Alaskan Athabascan vs Bermudan Unemployment Among Seniors over 65 years
COMPARE
Alaskan Athabascan
Bermudan
Unemployment Among Seniors over 65 years
Unemployment Among Seniors over 65 years Comparison
Alaskan Athabascans
Bermudans
7.0%
UNEMPLOYMENT AMONG SENIORS OVER 65 YEARS
0.0/ 100
METRIC RATING
344th/ 347
METRIC RANK
5.9%
UNEMPLOYMENT AMONG SENIORS OVER 65 YEARS
0.0/ 100
METRIC RATING
327th/ 347
METRIC RANK
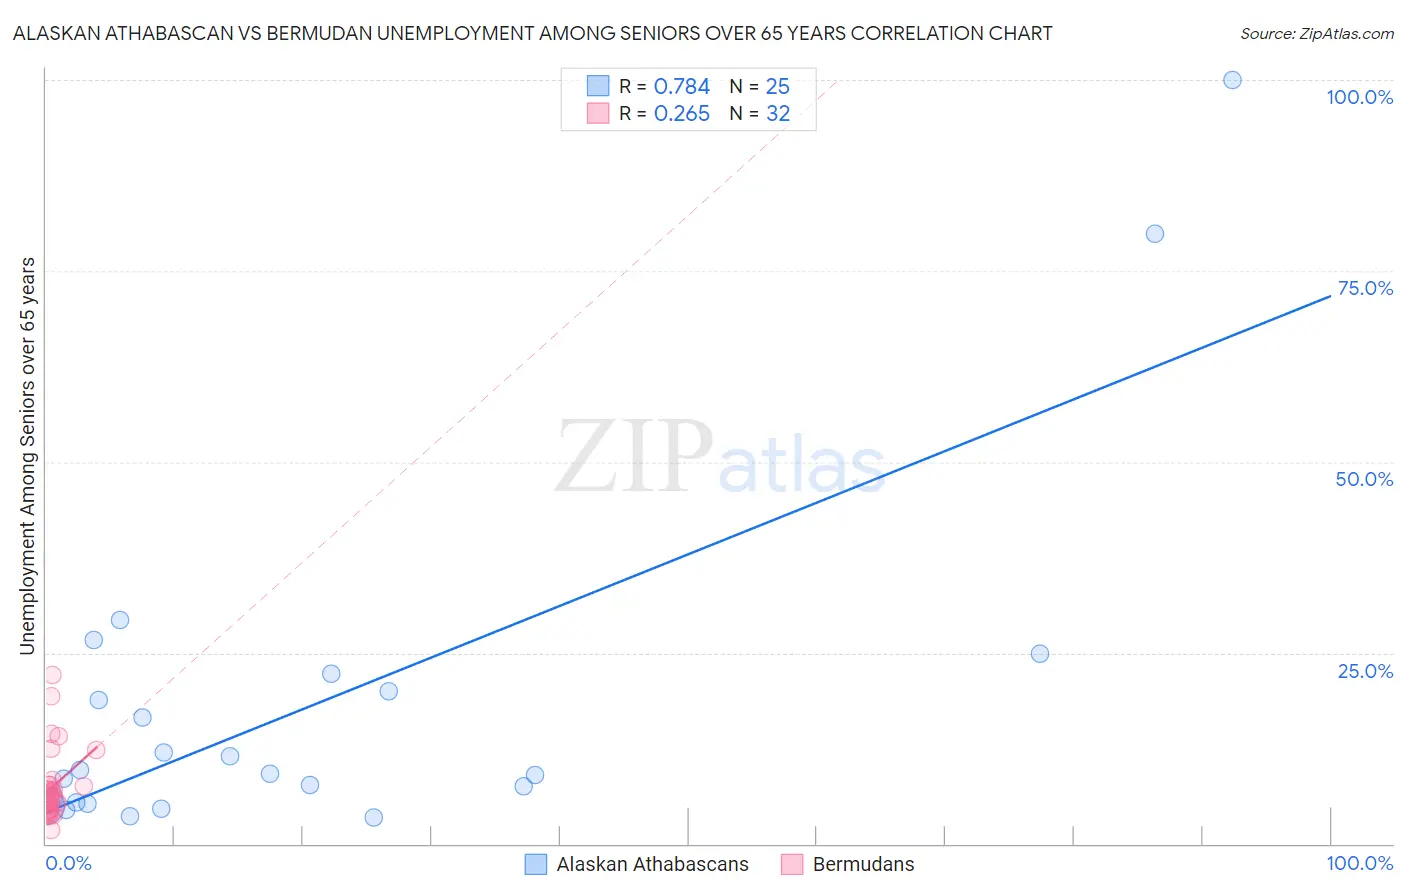
Alaskan Athabascan vs Bermudan Unemployment Among Seniors over 65 years Correlation Chart
The statistical analysis conducted on geographies consisting of 44,116,307 people shows a strong positive correlation between the proportion of Alaskan Athabascans and unemployment rate amomg seniors over the age of 65 in the United States with a correlation coefficient (R) of 0.784 and weighted average of 7.0%. Similarly, the statistical analysis conducted on geographies consisting of 54,539,220 people shows a weak positive correlation between the proportion of Bermudans and unemployment rate amomg seniors over the age of 65 in the United States with a correlation coefficient (R) of 0.265 and weighted average of 5.9%, a difference of 19.7%.
Unemployment Among Seniors over 65 years Correlation Summary
| Measurement | Alaskan Athabascan | Bermudan |
| Minimum | 3.5% | 1.8% |
| Maximum | 100.0% | 22.1% |
| Range | 96.5% | 20.3% |
| Mean | 18.1% | 7.5% |
| Median | 9.2% | 5.9% |
| Interquartile 25% (IQ1) | 5.3% | 4.4% |
| Interquartile 75% (IQ3) | 21.1% | 7.7% |
| Interquartile Range (IQR) | 15.9% | 3.3% |
| Standard Deviation (Sample) | 23.1% | 4.6% |
| Standard Deviation (Population) | 22.7% | 4.5% |
Demographics Similar to Alaskan Athabascans and Bermudans by Unemployment Among Seniors over 65 years
In terms of unemployment among seniors over 65 years, the demographic groups most similar to Alaskan Athabascans are Tlingit-Haida (6.8%, a difference of 3.8%), Navajo (6.7%, a difference of 5.1%), Yakama (6.7%, a difference of 5.6%), Ute (6.3%, a difference of 11.3%), and Paiute (6.3%, a difference of 11.3%). Similarly, the demographic groups most similar to Bermudans are Shoshone (5.9%, a difference of 0.48%), Puerto Rican (5.9%, a difference of 0.53%), Inupiat (5.8%, a difference of 0.91%), Dominican (6.0%, a difference of 1.3%), and Immigrants from Portugal (6.0%, a difference of 1.3%).
| Demographics | Rating | Rank | Unemployment Among Seniors over 65 years |
| Inupiat | 0.0 /100 | #325 | Tragic 5.8% |
| Shoshone | 0.0 /100 | #326 | Tragic 5.9% |
| Bermudans | 0.0 /100 | #327 | Tragic 5.9% |
| Puerto Ricans | 0.0 /100 | #328 | Tragic 5.9% |
| Dominicans | 0.0 /100 | #329 | Tragic 6.0% |
| Immigrants | Portugal | 0.0 /100 | #330 | Tragic 6.0% |
| Taiwanese | 0.0 /100 | #331 | Tragic 6.0% |
| Aleuts | 0.0 /100 | #332 | Tragic 6.0% |
| Immigrants | Dominican Republic | 0.0 /100 | #333 | Tragic 6.0% |
| Tohono O'odham | 0.0 /100 | #334 | Tragic 6.1% |
| Immigrants | Armenia | 0.0 /100 | #335 | Tragic 6.2% |
| Pima | 0.0 /100 | #336 | Tragic 6.3% |
| Alaska Natives | 0.0 /100 | #337 | Tragic 6.3% |
| Immigrants | Azores | 0.0 /100 | #338 | Tragic 6.3% |
| Paiute | 0.0 /100 | #339 | Tragic 6.3% |
| Ute | 0.0 /100 | #340 | Tragic 6.3% |
| Yakama | 0.0 /100 | #341 | Tragic 6.7% |
| Navajo | 0.0 /100 | #342 | Tragic 6.7% |
| Tlingit-Haida | 0.0 /100 | #343 | Tragic 6.8% |
| Alaskan Athabascans | 0.0 /100 | #344 | Tragic 7.0% |
| Immigrants | Yemen | 0.0 /100 | #345 | Tragic 8.2% |