Choctaw vs Japanese Disability Age 5 to 17
COMPARE
Choctaw
Japanese
Disability Age 5 to 17
Disability Age 5 to 17 Comparison
Choctaw
Japanese
6.9%
DISABILITY AGE 5 TO 17
0.0/ 100
METRIC RATING
339th/ 347
METRIC RANK
6.1%
DISABILITY AGE 5 TO 17
0.1/ 100
METRIC RATING
276th/ 347
METRIC RANK
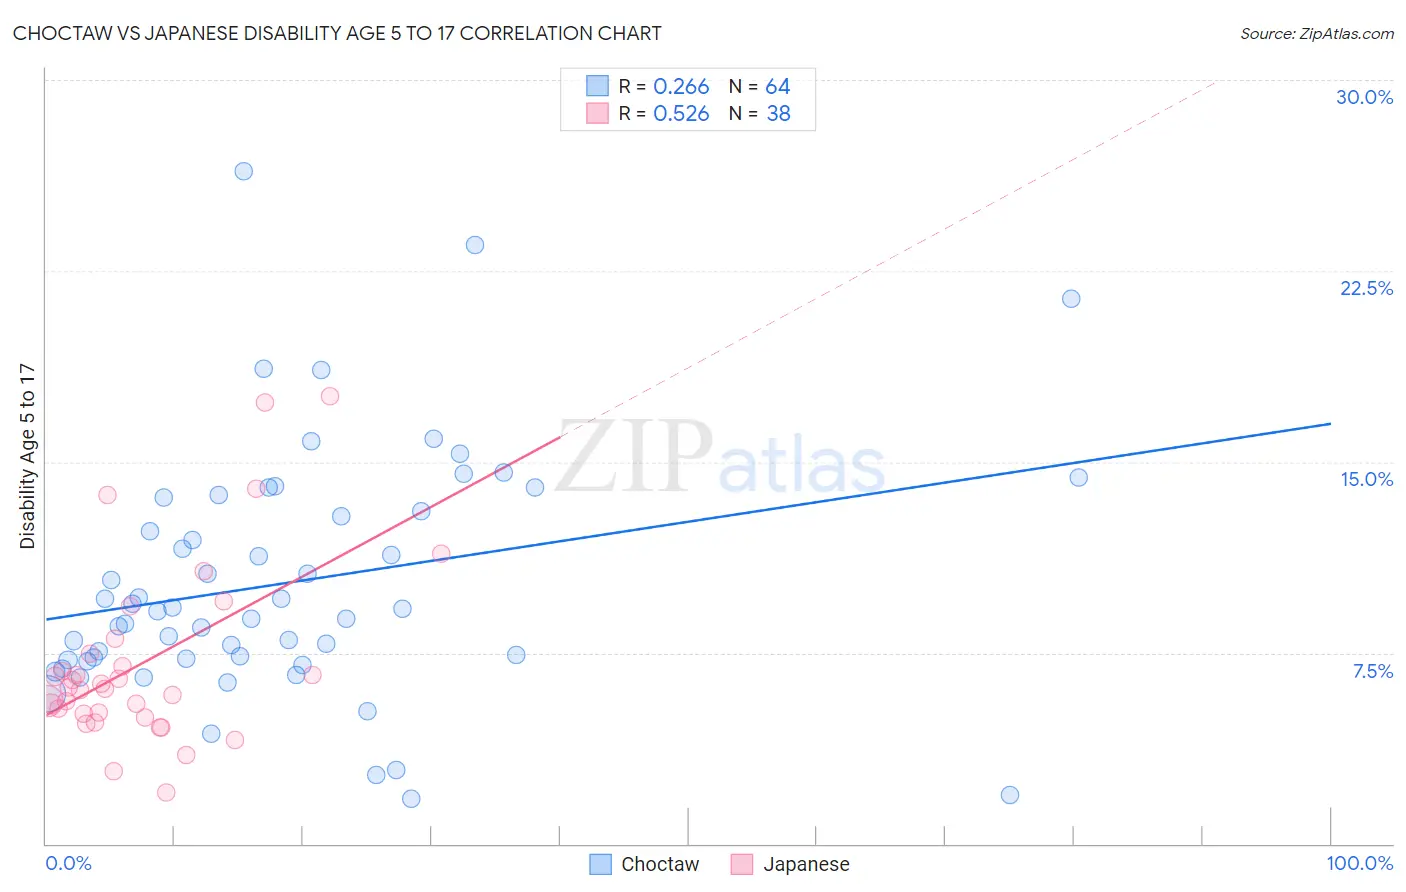
Choctaw vs Japanese Disability Age 5 to 17 Correlation Chart
The statistical analysis conducted on geographies consisting of 268,025,414 people shows a weak positive correlation between the proportion of Choctaw and percentage of population with a disability between the ages 5 and 17 in the United States with a correlation coefficient (R) of 0.266 and weighted average of 6.9%. Similarly, the statistical analysis conducted on geographies consisting of 248,392,506 people shows a substantial positive correlation between the proportion of Japanese and percentage of population with a disability between the ages 5 and 17 in the United States with a correlation coefficient (R) of 0.526 and weighted average of 6.1%, a difference of 14.1%.
Disability Age 5 to 17 Correlation Summary
| Measurement | Choctaw | Japanese |
| Minimum | 1.8% | 2.0% |
| Maximum | 26.4% | 17.6% |
| Range | 24.6% | 15.6% |
| Mean | 10.3% | 7.1% |
| Median | 9.2% | 6.1% |
| Interquartile 25% (IQ1) | 7.2% | 5.1% |
| Interquartile 75% (IQ3) | 13.3% | 7.5% |
| Interquartile Range (IQR) | 6.1% | 2.4% |
| Standard Deviation (Sample) | 4.8% | 3.6% |
| Standard Deviation (Population) | 4.8% | 3.5% |
Similar Demographics by Disability Age 5 to 17
Demographics Similar to Choctaw by Disability Age 5 to 17
In terms of disability age 5 to 17, the demographic groups most similar to Choctaw are Cherokee (6.9%, a difference of 0.26%), Iroquois (6.9%, a difference of 0.33%), Creek (6.9%, a difference of 0.57%), Cape Verdean (7.0%, a difference of 0.80%), and Chickasaw (6.8%, a difference of 1.0%).
| Demographics | Rating | Rank | Disability Age 5 to 17 |
| Immigrants | Azores | 0.0 /100 | #332 | Tragic 6.7% |
| Blacks/African Americans | 0.0 /100 | #333 | Tragic 6.8% |
| Seminole | 0.0 /100 | #334 | Tragic 6.8% |
| Ottawa | 0.0 /100 | #335 | Tragic 6.8% |
| Chickasaw | 0.0 /100 | #336 | Tragic 6.8% |
| Creek | 0.0 /100 | #337 | Tragic 6.9% |
| Iroquois | 0.0 /100 | #338 | Tragic 6.9% |
| Choctaw | 0.0 /100 | #339 | Tragic 6.9% |
| Cherokee | 0.0 /100 | #340 | Tragic 6.9% |
| Cape Verdeans | 0.0 /100 | #341 | Tragic 7.0% |
| Chippewa | 0.0 /100 | #342 | Tragic 7.1% |
| Immigrants | Cabo Verde | 0.0 /100 | #343 | Tragic 7.1% |
| Cajuns | 0.0 /100 | #344 | Tragic 7.2% |
| Tsimshian | 0.0 /100 | #345 | Tragic 7.9% |
| Puerto Ricans | 0.0 /100 | #346 | Tragic 8.3% |
Demographics Similar to Japanese by Disability Age 5 to 17
In terms of disability age 5 to 17, the demographic groups most similar to Japanese are Dutch (6.0%, a difference of 0.11%), Cheyenne (6.0%, a difference of 0.21%), Alaska Native (6.0%, a difference of 0.33%), Finnish (6.0%, a difference of 0.38%), and Immigrants from Zaire (6.0%, a difference of 0.40%).
| Demographics | Rating | Rank | Disability Age 5 to 17 |
| Liberians | 0.4 /100 | #269 | Tragic 6.0% |
| Immigrants | Somalia | 0.4 /100 | #270 | Tragic 6.0% |
| Immigrants | Zaire | 0.2 /100 | #271 | Tragic 6.0% |
| Finns | 0.2 /100 | #272 | Tragic 6.0% |
| Alaska Natives | 0.2 /100 | #273 | Tragic 6.0% |
| Cheyenne | 0.2 /100 | #274 | Tragic 6.0% |
| Dutch | 0.2 /100 | #275 | Tragic 6.0% |
| Japanese | 0.1 /100 | #276 | Tragic 6.1% |
| Puget Sound Salish | 0.1 /100 | #277 | Tragic 6.1% |
| Immigrants | Liberia | 0.1 /100 | #278 | Tragic 6.1% |
| Immigrants | Jamaica | 0.1 /100 | #279 | Tragic 6.1% |
| Portuguese | 0.1 /100 | #280 | Tragic 6.1% |
| Scottish | 0.0 /100 | #281 | Tragic 6.1% |
| Germans | 0.0 /100 | #282 | Tragic 6.1% |
| Ugandans | 0.0 /100 | #283 | Tragic 6.2% |