Indonesian vs Japanese Disability Age 5 to 17
COMPARE
Indonesian
Japanese
Disability Age 5 to 17
Disability Age 5 to 17 Comparison
Indonesians
Japanese
5.9%
DISABILITY AGE 5 TO 17
2.0/ 100
METRIC RATING
243rd/ 347
METRIC RANK
6.1%
DISABILITY AGE 5 TO 17
0.1/ 100
METRIC RATING
276th/ 347
METRIC RANK
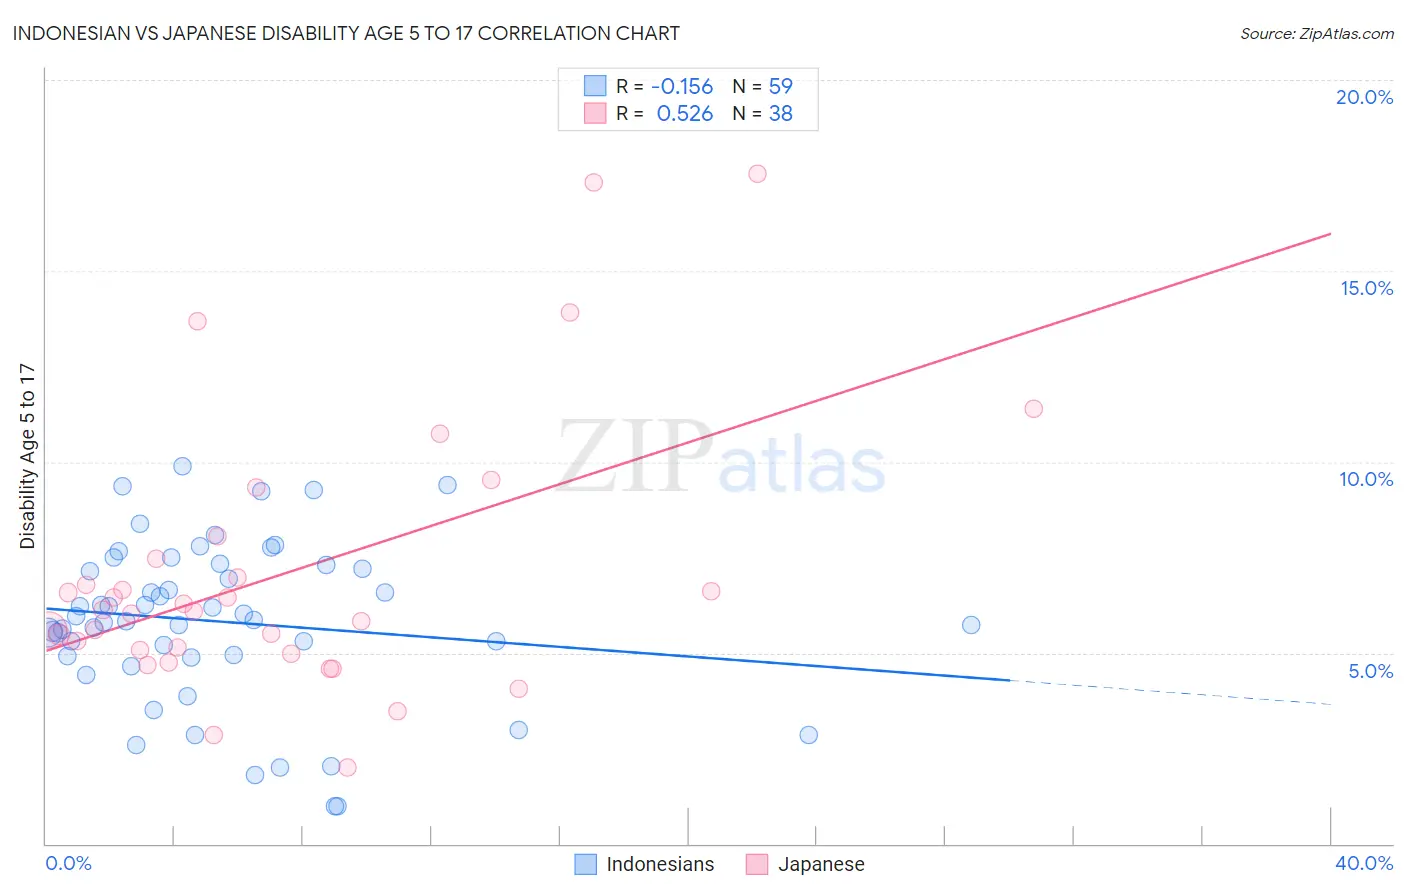
Indonesian vs Japanese Disability Age 5 to 17 Correlation Chart
The statistical analysis conducted on geographies consisting of 162,352,811 people shows a poor negative correlation between the proportion of Indonesians and percentage of population with a disability between the ages 5 and 17 in the United States with a correlation coefficient (R) of -0.156 and weighted average of 5.9%. Similarly, the statistical analysis conducted on geographies consisting of 248,392,506 people shows a substantial positive correlation between the proportion of Japanese and percentage of population with a disability between the ages 5 and 17 in the United States with a correlation coefficient (R) of 0.526 and weighted average of 6.1%, a difference of 3.1%.
Disability Age 5 to 17 Correlation Summary
| Measurement | Indonesian | Japanese |
| Minimum | 0.98% | 2.0% |
| Maximum | 9.9% | 17.6% |
| Range | 8.9% | 15.6% |
| Mean | 5.8% | 7.1% |
| Median | 5.8% | 6.1% |
| Interquartile 25% (IQ1) | 4.9% | 5.1% |
| Interquartile 75% (IQ3) | 7.3% | 7.5% |
| Interquartile Range (IQR) | 2.4% | 2.4% |
| Standard Deviation (Sample) | 2.1% | 3.6% |
| Standard Deviation (Population) | 2.1% | 3.5% |
Similar Demographics by Disability Age 5 to 17
Demographics Similar to Indonesians by Disability Age 5 to 17
In terms of disability age 5 to 17, the demographic groups most similar to Indonesians are Spaniard (5.9%, a difference of 0.010%), Immigrants from Germany (5.9%, a difference of 0.060%), Immigrants from Micronesia (5.9%, a difference of 0.060%), Tlingit-Haida (5.9%, a difference of 0.060%), and Immigrants from Caribbean (5.9%, a difference of 0.090%).
| Demographics | Rating | Rank | Disability Age 5 to 17 |
| Immigrants | Brazil | 3.2 /100 | #236 | Tragic 5.8% |
| Sudanese | 2.9 /100 | #237 | Tragic 5.8% |
| Hungarians | 2.6 /100 | #238 | Tragic 5.8% |
| German Russians | 2.4 /100 | #239 | Tragic 5.9% |
| West Indians | 2.4 /100 | #240 | Tragic 5.9% |
| Immigrants | Caribbean | 2.1 /100 | #241 | Tragic 5.9% |
| Spaniards | 2.0 /100 | #242 | Tragic 5.9% |
| Indonesians | 2.0 /100 | #243 | Tragic 5.9% |
| Immigrants | Germany | 1.9 /100 | #244 | Tragic 5.9% |
| Immigrants | Micronesia | 1.9 /100 | #245 | Tragic 5.9% |
| Tlingit-Haida | 1.9 /100 | #246 | Tragic 5.9% |
| Immigrants | Honduras | 1.8 /100 | #247 | Tragic 5.9% |
| British | 1.7 /100 | #248 | Tragic 5.9% |
| Immigrants | Ghana | 1.7 /100 | #249 | Tragic 5.9% |
| Poles | 1.5 /100 | #250 | Tragic 5.9% |
Demographics Similar to Japanese by Disability Age 5 to 17
In terms of disability age 5 to 17, the demographic groups most similar to Japanese are Dutch (6.0%, a difference of 0.11%), Cheyenne (6.0%, a difference of 0.21%), Alaska Native (6.0%, a difference of 0.33%), Finnish (6.0%, a difference of 0.38%), and Immigrants from Zaire (6.0%, a difference of 0.40%).
| Demographics | Rating | Rank | Disability Age 5 to 17 |
| Liberians | 0.4 /100 | #269 | Tragic 6.0% |
| Immigrants | Somalia | 0.4 /100 | #270 | Tragic 6.0% |
| Immigrants | Zaire | 0.2 /100 | #271 | Tragic 6.0% |
| Finns | 0.2 /100 | #272 | Tragic 6.0% |
| Alaska Natives | 0.2 /100 | #273 | Tragic 6.0% |
| Cheyenne | 0.2 /100 | #274 | Tragic 6.0% |
| Dutch | 0.2 /100 | #275 | Tragic 6.0% |
| Japanese | 0.1 /100 | #276 | Tragic 6.1% |
| Puget Sound Salish | 0.1 /100 | #277 | Tragic 6.1% |
| Immigrants | Liberia | 0.1 /100 | #278 | Tragic 6.1% |
| Immigrants | Jamaica | 0.1 /100 | #279 | Tragic 6.1% |
| Portuguese | 0.1 /100 | #280 | Tragic 6.1% |
| Scottish | 0.0 /100 | #281 | Tragic 6.1% |
| Germans | 0.0 /100 | #282 | Tragic 6.1% |
| Ugandans | 0.0 /100 | #283 | Tragic 6.2% |