Ecuadorian vs Immigrants from Latvia Disability Age 5 to 17
COMPARE
Ecuadorian
Immigrants from Latvia
Disability Age 5 to 17
Disability Age 5 to 17 Comparison
Ecuadorians
Immigrants from Latvia
5.5%
DISABILITY AGE 5 TO 17
79.7/ 100
METRIC RATING
153rd/ 347
METRIC RANK
5.3%
DISABILITY AGE 5 TO 17
97.9/ 100
METRIC RATING
112th/ 347
METRIC RANK
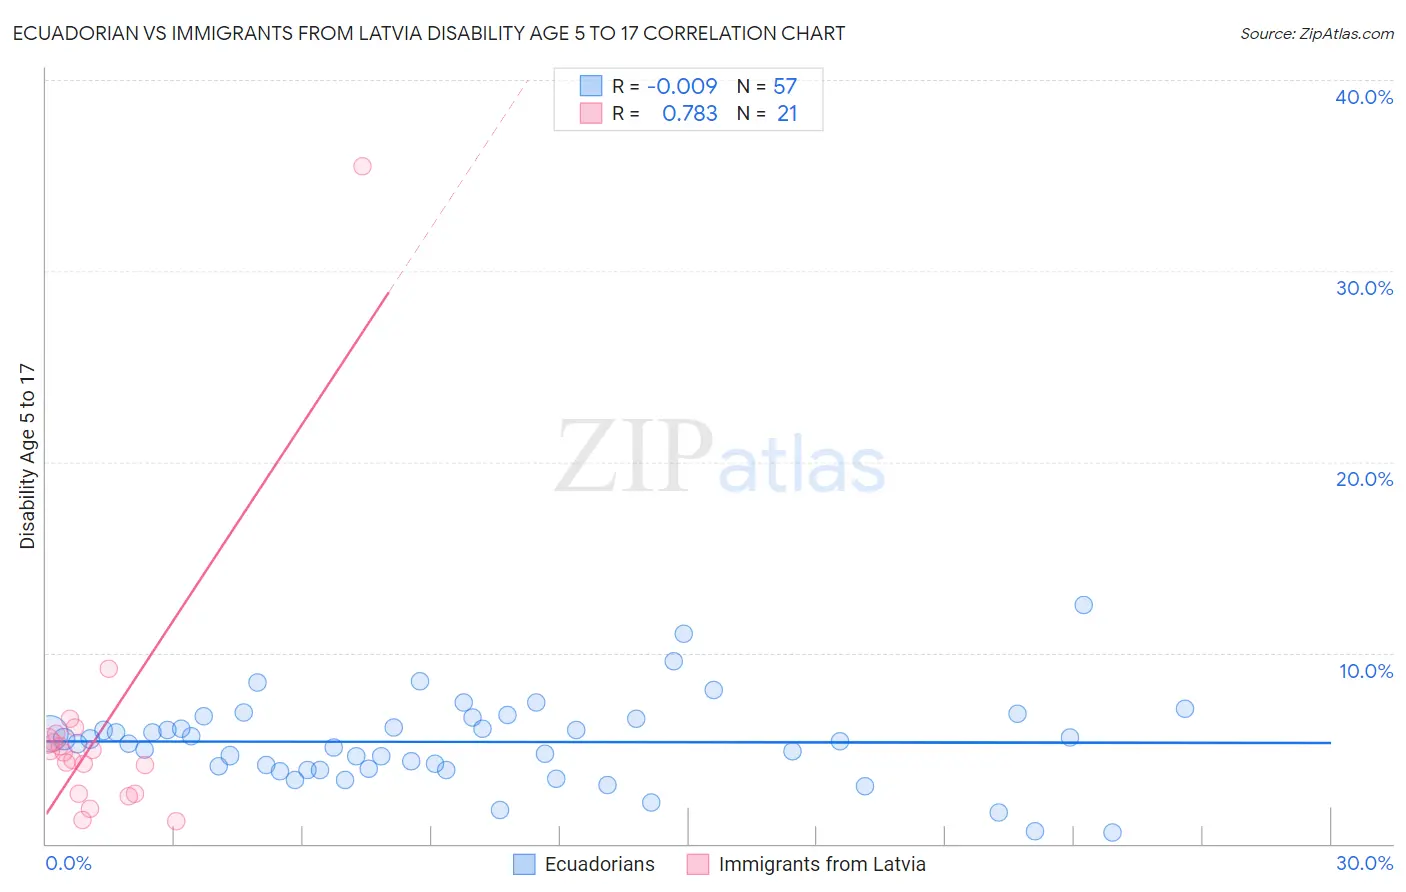
Ecuadorian vs Immigrants from Latvia Disability Age 5 to 17 Correlation Chart
The statistical analysis conducted on geographies consisting of 315,899,023 people shows no correlation between the proportion of Ecuadorians and percentage of population with a disability between the ages 5 and 17 in the United States with a correlation coefficient (R) of -0.009 and weighted average of 5.5%. Similarly, the statistical analysis conducted on geographies consisting of 113,351,045 people shows a strong positive correlation between the proportion of Immigrants from Latvia and percentage of population with a disability between the ages 5 and 17 in the United States with a correlation coefficient (R) of 0.783 and weighted average of 5.3%, a difference of 3.2%.
Disability Age 5 to 17 Correlation Summary
| Measurement | Ecuadorian | Immigrants from Latvia |
| Minimum | 0.57% | 1.2% |
| Maximum | 12.5% | 35.5% |
| Range | 11.9% | 34.4% |
| Mean | 5.3% | 5.8% |
| Median | 5.4% | 4.8% |
| Interquartile 25% (IQ1) | 3.9% | 2.6% |
| Interquartile 75% (IQ3) | 6.6% | 5.6% |
| Interquartile Range (IQR) | 2.7% | 2.9% |
| Standard Deviation (Sample) | 2.2% | 7.1% |
| Standard Deviation (Population) | 2.2% | 6.9% |
Similar Demographics by Disability Age 5 to 17
Demographics Similar to Ecuadorians by Disability Age 5 to 17
In terms of disability age 5 to 17, the demographic groups most similar to Ecuadorians are Ute (5.5%, a difference of 0.070%), Australian (5.5%, a difference of 0.070%), Estonian (5.5%, a difference of 0.080%), Immigrants from Ecuador (5.5%, a difference of 0.11%), and Hawaiian (5.5%, a difference of 0.13%).
| Demographics | Rating | Rank | Disability Age 5 to 17 |
| Albanians | 83.7 /100 | #146 | Excellent 5.5% |
| Immigrants | Albania | 83.1 /100 | #147 | Excellent 5.5% |
| Samoans | 81.9 /100 | #148 | Excellent 5.5% |
| Central Americans | 81.6 /100 | #149 | Excellent 5.5% |
| Guatemalans | 81.5 /100 | #150 | Excellent 5.5% |
| Estonians | 80.8 /100 | #151 | Excellent 5.5% |
| Ute | 80.6 /100 | #152 | Excellent 5.5% |
| Ecuadorians | 79.7 /100 | #153 | Good 5.5% |
| Australians | 78.8 /100 | #154 | Good 5.5% |
| Immigrants | Ecuador | 78.3 /100 | #155 | Good 5.5% |
| Hawaiians | 78.0 /100 | #156 | Good 5.5% |
| Immigrants | Costa Rica | 77.9 /100 | #157 | Good 5.5% |
| Immigrants | Nepal | 77.1 /100 | #158 | Good 5.5% |
| Immigrants | Zimbabwe | 75.3 /100 | #159 | Good 5.5% |
| South Africans | 73.3 /100 | #160 | Good 5.5% |
Demographics Similar to Immigrants from Latvia by Disability Age 5 to 17
In terms of disability age 5 to 17, the demographic groups most similar to Immigrants from Latvia are Ethiopian (5.3%, a difference of 0.020%), Aleut (5.3%, a difference of 0.040%), Immigrants from Eritrea (5.3%, a difference of 0.050%), Immigrants from Northern Europe (5.3%, a difference of 0.070%), and Cuban (5.3%, a difference of 0.080%).
| Demographics | Rating | Rank | Disability Age 5 to 17 |
| Immigrants | Italy | 98.4 /100 | #105 | Exceptional 5.3% |
| Immigrants | Yemen | 98.2 /100 | #106 | Exceptional 5.3% |
| Russians | 98.2 /100 | #107 | Exceptional 5.3% |
| Immigrants | South Africa | 98.1 /100 | #108 | Exceptional 5.3% |
| Immigrants | Northern Africa | 98.1 /100 | #109 | Exceptional 5.3% |
| Immigrants | Eritrea | 98.0 /100 | #110 | Exceptional 5.3% |
| Ethiopians | 97.9 /100 | #111 | Exceptional 5.3% |
| Immigrants | Latvia | 97.9 /100 | #112 | Exceptional 5.3% |
| Aleuts | 97.8 /100 | #113 | Exceptional 5.3% |
| Immigrants | Northern Europe | 97.8 /100 | #114 | Exceptional 5.3% |
| Cubans | 97.8 /100 | #115 | Exceptional 5.3% |
| Cypriots | 97.7 /100 | #116 | Exceptional 5.3% |
| Immigrants | Afghanistan | 97.4 /100 | #117 | Exceptional 5.3% |
| South Americans | 97.1 /100 | #118 | Exceptional 5.4% |
| Immigrants | South America | 97.1 /100 | #119 | Exceptional 5.4% |