Immigrants from the Azores vs Egyptian Disability Age 5 to 17
COMPARE
Immigrants from the Azores
Egyptian
Disability Age 5 to 17
Disability Age 5 to 17 Comparison
Immigrants from the Azores
Egyptians
6.7%
DISABILITY AGE 5 TO 17
0.0/ 100
METRIC RATING
332nd/ 347
METRIC RANK
5.0%
DISABILITY AGE 5 TO 17
100.0/ 100
METRIC RATING
44th/ 347
METRIC RANK
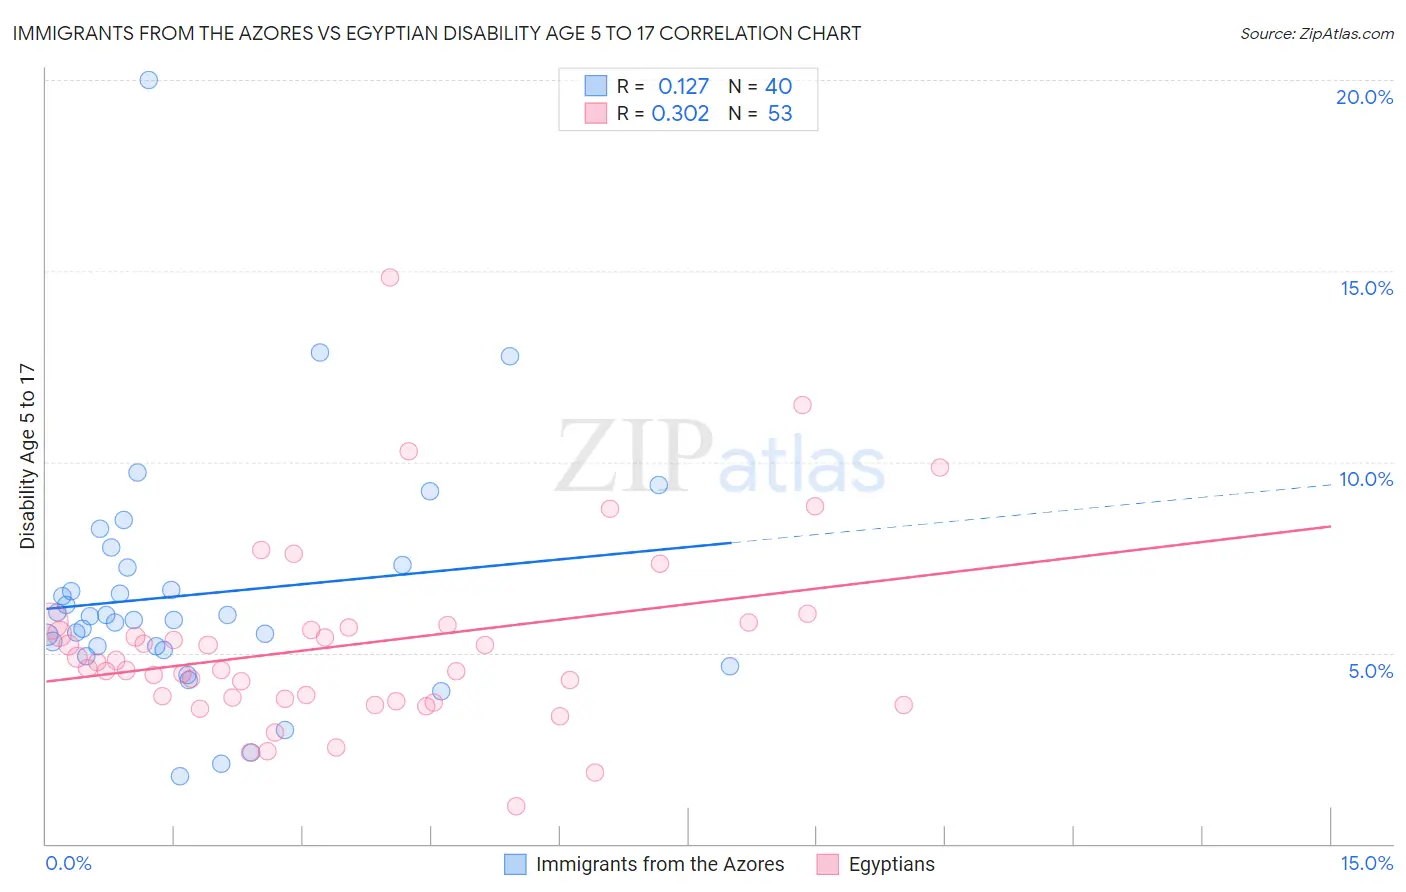
Immigrants from the Azores vs Egyptian Disability Age 5 to 17 Correlation Chart
The statistical analysis conducted on geographies consisting of 46,157,711 people shows a poor positive correlation between the proportion of Immigrants from the Azores and percentage of population with a disability between the ages 5 and 17 in the United States with a correlation coefficient (R) of 0.127 and weighted average of 6.7%. Similarly, the statistical analysis conducted on geographies consisting of 275,465,028 people shows a mild positive correlation between the proportion of Egyptians and percentage of population with a disability between the ages 5 and 17 in the United States with a correlation coefficient (R) of 0.302 and weighted average of 5.0%, a difference of 33.3%.
Disability Age 5 to 17 Correlation Summary
| Measurement | Immigrants from the Azores | Egyptian |
| Minimum | 1.8% | 0.99% |
| Maximum | 20.0% | 14.8% |
| Range | 18.2% | 13.8% |
| Mean | 6.5% | 5.2% |
| Median | 5.9% | 4.6% |
| Interquartile 25% (IQ1) | 5.1% | 3.8% |
| Interquartile 75% (IQ3) | 7.3% | 5.7% |
| Interquartile Range (IQR) | 2.1% | 1.9% |
| Standard Deviation (Sample) | 3.2% | 2.5% |
| Standard Deviation (Population) | 3.2% | 2.4% |
Similar Demographics by Disability Age 5 to 17
Demographics Similar to Immigrants from the Azores by Disability Age 5 to 17
In terms of disability age 5 to 17, the demographic groups most similar to Immigrants from the Azores are French Canadian (6.7%, a difference of 0.020%), Dutch West Indian (6.7%, a difference of 0.10%), Black/African American (6.8%, a difference of 0.59%), Seminole (6.8%, a difference of 0.64%), and Ottawa (6.8%, a difference of 1.3%).
| Demographics | Rating | Rank | Disability Age 5 to 17 |
| Americans | 0.0 /100 | #325 | Tragic 6.5% |
| Potawatomi | 0.0 /100 | #326 | Tragic 6.5% |
| French American Indians | 0.0 /100 | #327 | Tragic 6.6% |
| Pennsylvania Germans | 0.0 /100 | #328 | Tragic 6.6% |
| Blackfeet | 0.0 /100 | #329 | Tragic 6.6% |
| Dutch West Indians | 0.0 /100 | #330 | Tragic 6.7% |
| French Canadians | 0.0 /100 | #331 | Tragic 6.7% |
| Immigrants | Azores | 0.0 /100 | #332 | Tragic 6.7% |
| Blacks/African Americans | 0.0 /100 | #333 | Tragic 6.8% |
| Seminole | 0.0 /100 | #334 | Tragic 6.8% |
| Ottawa | 0.0 /100 | #335 | Tragic 6.8% |
| Chickasaw | 0.0 /100 | #336 | Tragic 6.8% |
| Creek | 0.0 /100 | #337 | Tragic 6.9% |
| Iroquois | 0.0 /100 | #338 | Tragic 6.9% |
| Choctaw | 0.0 /100 | #339 | Tragic 6.9% |
Demographics Similar to Egyptians by Disability Age 5 to 17
In terms of disability age 5 to 17, the demographic groups most similar to Egyptians are Immigrants from Russia (5.0%, a difference of 0.040%), Tongan (5.0%, a difference of 0.070%), Assyrian/Chaldean/Syriac (5.0%, a difference of 0.14%), Vietnamese (5.1%, a difference of 0.27%), and Immigrants from Sri Lanka (5.0%, a difference of 0.42%).
| Demographics | Rating | Rank | Disability Age 5 to 17 |
| Immigrants | Belarus | 100.0 /100 | #37 | Exceptional 5.0% |
| Immigrants | Philippines | 100.0 /100 | #38 | Exceptional 5.0% |
| Immigrants | Argentina | 100.0 /100 | #39 | Exceptional 5.0% |
| Okinawans | 100.0 /100 | #40 | Exceptional 5.0% |
| Immigrants | Australia | 100.0 /100 | #41 | Exceptional 5.0% |
| Immigrants | Sri Lanka | 100.0 /100 | #42 | Exceptional 5.0% |
| Immigrants | Russia | 100.0 /100 | #43 | Exceptional 5.0% |
| Egyptians | 100.0 /100 | #44 | Exceptional 5.0% |
| Tongans | 100.0 /100 | #45 | Exceptional 5.0% |
| Assyrians/Chaldeans/Syriacs | 100.0 /100 | #46 | Exceptional 5.0% |
| Vietnamese | 100.0 /100 | #47 | Exceptional 5.1% |
| Koreans | 100.0 /100 | #48 | Exceptional 5.1% |
| Immigrants | Western Asia | 100.0 /100 | #49 | Exceptional 5.1% |
| Argentineans | 99.9 /100 | #50 | Exceptional 5.1% |
| Turks | 99.9 /100 | #51 | Exceptional 5.1% |