Afghan vs Egyptian 4th Grade
COMPARE
Afghan
Egyptian
4th Grade
4th Grade Comparison
Afghans
Egyptians
96.9%
4TH GRADE
0.1/ 100
METRIC RATING
279th/ 347
METRIC RANK
97.5%
4TH GRADE
50.0/ 100
METRIC RATING
174th/ 347
METRIC RANK
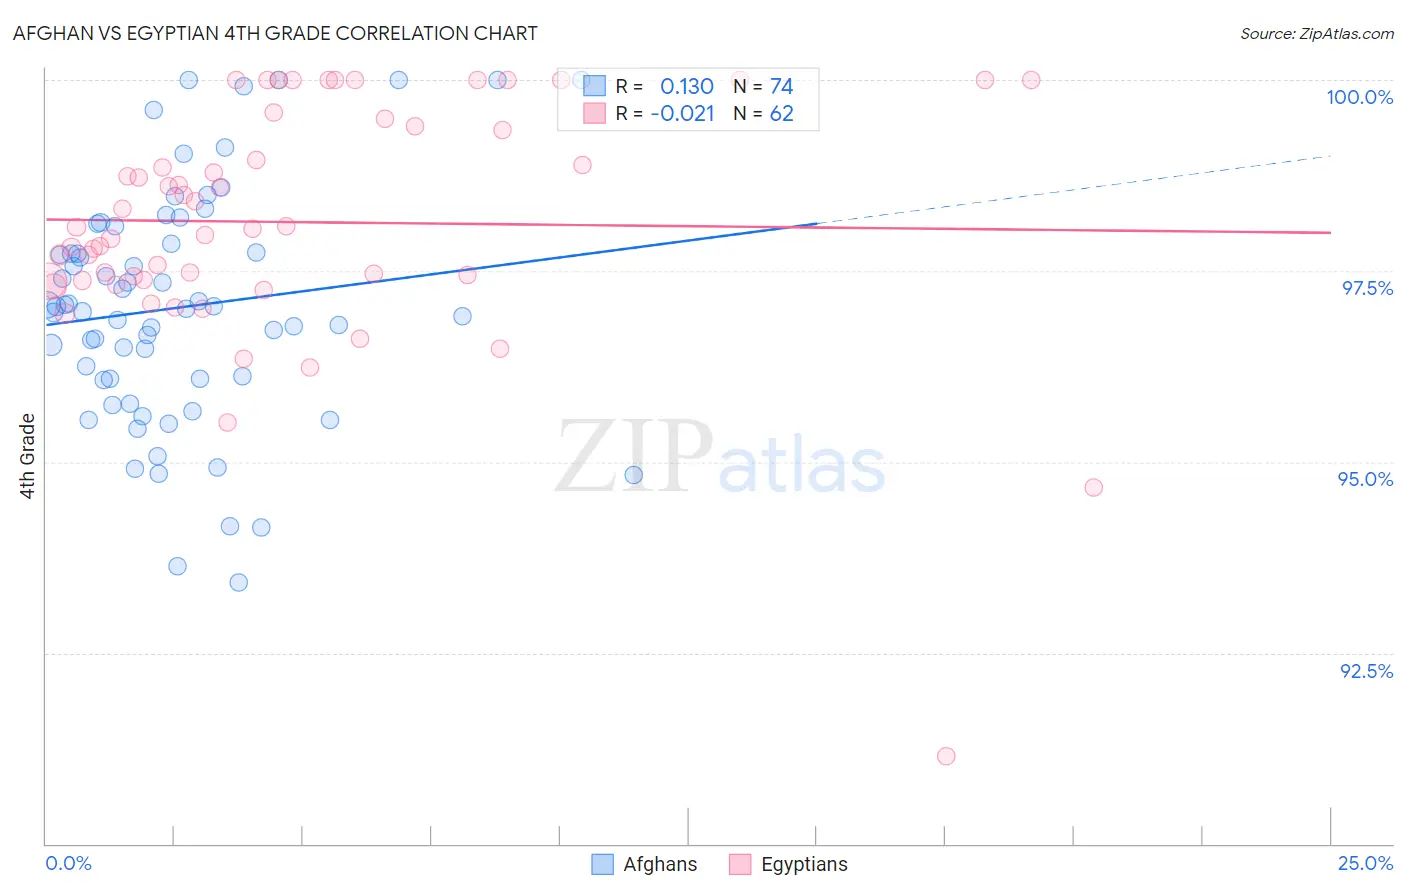
Afghan vs Egyptian 4th Grade Correlation Chart
The statistical analysis conducted on geographies consisting of 148,851,685 people shows a poor positive correlation between the proportion of Afghans and percentage of population with at least 4th grade education in the United States with a correlation coefficient (R) of 0.130 and weighted average of 96.9%. Similarly, the statistical analysis conducted on geographies consisting of 276,927,423 people shows no correlation between the proportion of Egyptians and percentage of population with at least 4th grade education in the United States with a correlation coefficient (R) of -0.021 and weighted average of 97.5%, a difference of 0.67%.
4th Grade Correlation Summary
| Measurement | Afghan | Egyptian |
| Minimum | 93.4% | 91.1% |
| Maximum | 100.0% | 100.0% |
| Range | 6.6% | 8.9% |
| Mean | 97.0% | 98.1% |
| Median | 97.0% | 98.1% |
| Interquartile 25% (IQ1) | 96.1% | 97.4% |
| Interquartile 75% (IQ3) | 97.9% | 99.4% |
| Interquartile Range (IQR) | 1.8% | 2.0% |
| Standard Deviation (Sample) | 1.5% | 1.6% |
| Standard Deviation (Population) | 1.5% | 1.5% |
Similar Demographics by 4th Grade
Demographics Similar to Afghans by 4th Grade
In terms of 4th grade, the demographic groups most similar to Afghans are Yaqui (96.9%, a difference of 0.010%), Immigrants from Western Africa (96.9%, a difference of 0.010%), Immigrants from Bolivia (96.9%, a difference of 0.010%), Barbadian (96.9%, a difference of 0.010%), and Trinidadian and Tobagonian (96.9%, a difference of 0.020%).
| Demographics | Rating | Rank | 4th Grade |
| Fijians | 0.1 /100 | #272 | Tragic 96.9% |
| Immigrants | Cameroon | 0.1 /100 | #273 | Tragic 96.9% |
| Trinidadians and Tobagonians | 0.1 /100 | #274 | Tragic 96.9% |
| Immigrants | Ghana | 0.1 /100 | #275 | Tragic 96.9% |
| Yaqui | 0.1 /100 | #276 | Tragic 96.9% |
| Immigrants | Western Africa | 0.1 /100 | #277 | Tragic 96.9% |
| Immigrants | Bolivia | 0.1 /100 | #278 | Tragic 96.9% |
| Afghans | 0.1 /100 | #279 | Tragic 96.9% |
| Barbadians | 0.1 /100 | #280 | Tragic 96.9% |
| Immigrants | Hong Kong | 0.1 /100 | #281 | Tragic 96.9% |
| Immigrants | Trinidad and Tobago | 0.1 /100 | #282 | Tragic 96.8% |
| Immigrants | Philippines | 0.1 /100 | #283 | Tragic 96.8% |
| Immigrants | St. Vincent and the Grenadines | 0.1 /100 | #284 | Tragic 96.8% |
| Immigrants | Barbados | 0.0 /100 | #285 | Tragic 96.8% |
| Immigrants | Thailand | 0.0 /100 | #286 | Tragic 96.8% |
Demographics Similar to Egyptians by 4th Grade
In terms of 4th grade, the demographic groups most similar to Egyptians are Immigrants from Sri Lanka (97.5%, a difference of 0.0%), Immigrants from Korea (97.5%, a difference of 0.0%), Immigrants from Micronesia (97.5%, a difference of 0.0%), Arab (97.5%, a difference of 0.0%), and Immigrants from Spain (97.5%, a difference of 0.010%).
| Demographics | Rating | Rank | 4th Grade |
| Immigrants | Poland | 55.9 /100 | #167 | Average 97.5% |
| Immigrants | Belarus | 55.8 /100 | #168 | Average 97.5% |
| Chileans | 54.4 /100 | #169 | Average 97.5% |
| Immigrants | Spain | 51.8 /100 | #170 | Average 97.5% |
| Brazilians | 51.5 /100 | #171 | Average 97.5% |
| Immigrants | Sri Lanka | 51.1 /100 | #172 | Average 97.5% |
| Immigrants | Korea | 50.6 /100 | #173 | Average 97.5% |
| Egyptians | 50.0 /100 | #174 | Average 97.5% |
| Immigrants | Micronesia | 49.6 /100 | #175 | Average 97.5% |
| Arabs | 48.7 /100 | #176 | Average 97.5% |
| Immigrants | Brazil | 46.1 /100 | #177 | Average 97.5% |
| Comanche | 45.3 /100 | #178 | Average 97.5% |
| Immigrants | Kazakhstan | 43.6 /100 | #179 | Average 97.5% |
| Immigrants | Venezuela | 42.7 /100 | #180 | Average 97.5% |
| Immigrants | Taiwan | 41.5 /100 | #181 | Average 97.5% |