Zip Codes with the Highest Percentage of Households with Income Below $10,000 in Bryan, TX
RELATED REPORTS & OPTIONS
Household Income | $0-10k
Bryan
Compare Zip Codes
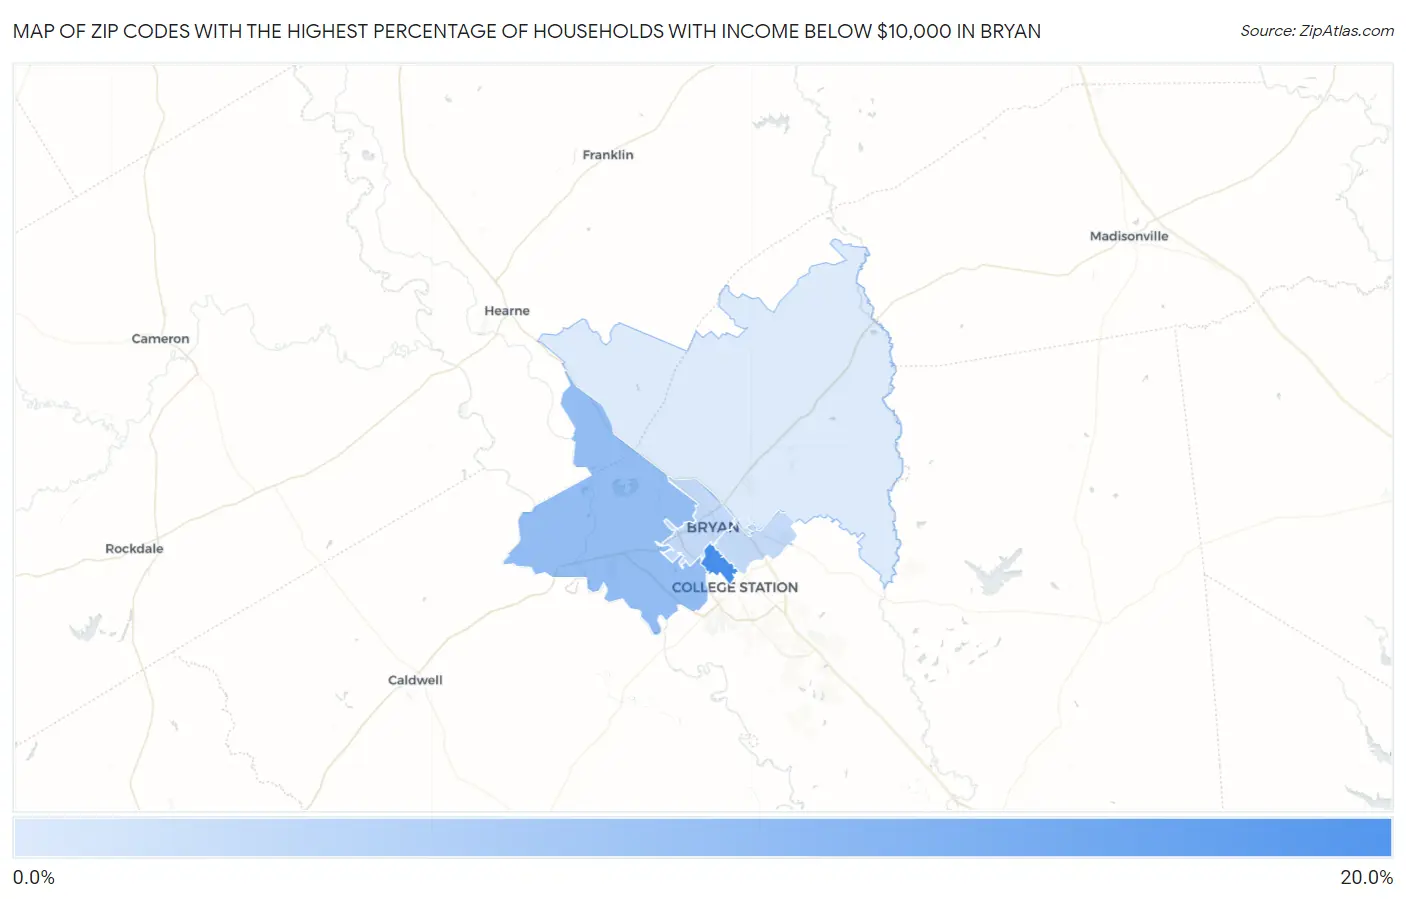
Map of Zip Codes with the Highest Percentage of Households with Income Below $10,000 in Bryan
3.3%
19.6%
Zip Codes with the Highest Percentage of Households with Income Below $10,000 in Bryan, TX
| Zip Code | Households with Income < $10k | vs State | vs National | |
| 1. | 77801 | 19.6% | 5.1%(+14.5)#47 | 4.9%(+14.7)#829 |
| 2. | 77807 | 11.0% | 5.1%(+5.90)#171 | 4.9%(+6.10)#2,962 |
| 3. | 77803 | 6.1% | 5.1%(+1.00)#594 | 4.9%(+1.20)#8,743 |
| 4. | 77802 | 6.1% | 5.1%(+1.00)#598 | 4.9%(+1.20)#8,765 |
| 5. | 77808 | 3.3% | 5.1%(-1.80)#1,137 | 4.9%(-1.60)#18,174 |
1
Common Questions
What are the Top 3 Zip Codes with the Highest Percentage of Households with Income Below $10,000 in Bryan, TX?
Top 3 Zip Codes with the Highest Percentage of Households with Income Below $10,000 in Bryan, TX are:
What zip code has the Highest Percentage of Households with Income Below $10,000 in Bryan, TX?
77801 has the Highest Percentage of Households with Income Below $10,000 in Bryan, TX with 19.6%.
What is the Percentage of Households with Income Below $10,000 in Bryan, TX?
Percentage of Households with Income Below $10,000 in Bryan is 9.5%.
What is the Percentage of Households with Income Below $10,000 in Texas?
Percentage of Households with Income Below $10,000 in Texas is 5.1%.
What is the Percentage of Households with Income Below $10,000 in the United States?
Percentage of Households with Income Below $10,000 in the United States is 4.9%.