Grandfalls, TX Map & Demographics
Grandfalls Map
Grandfalls Overview
$20,216
PER CAPITA INCOME
$49,688
AVG FAMILY INCOME
$42,500
AVG HOUSEHOLD INCOME
13.5%
WAGE / INCOME GAP [ % ]
86.5¢/ $1
WAGE / INCOME GAP [ $ ]
0.53
INEQUALITY / GINI INDEX
230
TOTAL POPULATION
97
MALE POPULATION
133
FEMALE POPULATION
72.93
MALES / 100 FEMALES
137.11
FEMALES / 100 MALES
40.2
MEDIAN AGE
3.1
AVG FAMILY SIZE
2.6
AVG HOUSEHOLD SIZE
68
LABOR FORCE [ PEOPLE ]
44.2%
PERCENT IN LABOR FORCE
13.2%
UNEMPLOYMENT RATE
Grandfalls Zip Codes
Grandfalls Area Codes
Income in Grandfalls
Income Overview in Grandfalls
Per Capita Income in Grandfalls is $20,216, while median incomes of families and households are $49,688 and $42,500 respectively.
| Characteristic | Number | Measure |
| Per Capita Income | 230 | $20,216 |
| Median Family Income | 67 | $49,688 |
| Mean Family Income | 67 | $74,072 |
| Median Household Income | 88 | $42,500 |
| Mean Household Income | 88 | $62,350 |
| Income Deficit | 67 | $0 |
| Wage / Income Gap (%) | 230 | 13.45% |
| Wage / Income Gap ($) | 230 | 86.55¢ per $1 |
| Gini / Inequality Index | 230 | 0.53 |
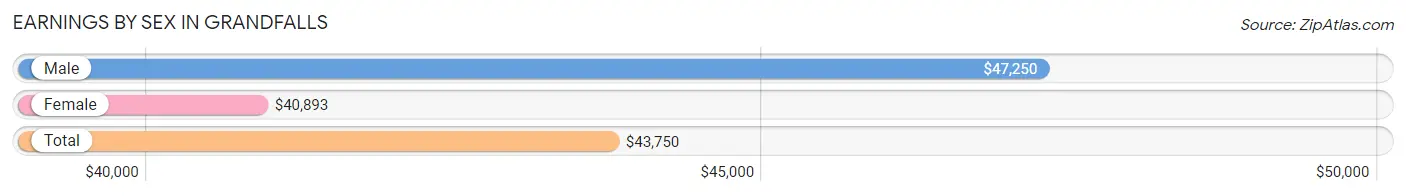
Earnings by Sex in Grandfalls
Average Earnings in Grandfalls are $43,750, $47,250 for men and $40,893 for women, a difference of 13.5%.
| Sex | Number | Average Earnings |
| Male | 37 (50.0%) | $47,250 |
| Female | 37 (50.0%) | $40,893 |
| Total | 74 (100.0%) | $43,750 |
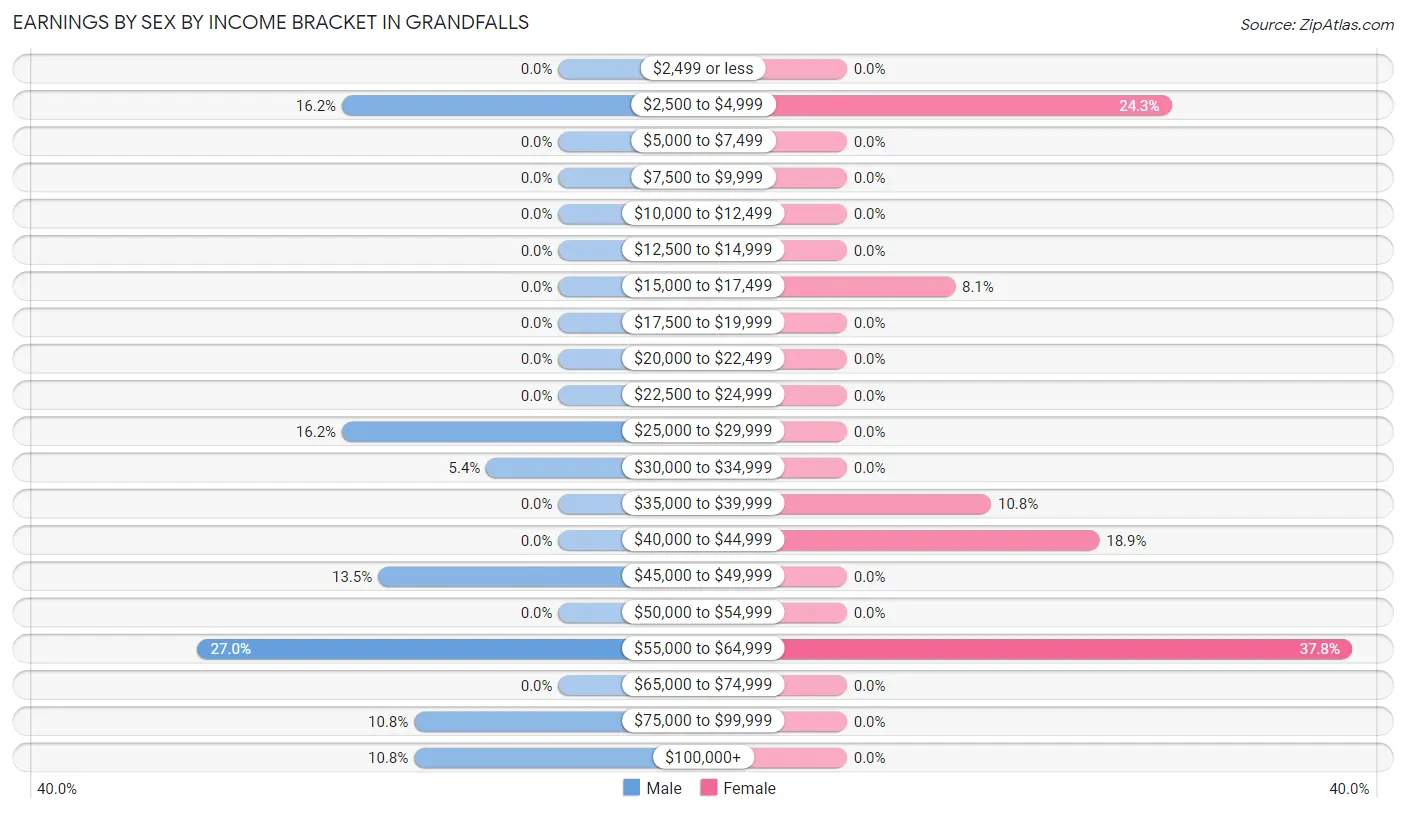
Earnings by Sex by Income Bracket in Grandfalls
The most common earnings brackets in Grandfalls are $55,000 to $64,999 for men (10 | 27.0%) and $55,000 to $64,999 for women (14 | 37.8%).
| Income | Male | Female |
| $2,499 or less | 0 (0.0%) | 0 (0.0%) |
| $2,500 to $4,999 | 6 (16.2%) | 9 (24.3%) |
| $5,000 to $7,499 | 0 (0.0%) | 0 (0.0%) |
| $7,500 to $9,999 | 0 (0.0%) | 0 (0.0%) |
| $10,000 to $12,499 | 0 (0.0%) | 0 (0.0%) |
| $12,500 to $14,999 | 0 (0.0%) | 0 (0.0%) |
| $15,000 to $17,499 | 0 (0.0%) | 3 (8.1%) |
| $17,500 to $19,999 | 0 (0.0%) | 0 (0.0%) |
| $20,000 to $22,499 | 0 (0.0%) | 0 (0.0%) |
| $22,500 to $24,999 | 0 (0.0%) | 0 (0.0%) |
| $25,000 to $29,999 | 6 (16.2%) | 0 (0.0%) |
| $30,000 to $34,999 | 2 (5.4%) | 0 (0.0%) |
| $35,000 to $39,999 | 0 (0.0%) | 4 (10.8%) |
| $40,000 to $44,999 | 0 (0.0%) | 7 (18.9%) |
| $45,000 to $49,999 | 5 (13.5%) | 0 (0.0%) |
| $50,000 to $54,999 | 0 (0.0%) | 0 (0.0%) |
| $55,000 to $64,999 | 10 (27.0%) | 14 (37.8%) |
| $65,000 to $74,999 | 0 (0.0%) | 0 (0.0%) |
| $75,000 to $99,999 | 4 (10.8%) | 0 (0.0%) |
| $100,000+ | 4 (10.8%) | 0 (0.0%) |
| Total | 37 (100.0%) | 37 (100.0%) |
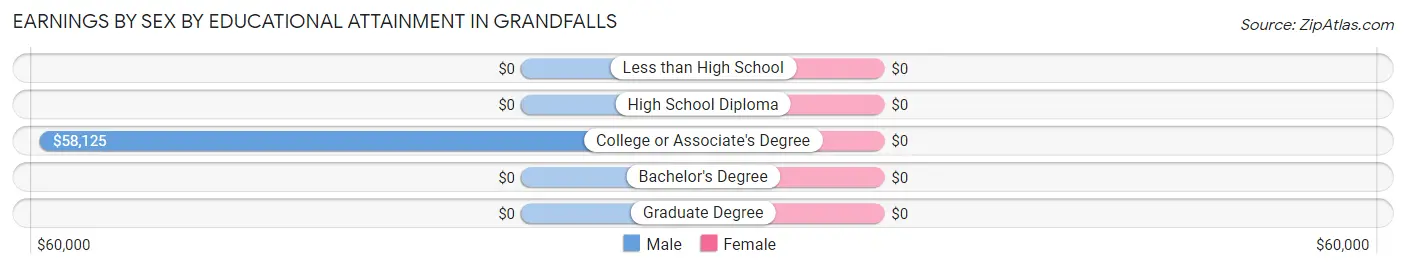
Earnings by Sex by Educational Attainment in Grandfalls
| Educational Attainment | Male Income | Female Income |
| Less than High School | - | - |
| High School Diploma | - | - |
| College or Associate's Degree | $58,125 | $0 |
| Bachelor's Degree | - | - |
| Graduate Degree | - | - |
| Total | $58,625 | $40,893 |
Family Income in Grandfalls
Family Income Brackets in Grandfalls
According to the Grandfalls family income data, there are 16 families falling into the $150,000 to $199,999 income range, which is the most common income bracket and makes up 23.9% of all families.
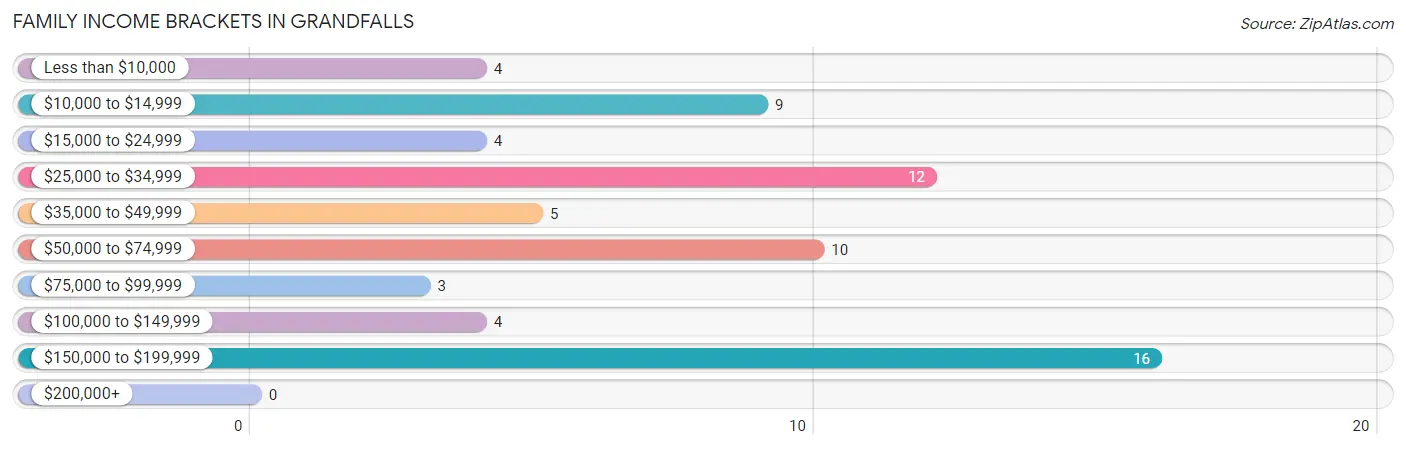
| Income Bracket | # Families | % Families |
| Less than $10,000 | 4 | 6.0% |
| $10,000 to $14,999 | 9 | 13.4% |
| $15,000 to $24,999 | 4 | 6.0% |
| $25,000 to $34,999 | 12 | 17.9% |
| $35,000 to $49,999 | 5 | 7.5% |
| $50,000 to $74,999 | 10 | 14.9% |
| $75,000 to $99,999 | 3 | 4.5% |
| $100,000 to $149,999 | 4 | 6.0% |
| $150,000 to $199,999 | 16 | 23.9% |
| $200,000+ | 0 | 0.0% |
Family Income by Famaliy Size in Grandfalls
2-person families (28 | 41.8%) account for the highest median family income in Grandfalls with $28,750 per family, while 2-person families (28 | 41.8%) have the highest median income of $14,375 per family member.
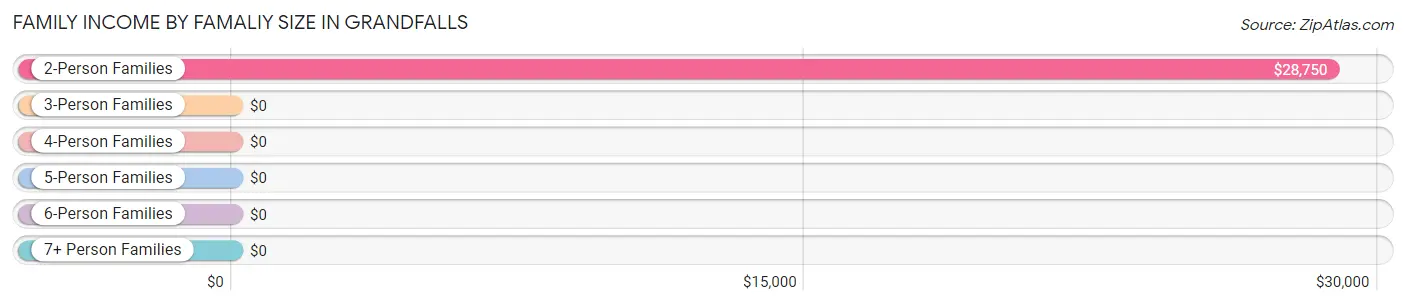
| Income Bracket | # Families | Median Income |
| 2-Person Families | 28 (41.8%) | $28,750 |
| 3-Person Families | 16 (23.9%) | $0 |
| 4-Person Families | 17 (25.4%) | $0 |
| 5-Person Families | 0 (0.0%) | $0 |
| 6-Person Families | 0 (0.0%) | $0 |
| 7+ Person Families | 6 (9.0%) | $0 |
| Total | 67 (100.0%) | $49,688 |
Family Income by Number of Earners in Grandfalls
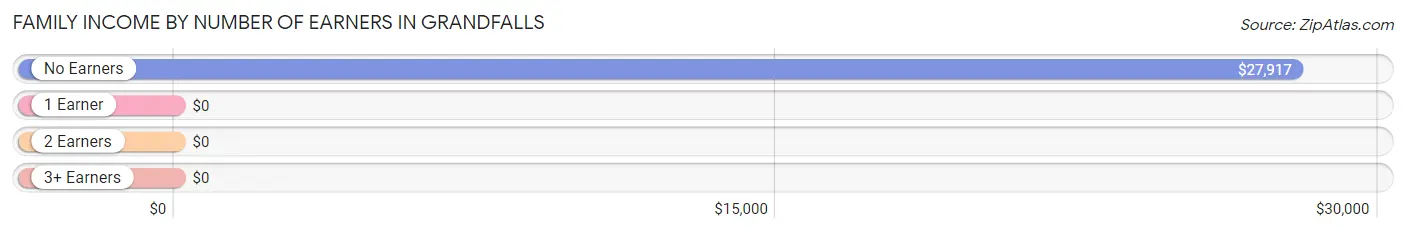
| Number of Earners | # Families | Median Income |
| No Earners | 20 (29.8%) | $27,917 |
| 1 Earner | 25 (37.3%) | $0 |
| 2 Earners | 13 (19.4%) | $0 |
| 3+ Earners | 9 (13.4%) | $0 |
| Total | 67 (100.0%) | $49,688 |
Household Income in Grandfalls
Household Income Brackets in Grandfalls
With 16 households falling in the category, the $150,000 to $199,999 income range is the most frequent in Grandfalls, accounting for 18.2% of all households.
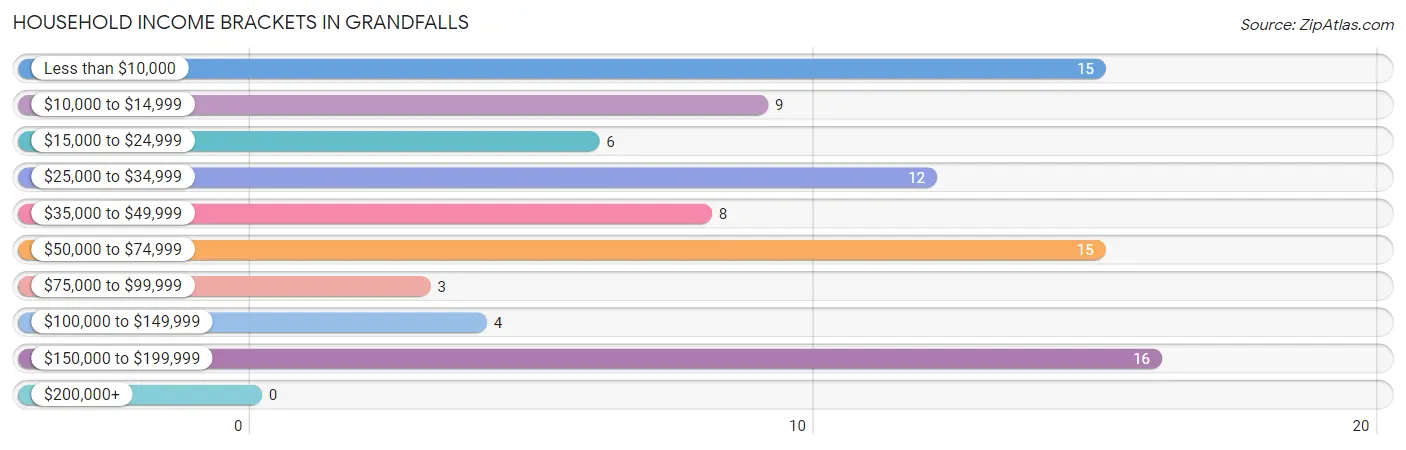
| Income Bracket | # Households | % Households |
| Less than $10,000 | 15 | 17.0% |
| $10,000 to $14,999 | 9 | 10.2% |
| $15,000 to $24,999 | 6 | 6.8% |
| $25,000 to $34,999 | 12 | 13.6% |
| $35,000 to $49,999 | 8 | 9.1% |
| $50,000 to $74,999 | 15 | 17.0% |
| $75,000 to $99,999 | 3 | 3.4% |
| $100,000 to $149,999 | 4 | 4.5% |
| $150,000 to $199,999 | 16 | 18.2% |
| $200,000+ | 0 | 0.0% |
Household Income by Householder Age in Grandfalls
The median household income in Grandfalls is $42,500, with the highest median household income of $28,125 found in the 65+ years age bracket for the primary householder. A total of 36 households (40.9%) fall into this category.
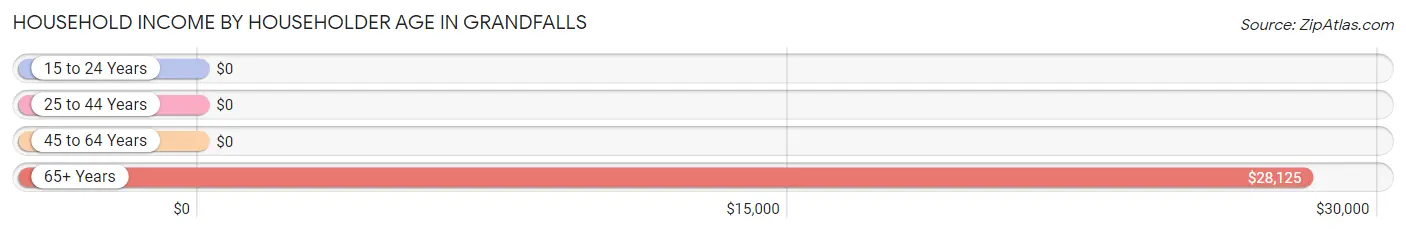
| Income Bracket | # Households | Median Income |
| 15 to 24 Years | 0 (0.0%) | $0 |
| 25 to 44 Years | 16 (18.2%) | $0 |
| 45 to 64 Years | 36 (40.9%) | $0 |
| 65+ Years | 36 (40.9%) | $28,125 |
| Total | 88 (100.0%) | $42,500 |
Poverty in Grandfalls
Income Below Poverty by Sex and Age in Grandfalls
With 13.4% poverty level for males and 24.1% for females among the residents of Grandfalls, 12 to 14 year old males and 16 and 17 year old females are the most vulnerable to poverty, with 6 males (100.0%) and 6 females (100.0%) in their respective age groups living below the poverty level.
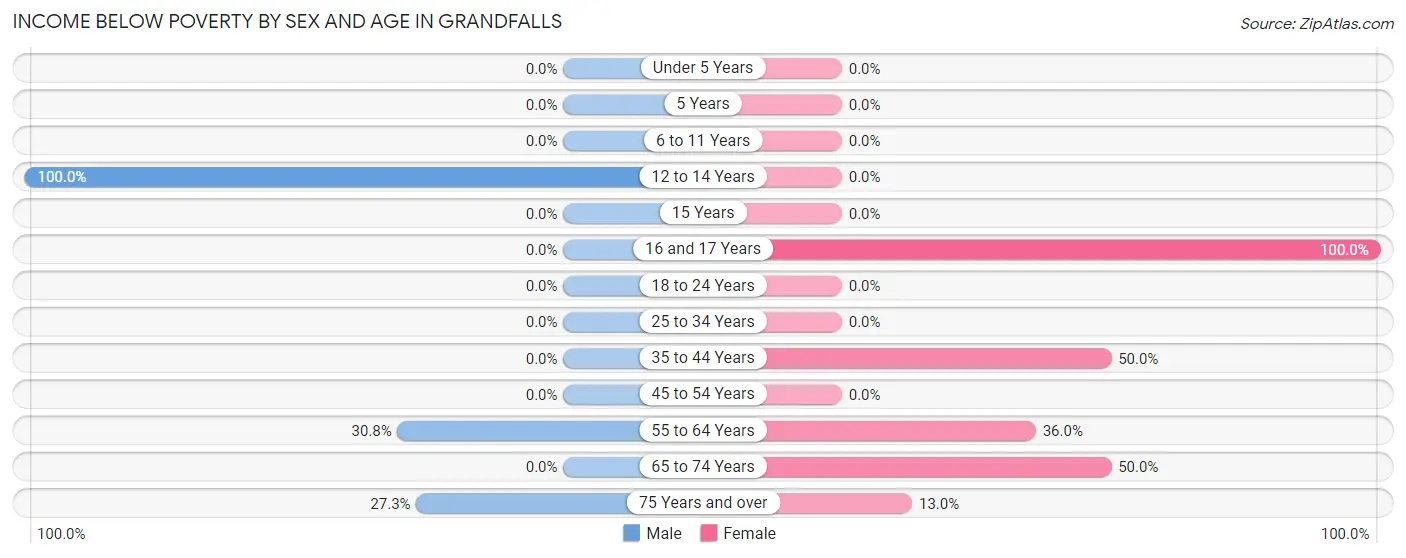
| Age Bracket | Male | Female |
| Under 5 Years | 0 (0.0%) | 0 (0.0%) |
| 5 Years | 0 (0.0%) | 0 (0.0%) |
| 6 to 11 Years | 0 (0.0%) | 0 (0.0%) |
| 12 to 14 Years | 6 (100.0%) | 0 (0.0%) |
| 15 Years | 0 (0.0%) | 0 (0.0%) |
| 16 and 17 Years | 0 (0.0%) | 6 (100.0%) |
| 18 to 24 Years | 0 (0.0%) | 0 (0.0%) |
| 25 to 34 Years | 0 (0.0%) | 0 (0.0%) |
| 35 to 44 Years | 0 (0.0%) | 9 (50.0%) |
| 45 to 54 Years | 0 (0.0%) | 0 (0.0%) |
| 55 to 64 Years | 4 (30.8%) | 9 (36.0%) |
| 65 to 74 Years | 0 (0.0%) | 5 (50.0%) |
| 75 Years and over | 3 (27.3%) | 3 (13.0%) |
| Total | 13 (13.4%) | 32 (24.1%) |
Income Above Poverty by Sex and Age in Grandfalls
According to the poverty statistics in Grandfalls, males aged under 5 years and females aged under 5 years are the age groups that are most secure financially, with 100.0% of males and 100.0% of females in these age groups living above the poverty line.
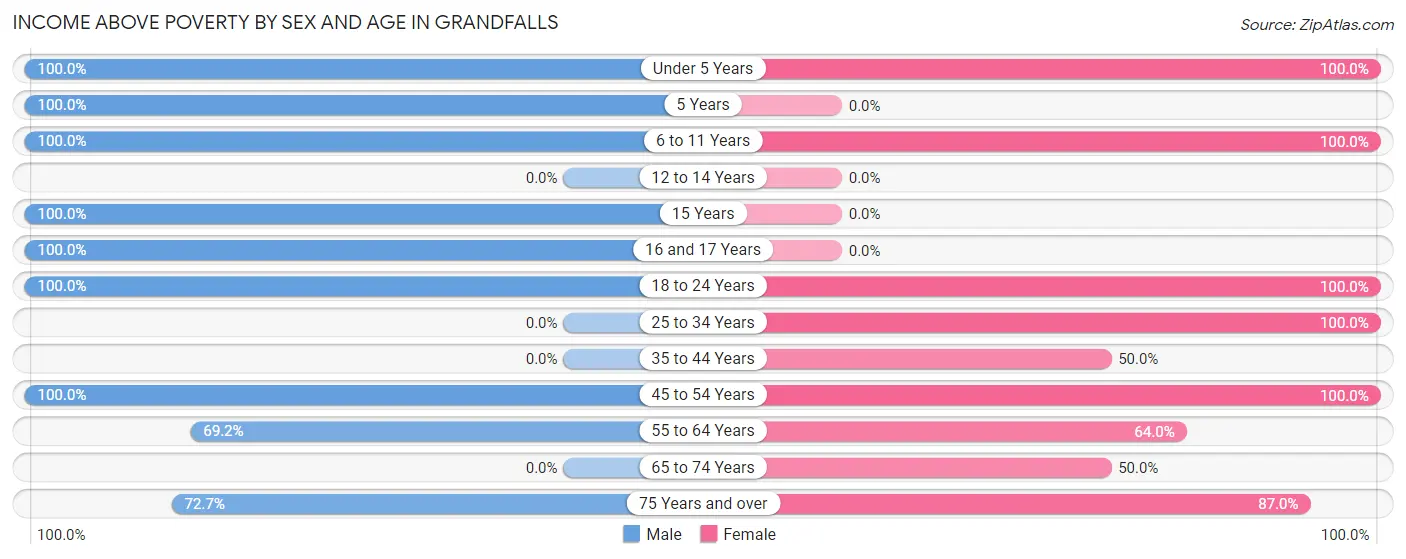
| Age Bracket | Male | Female |
| Under 5 Years | 8 (100.0%) | 19 (100.0%) |
| 5 Years | 11 (100.0%) | 0 (0.0%) |
| 6 to 11 Years | 17 (100.0%) | 10 (100.0%) |
| 12 to 14 Years | 0 (0.0%) | 0 (0.0%) |
| 15 Years | 5 (100.0%) | 0 (0.0%) |
| 16 and 17 Years | 6 (100.0%) | 0 (0.0%) |
| 18 to 24 Years | 4 (100.0%) | 3 (100.0%) |
| 25 to 34 Years | 0 (0.0%) | 9 (100.0%) |
| 35 to 44 Years | 0 (0.0%) | 9 (50.0%) |
| 45 to 54 Years | 16 (100.0%) | 10 (100.0%) |
| 55 to 64 Years | 9 (69.2%) | 16 (64.0%) |
| 65 to 74 Years | 0 (0.0%) | 5 (50.0%) |
| 75 Years and over | 8 (72.7%) | 20 (87.0%) |
| Total | 84 (86.6%) | 101 (75.9%) |
Income Below Poverty Among Married-Couple Families in Grandfalls
The poverty statistics for married-couple families in Grandfalls show that 9.3% or 4 of the total 43 families live below the poverty line. Families with no children have the highest poverty rate of 14.8%, comprising of 4 families. On the other hand, families with 1 or 2 children have the lowest poverty rate of 0.0%, which includes 0 families.
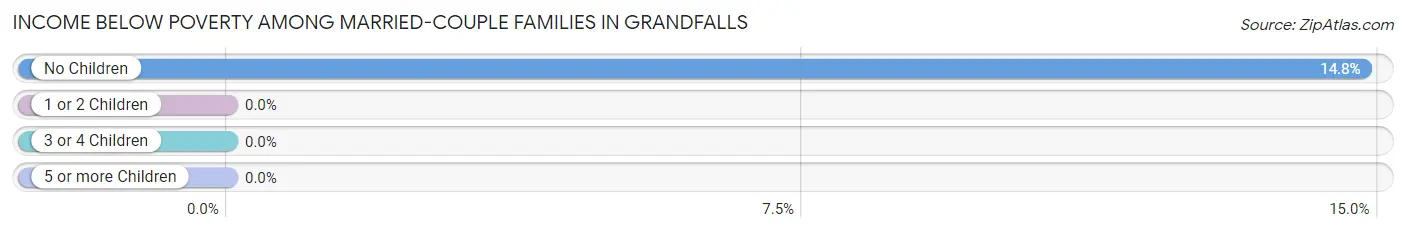
| Children | Above Poverty | Below Poverty |
| No Children | 23 (85.2%) | 4 (14.8%) |
| 1 or 2 Children | 10 (100.0%) | 0 (0.0%) |
| 3 or 4 Children | 0 (0.0%) | 0 (0.0%) |
| 5 or more Children | 6 (100.0%) | 0 (0.0%) |
| Total | 39 (90.7%) | 4 (9.3%) |
Income Below Poverty Among Single-Parent Households in Grandfalls
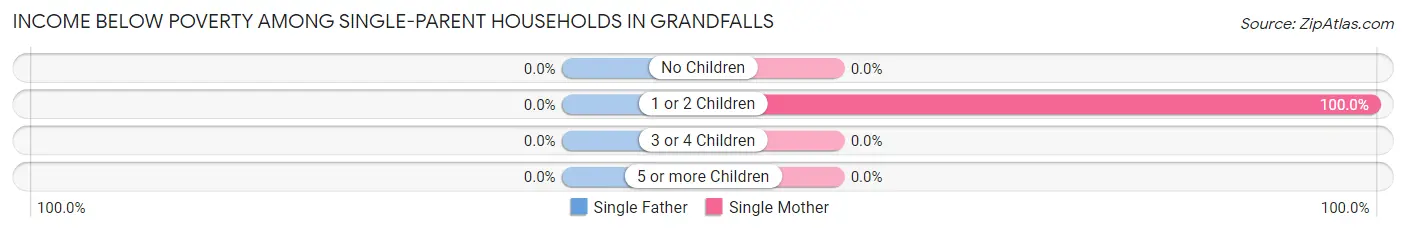
| Children | Single Father | Single Mother |
| No Children | 0 (0.0%) | 0 (0.0%) |
| 1 or 2 Children | 0 (0.0%) | 9 (100.0%) |
| 3 or 4 Children | 0 (0.0%) | 0 (0.0%) |
| 5 or more Children | 0 (0.0%) | 0 (0.0%) |
| Total | 0 (0.0%) | 9 (39.1%) |
Income Below Poverty Among Married-Couple vs Single-Parent Households in Grandfalls
The poverty data for Grandfalls shows that 4 of the married-couple family households (9.3%) and 9 of the single-parent households (37.5%) are living below the poverty level. Within the married-couple family households, those with no children have the highest poverty rate, with 4 households (14.8%) falling below the poverty line. Among the single-parent households, those with 1 or 2 children have the highest poverty rate, with 9 household (100.0%) living below poverty.
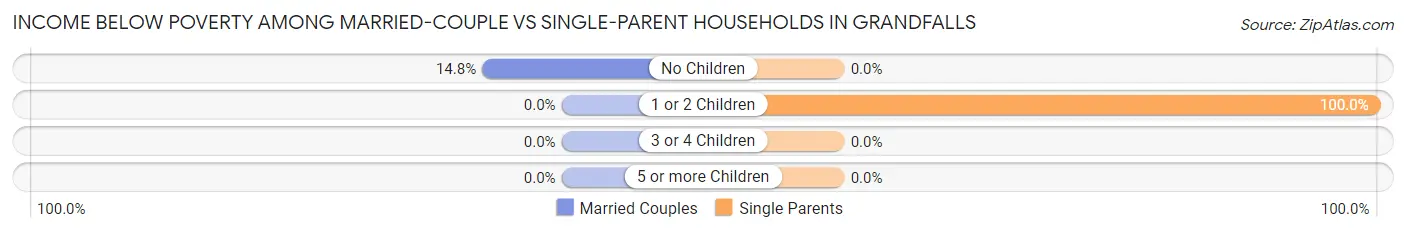
| Children | Married-Couple Families | Single-Parent Households |
| No Children | 4 (14.8%) | 0 (0.0%) |
| 1 or 2 Children | 0 (0.0%) | 9 (100.0%) |
| 3 or 4 Children | 0 (0.0%) | 0 (0.0%) |
| 5 or more Children | 0 (0.0%) | 0 (0.0%) |
| Total | 4 (9.3%) | 9 (37.5%) |
Race in Grandfalls
The most populous races in Grandfalls are White / Caucasian (174 | 75.6%), Hispanic or Latino (98 | 42.6%), and Black / African American (28 | 12.2%).
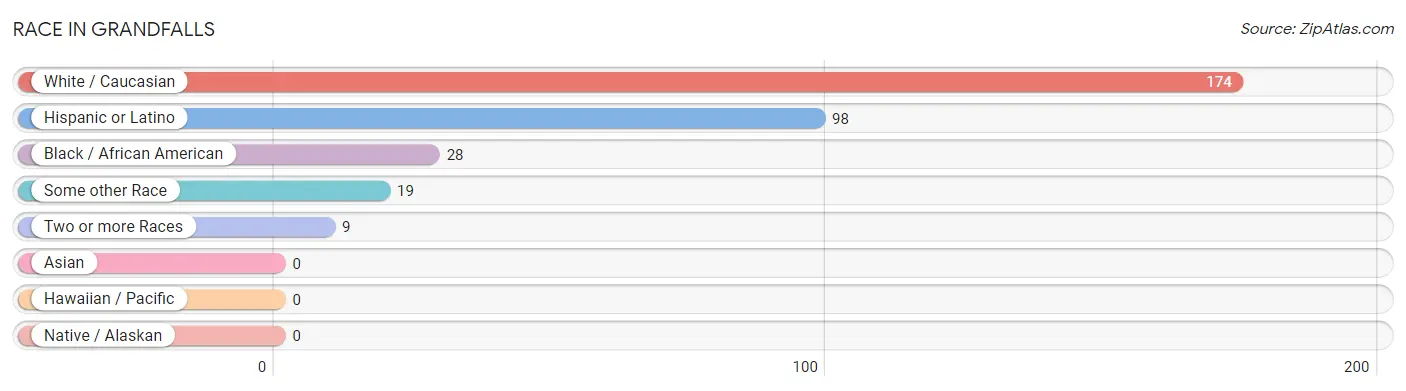
| Race | # Population | % Population |
| Asian | 0 | 0.0% |
| Black / African American | 28 | 12.2% |
| Hawaiian / Pacific | 0 | 0.0% |
| Hispanic or Latino | 98 | 42.6% |
| Native / Alaskan | 0 | 0.0% |
| White / Caucasian | 174 | 75.6% |
| Two or more Races | 9 | 3.9% |
| Some other Race | 19 | 8.3% |
| Total | 230 | 100.0% |
Ancestry in Grandfalls
The most populous ancestries reported in Grandfalls are Mexican (98 | 42.6%), American (63 | 27.4%), English (16 | 7.0%), Scottish (13 | 5.7%), and German (4 | 1.7%), together accounting for 84.3% of all Grandfalls residents.
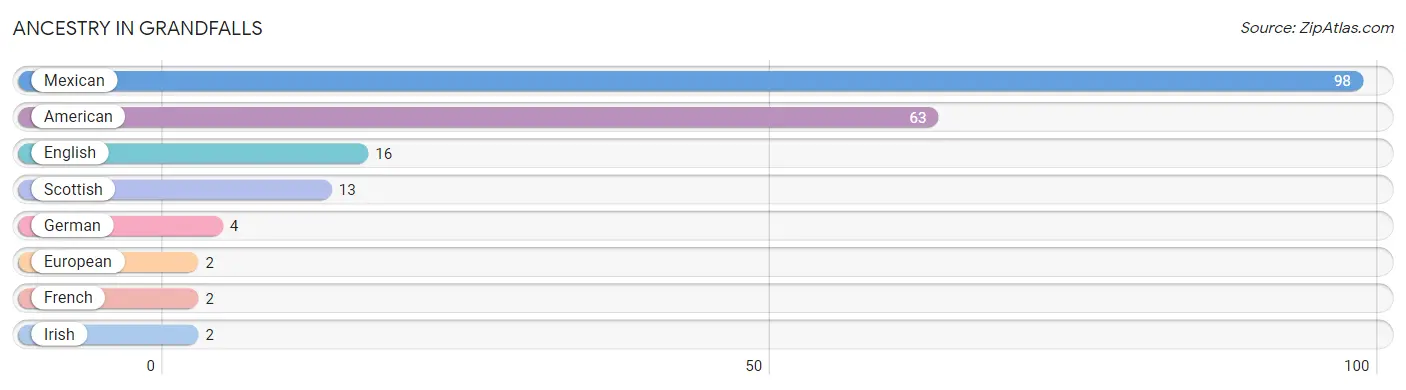
| Ancestry | # Population | % Population |
| American | 63 | 27.4% |
| English | 16 | 7.0% |
| European | 2 | 0.9% |
| French | 2 | 0.9% |
| German | 4 | 1.7% |
| Irish | 2 | 0.9% |
| Mexican | 98 | 42.6% |
| Scottish | 13 | 5.7% | View All 8 Rows |
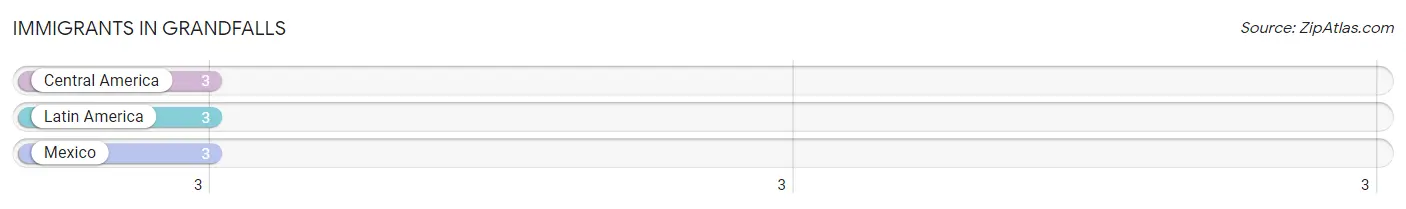
Immigrants in Grandfalls
The most numerous immigrant groups reported in Grandfalls came from Central America (3 | 1.3%), Latin America (3 | 1.3%), and Mexico (3 | 1.3%), together accounting for 3.9% of all Grandfalls residents.
| Immigration Origin | # Population | % Population |
| Central America | 3 | 1.3% |
| Latin America | 3 | 1.3% |
| Mexico | 3 | 1.3% | View All 3 Rows |
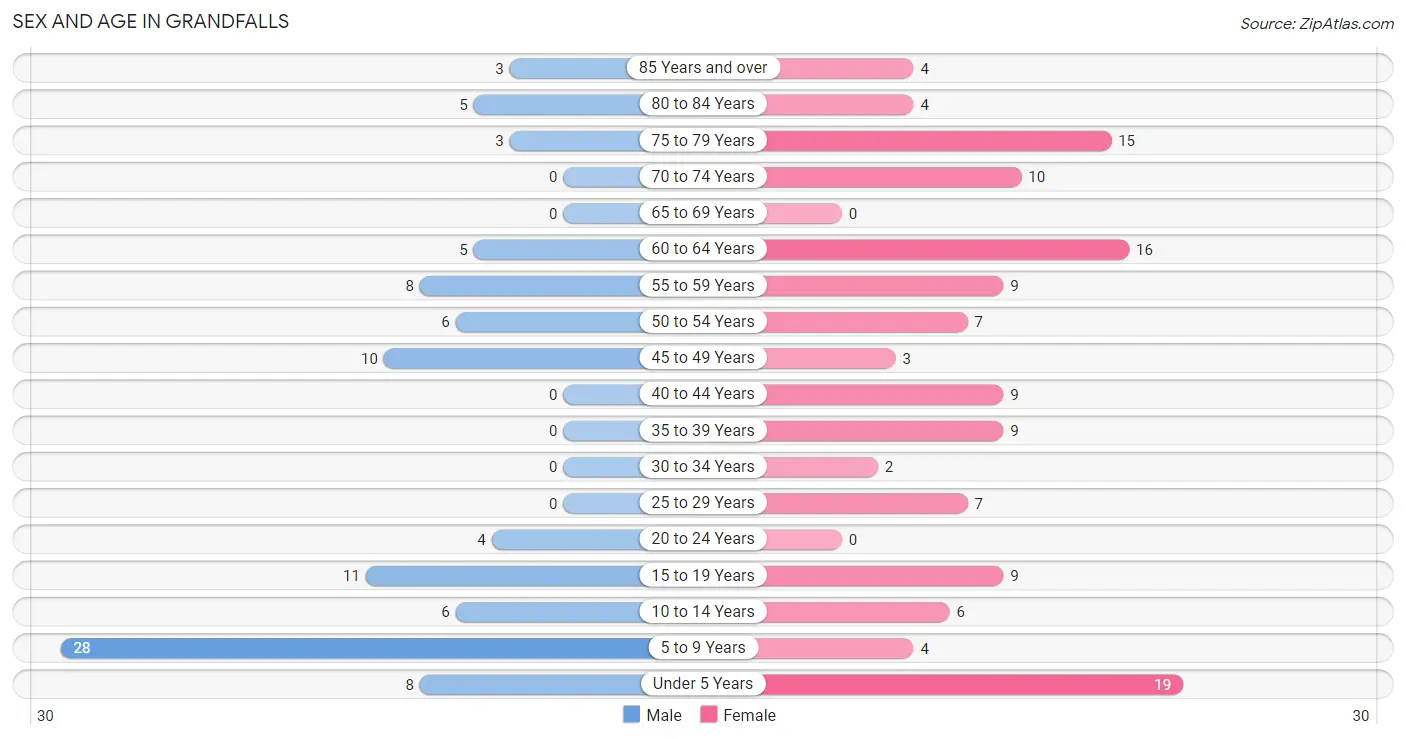
Sex and Age in Grandfalls
Sex and Age in Grandfalls
The most populous age groups in Grandfalls are 5 to 9 Years (28 | 28.9%) for men and Under 5 Years (19 | 14.3%) for women.
| Age Bracket | Male | Female |
| Under 5 Years | 8 (8.3%) | 19 (14.3%) |
| 5 to 9 Years | 28 (28.9%) | 4 (3.0%) |
| 10 to 14 Years | 6 (6.2%) | 6 (4.5%) |
| 15 to 19 Years | 11 (11.3%) | 9 (6.8%) |
| 20 to 24 Years | 4 (4.1%) | 0 (0.0%) |
| 25 to 29 Years | 0 (0.0%) | 7 (5.3%) |
| 30 to 34 Years | 0 (0.0%) | 2 (1.5%) |
| 35 to 39 Years | 0 (0.0%) | 9 (6.8%) |
| 40 to 44 Years | 0 (0.0%) | 9 (6.8%) |
| 45 to 49 Years | 10 (10.3%) | 3 (2.3%) |
| 50 to 54 Years | 6 (6.2%) | 7 (5.3%) |
| 55 to 59 Years | 8 (8.3%) | 9 (6.8%) |
| 60 to 64 Years | 5 (5.1%) | 16 (12.0%) |
| 65 to 69 Years | 0 (0.0%) | 0 (0.0%) |
| 70 to 74 Years | 0 (0.0%) | 10 (7.5%) |
| 75 to 79 Years | 3 (3.1%) | 15 (11.3%) |
| 80 to 84 Years | 5 (5.1%) | 4 (3.0%) |
| 85 Years and over | 3 (3.1%) | 4 (3.0%) |
| Total | 97 (100.0%) | 133 (100.0%) |
Families and Households in Grandfalls
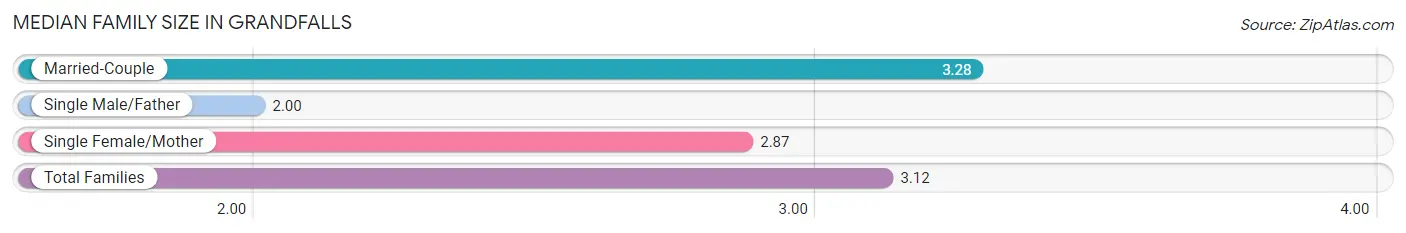
Median Family Size in Grandfalls
The median family size in Grandfalls is 3.12 persons per family, with married-couple families (43 | 64.2%) accounting for the largest median family size of 3.28 persons per family. On the other hand, single male/father families (1 | 1.5%) represent the smallest median family size with 2.00 persons per family.
| Family Type | # Families | Family Size |
| Married-Couple | 43 (64.2%) | 3.28 |
| Single Male/Father | 1 (1.5%) | 2.00 |
| Single Female/Mother | 23 (34.3%) | 2.87 |
| Total Families | 67 (100.0%) | 3.12 |
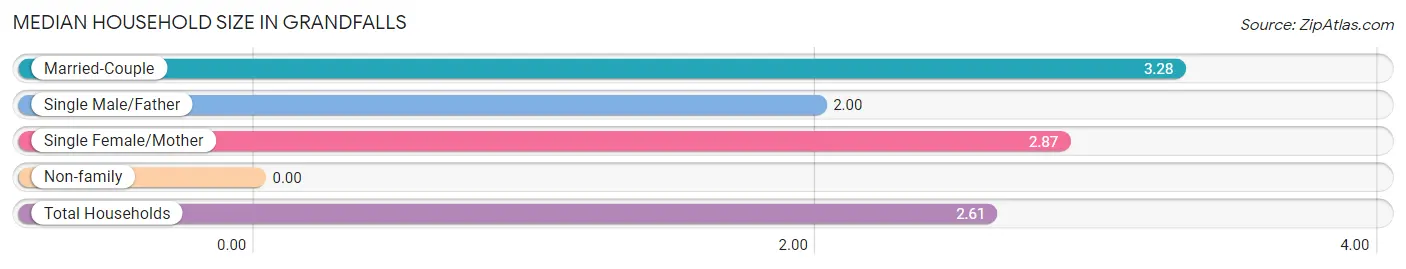
Median Household Size in Grandfalls
| Household Type | # Households | Household Size |
| Married-Couple | 43 (48.9%) | 3.28 |
| Single Male/Father | 1 (1.1%) | 2.00 |
| Single Female/Mother | 23 (26.1%) | 2.87 |
| Non-family | 21 (23.9%) | - |
| Total Households | 88 (100.0%) | 2.61 |
Household Size by Marriage Status in Grandfalls
Out of a total of 88 households in Grandfalls, 67 (76.1%) are family households, while 21 (23.9%) are nonfamily households. The most numerous type of family households are 2-person households, comprising 28, and the most common type of nonfamily households are 1-person households, comprising 21.
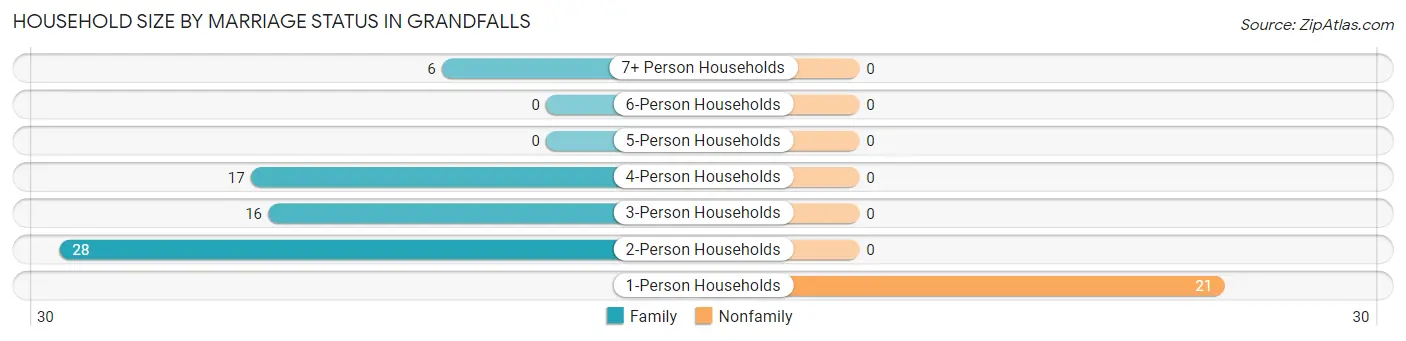
| Household Size | Family Households | Nonfamily Households |
| 1-Person Households | - | 21 (23.9%) |
| 2-Person Households | 28 (31.8%) | 0 (0.0%) |
| 3-Person Households | 16 (18.2%) | 0 (0.0%) |
| 4-Person Households | 17 (19.3%) | 0 (0.0%) |
| 5-Person Households | 0 (0.0%) | 0 (0.0%) |
| 6-Person Households | 0 (0.0%) | 0 (0.0%) |
| 7+ Person Households | 6 (6.8%) | 0 (0.0%) |
| Total | 67 (76.1%) | 21 (23.9%) |
Female Fertility in Grandfalls
Fertility by Age in Grandfalls
| Age Bracket | Women with Births | Births / 1,000 Women |
| 15 to 19 years | 0 (0.0%) | 0.0 |
| 20 to 34 years | 0 (0.0%) | 0.0 |
| 35 to 50 years | 0 (0.0%) | 0.0 |
| Total | 0 (0.0%) | 0.0 |
Fertility by Age by Marriage Status in Grandfalls
| Age Bracket | Married | Unmarried |
| 15 to 19 years | 0 (0.0%) | 0 (0.0%) |
| 20 to 34 years | 0 (0.0%) | 0 (0.0%) |
| 35 to 50 years | 0 (0.0%) | 0 (0.0%) |
| Total | 0 (0.0%) | 0 (0.0%) |
Fertility by Education in Grandfalls
| Educational Attainment | Women with Births | Births / 1,000 Women |
| Less than High School | 0 (0.0%) | 0.0 |
| High School Diploma | 0 (0.0%) | 0.0 |
| College or Associate's Degree | 0 (0.0%) | 0.0 |
| Bachelor's Degree | 0 (0.0%) | 0.0 |
| Graduate Degree | 0 (0.0%) | 0.0 |
| Total | 0 (0.0%) | 0.0 |
Fertility by Education by Marriage Status in Grandfalls
| Educational Attainment | Married | Unmarried |
| Less than High School | 0 (0.0%) | 0 (0.0%) |
| High School Diploma | 0 (0.0%) | 0 (0.0%) |
| College or Associate's Degree | 0 (0.0%) | 0 (0.0%) |
| Bachelor's Degree | 0 (0.0%) | 0 (0.0%) |
| Graduate Degree | 0 (0.0%) | 0 (0.0%) |
| Total | 0 (0.0%) | 0 (0.0%) |
Employment Characteristics in Grandfalls
Employment by Class of Employer in Grandfalls
Among the 59 employed individuals in Grandfalls, private company employees (27 | 45.8%), state government employees (17 | 28.8%), and local government employees (15 | 25.4%) make up the most common classes of employment.
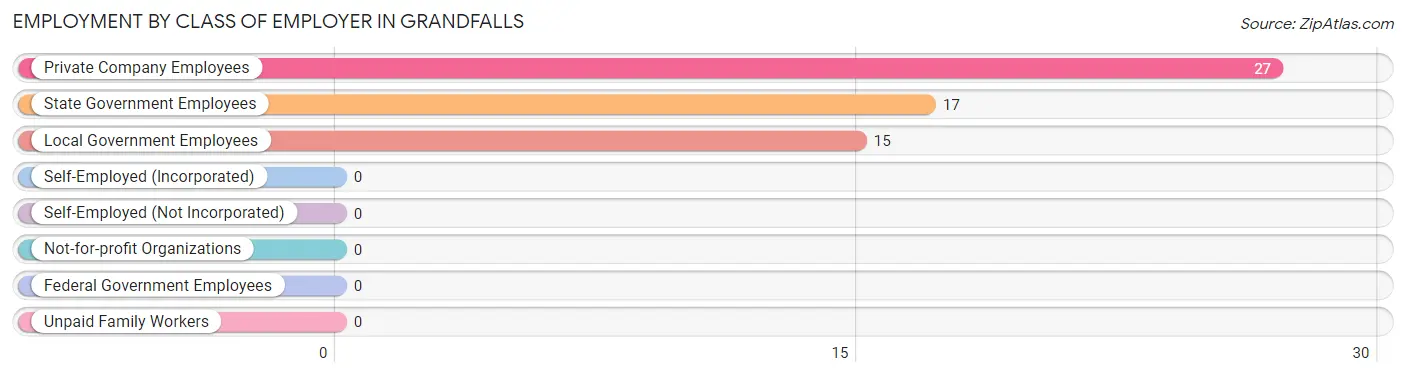
| Employer Class | # Employees | % Employees |
| Private Company Employees | 27 | 45.8% |
| Self-Employed (Incorporated) | 0 | 0.0% |
| Self-Employed (Not Incorporated) | 0 | 0.0% |
| Not-for-profit Organizations | 0 | 0.0% |
| Local Government Employees | 15 | 25.4% |
| State Government Employees | 17 | 28.8% |
| Federal Government Employees | 0 | 0.0% |
| Unpaid Family Workers | 0 | 0.0% |
| Total | 59 | 100.0% |
Employment Status by Age in Grandfalls
According to the labor force statistics for Grandfalls, out of the total population over 16 years of age (154), 44.2% or 68 individuals are in the labor force, with 13.2% or 9 of them unemployed. The age group with the highest labor force participation rate is 20 to 24 years, with 100.0% or 4 individuals in the labor force. Within the labor force, the 35 to 44 years age range has the highest percentage of unemployed individuals, with 100.0% or 9 of them being unemployed.
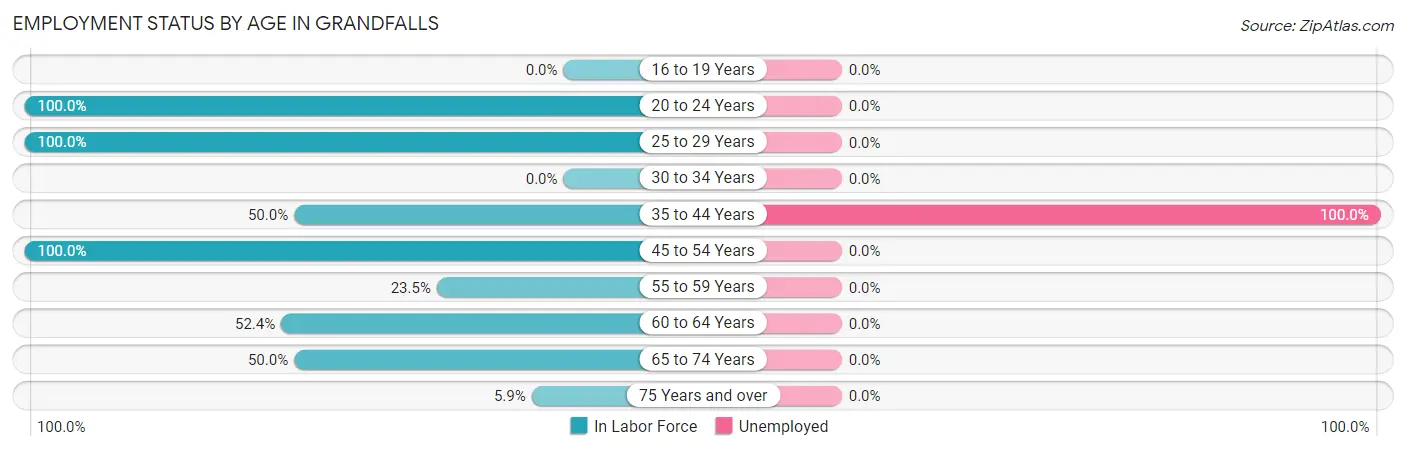
| Age Bracket | In Labor Force | Unemployed |
| 16 to 19 Years | 0 (0.0%) | 0 (0.0%) |
| 20 to 24 Years | 4 (100.0%) | 0 (0.0%) |
| 25 to 29 Years | 7 (100.0%) | 0 (0.0%) |
| 30 to 34 Years | 0 (0.0%) | 0 (0.0%) |
| 35 to 44 Years | 9 (50.0%) | 9 (100.0%) |
| 45 to 54 Years | 26 (100.0%) | 0 (0.0%) |
| 55 to 59 Years | 4 (23.5%) | 0 (0.0%) |
| 60 to 64 Years | 11 (52.4%) | 0 (0.0%) |
| 65 to 74 Years | 5 (50.0%) | 0 (0.0%) |
| 75 Years and over | 2 (5.9%) | 0 (0.0%) |
| Total | 68 (44.2%) | 9 (13.2%) |
Employment Status by Educational Attainment in Grandfalls
According to labor force statistics for Grandfalls, 62.6% of individuals (57) out of the total population between 25 and 64 years of age (91) are in the labor force, with 15.8% or 9 of them being unemployed. The group with the highest labor force participation rate are those with the educational attainment of bachelor's degree or higher, with 100.0% or 20 individuals in the labor force. Within the labor force, individuals with high school diploma education have the highest percentage of unemployment, with 40.9% or 9 of them being unemployed.
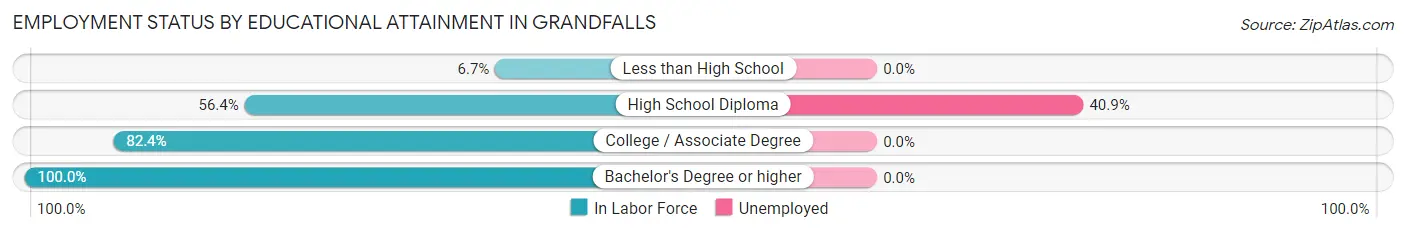
| Educational Attainment | In Labor Force | Unemployed |
| Less than High School | 1 (6.7%) | 0 (0.0%) |
| High School Diploma | 22 (56.4%) | 16 (40.9%) |
| College / Associate Degree | 14 (82.4%) | 0 (0.0%) |
| Bachelor's Degree or higher | 20 (100.0%) | 0 (0.0%) |
| Total | 57 (62.6%) | 14 (15.8%) |
Employment Occupations by Sex in Grandfalls
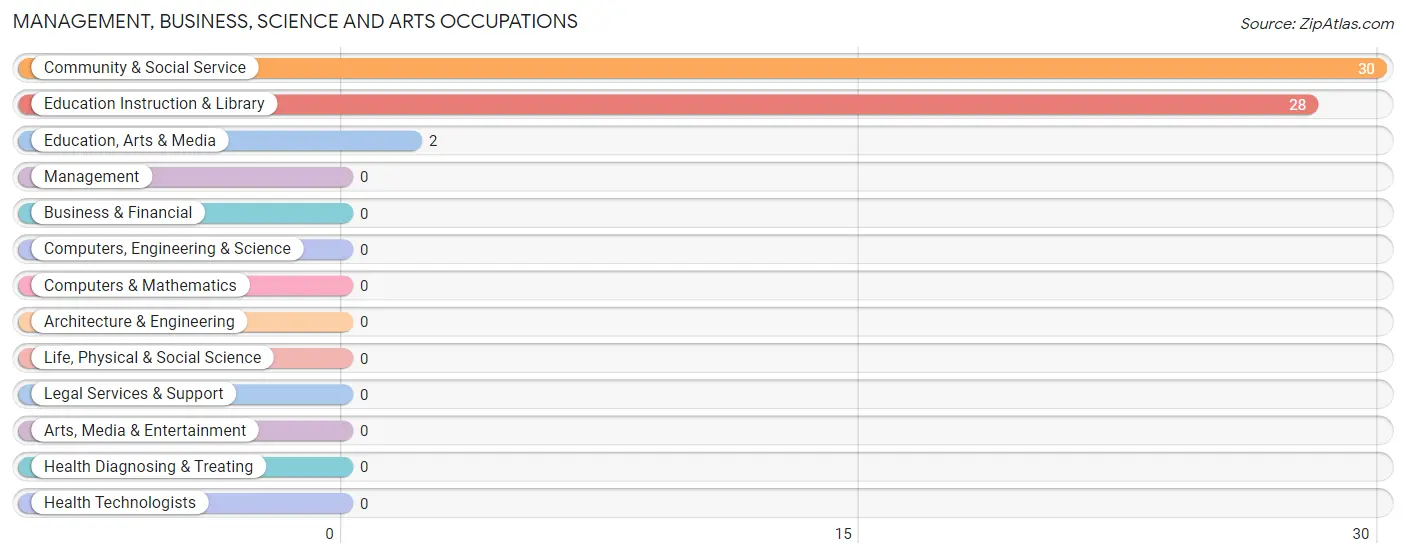
Management, Business, Science and Arts Occupations
The most common Management, Business, Science and Arts occupations in Grandfalls are Community & Social Service (30 | 50.8%), Education Instruction & Library (28 | 47.5%), and Education, Arts & Media (2 | 3.4%).
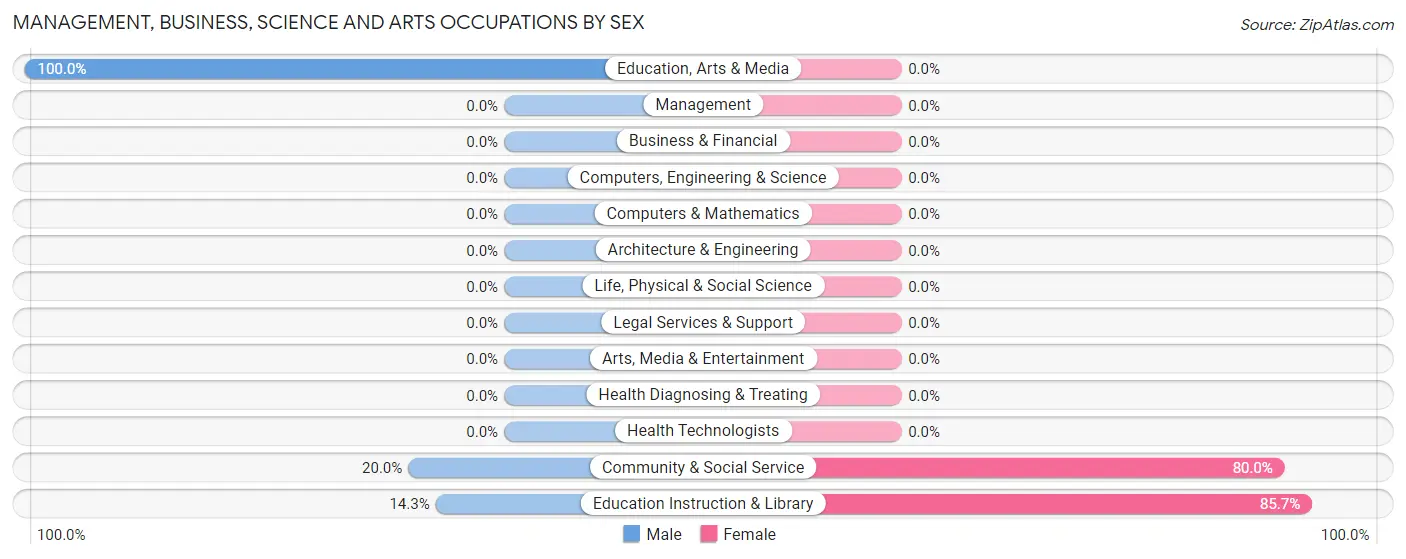
Management, Business, Science and Arts Occupations by Sex
Within the Management, Business, Science and Arts occupations in Grandfalls, the most male-oriented occupations are Education, Arts & Media (100.0%), Community & Social Service (20.0%), and Education Instruction & Library (14.3%), while the most female-oriented occupations are Education Instruction & Library (85.7%), and Community & Social Service (80.0%).
| Occupation | Male | Female |
| Management | 0 (0.0%) | 0 (0.0%) |
| Business & Financial | 0 (0.0%) | 0 (0.0%) |
| Computers, Engineering & Science | 0 (0.0%) | 0 (0.0%) |
| Computers & Mathematics | 0 (0.0%) | 0 (0.0%) |
| Architecture & Engineering | 0 (0.0%) | 0 (0.0%) |
| Life, Physical & Social Science | 0 (0.0%) | 0 (0.0%) |
| Community & Social Service | 6 (20.0%) | 24 (80.0%) |
| Education, Arts & Media | 2 (100.0%) | 0 (0.0%) |
| Legal Services & Support | 0 (0.0%) | 0 (0.0%) |
| Education Instruction & Library | 4 (14.3%) | 24 (85.7%) |
| Arts, Media & Entertainment | 0 (0.0%) | 0 (0.0%) |
| Health Diagnosing & Treating | 0 (0.0%) | 0 (0.0%) |
| Health Technologists | 0 (0.0%) | 0 (0.0%) |
| Total (Category) | 6 (20.0%) | 24 (80.0%) |
| Total (Overall) | 31 (52.5%) | 28 (47.5%) |
Services Occupations
Services Occupations by Sex
| Occupation | Male | Female |
| Healthcare Support | 0 (0.0%) | 0 (0.0%) |
| Security & Protection | 0 (0.0%) | 0 (0.0%) |
| Firefighting & Prevention | 0 (0.0%) | 0 (0.0%) |
| Law Enforcement | 0 (0.0%) | 0 (0.0%) |
| Food Preparation & Serving | 0 (0.0%) | 0 (0.0%) |
| Cleaning & Maintenance | 0 (0.0%) | 0 (0.0%) |
| Personal Care & Service | 0 (0.0%) | 0 (0.0%) |
| Total (Category) | 0 (0.0%) | 0 (0.0%) |
| Total (Overall) | 31 (52.5%) | 28 (47.5%) |
Sales and Office Occupations
The most common Sales and Office occupations in Grandfalls are Office & Administration (4 | 6.8%), and Sales & Related (2 | 3.4%).
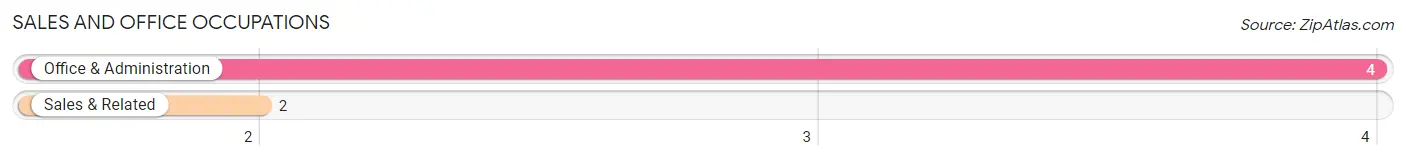
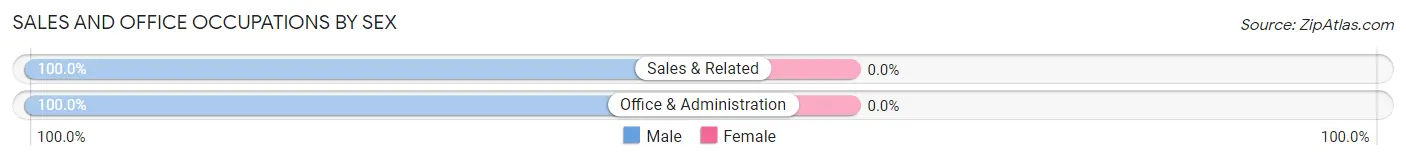
Sales and Office Occupations by Sex
| Occupation | Male | Female |
| Sales & Related | 2 (100.0%) | 0 (0.0%) |
| Office & Administration | 4 (100.0%) | 0 (0.0%) |
| Total (Category) | 6 (100.0%) | 0 (0.0%) |
| Total (Overall) | 31 (52.5%) | 28 (47.5%) |
Natural Resources, Construction and Maintenance Occupations
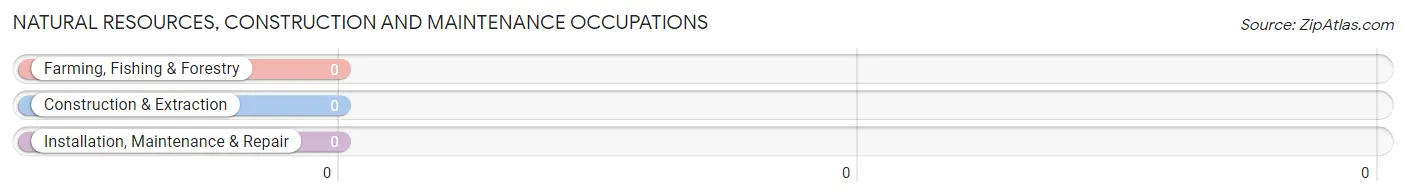
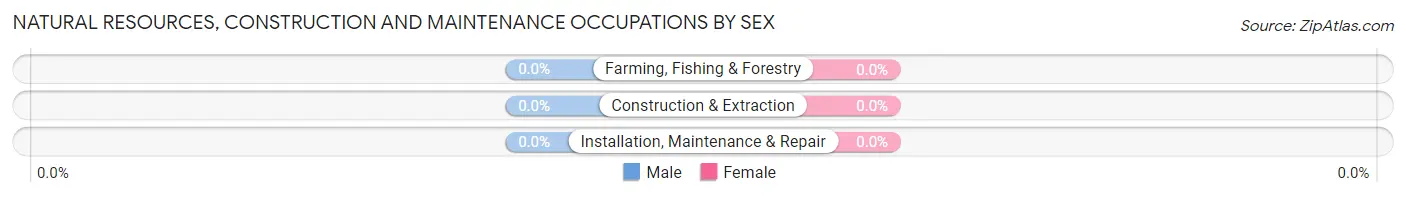
Natural Resources, Construction and Maintenance Occupations by Sex
| Occupation | Male | Female |
| Farming, Fishing & Forestry | 0 (0.0%) | 0 (0.0%) |
| Construction & Extraction | 0 (0.0%) | 0 (0.0%) |
| Installation, Maintenance & Repair | 0 (0.0%) | 0 (0.0%) |
| Total (Category) | 0 (0.0%) | 0 (0.0%) |
| Total (Overall) | 31 (52.5%) | 28 (47.5%) |
Production, Transportation and Moving Occupations
The most common Production, Transportation and Moving occupations in Grandfalls are Transportation (18 | 30.5%), and Production (5 | 8.5%).
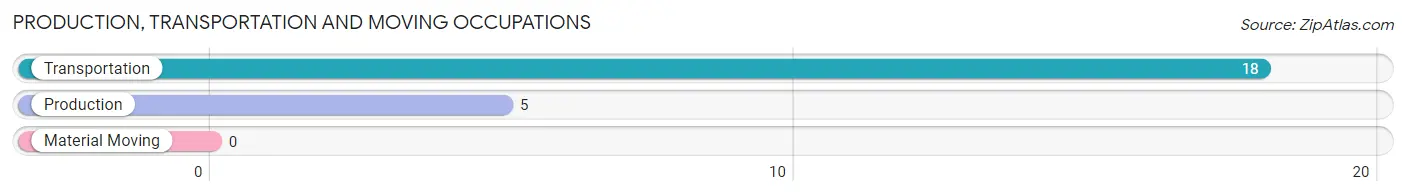
Production, Transportation and Moving Occupations by Sex
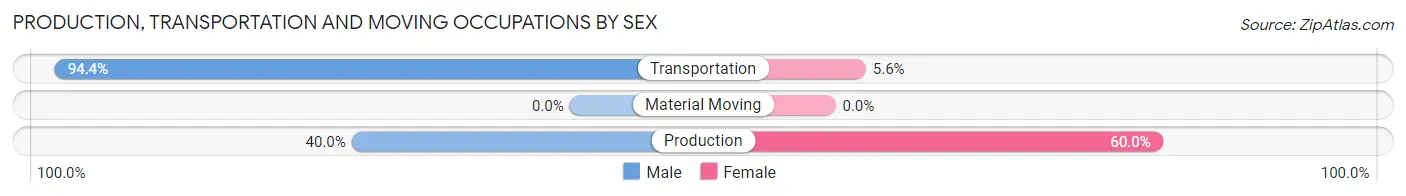
| Occupation | Male | Female |
| Production | 2 (40.0%) | 3 (60.0%) |
| Transportation | 17 (94.4%) | 1 (5.6%) |
| Material Moving | 0 (0.0%) | 0 (0.0%) |
| Total (Category) | 19 (82.6%) | 4 (17.4%) |
| Total (Overall) | 31 (52.5%) | 28 (47.5%) |
Employment Industries by Sex in Grandfalls
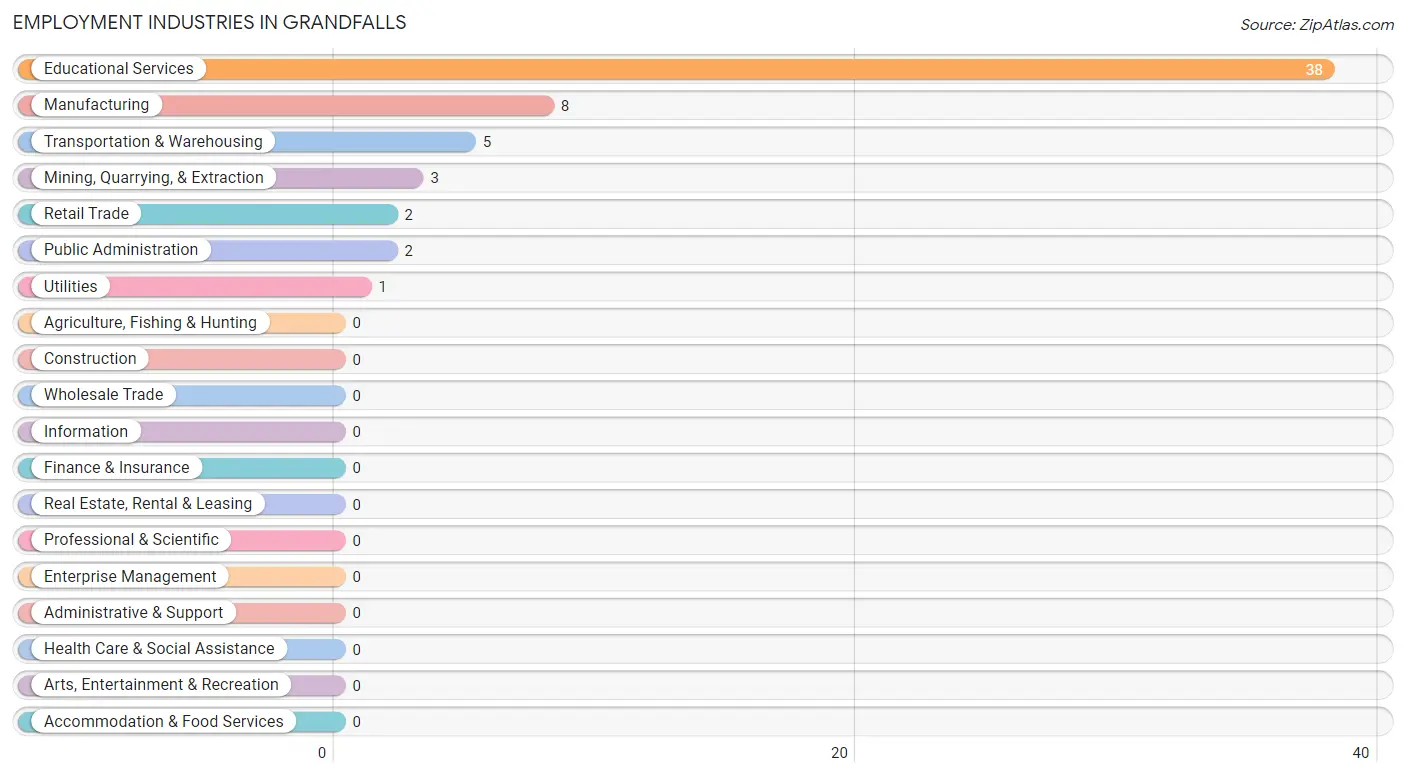
Employment Industries in Grandfalls
The major employment industries in Grandfalls include Educational Services (38 | 64.4%), Manufacturing (8 | 13.6%), Transportation & Warehousing (5 | 8.5%), Mining, Quarrying, & Extraction (3 | 5.1%), and Retail Trade (2 | 3.4%).
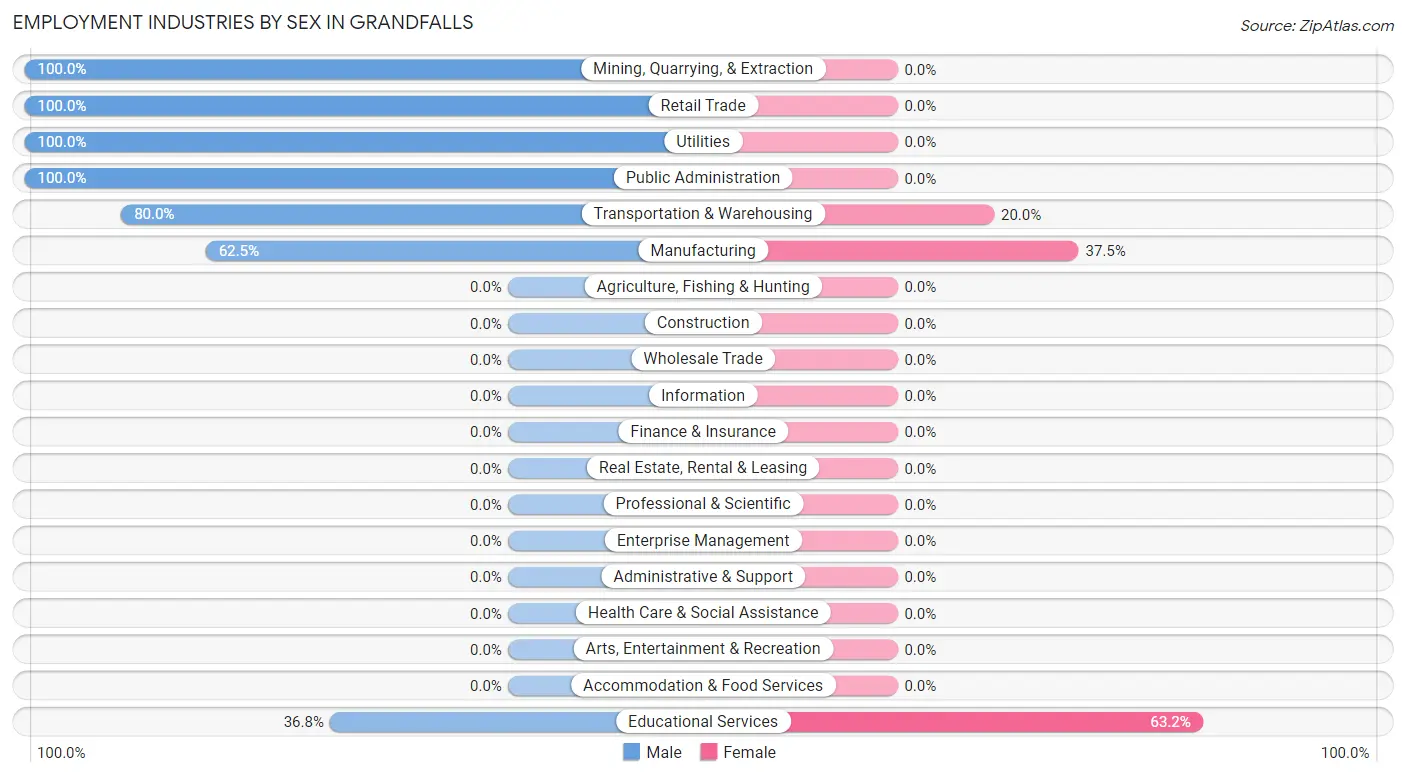
Employment Industries by Sex in Grandfalls
The Grandfalls industries that see more men than women are Mining, Quarrying, & Extraction (100.0%), Retail Trade (100.0%), and Utilities (100.0%), whereas the industries that tend to have a higher number of women are Educational Services (63.2%), Manufacturing (37.5%), and Transportation & Warehousing (20.0%).
| Industry | Male | Female |
| Agriculture, Fishing & Hunting | 0 (0.0%) | 0 (0.0%) |
| Mining, Quarrying, & Extraction | 3 (100.0%) | 0 (0.0%) |
| Construction | 0 (0.0%) | 0 (0.0%) |
| Manufacturing | 5 (62.5%) | 3 (37.5%) |
| Wholesale Trade | 0 (0.0%) | 0 (0.0%) |
| Retail Trade | 2 (100.0%) | 0 (0.0%) |
| Transportation & Warehousing | 4 (80.0%) | 1 (20.0%) |
| Utilities | 1 (100.0%) | 0 (0.0%) |
| Information | 0 (0.0%) | 0 (0.0%) |
| Finance & Insurance | 0 (0.0%) | 0 (0.0%) |
| Real Estate, Rental & Leasing | 0 (0.0%) | 0 (0.0%) |
| Professional & Scientific | 0 (0.0%) | 0 (0.0%) |
| Enterprise Management | 0 (0.0%) | 0 (0.0%) |
| Administrative & Support | 0 (0.0%) | 0 (0.0%) |
| Educational Services | 14 (36.8%) | 24 (63.2%) |
| Health Care & Social Assistance | 0 (0.0%) | 0 (0.0%) |
| Arts, Entertainment & Recreation | 0 (0.0%) | 0 (0.0%) |
| Accommodation & Food Services | 0 (0.0%) | 0 (0.0%) |
| Public Administration | 2 (100.0%) | 0 (0.0%) |
| Total | 31 (52.5%) | 28 (47.5%) |
Education in Grandfalls
School Enrollment in Grandfalls
The most common levels of schooling among the 74 students in Grandfalls are elementary school (21 | 28.4%), high school (20 | 27.0%), and middle school (12 | 16.2%).
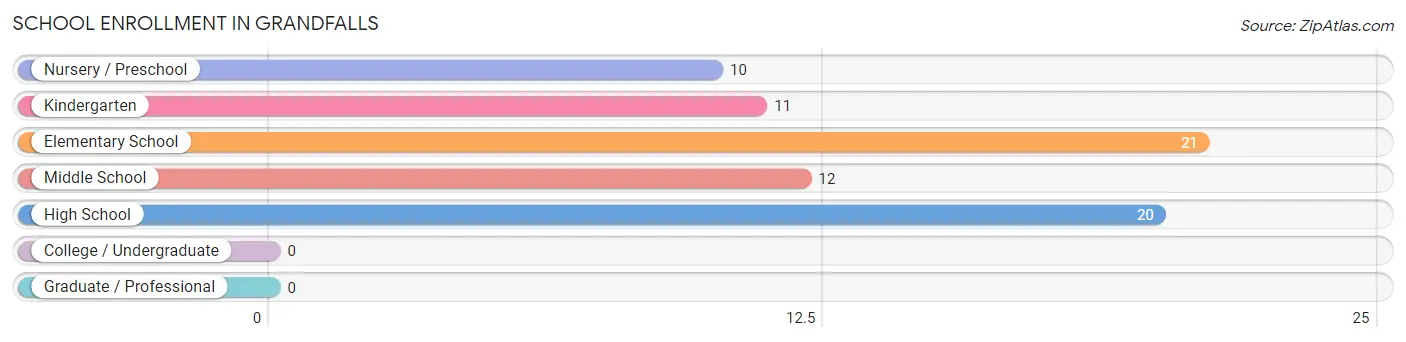
| School Level | # Students | % Students |
| Nursery / Preschool | 10 | 13.5% |
| Kindergarten | 11 | 14.9% |
| Elementary School | 21 | 28.4% |
| Middle School | 12 | 16.2% |
| High School | 20 | 27.0% |
| College / Undergraduate | 0 | 0.0% |
| Graduate / Professional | 0 | 0.0% |
| Total | 74 | 100.0% |
School Enrollment by Age by Funding Source in Grandfalls
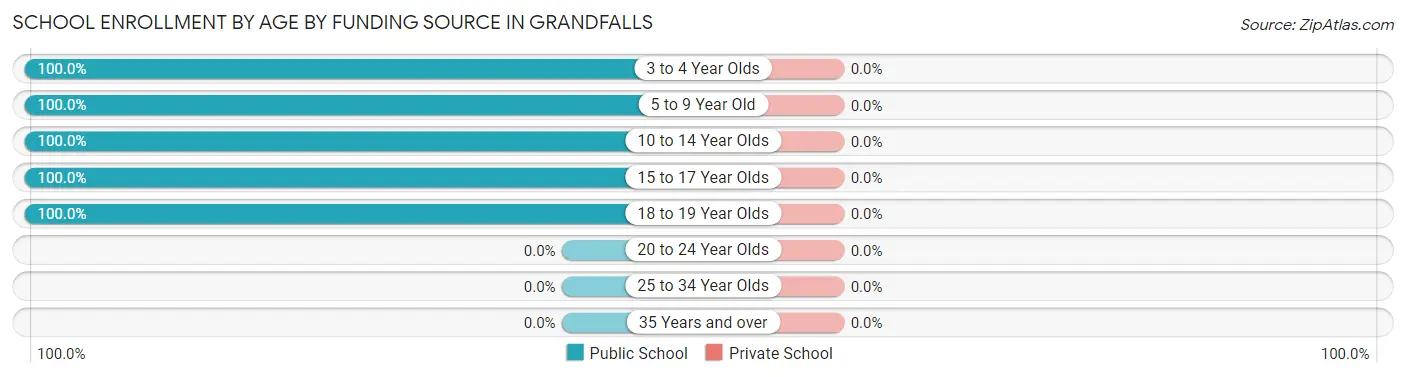
| Age Bracket | Public School | Private School |
| 3 to 4 Year Olds | 10 (100.0%) | 0 (0.0%) |
| 5 to 9 Year Old | 32 (100.0%) | 0 (0.0%) |
| 10 to 14 Year Olds | 12 (100.0%) | 0 (0.0%) |
| 15 to 17 Year Olds | 17 (100.0%) | 0 (0.0%) |
| 18 to 19 Year Olds | 3 (100.0%) | 0 (0.0%) |
| 20 to 24 Year Olds | 0 (0.0%) | 0 (0.0%) |
| 25 to 34 Year Olds | 0 (0.0%) | 0 (0.0%) |
| 35 Years and over | 0 (0.0%) | 0 (0.0%) |
| Total | 74 (100.0%) | 0 (0.0%) |
Educational Attainment by Field of Study in Grandfalls
Education (18 | 52.9%), business (9 | 26.5%), visual & performing arts (4 | 11.8%), and computers & mathematics (3 | 8.8%) are the most common fields of study among 34 individuals in Grandfalls who have obtained a bachelor's degree or higher.
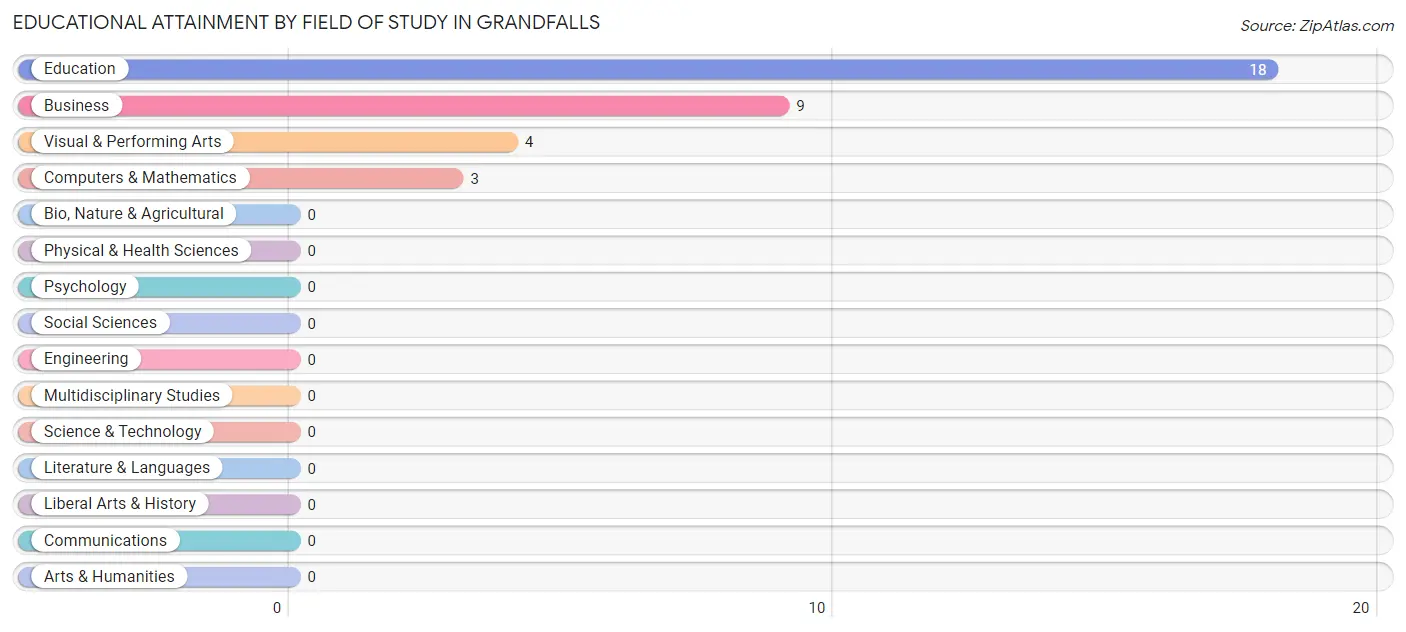
| Field of Study | # Graduates | % Graduates |
| Computers & Mathematics | 3 | 8.8% |
| Bio, Nature & Agricultural | 0 | 0.0% |
| Physical & Health Sciences | 0 | 0.0% |
| Psychology | 0 | 0.0% |
| Social Sciences | 0 | 0.0% |
| Engineering | 0 | 0.0% |
| Multidisciplinary Studies | 0 | 0.0% |
| Science & Technology | 0 | 0.0% |
| Business | 9 | 26.5% |
| Education | 18 | 52.9% |
| Literature & Languages | 0 | 0.0% |
| Liberal Arts & History | 0 | 0.0% |
| Visual & Performing Arts | 4 | 11.8% |
| Communications | 0 | 0.0% |
| Arts & Humanities | 0 | 0.0% |
| Total | 34 | 100.0% |
Transportation & Commute in Grandfalls
Vehicle Availability by Sex in Grandfalls
The most prevalent vehicle ownership categories in Grandfalls are males with 2 vehicles (22, accounting for 71.0%) and females with 2 vehicles (9, making up 78.6%).
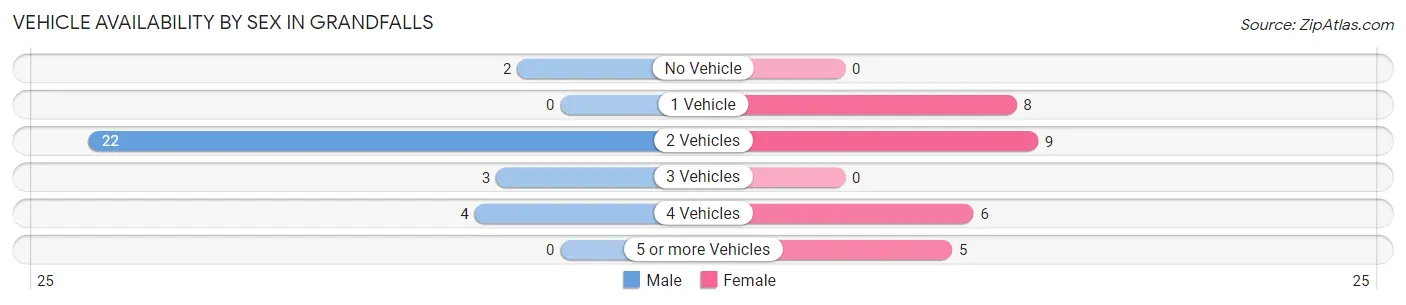
| Vehicles Available | Male | Female |
| No Vehicle | 2 (6.5%) | 0 (0.0%) |
| 1 Vehicle | 0 (0.0%) | 8 (28.6%) |
| 2 Vehicles | 22 (71.0%) | 9 (32.1%) |
| 3 Vehicles | 3 (9.7%) | 0 (0.0%) |
| 4 Vehicles | 4 (12.9%) | 6 (21.4%) |
| 5 or more Vehicles | 0 (0.0%) | 5 (17.9%) |
| Total | 31 (100.0%) | 28 (100.0%) |
Commute Time in Grandfalls
The most frequently occuring commute durations in Grandfalls are 5 to 9 minutes (29 commuters, 49.1%), 90 or more minutes (7 commuters, 11.9%), and 30 to 34 minutes (6 commuters, 10.2%).
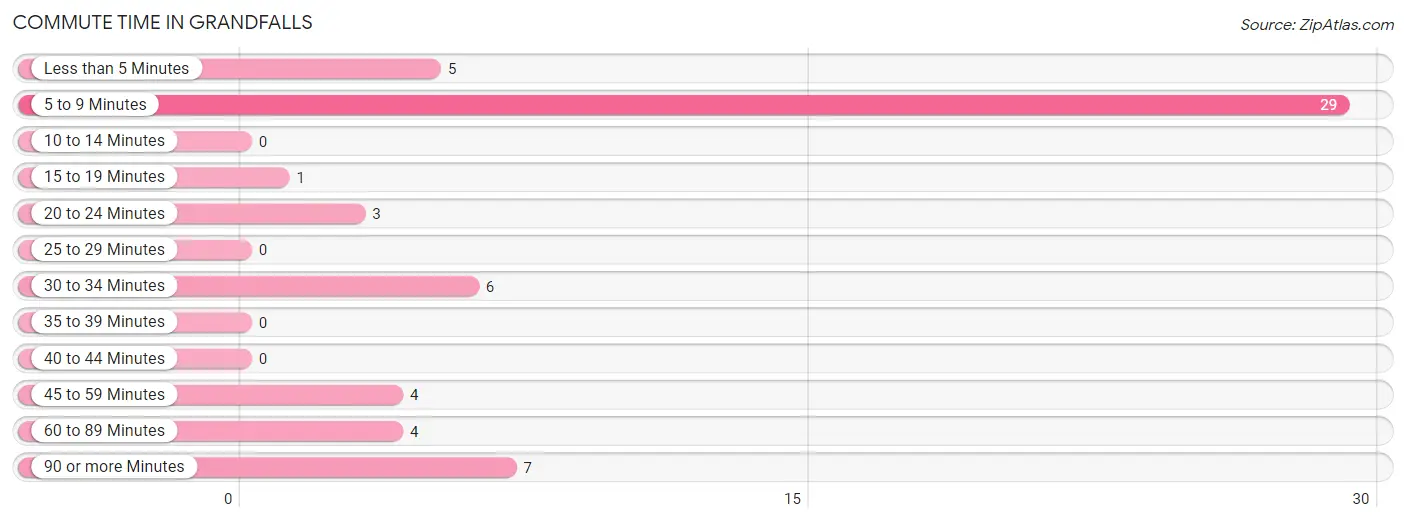
| Commute Time | # Commuters | % Commuters |
| Less than 5 Minutes | 5 | 8.5% |
| 5 to 9 Minutes | 29 | 49.1% |
| 10 to 14 Minutes | 0 | 0.0% |
| 15 to 19 Minutes | 1 | 1.7% |
| 20 to 24 Minutes | 3 | 5.1% |
| 25 to 29 Minutes | 0 | 0.0% |
| 30 to 34 Minutes | 6 | 10.2% |
| 35 to 39 Minutes | 0 | 0.0% |
| 40 to 44 Minutes | 0 | 0.0% |
| 45 to 59 Minutes | 4 | 6.8% |
| 60 to 89 Minutes | 4 | 6.8% |
| 90 or more Minutes | 7 | 11.9% |
Commute Time by Sex in Grandfalls
The most common commute times in Grandfalls are 5 to 9 minutes (10 commuters, 32.3%) for males and 5 to 9 minutes (19 commuters, 67.9%) for females.
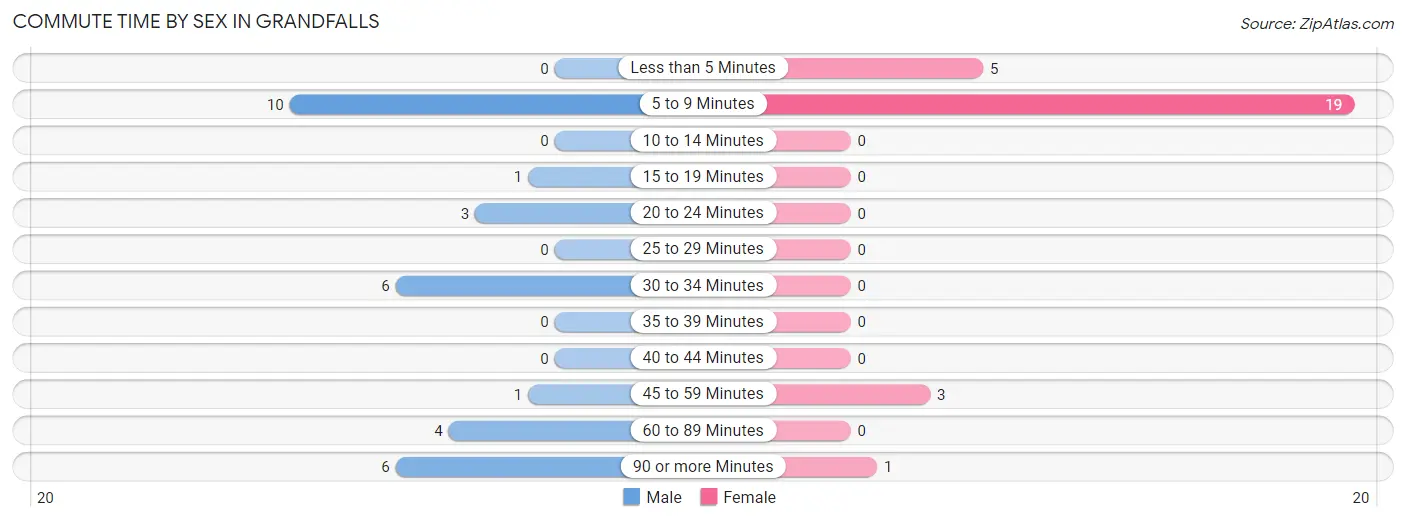
| Commute Time | Male | Female |
| Less than 5 Minutes | 0 (0.0%) | 5 (17.9%) |
| 5 to 9 Minutes | 10 (32.3%) | 19 (67.9%) |
| 10 to 14 Minutes | 0 (0.0%) | 0 (0.0%) |
| 15 to 19 Minutes | 1 (3.2%) | 0 (0.0%) |
| 20 to 24 Minutes | 3 (9.7%) | 0 (0.0%) |
| 25 to 29 Minutes | 0 (0.0%) | 0 (0.0%) |
| 30 to 34 Minutes | 6 (19.4%) | 0 (0.0%) |
| 35 to 39 Minutes | 0 (0.0%) | 0 (0.0%) |
| 40 to 44 Minutes | 0 (0.0%) | 0 (0.0%) |
| 45 to 59 Minutes | 1 (3.2%) | 3 (10.7%) |
| 60 to 89 Minutes | 4 (12.9%) | 0 (0.0%) |
| 90 or more Minutes | 6 (19.4%) | 1 (3.6%) |
Time of Departure to Work by Sex in Grandfalls
The most frequent times of departure to work in Grandfalls are 6:30 AM to 6:59 AM (10, 32.3%) for males and 7:30 AM to 7:59 AM (19, 67.9%) for females.
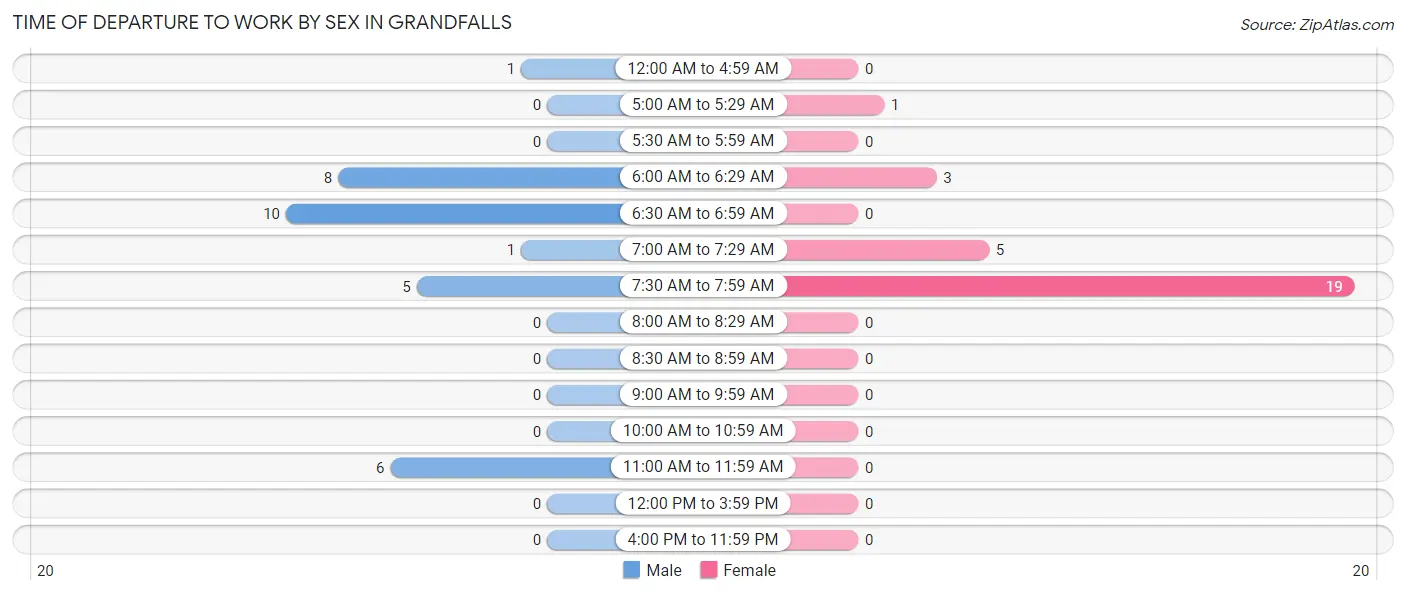
| Time of Departure | Male | Female |
| 12:00 AM to 4:59 AM | 1 (3.2%) | 0 (0.0%) |
| 5:00 AM to 5:29 AM | 0 (0.0%) | 1 (3.6%) |
| 5:30 AM to 5:59 AM | 0 (0.0%) | 0 (0.0%) |
| 6:00 AM to 6:29 AM | 8 (25.8%) | 3 (10.7%) |
| 6:30 AM to 6:59 AM | 10 (32.3%) | 0 (0.0%) |
| 7:00 AM to 7:29 AM | 1 (3.2%) | 5 (17.9%) |
| 7:30 AM to 7:59 AM | 5 (16.1%) | 19 (67.9%) |
| 8:00 AM to 8:29 AM | 0 (0.0%) | 0 (0.0%) |
| 8:30 AM to 8:59 AM | 0 (0.0%) | 0 (0.0%) |
| 9:00 AM to 9:59 AM | 0 (0.0%) | 0 (0.0%) |
| 10:00 AM to 10:59 AM | 0 (0.0%) | 0 (0.0%) |
| 11:00 AM to 11:59 AM | 6 (19.4%) | 0 (0.0%) |
| 12:00 PM to 3:59 PM | 0 (0.0%) | 0 (0.0%) |
| 4:00 PM to 11:59 PM | 0 (0.0%) | 0 (0.0%) |
| Total | 31 (100.0%) | 28 (100.0%) |
Housing Occupancy in Grandfalls
Occupancy by Ownership in Grandfalls
Of the total 88 dwellings in Grandfalls, owner-occupied units account for 68 (77.3%), while renter-occupied units make up 20 (22.7%).
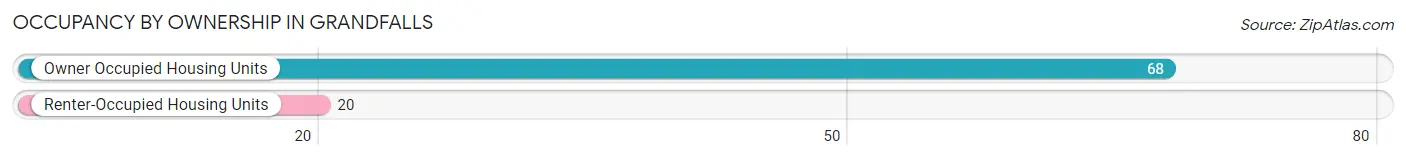
| Occupancy | # Housing Units | % Housing Units |
| Owner Occupied Housing Units | 68 | 77.3% |
| Renter-Occupied Housing Units | 20 | 22.7% |
| Total Occupied Housing Units | 88 | 100.0% |
Occupancy by Household Size in Grandfalls
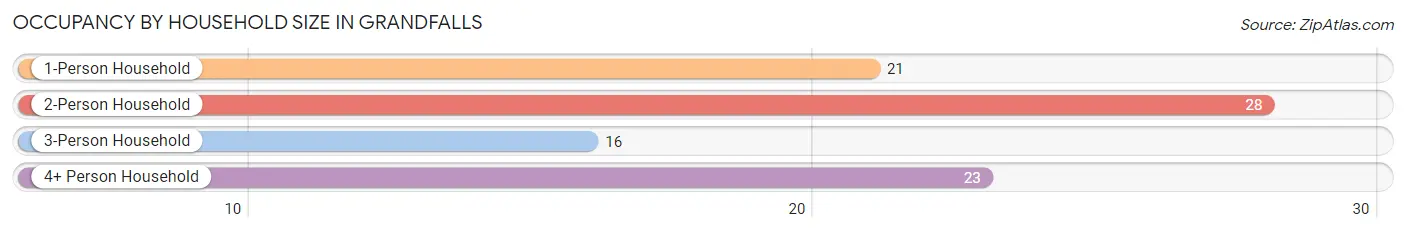
| Household Size | # Housing Units | % Housing Units |
| 1-Person Household | 21 | 23.9% |
| 2-Person Household | 28 | 31.8% |
| 3-Person Household | 16 | 18.2% |
| 4+ Person Household | 23 | 26.1% |
| Total Housing Units | 88 | 100.0% |
Occupancy by Ownership by Household Size in Grandfalls
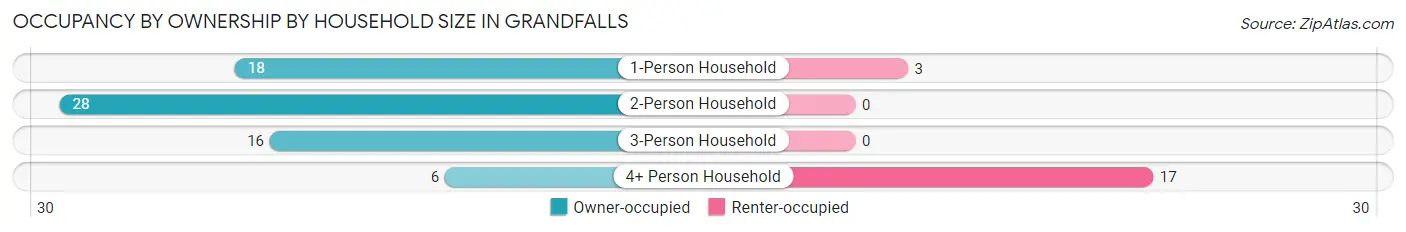
| Household Size | Owner-occupied | Renter-occupied |
| 1-Person Household | 18 (85.7%) | 3 (14.3%) |
| 2-Person Household | 28 (100.0%) | 0 (0.0%) |
| 3-Person Household | 16 (100.0%) | 0 (0.0%) |
| 4+ Person Household | 6 (26.1%) | 17 (73.9%) |
| Total Housing Units | 68 (77.3%) | 20 (22.7%) |
Occupancy by Educational Attainment in Grandfalls
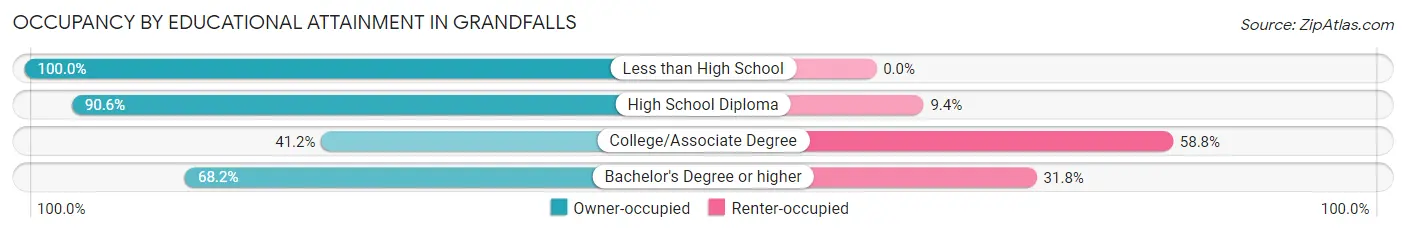
| Household Size | Owner-occupied | Renter-occupied |
| Less than High School | 17 (100.0%) | 0 (0.0%) |
| High School Diploma | 29 (90.6%) | 3 (9.4%) |
| College/Associate Degree | 7 (41.2%) | 10 (58.8%) |
| Bachelor's Degree or higher | 15 (68.2%) | 7 (31.8%) |
Occupancy by Age of Householder in Grandfalls
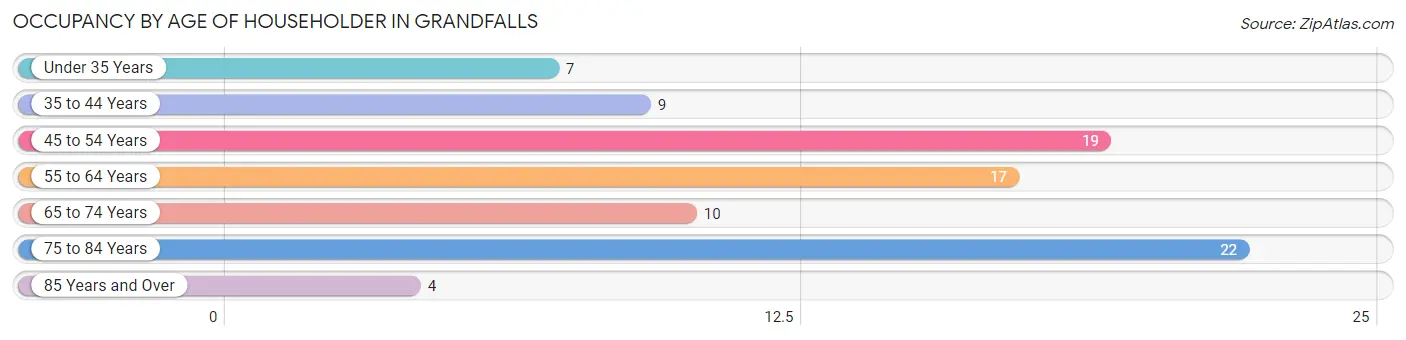
| Age Bracket | # Households | % Households |
| Under 35 Years | 7 | 8.0% |
| 35 to 44 Years | 9 | 10.2% |
| 45 to 54 Years | 19 | 21.6% |
| 55 to 64 Years | 17 | 19.3% |
| 65 to 74 Years | 10 | 11.4% |
| 75 to 84 Years | 22 | 25.0% |
| 85 Years and Over | 4 | 4.5% |
| Total | 88 | 100.0% |
Housing Finances in Grandfalls
Median Income by Occupancy in Grandfalls
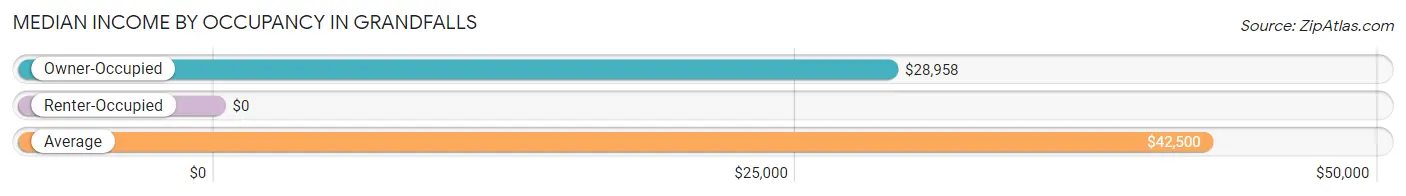
| Occupancy Type | # Households | Median Income |
| Owner-Occupied | 68 (77.3%) | $28,958 |
| Renter-Occupied | 20 (22.7%) | $0 |
| Average | 88 (100.0%) | $42,500 |
Occupancy by Householder Income Bracket in Grandfalls
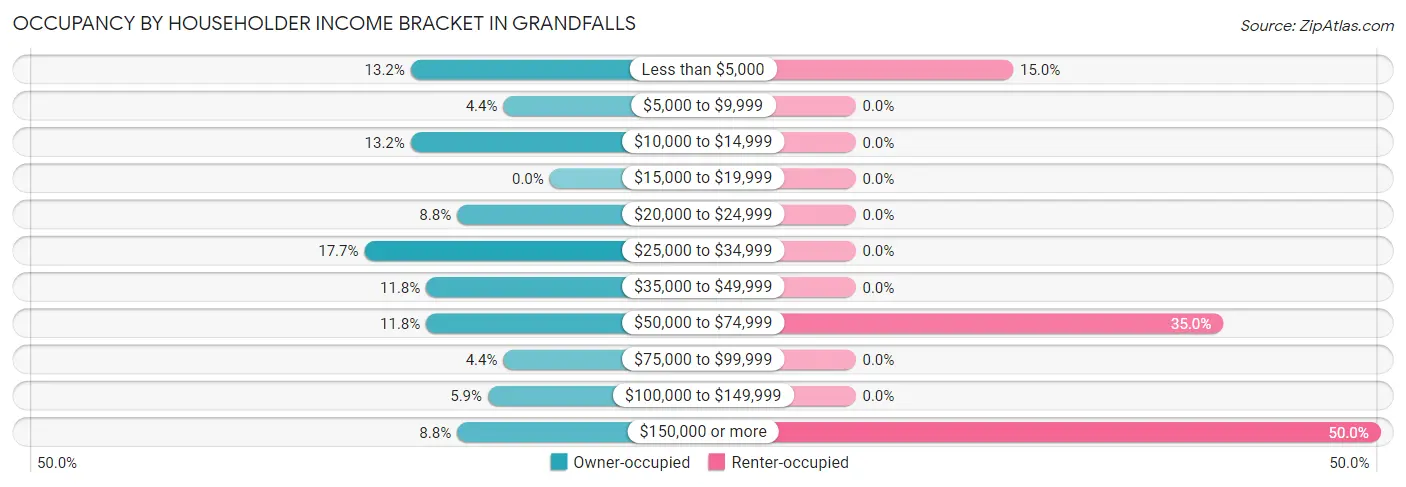
| Income Bracket | Owner-occupied | Renter-occupied |
| Less than $5,000 | 9 (13.2%) | 3 (15.0%) |
| $5,000 to $9,999 | 3 (4.4%) | 0 (0.0%) |
| $10,000 to $14,999 | 9 (13.2%) | 0 (0.0%) |
| $15,000 to $19,999 | 0 (0.0%) | 0 (0.0%) |
| $20,000 to $24,999 | 6 (8.8%) | 0 (0.0%) |
| $25,000 to $34,999 | 12 (17.6%) | 0 (0.0%) |
| $35,000 to $49,999 | 8 (11.8%) | 0 (0.0%) |
| $50,000 to $74,999 | 8 (11.8%) | 7 (35.0%) |
| $75,000 to $99,999 | 3 (4.4%) | 0 (0.0%) |
| $100,000 to $149,999 | 4 (5.9%) | 0 (0.0%) |
| $150,000 or more | 6 (8.8%) | 10 (50.0%) |
| Total | 68 (100.0%) | 20 (100.0%) |
Monthly Housing Cost Tiers in Grandfalls
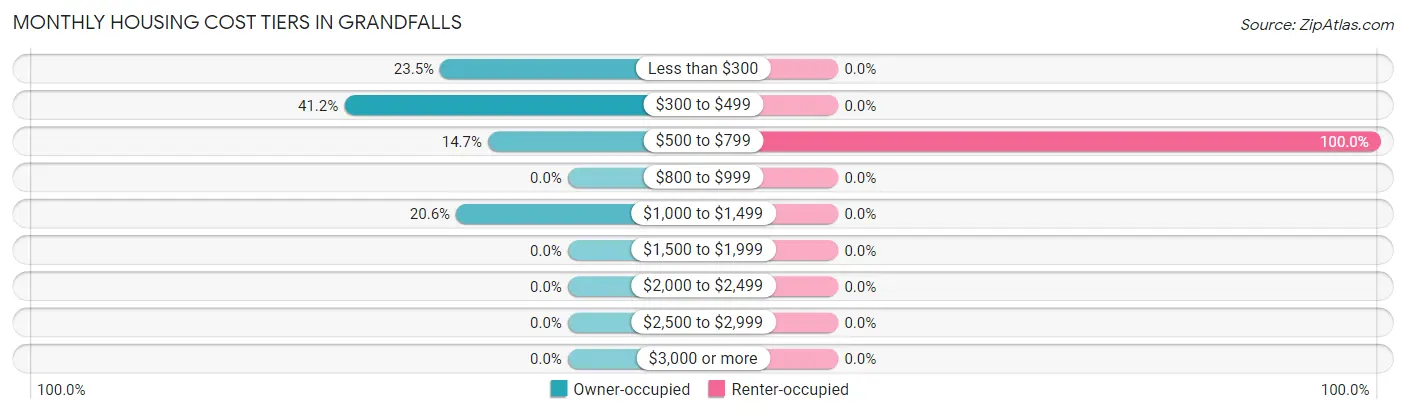
| Monthly Cost | Owner-occupied | Renter-occupied |
| Less than $300 | 16 (23.5%) | 0 (0.0%) |
| $300 to $499 | 28 (41.2%) | 0 (0.0%) |
| $500 to $799 | 10 (14.7%) | 20 (100.0%) |
| $800 to $999 | 0 (0.0%) | 0 (0.0%) |
| $1,000 to $1,499 | 14 (20.6%) | 0 (0.0%) |
| $1,500 to $1,999 | 0 (0.0%) | 0 (0.0%) |
| $2,000 to $2,499 | 0 (0.0%) | 0 (0.0%) |
| $2,500 to $2,999 | 0 (0.0%) | 0 (0.0%) |
| $3,000 or more | 0 (0.0%) | 0 (0.0%) |
| Total | 68 (100.0%) | 20 (100.0%) |
Physical Housing Characteristics in Grandfalls
Housing Structures in Grandfalls
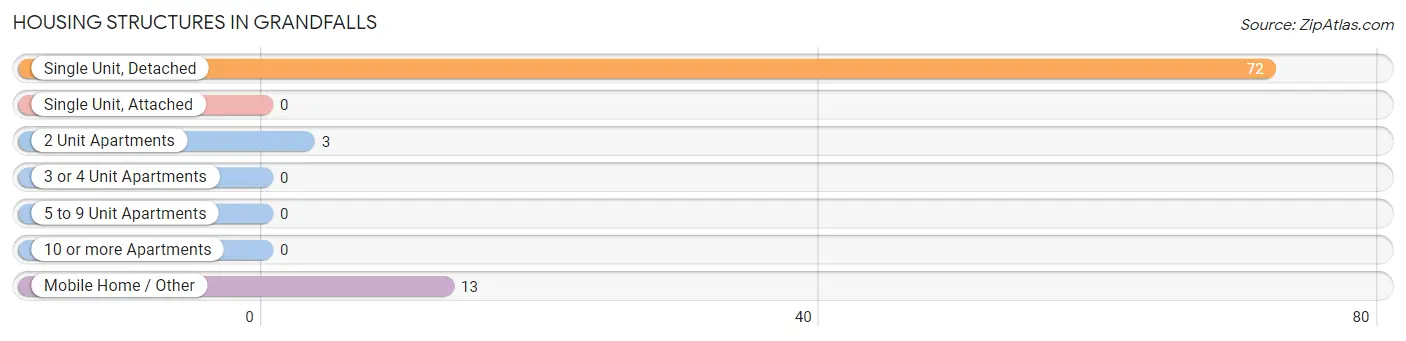
| Structure Type | # Housing Units | % Housing Units |
| Single Unit, Detached | 72 | 81.8% |
| Single Unit, Attached | 0 | 0.0% |
| 2 Unit Apartments | 3 | 3.4% |
| 3 or 4 Unit Apartments | 0 | 0.0% |
| 5 to 9 Unit Apartments | 0 | 0.0% |
| 10 or more Apartments | 0 | 0.0% |
| Mobile Home / Other | 13 | 14.8% |
| Total | 88 | 100.0% |
Housing Structures by Occupancy in Grandfalls
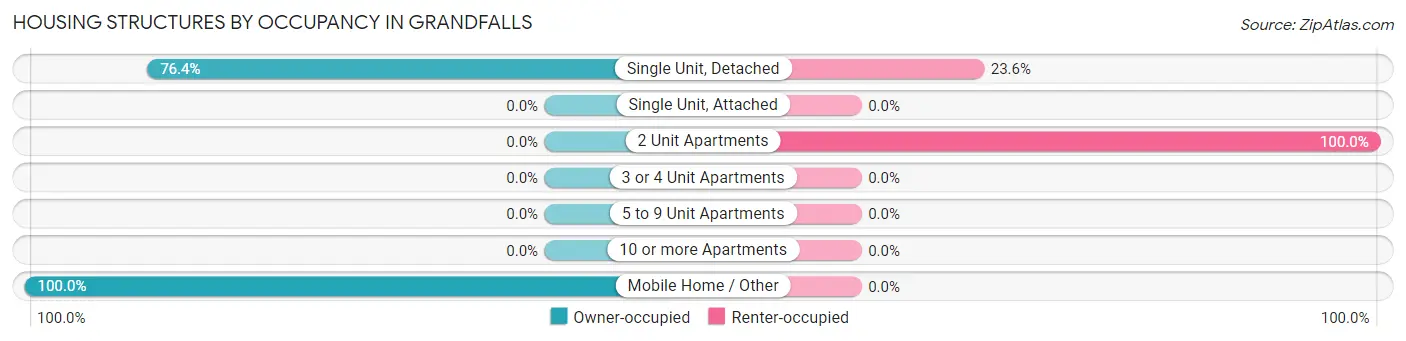
| Structure Type | Owner-occupied | Renter-occupied |
| Single Unit, Detached | 55 (76.4%) | 17 (23.6%) |
| Single Unit, Attached | 0 (0.0%) | 0 (0.0%) |
| 2 Unit Apartments | 0 (0.0%) | 3 (100.0%) |
| 3 or 4 Unit Apartments | 0 (0.0%) | 0 (0.0%) |
| 5 to 9 Unit Apartments | 0 (0.0%) | 0 (0.0%) |
| 10 or more Apartments | 0 (0.0%) | 0 (0.0%) |
| Mobile Home / Other | 13 (100.0%) | 0 (0.0%) |
| Total | 68 (77.3%) | 20 (22.7%) |
Housing Structures by Number of Rooms in Grandfalls
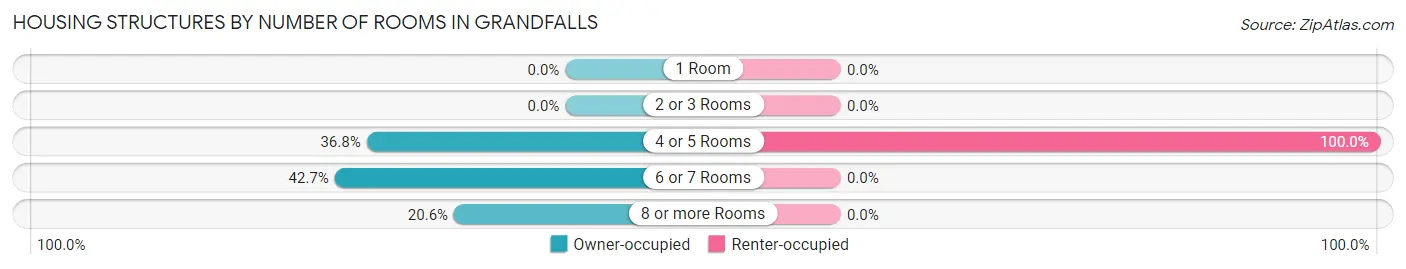
| Number of Rooms | Owner-occupied | Renter-occupied |
| 1 Room | 0 (0.0%) | 0 (0.0%) |
| 2 or 3 Rooms | 0 (0.0%) | 0 (0.0%) |
| 4 or 5 Rooms | 25 (36.8%) | 20 (100.0%) |
| 6 or 7 Rooms | 29 (42.6%) | 0 (0.0%) |
| 8 or more Rooms | 14 (20.6%) | 0 (0.0%) |
| Total | 68 (100.0%) | 20 (100.0%) |
Housing Structure by Heating Type in Grandfalls
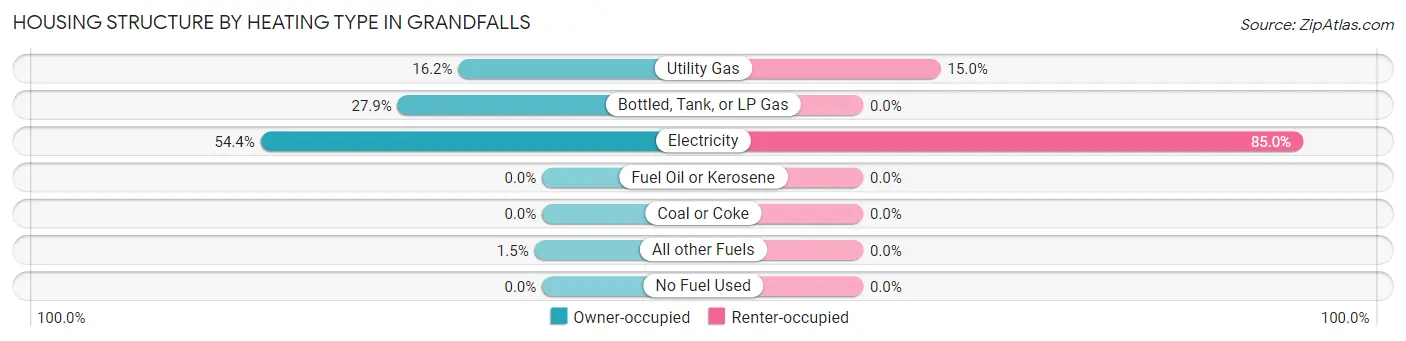
| Heating Type | Owner-occupied | Renter-occupied |
| Utility Gas | 11 (16.2%) | 3 (15.0%) |
| Bottled, Tank, or LP Gas | 19 (27.9%) | 0 (0.0%) |
| Electricity | 37 (54.4%) | 17 (85.0%) |
| Fuel Oil or Kerosene | 0 (0.0%) | 0 (0.0%) |
| Coal or Coke | 0 (0.0%) | 0 (0.0%) |
| All other Fuels | 1 (1.5%) | 0 (0.0%) |
| No Fuel Used | 0 (0.0%) | 0 (0.0%) |
| Total | 68 (100.0%) | 20 (100.0%) |
Household Vehicle Usage in Grandfalls
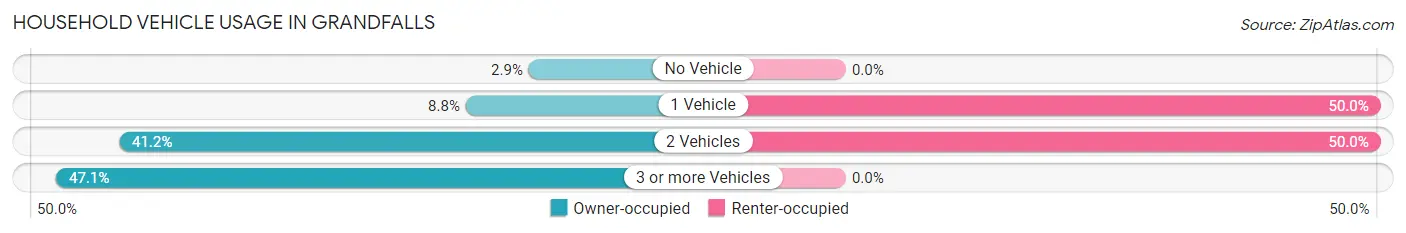
| Vehicles per Household | Owner-occupied | Renter-occupied |
| No Vehicle | 2 (2.9%) | 0 (0.0%) |
| 1 Vehicle | 6 (8.8%) | 10 (50.0%) |
| 2 Vehicles | 28 (41.2%) | 10 (50.0%) |
| 3 or more Vehicles | 32 (47.1%) | 0 (0.0%) |
| Total | 68 (100.0%) | 20 (100.0%) |
Real Estate & Mortgages in Grandfalls
Real Estate and Mortgage Overview in Grandfalls
| Characteristic | Without Mortgage | With Mortgage |
| Housing Units | 61 | 7 |
| Median Property Value | - | - |
| Median Household Income | $29,063 | $0 |
| Monthly Housing Costs | $358 | $0 |
| Real Estate Taxes | $375 | $0 |
Property Value by Mortgage Status in Grandfalls
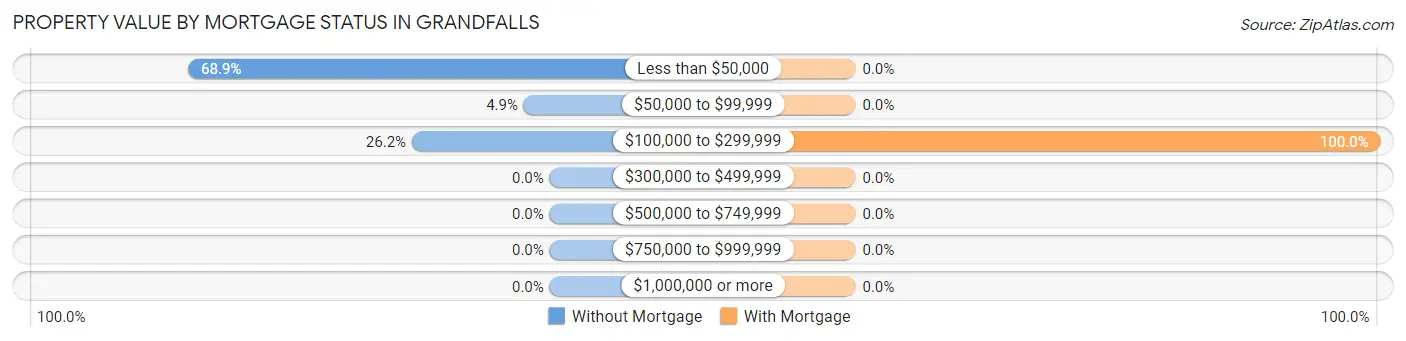
| Property Value | Without Mortgage | With Mortgage |
| Less than $50,000 | 42 (68.9%) | 0 (0.0%) |
| $50,000 to $99,999 | 3 (4.9%) | 0 (0.0%) |
| $100,000 to $299,999 | 16 (26.2%) | 7 (100.0%) |
| $300,000 to $499,999 | 0 (0.0%) | 0 (0.0%) |
| $500,000 to $749,999 | 0 (0.0%) | 0 (0.0%) |
| $750,000 to $999,999 | 0 (0.0%) | 0 (0.0%) |
| $1,000,000 or more | 0 (0.0%) | 0 (0.0%) |
| Total | 61 (100.0%) | 7 (100.0%) |
Household Income by Mortgage Status in Grandfalls
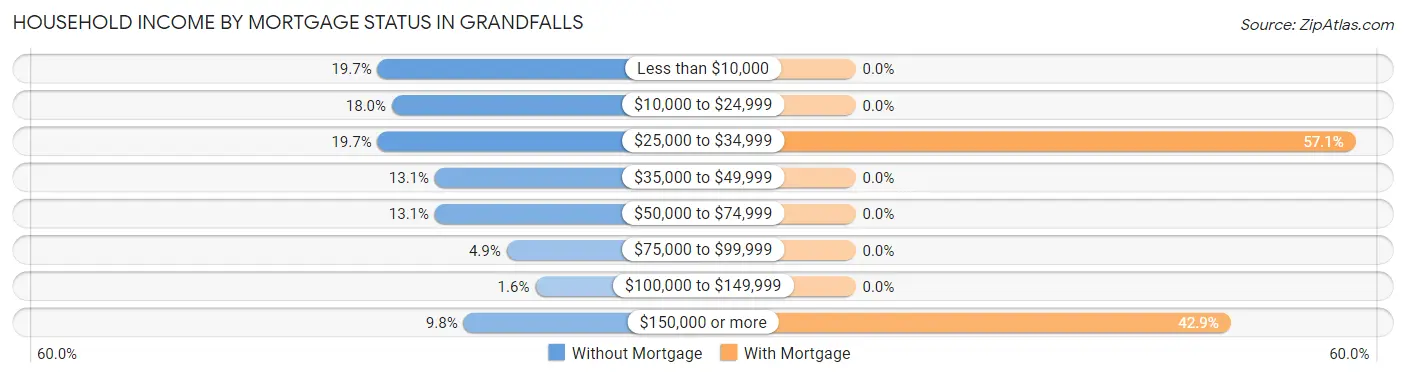
| Household Income | Without Mortgage | With Mortgage |
| Less than $10,000 | 12 (19.7%) | 0 (0.0%) |
| $10,000 to $24,999 | 11 (18.0%) | 0 (0.0%) |
| $25,000 to $34,999 | 12 (19.7%) | 4 (57.1%) |
| $35,000 to $49,999 | 8 (13.1%) | 0 (0.0%) |
| $50,000 to $74,999 | 8 (13.1%) | 0 (0.0%) |
| $75,000 to $99,999 | 3 (4.9%) | 0 (0.0%) |
| $100,000 to $149,999 | 1 (1.6%) | 0 (0.0%) |
| $150,000 or more | 6 (9.8%) | 3 (42.9%) |
| Total | 61 (100.0%) | 7 (100.0%) |
Property Value to Household Income Ratio in Grandfalls
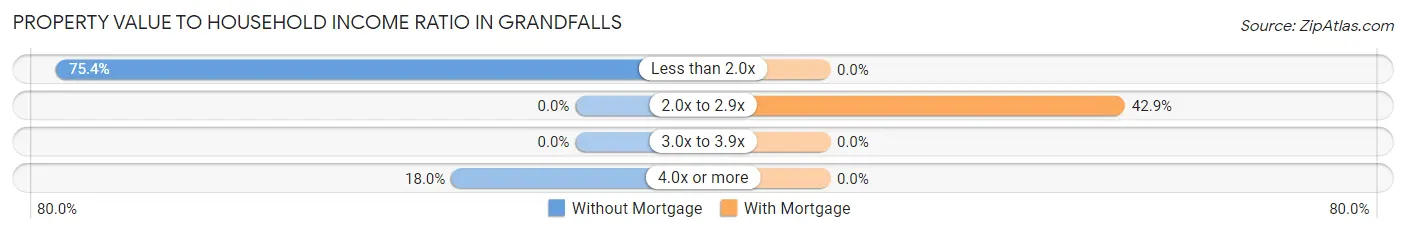
| Value-to-Income Ratio | Without Mortgage | With Mortgage |
| Less than 2.0x | 46 (75.4%) | 0 (0.0%) |
| 2.0x to 2.9x | 0 (0.0%) | 3 (42.9%) |
| 3.0x to 3.9x | 0 (0.0%) | 0 (0.0%) |
| 4.0x or more | 11 (18.0%) | 0 (0.0%) |
| Total | 61 (100.0%) | 7 (100.0%) |
Real Estate Taxes by Mortgage Status in Grandfalls
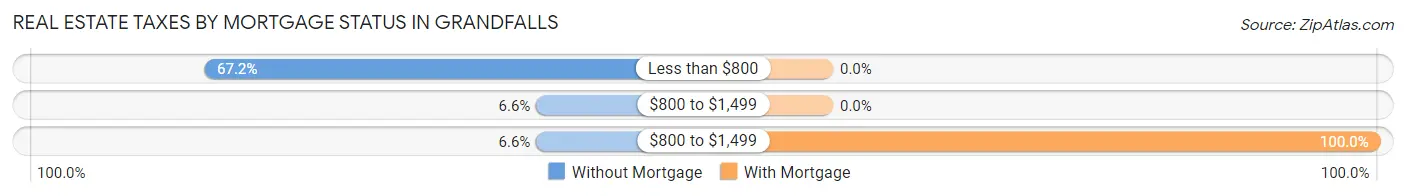
| Property Taxes | Without Mortgage | With Mortgage |
| Less than $800 | 41 (67.2%) | 0 (0.0%) |
| $800 to $1,499 | 4 (6.6%) | 0 (0.0%) |
| $800 to $1,499 | 4 (6.6%) | 7 (100.0%) |
| Total | 61 (100.0%) | 7 (100.0%) |
Health & Disability in Grandfalls
Health Insurance Coverage by Age in Grandfalls
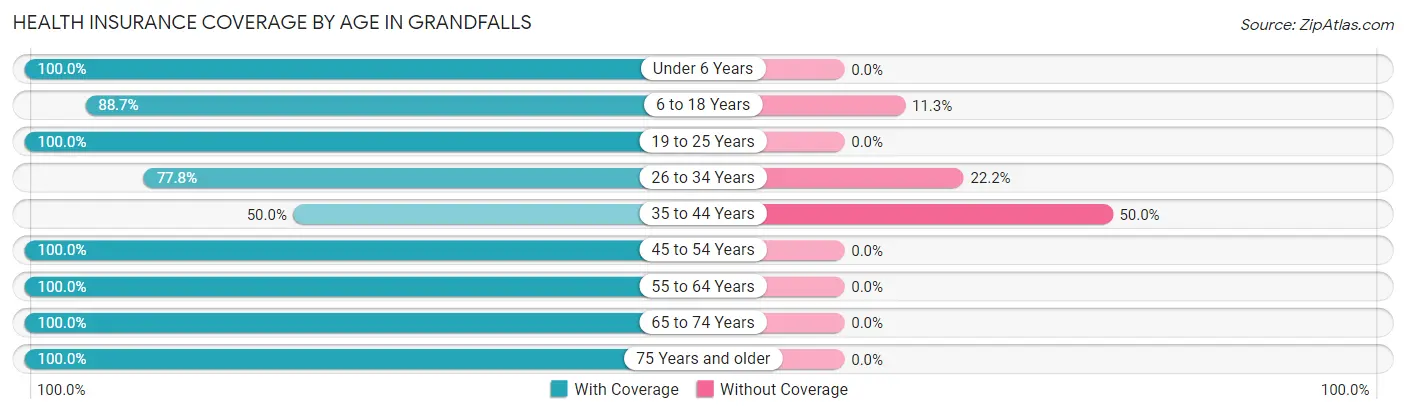
| Age Bracket | With Coverage | Without Coverage |
| Under 6 Years | 38 (100.0%) | 0 (0.0%) |
| 6 to 18 Years | 47 (88.7%) | 6 (11.3%) |
| 19 to 25 Years | 4 (100.0%) | 0 (0.0%) |
| 26 to 34 Years | 7 (77.8%) | 2 (22.2%) |
| 35 to 44 Years | 9 (50.0%) | 9 (50.0%) |
| 45 to 54 Years | 26 (100.0%) | 0 (0.0%) |
| 55 to 64 Years | 38 (100.0%) | 0 (0.0%) |
| 65 to 74 Years | 10 (100.0%) | 0 (0.0%) |
| 75 Years and older | 34 (100.0%) | 0 (0.0%) |
| Total | 213 (92.6%) | 17 (7.4%) |
Health Insurance Coverage by Citizenship Status in Grandfalls
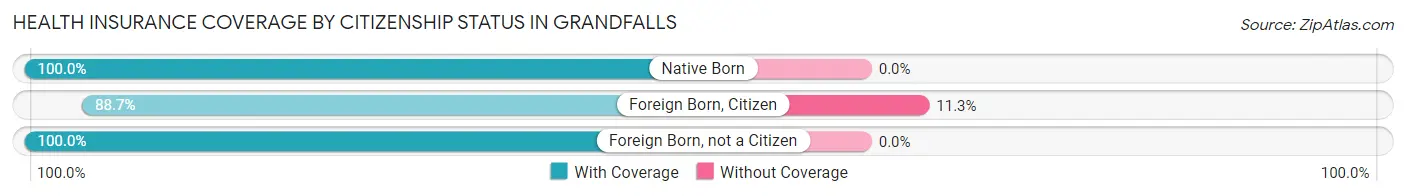
| Citizenship Status | With Coverage | Without Coverage |
| Native Born | 38 (100.0%) | 0 (0.0%) |
| Foreign Born, Citizen | 47 (88.7%) | 6 (11.3%) |
| Foreign Born, not a Citizen | 4 (100.0%) | 0 (0.0%) |
Health Insurance Coverage by Household Income in Grandfalls
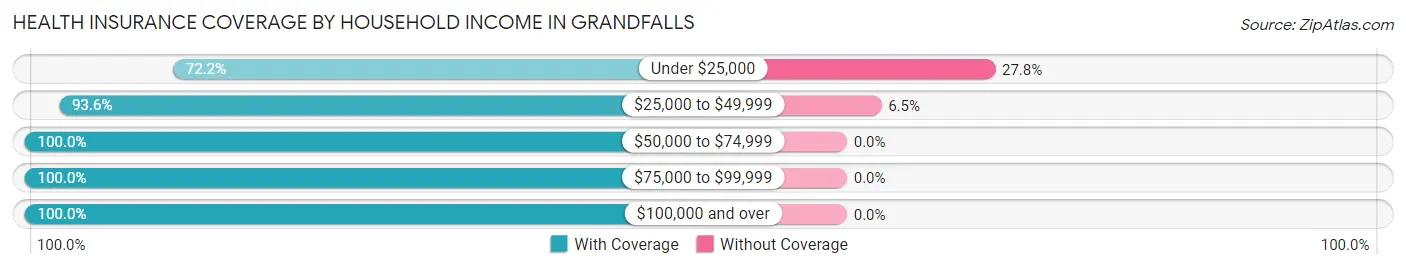
| Household Income | With Coverage | Without Coverage |
| Under $25,000 | 39 (72.2%) | 15 (27.8%) |
| $25,000 to $49,999 | 29 (93.5%) | 2 (6.5%) |
| $50,000 to $74,999 | 43 (100.0%) | 0 (0.0%) |
| $75,000 to $99,999 | 10 (100.0%) | 0 (0.0%) |
| $100,000 and over | 92 (100.0%) | 0 (0.0%) |
Public vs Private Health Insurance Coverage by Age in Grandfalls
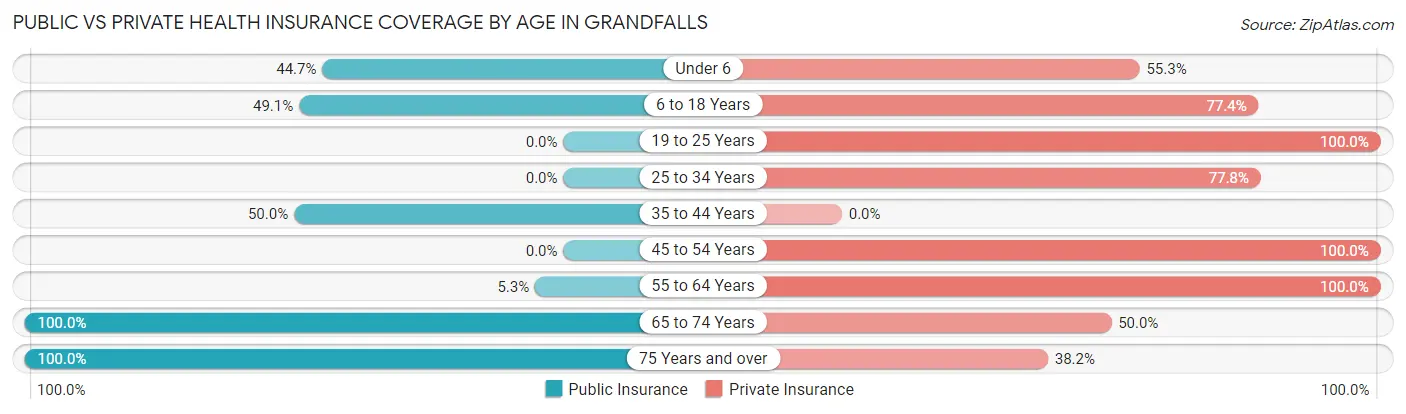
| Age Bracket | Public Insurance | Private Insurance |
| Under 6 | 17 (44.7%) | 21 (55.3%) |
| 6 to 18 Years | 26 (49.1%) | 41 (77.4%) |
| 19 to 25 Years | 0 (0.0%) | 4 (100.0%) |
| 25 to 34 Years | 0 (0.0%) | 7 (77.8%) |
| 35 to 44 Years | 9 (50.0%) | 0 (0.0%) |
| 45 to 54 Years | 0 (0.0%) | 26 (100.0%) |
| 55 to 64 Years | 2 (5.3%) | 38 (100.0%) |
| 65 to 74 Years | 10 (100.0%) | 5 (50.0%) |
| 75 Years and over | 34 (100.0%) | 13 (38.2%) |
| Total | 98 (42.6%) | 155 (67.4%) |
Disability Status by Sex by Age in Grandfalls
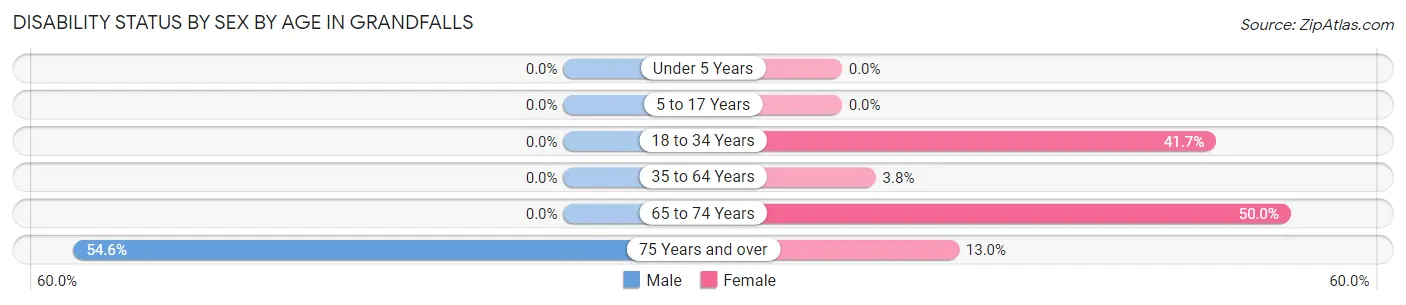
| Age Bracket | Male | Female |
| Under 5 Years | 0 (0.0%) | 0 (0.0%) |
| 5 to 17 Years | 0 (0.0%) | 0 (0.0%) |
| 18 to 34 Years | 0 (0.0%) | 5 (41.7%) |
| 35 to 64 Years | 0 (0.0%) | 2 (3.8%) |
| 65 to 74 Years | 0 (0.0%) | 5 (50.0%) |
| 75 Years and over | 6 (54.5%) | 3 (13.0%) |
Disability Class by Sex by Age in Grandfalls
Disability Class: Hearing Difficulty
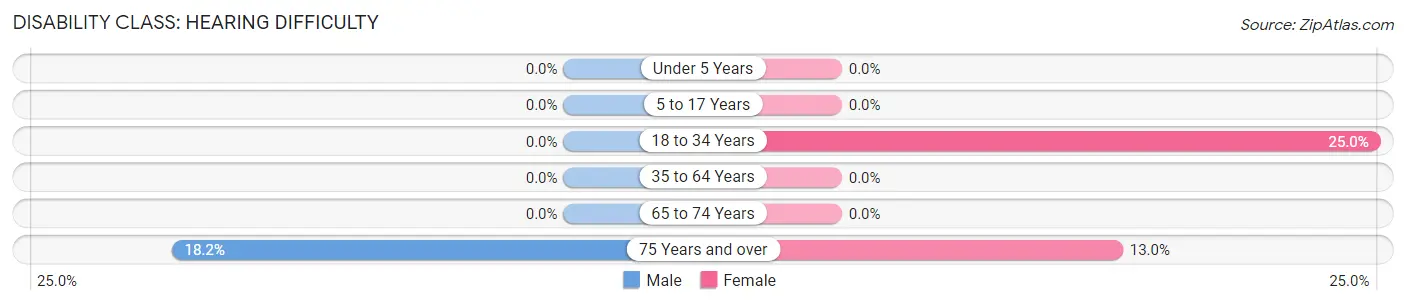
| Age Bracket | Male | Female |
| Under 5 Years | 0 (0.0%) | 0 (0.0%) |
| 5 to 17 Years | 0 (0.0%) | 0 (0.0%) |
| 18 to 34 Years | 0 (0.0%) | 3 (25.0%) |
| 35 to 64 Years | 0 (0.0%) | 0 (0.0%) |
| 65 to 74 Years | 0 (0.0%) | 0 (0.0%) |
| 75 Years and over | 2 (18.2%) | 3 (13.0%) |
Disability Class: Vision Difficulty
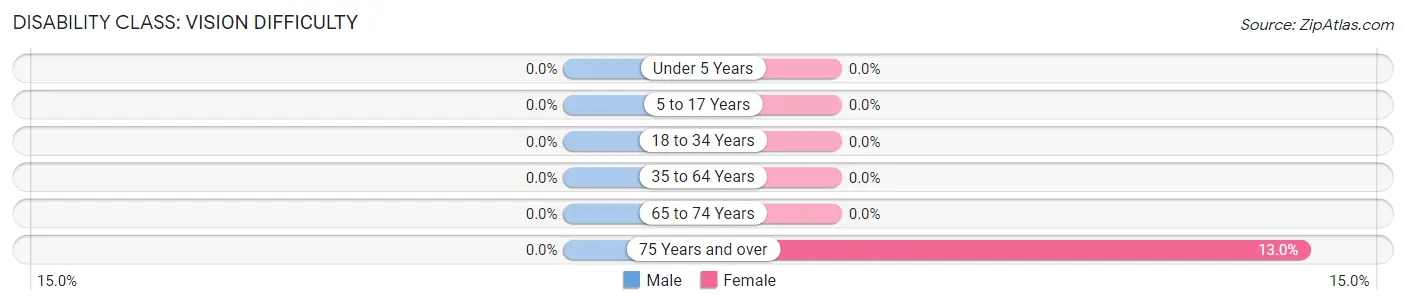
| Age Bracket | Male | Female |
| Under 5 Years | 0 (0.0%) | 0 (0.0%) |
| 5 to 17 Years | 0 (0.0%) | 0 (0.0%) |
| 18 to 34 Years | 0 (0.0%) | 0 (0.0%) |
| 35 to 64 Years | 0 (0.0%) | 0 (0.0%) |
| 65 to 74 Years | 0 (0.0%) | 0 (0.0%) |
| 75 Years and over | 0 (0.0%) | 3 (13.0%) |
Disability Class: Cognitive Difficulty
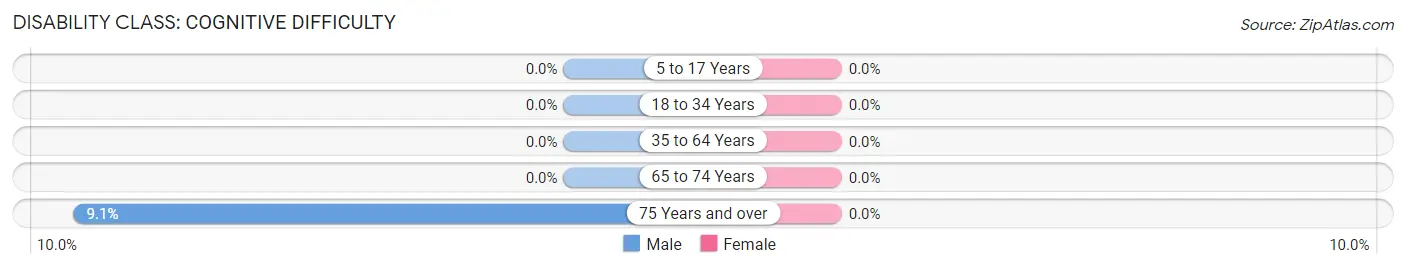
| Age Bracket | Male | Female |
| 5 to 17 Years | 0 (0.0%) | 0 (0.0%) |
| 18 to 34 Years | 0 (0.0%) | 0 (0.0%) |
| 35 to 64 Years | 0 (0.0%) | 0 (0.0%) |
| 65 to 74 Years | 0 (0.0%) | 0 (0.0%) |
| 75 Years and over | 1 (9.1%) | 0 (0.0%) |
Disability Class: Ambulatory Difficulty
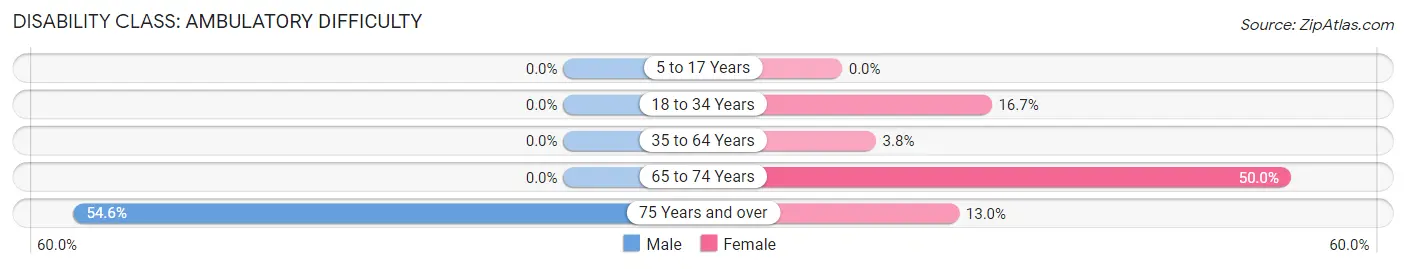
| Age Bracket | Male | Female |
| 5 to 17 Years | 0 (0.0%) | 0 (0.0%) |
| 18 to 34 Years | 0 (0.0%) | 2 (16.7%) |
| 35 to 64 Years | 0 (0.0%) | 2 (3.8%) |
| 65 to 74 Years | 0 (0.0%) | 5 (50.0%) |
| 75 Years and over | 6 (54.5%) | 3 (13.0%) |
Disability Class: Self-Care Difficulty
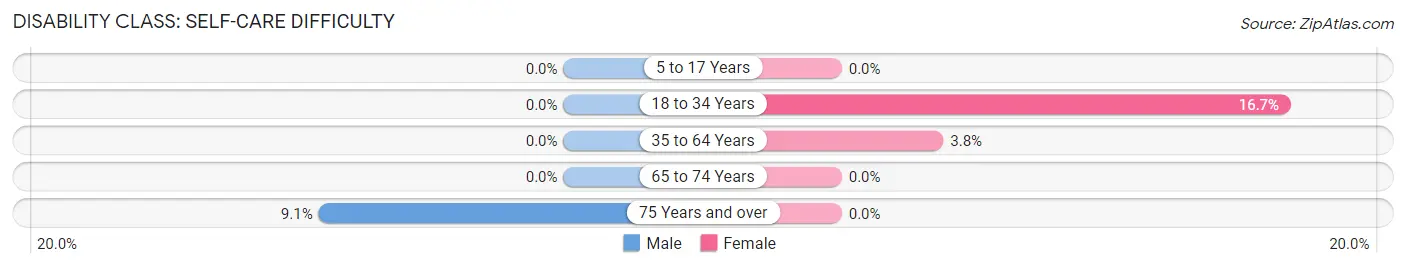
| Age Bracket | Male | Female |
| 5 to 17 Years | 0 (0.0%) | 0 (0.0%) |
| 18 to 34 Years | 0 (0.0%) | 2 (16.7%) |
| 35 to 64 Years | 0 (0.0%) | 2 (3.8%) |
| 65 to 74 Years | 0 (0.0%) | 0 (0.0%) |
| 75 Years and over | 1 (9.1%) | 0 (0.0%) |
Technology Access in Grandfalls
Computing Device Access in Grandfalls
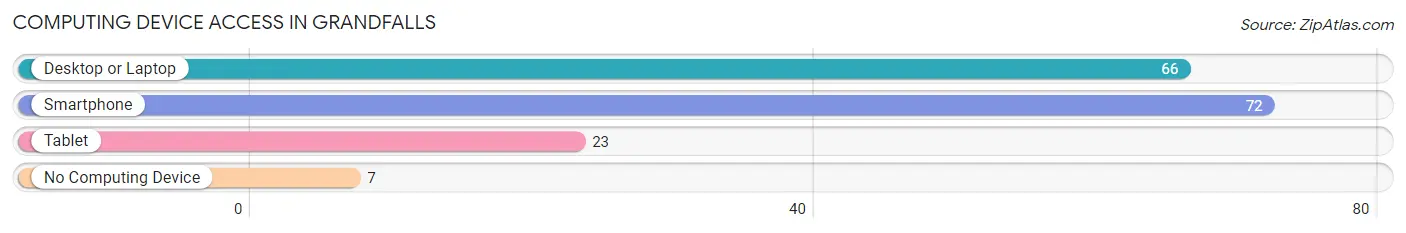
| Device Type | # Households | % Households |
| Desktop or Laptop | 66 | 75.0% |
| Smartphone | 72 | 81.8% |
| Tablet | 23 | 26.1% |
| No Computing Device | 7 | 8.0% |
| Total | 88 | 100.0% |
Internet Access in Grandfalls
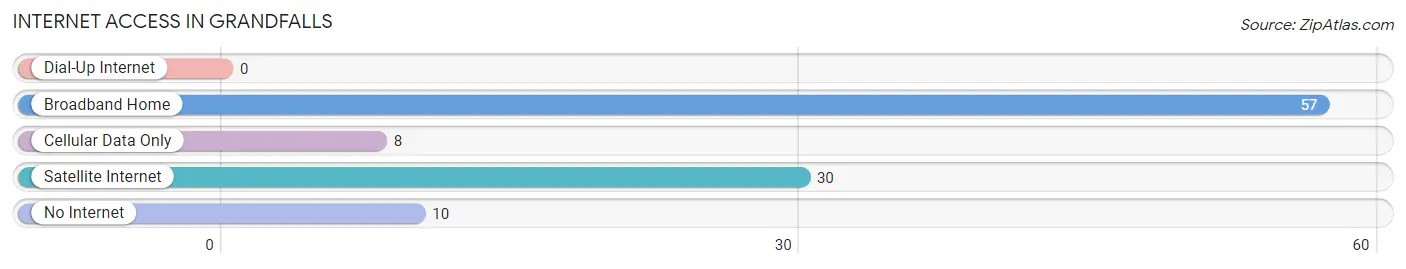
| Internet Type | # Households | % Households |
| Dial-Up Internet | 0 | 0.0% |
| Broadband Home | 57 | 64.8% |
| Cellular Data Only | 8 | 9.1% |
| Satellite Internet | 30 | 34.1% |
| No Internet | 10 | 11.4% |
| Total | 88 | 100.0% |
Grandfalls Summary
History
Grandfalls, Texas is a small town located in western Texas, about 30 miles east of the New Mexico border. It is part of the Midland-Odessa metropolitan area and is the county seat of Ward County. The town was founded in 1891 by the Texas and Pacific Railway Company and was named after a nearby waterfall.
Grandfalls was originally a farming and ranching community, but the discovery of oil in the area in the early 1900s changed the town’s fortunes. The town quickly became a boomtown, with the population growing from just over 500 in 1910 to over 3,000 by 1920. The oil industry continued to be the mainstay of the local economy for the next several decades, and the town’s population peaked at over 5,000 in the 1950s.
In the late 1960s, the oil industry began to decline, and the population of Grandfalls began to decline as well. By the 1980s, the population had dropped to just over 2,000. In recent years, the town has seen a resurgence in population, with the population now estimated to be around 3,000.
Geography
Grandfalls is located in western Texas, about 30 miles east of the New Mexico border. It is part of the Midland-Odessa metropolitan area and is the county seat of Ward County. The town is situated on the banks of the Pecos River, and is surrounded by rolling hills and prairies. The climate is semi-arid, with hot summers and mild winters.
Economy
The economy of Grandfalls is largely based on oil and gas production. The town is home to several oil and gas companies, including Apache Corporation, Chevron, and ConocoPhillips. In addition to oil and gas, the town is also home to several manufacturing companies, including a plastics plant and a metal fabrication plant.
The town is also home to several retail stores, restaurants, and other businesses. The town is served by the Grandfalls-Royalty Independent School District, which serves students from kindergarten through 12th grade.
Demographics
As of the 2010 census, the population of Grandfalls was 3,072. The racial makeup of the town was 79.3% White, 0.7% African American, 0.3% Native American, 0.2% Asian, 0.1% Pacific Islander, 17.7% from other races, and 1.9% from two or more races. Hispanic or Latino of any race were 33.2% of the population.
The median income for a household in Grandfalls was $31,250, and the median income for a family was $37,500. The per capita income for the town was $17,845. About 18.2% of families and 22.2% of the population were below the poverty line, including 28.3% of those under age 18 and 15.2% of those age 65 or over.
Common Questions
What is Per Capita Income in Grandfalls?
Per Capita income in Grandfalls is $20,216.
What is the Median Family Income in Grandfalls?
Median Family Income in Grandfalls is $49,688.
What is the Median Household income in Grandfalls?
Median Household Income in Grandfalls is $42,500.
What is Income or Wage Gap in Grandfalls?
Income or Wage Gap in Grandfalls is 13.5%.
Women in Grandfalls earn 86.5 cents for every dollar earned by a man.
What is Inequality or Gini Index in Grandfalls?
Inequality or Gini Index in Grandfalls is 0.53.
What is the Total Population of Grandfalls?
Total Population of Grandfalls is 230.
What is the Total Male Population of Grandfalls?
Total Male Population of Grandfalls is 97.
What is the Total Female Population of Grandfalls?
Total Female Population of Grandfalls is 133.
What is the Ratio of Males per 100 Females in Grandfalls?
There are 72.93 Males per 100 Females in Grandfalls.
What is the Ratio of Females per 100 Males in Grandfalls?
There are 137.11 Females per 100 Males in Grandfalls.
What is the Median Population Age in Grandfalls?
Median Population Age in Grandfalls is 40.2 Years.
What is the Average Family Size in Grandfalls
Average Family Size in Grandfalls is 3.1 People.
What is the Average Household Size in Grandfalls
Average Household Size in Grandfalls is 2.6 People.
How Large is the Labor Force in Grandfalls?
There are 68 People in the Labor Forcein in Grandfalls.
What is the Percentage of People in the Labor Force in Grandfalls?
44.2% of People are in the Labor Force in Grandfalls.
What is the Unemployment Rate in Grandfalls?
Unemployment Rate in Grandfalls is 13.2%.