Goliad, TX Map & Demographics
Goliad Map
Goliad Overview
$22,444
PER CAPITA INCOME
$66,389
AVG FAMILY INCOME
$39,138
AVG HOUSEHOLD INCOME
17.2%
WAGE / INCOME GAP [ % ]
82.8¢/ $1
WAGE / INCOME GAP [ $ ]
0.51
INEQUALITY / GINI INDEX
1,816
TOTAL POPULATION
833
MALE POPULATION
983
FEMALE POPULATION
84.74
MALES / 100 FEMALES
118.01
FEMALES / 100 MALES
38.4
MEDIAN AGE
3.6
AVG FAMILY SIZE
2.5
AVG HOUSEHOLD SIZE
738
LABOR FORCE [ PEOPLE ]
50.5%
PERCENT IN LABOR FORCE
8.9%
UNEMPLOYMENT RATE
Goliad Zip Codes
Goliad Area Codes
Income in Goliad
Income Overview in Goliad
Per Capita Income in Goliad is $22,444, while median incomes of families and households are $66,389 and $39,138 respectively.
| Characteristic | Number | Measure |
| Per Capita Income | 1,816 | $22,444 |
| Median Family Income | 384 | $66,389 |
| Mean Family Income | 384 | $72,560 |
| Median Household Income | 692 | $39,138 |
| Mean Household Income | 692 | $56,028 |
| Income Deficit | 384 | $0 |
| Wage / Income Gap (%) | 1,816 | 17.22% |
| Wage / Income Gap ($) | 1,816 | 82.78¢ per $1 |
| Gini / Inequality Index | 1,816 | 0.51 |
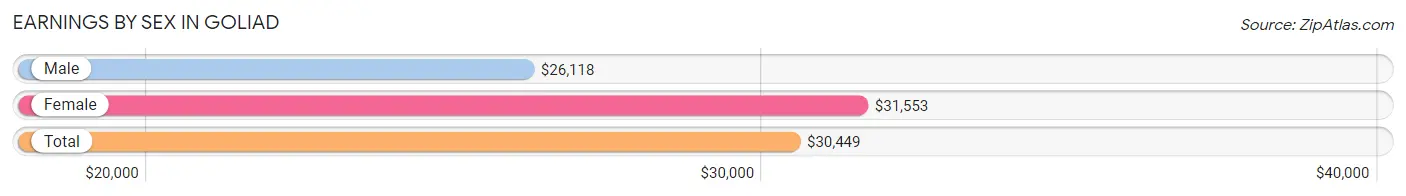
Earnings by Sex in Goliad
Average Earnings in Goliad are $30,449, $26,118 for men and $31,553 for women, a difference of 17.2%.
| Sex | Number | Average Earnings |
| Male | 431 (54.1%) | $26,118 |
| Female | 365 (45.9%) | $31,553 |
| Total | 796 (100.0%) | $30,449 |
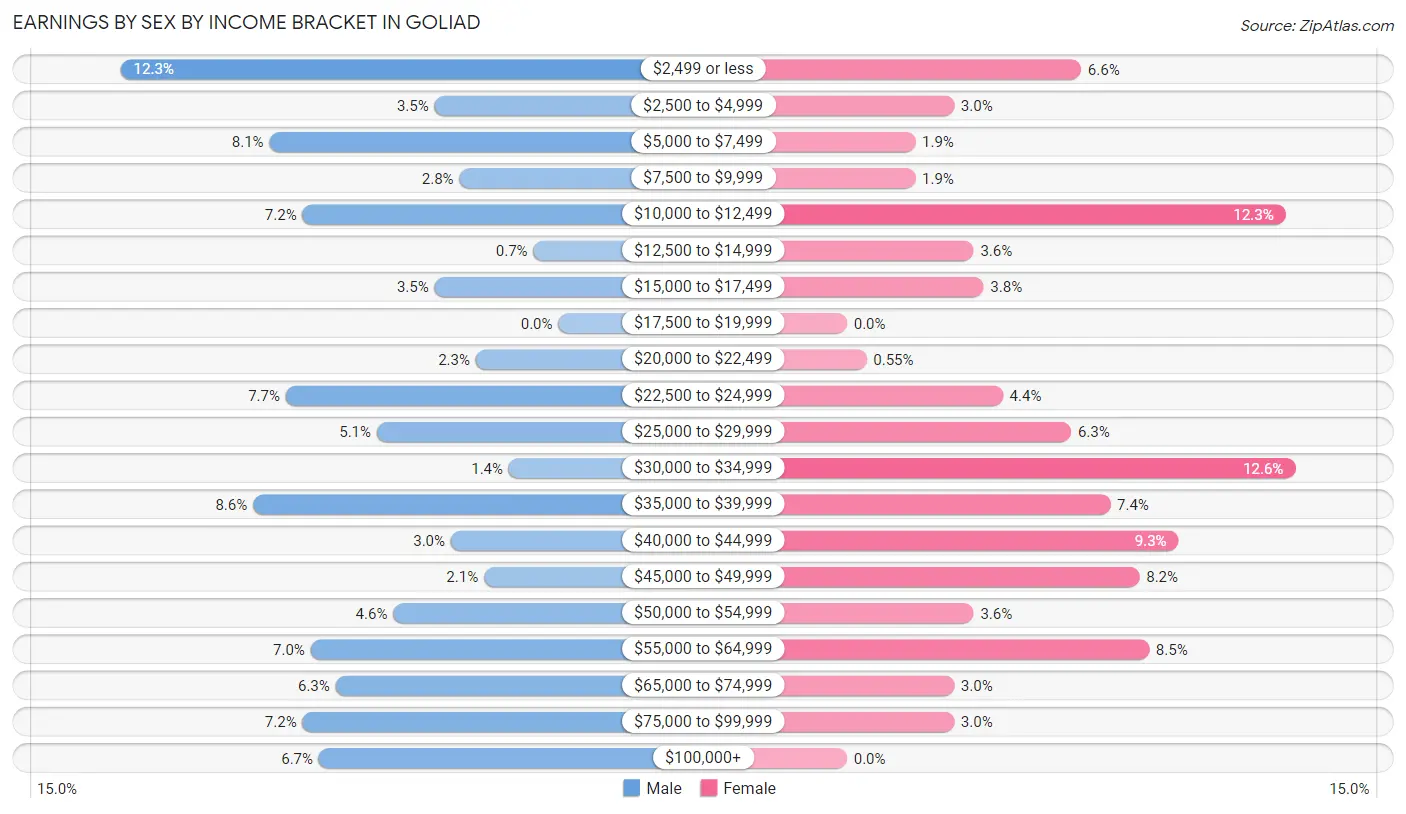
Earnings by Sex by Income Bracket in Goliad
The most common earnings brackets in Goliad are $2,499 or less for men (53 | 12.3%) and $30,000 to $34,999 for women (46 | 12.6%).
| Income | Male | Female |
| $2,499 or less | 53 (12.3%) | 24 (6.6%) |
| $2,500 to $4,999 | 15 (3.5%) | 11 (3.0%) |
| $5,000 to $7,499 | 35 (8.1%) | 7 (1.9%) |
| $7,500 to $9,999 | 12 (2.8%) | 7 (1.9%) |
| $10,000 to $12,499 | 31 (7.2%) | 45 (12.3%) |
| $12,500 to $14,999 | 3 (0.7%) | 13 (3.6%) |
| $15,000 to $17,499 | 15 (3.5%) | 14 (3.8%) |
| $17,500 to $19,999 | 0 (0.0%) | 0 (0.0%) |
| $20,000 to $22,499 | 10 (2.3%) | 2 (0.5%) |
| $22,500 to $24,999 | 33 (7.7%) | 16 (4.4%) |
| $25,000 to $29,999 | 22 (5.1%) | 23 (6.3%) |
| $30,000 to $34,999 | 6 (1.4%) | 46 (12.6%) |
| $35,000 to $39,999 | 37 (8.6%) | 27 (7.4%) |
| $40,000 to $44,999 | 13 (3.0%) | 34 (9.3%) |
| $45,000 to $49,999 | 9 (2.1%) | 30 (8.2%) |
| $50,000 to $54,999 | 20 (4.6%) | 13 (3.6%) |
| $55,000 to $64,999 | 30 (7.0%) | 31 (8.5%) |
| $65,000 to $74,999 | 27 (6.3%) | 11 (3.0%) |
| $75,000 to $99,999 | 31 (7.2%) | 11 (3.0%) |
| $100,000+ | 29 (6.7%) | 0 (0.0%) |
| Total | 431 (100.0%) | 365 (100.0%) |
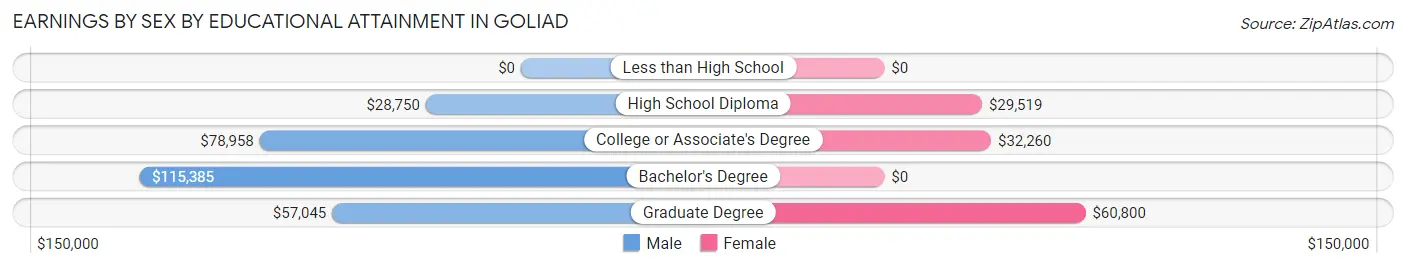
Earnings by Sex by Educational Attainment in Goliad
Average earnings in Goliad are $37,404 for men and $32,159 for women, a difference of 14.0%. Men with an educational attainment of bachelor's degree enjoy the highest average annual earnings of $115,385, while those with high school diploma education earn the least with $28,750. Women with an educational attainment of graduate degree earn the most with the average annual earnings of $60,800, while those with high school diploma education have the smallest earnings of $29,519.
| Educational Attainment | Male Income | Female Income |
| Less than High School | - | - |
| High School Diploma | $28,750 | $29,519 |
| College or Associate's Degree | $78,958 | $32,260 |
| Bachelor's Degree | $115,385 | $0 |
| Graduate Degree | $57,045 | $60,800 |
| Total | $37,404 | $32,159 |
Family Income in Goliad
Family Income Brackets in Goliad
According to the Goliad family income data, there are 84 families falling into the $75,000 to $99,999 income range, which is the most common income bracket and makes up 21.9% of all families. Conversely, the $200,000+ income bracket is the least frequent group with only 1 families (0.3%) belonging to this category.
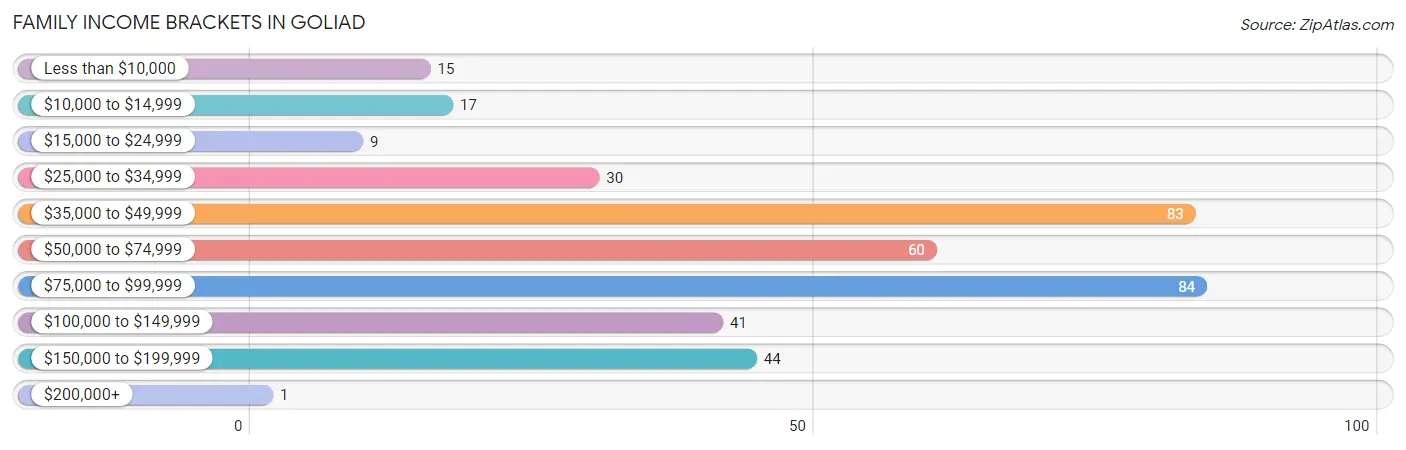
| Income Bracket | # Families | % Families |
| Less than $10,000 | 15 | 3.9% |
| $10,000 to $14,999 | 17 | 4.4% |
| $15,000 to $24,999 | 9 | 2.3% |
| $25,000 to $34,999 | 30 | 7.8% |
| $35,000 to $49,999 | 83 | 21.6% |
| $50,000 to $74,999 | 60 | 15.6% |
| $75,000 to $99,999 | 84 | 21.9% |
| $100,000 to $149,999 | 41 | 10.7% |
| $150,000 to $199,999 | 44 | 11.5% |
| $200,000+ | 1 | 0.3% |
Family Income by Famaliy Size in Goliad
5-person families (37 | 9.6%) account for the highest median family income in Goliad with $78,882 per family, while 2-person families (146 | 38.0%) have the highest median income of $32,639 per family member.
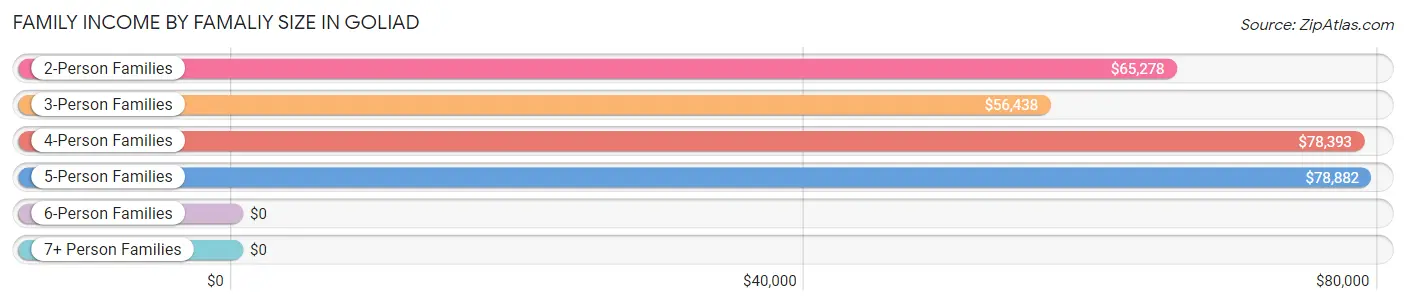
| Income Bracket | # Families | Median Income |
| 2-Person Families | 146 (38.0%) | $65,278 |
| 3-Person Families | 93 (24.2%) | $56,438 |
| 4-Person Families | 108 (28.1%) | $78,393 |
| 5-Person Families | 37 (9.6%) | $78,882 |
| 6-Person Families | 0 (0.0%) | $0 |
| 7+ Person Families | 0 (0.0%) | $0 |
| Total | 384 (100.0%) | $66,389 |
Family Income by Number of Earners in Goliad
The median family income in Goliad is $66,389, with families comprising 3+ earners (17) having the highest median family income of $101,125, while families with 1 earner (134) have the lowest median family income of $42,875, accounting for 4.4% and 34.9% of families, respectively.
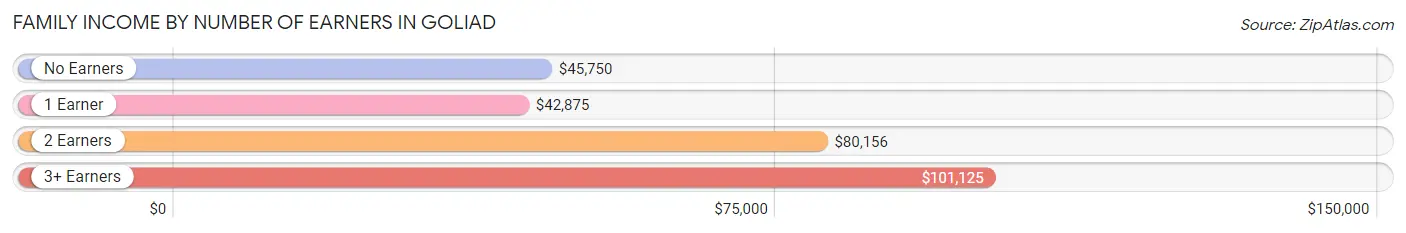
| Number of Earners | # Families | Median Income |
| No Earners | 51 (13.3%) | $45,750 |
| 1 Earner | 134 (34.9%) | $42,875 |
| 2 Earners | 182 (47.4%) | $80,156 |
| 3+ Earners | 17 (4.4%) | $101,125 |
| Total | 384 (100.0%) | $66,389 |
Household Income in Goliad
Household Income Brackets in Goliad
With 126 households falling in the category, the less than $10,000 income range is the most frequent in Goliad, accounting for 18.2% of all households. In contrast, only 6 households (0.9%) fall into the $200,000+ income bracket, making it the least populous group.
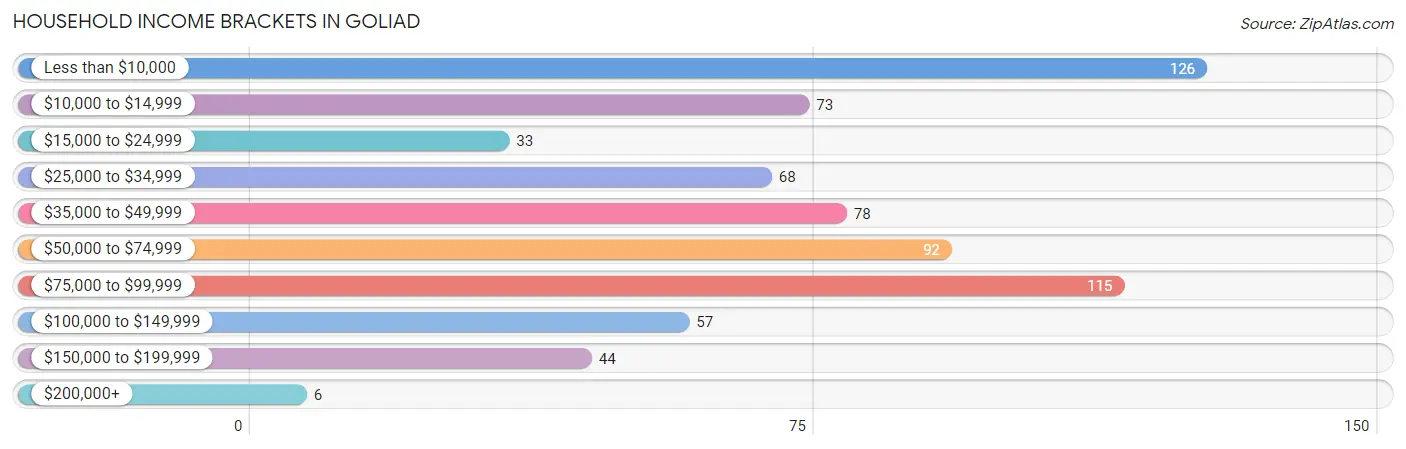
| Income Bracket | # Households | % Households |
| Less than $10,000 | 126 | 18.2% |
| $10,000 to $14,999 | 73 | 10.5% |
| $15,000 to $24,999 | 33 | 4.8% |
| $25,000 to $34,999 | 68 | 9.8% |
| $35,000 to $49,999 | 78 | 11.3% |
| $50,000 to $74,999 | 92 | 13.3% |
| $75,000 to $99,999 | 115 | 16.6% |
| $100,000 to $149,999 | 57 | 8.2% |
| $150,000 to $199,999 | 44 | 6.4% |
| $200,000+ | 6 | 0.9% |
Household Income by Householder Age in Goliad
The median household income in Goliad is $39,138, with the highest median household income of $56,838 found in the 45 to 64 years age bracket for the primary householder. A total of 213 households (30.8%) fall into this category.
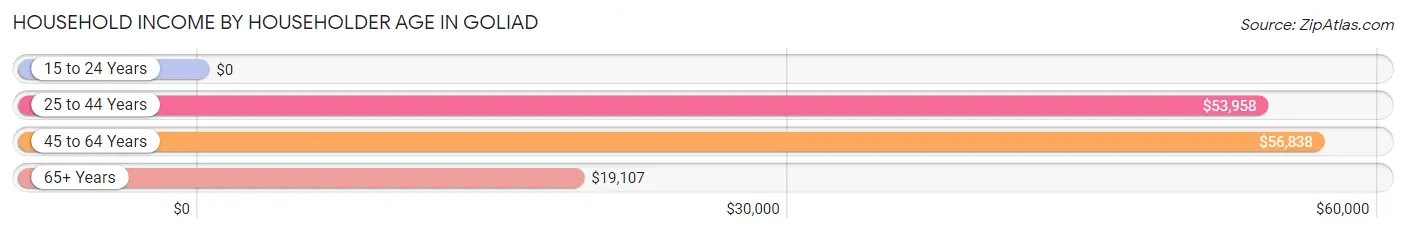
| Income Bracket | # Households | Median Income |
| 15 to 24 Years | 0 (0.0%) | $0 |
| 25 to 44 Years | 210 (30.3%) | $53,958 |
| 45 to 64 Years | 213 (30.8%) | $56,838 |
| 65+ Years | 269 (38.9%) | $19,107 |
| Total | 692 (100.0%) | $39,138 |
Poverty in Goliad
Income Below Poverty by Sex and Age in Goliad
With 20.8% poverty level for males and 18.0% for females among the residents of Goliad, 75 year old and over males and 75 year old and over females are the most vulnerable to poverty, with 29 males (64.4%) and 53 females (66.2%) in their respective age groups living below the poverty level.
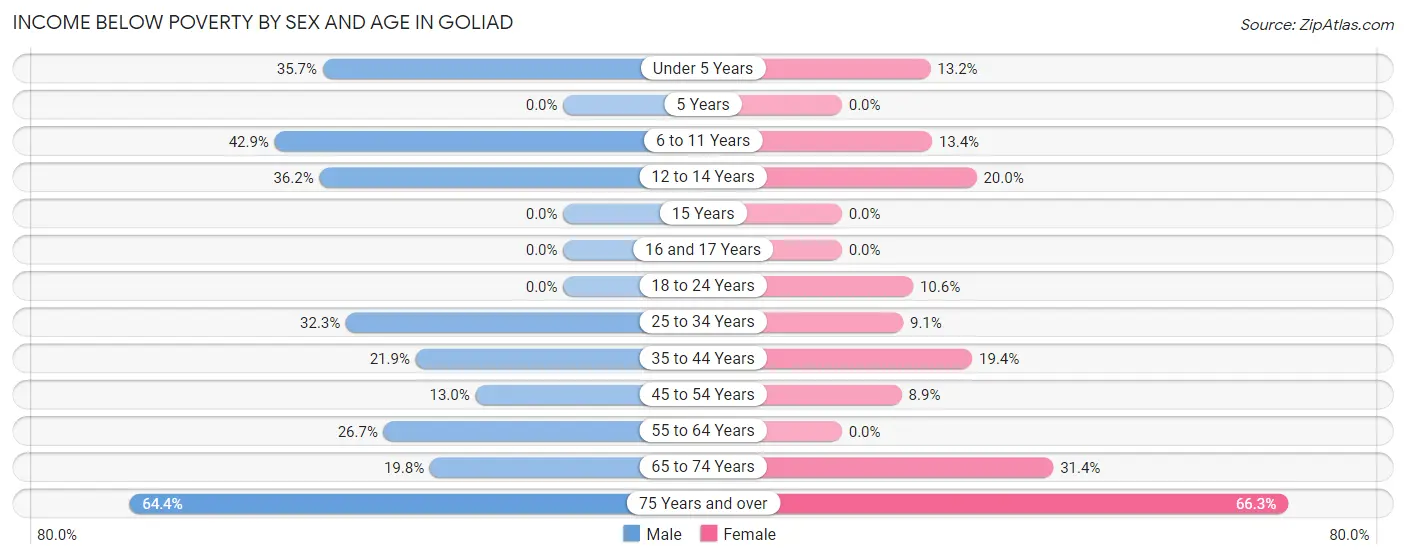
| Age Bracket | Male | Female |
| Under 5 Years | 5 (35.7%) | 5 (13.2%) |
| 5 Years | 0 (0.0%) | 0 (0.0%) |
| 6 to 11 Years | 6 (42.9%) | 17 (13.4%) |
| 12 to 14 Years | 21 (36.2%) | 5 (20.0%) |
| 15 Years | 0 (0.0%) | 0 (0.0%) |
| 16 and 17 Years | 0 (0.0%) | 0 (0.0%) |
| 18 to 24 Years | 0 (0.0%) | 13 (10.6%) |
| 25 to 34 Years | 30 (32.3%) | 7 (9.1%) |
| 35 to 44 Years | 16 (21.9%) | 18 (19.4%) |
| 45 to 54 Years | 15 (13.0%) | 12 (8.9%) |
| 55 to 64 Years | 16 (26.7%) | 0 (0.0%) |
| 65 to 74 Years | 20 (19.8%) | 43 (31.4%) |
| 75 Years and over | 29 (64.4%) | 53 (66.2%) |
| Total | 158 (20.8%) | 173 (18.0%) |
Income Above Poverty by Sex and Age in Goliad
According to the poverty statistics in Goliad, males aged 5 years and females aged 15 years are the age groups that are most secure financially, with 100.0% of males and 100.0% of females in these age groups living above the poverty line.
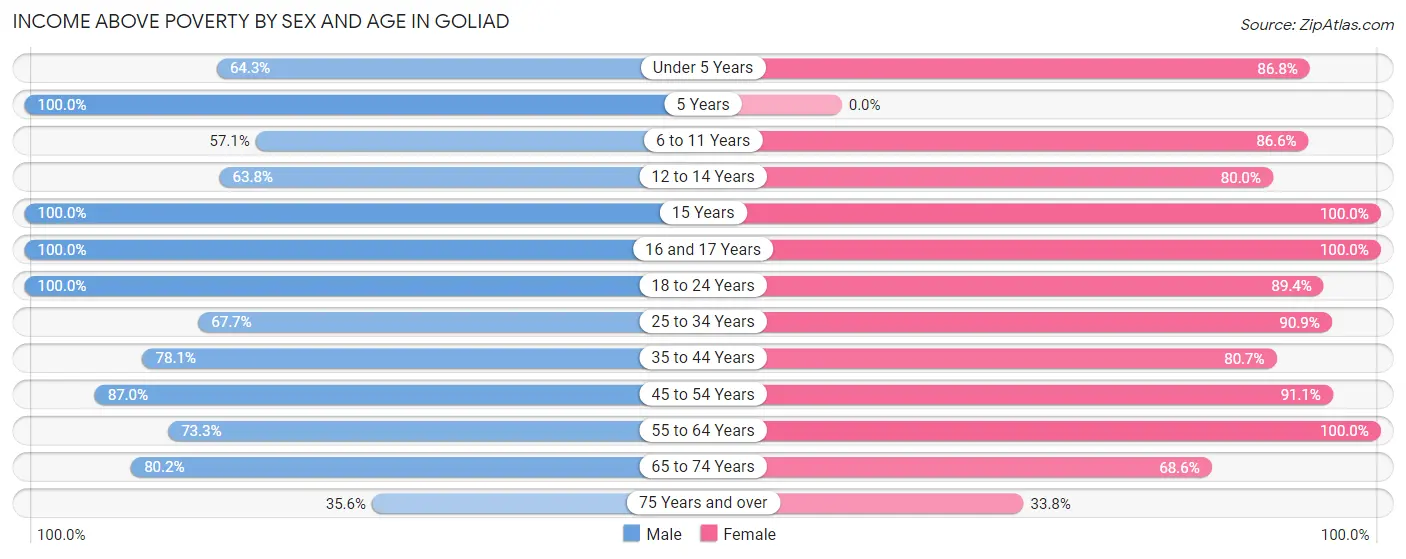
| Age Bracket | Male | Female |
| Under 5 Years | 9 (64.3%) | 33 (86.8%) |
| 5 Years | 21 (100.0%) | 0 (0.0%) |
| 6 to 11 Years | 8 (57.1%) | 110 (86.6%) |
| 12 to 14 Years | 37 (63.8%) | 20 (80.0%) |
| 15 Years | 40 (100.0%) | 17 (100.0%) |
| 16 and 17 Years | 35 (100.0%) | 38 (100.0%) |
| 18 to 24 Years | 91 (100.0%) | 110 (89.4%) |
| 25 to 34 Years | 63 (67.7%) | 70 (90.9%) |
| 35 to 44 Years | 57 (78.1%) | 75 (80.6%) |
| 45 to 54 Years | 100 (87.0%) | 123 (91.1%) |
| 55 to 64 Years | 44 (73.3%) | 71 (100.0%) |
| 65 to 74 Years | 81 (80.2%) | 94 (68.6%) |
| 75 Years and over | 16 (35.6%) | 27 (33.8%) |
| Total | 602 (79.2%) | 788 (82.0%) |
Income Below Poverty Among Married-Couple Families in Goliad
The poverty statistics for married-couple families in Goliad show that 9.4% or 23 of the total 245 families live below the poverty line. Families with 1 or 2 children have the highest poverty rate of 17.0%, comprising of 23 families. On the other hand, families with no children have the lowest poverty rate of 0.0%, which includes 0 families.
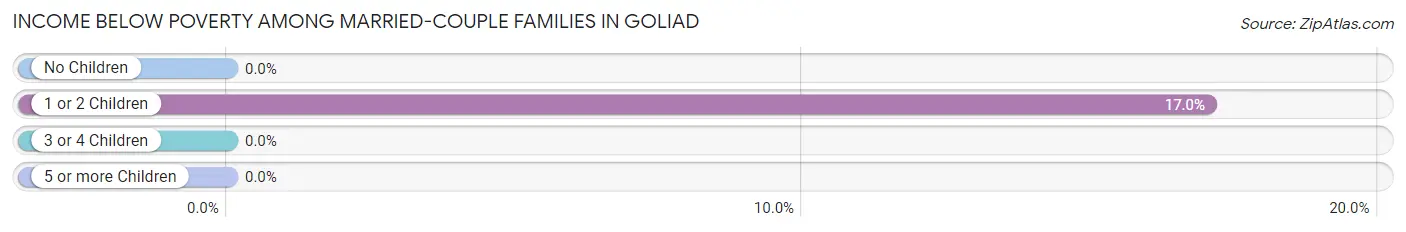
| Children | Above Poverty | Below Poverty |
| No Children | 83 (100.0%) | 0 (0.0%) |
| 1 or 2 Children | 112 (83.0%) | 23 (17.0%) |
| 3 or 4 Children | 27 (100.0%) | 0 (0.0%) |
| 5 or more Children | 0 (0.0%) | 0 (0.0%) |
| Total | 222 (90.6%) | 23 (9.4%) |
Income Below Poverty Among Single-Parent Households in Goliad
According to the poverty data in Goliad, 43.2% or 16 single-father households and 13.7% or 14 single-mother households are living below the poverty line. Among single-father households, those with 1 or 2 children have the highest poverty rate, with 7 households (100.0%) experiencing poverty. Likewise, among single-mother households, those with 1 or 2 children have the highest poverty rate, with 14 households (21.5%) falling below the poverty line.
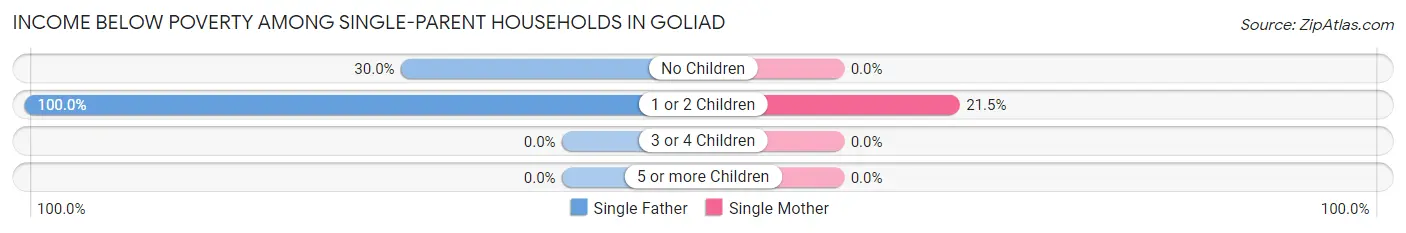
| Children | Single Father | Single Mother |
| No Children | 9 (30.0%) | 0 (0.0%) |
| 1 or 2 Children | 7 (100.0%) | 14 (21.5%) |
| 3 or 4 Children | 0 (0.0%) | 0 (0.0%) |
| 5 or more Children | 0 (0.0%) | 0 (0.0%) |
| Total | 16 (43.2%) | 14 (13.7%) |
Income Below Poverty Among Married-Couple vs Single-Parent Households in Goliad
The poverty data for Goliad shows that 23 of the married-couple family households (9.4%) and 30 of the single-parent households (21.6%) are living below the poverty level. Within the married-couple family households, those with 1 or 2 children have the highest poverty rate, with 23 households (17.0%) falling below the poverty line. Among the single-parent households, those with 1 or 2 children have the highest poverty rate, with 21 household (29.2%) living below poverty.
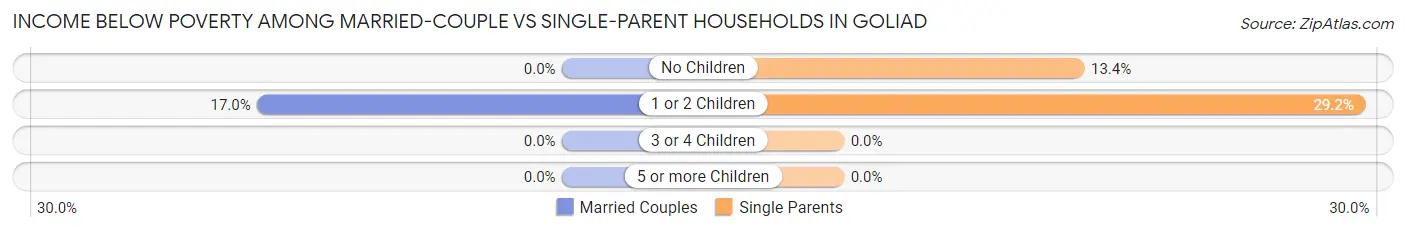
| Children | Married-Couple Families | Single-Parent Households |
| No Children | 0 (0.0%) | 9 (13.4%) |
| 1 or 2 Children | 23 (17.0%) | 21 (29.2%) |
| 3 or 4 Children | 0 (0.0%) | 0 (0.0%) |
| 5 or more Children | 0 (0.0%) | 0 (0.0%) |
| Total | 23 (9.4%) | 30 (21.6%) |
Race in Goliad
The most populous races in Goliad are White / Caucasian (1,197 | 65.9%), Hispanic or Latino (1,052 | 57.9%), and Two or more Races (375 | 20.6%).
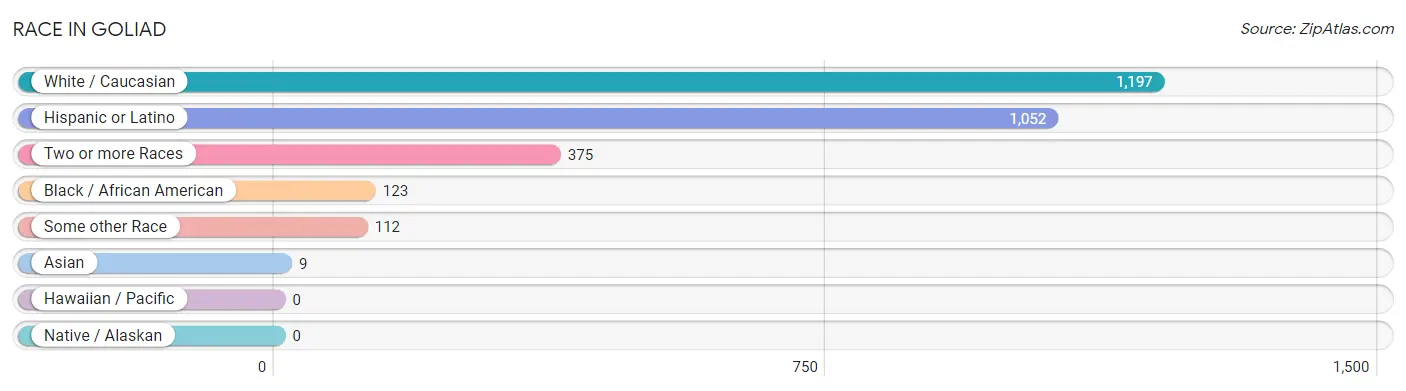
| Race | # Population | % Population |
| Asian | 9 | 0.5% |
| Black / African American | 123 | 6.8% |
| Hawaiian / Pacific | 0 | 0.0% |
| Hispanic or Latino | 1,052 | 57.9% |
| Native / Alaskan | 0 | 0.0% |
| White / Caucasian | 1,197 | 65.9% |
| Two or more Races | 375 | 20.6% |
| Some other Race | 112 | 6.2% |
| Total | 1,816 | 100.0% |
Ancestry in Goliad
The most populous ancestries reported in Goliad are Mexican (981 | 54.0%), German (248 | 13.7%), Irish (155 | 8.5%), English (89 | 4.9%), and French (52 | 2.9%), together accounting for 84.0% of all Goliad residents.
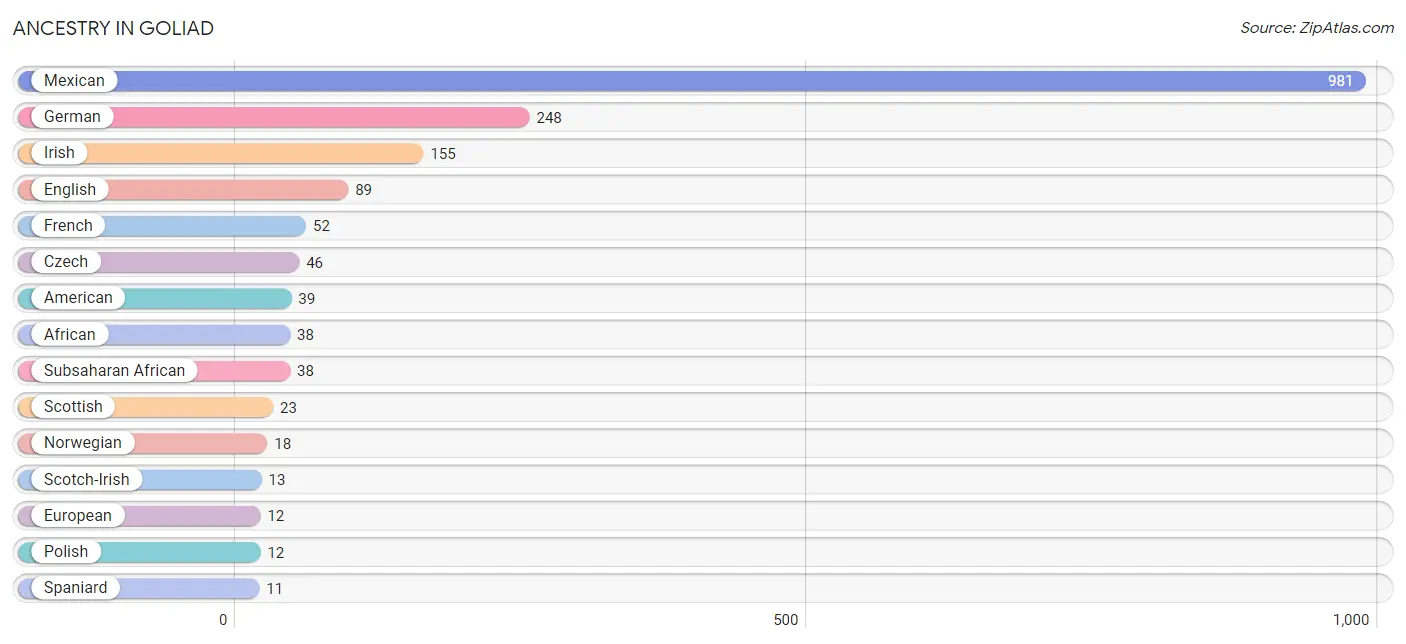
| Ancestry | # Population | % Population |
| African | 38 | 2.1% |
| American | 39 | 2.1% |
| Central American | 5 | 0.3% |
| Czech | 46 | 2.5% |
| Danish | 1 | 0.1% |
| English | 89 | 4.9% |
| European | 12 | 0.7% |
| French | 52 | 2.9% |
| French Canadian | 5 | 0.3% |
| German | 248 | 13.7% |
| Irish | 155 | 8.5% |
| Italian | 2 | 0.1% |
| Mexican | 981 | 54.0% |
| Norwegian | 18 | 1.0% |
| Polish | 12 | 0.7% |
| Salvadoran | 5 | 0.3% |
| Scotch-Irish | 13 | 0.7% |
| Scottish | 23 | 1.3% |
| Spaniard | 11 | 0.6% |
| Spanish | 3 | 0.2% |
| Sri Lankan | 9 | 0.5% |
| Subsaharan African | 38 | 2.1% | View All 22 Rows |
Immigrants in Goliad
The most numerous immigrant groups reported in Goliad came from Central America (107 | 5.9%), Latin America (107 | 5.9%), Mexico (102 | 5.6%), Canada (7 | 0.4%), and El Salvador (5 | 0.3%), together accounting for 18.1% of all Goliad residents.
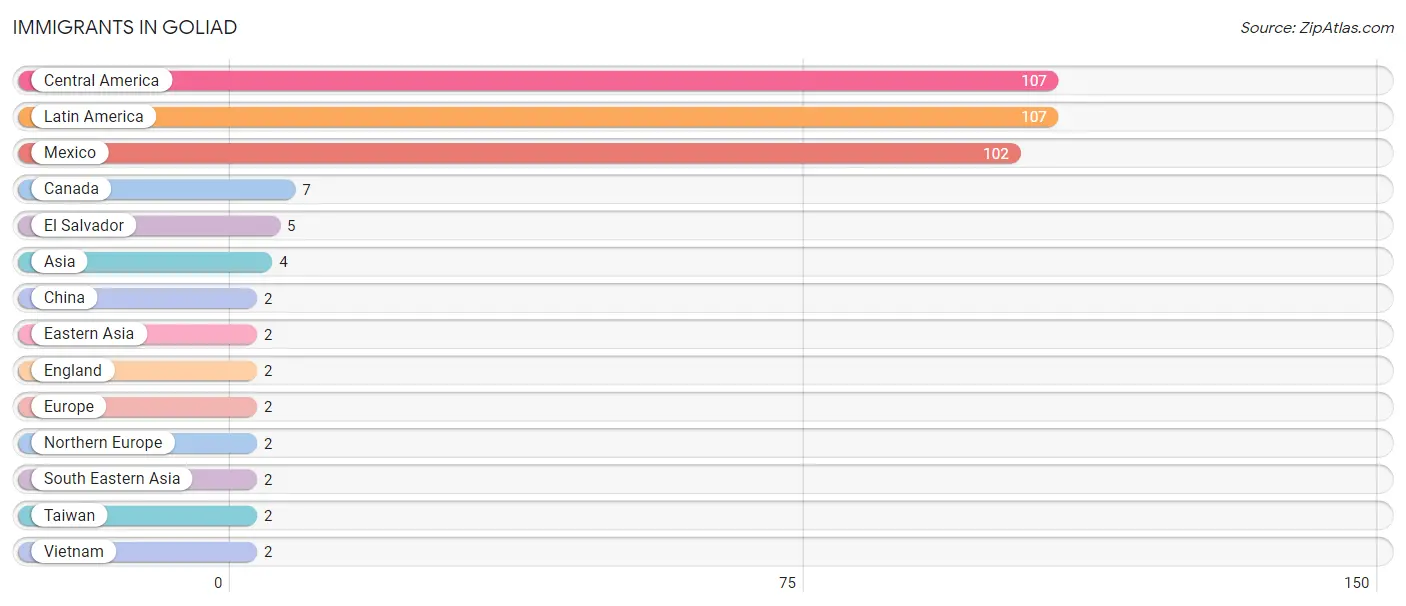
| Immigration Origin | # Population | % Population |
| Asia | 4 | 0.2% |
| Canada | 7 | 0.4% |
| Central America | 107 | 5.9% |
| China | 2 | 0.1% |
| Eastern Asia | 2 | 0.1% |
| El Salvador | 5 | 0.3% |
| England | 2 | 0.1% |
| Europe | 2 | 0.1% |
| Latin America | 107 | 5.9% |
| Mexico | 102 | 5.6% |
| Northern Europe | 2 | 0.1% |
| South Eastern Asia | 2 | 0.1% |
| Taiwan | 2 | 0.1% |
| Vietnam | 2 | 0.1% | View All 14 Rows |
Sex and Age in Goliad
Sex and Age in Goliad
The most populous age groups in Goliad are 15 to 19 Years (101 | 12.1%) for men and 65 to 69 Years (124 | 12.6%) for women.
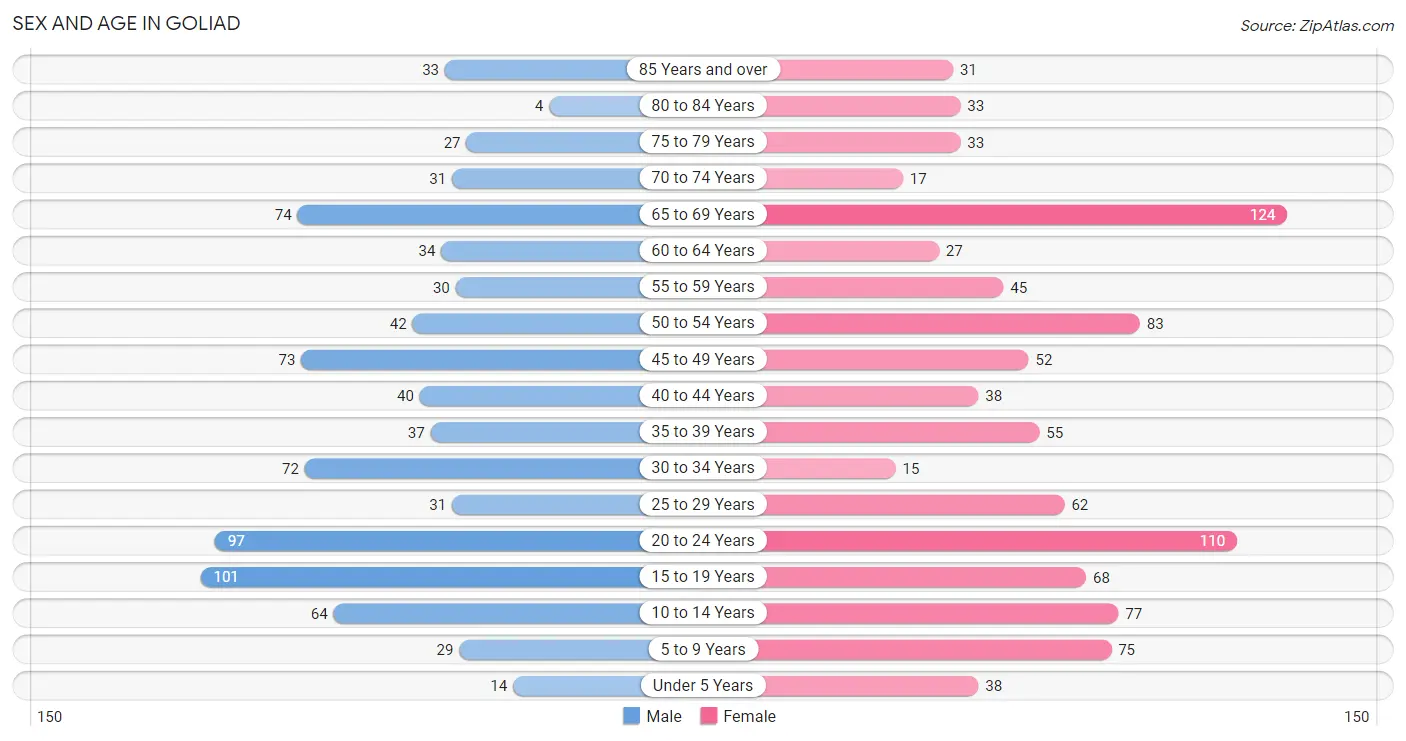
| Age Bracket | Male | Female |
| Under 5 Years | 14 (1.7%) | 38 (3.9%) |
| 5 to 9 Years | 29 (3.5%) | 75 (7.6%) |
| 10 to 14 Years | 64 (7.7%) | 77 (7.8%) |
| 15 to 19 Years | 101 (12.1%) | 68 (6.9%) |
| 20 to 24 Years | 97 (11.6%) | 110 (11.2%) |
| 25 to 29 Years | 31 (3.7%) | 62 (6.3%) |
| 30 to 34 Years | 72 (8.6%) | 15 (1.5%) |
| 35 to 39 Years | 37 (4.4%) | 55 (5.6%) |
| 40 to 44 Years | 40 (4.8%) | 38 (3.9%) |
| 45 to 49 Years | 73 (8.8%) | 52 (5.3%) |
| 50 to 54 Years | 42 (5.0%) | 83 (8.4%) |
| 55 to 59 Years | 30 (3.6%) | 45 (4.6%) |
| 60 to 64 Years | 34 (4.1%) | 27 (2.8%) |
| 65 to 69 Years | 74 (8.9%) | 124 (12.6%) |
| 70 to 74 Years | 31 (3.7%) | 17 (1.7%) |
| 75 to 79 Years | 27 (3.2%) | 33 (3.4%) |
| 80 to 84 Years | 4 (0.5%) | 33 (3.4%) |
| 85 Years and over | 33 (4.0%) | 31 (3.2%) |
| Total | 833 (100.0%) | 983 (100.0%) |
Families and Households in Goliad
Median Family Size in Goliad
The median family size in Goliad is 3.56 persons per family, with married-couple families (245 | 63.8%) accounting for the largest median family size of 4.07 persons per family. On the other hand, single female/mother families (102 | 26.6%) represent the smallest median family size with 2.53 persons per family.
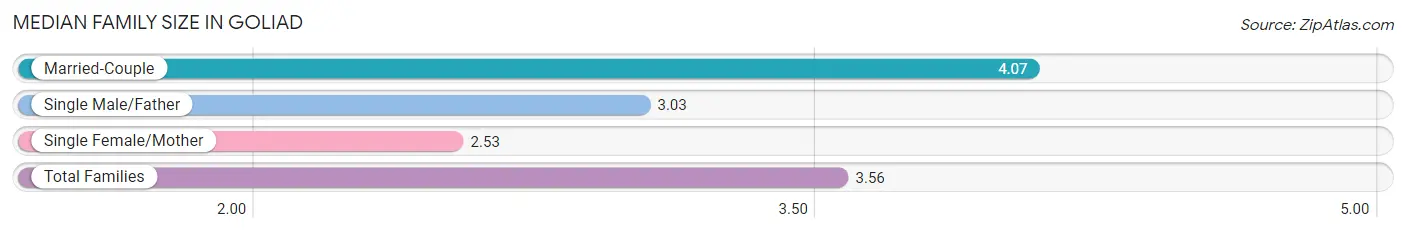
| Family Type | # Families | Family Size |
| Married-Couple | 245 (63.8%) | 4.07 |
| Single Male/Father | 37 (9.6%) | 3.03 |
| Single Female/Mother | 102 (26.6%) | 2.53 |
| Total Families | 384 (100.0%) | 3.56 |
Median Household Size in Goliad
The median household size in Goliad is 2.49 persons per household, with married-couple households (245 | 35.4%) accounting for the largest median household size of 4.07 persons per household. non-family households (308 | 44.5%) represent the smallest median household size with 1.08 persons per household.
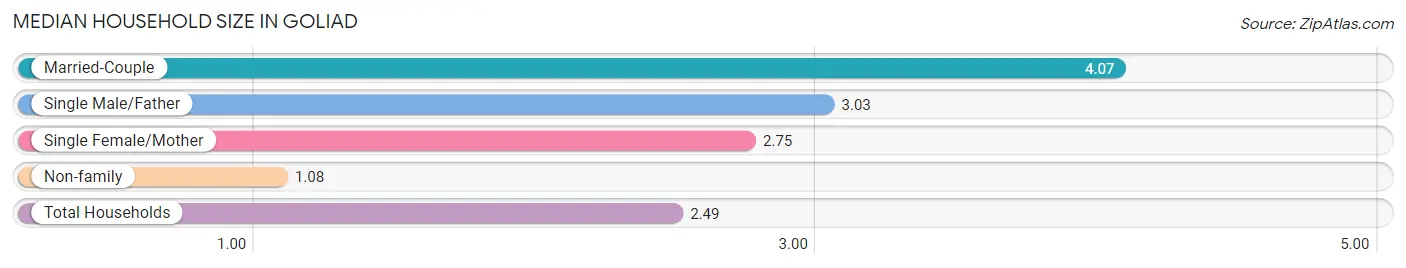
| Household Type | # Households | Household Size |
| Married-Couple | 245 (35.4%) | 4.07 |
| Single Male/Father | 37 (5.3%) | 3.03 |
| Single Female/Mother | 102 (14.7%) | 2.75 |
| Non-family | 308 (44.5%) | 1.08 |
| Total Households | 692 (100.0%) | 2.49 |
Household Size by Marriage Status in Goliad
Out of a total of 692 households in Goliad, 384 (55.5%) are family households, while 308 (44.5%) are nonfamily households. The most numerous type of family households are 2-person households, comprising 126, and the most common type of nonfamily households are 1-person households, comprising 285.
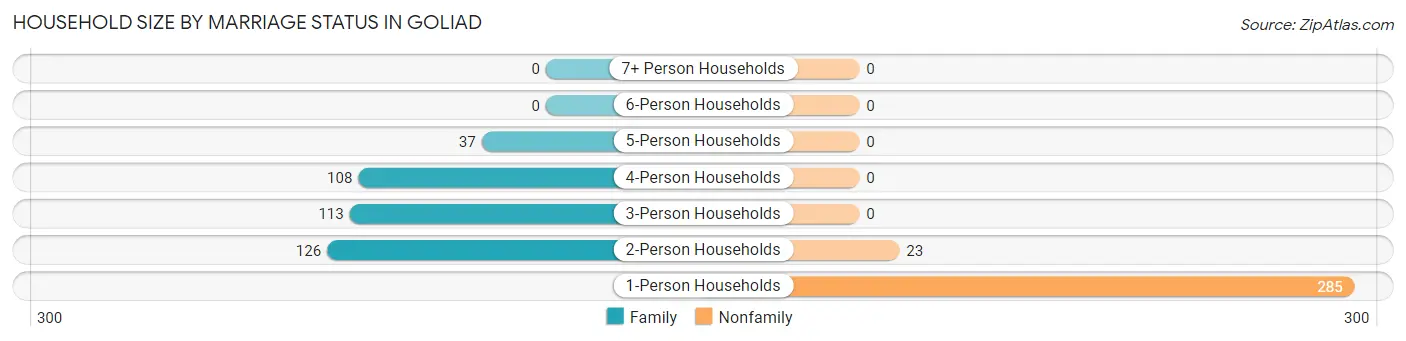
| Household Size | Family Households | Nonfamily Households |
| 1-Person Households | - | 285 (41.2%) |
| 2-Person Households | 126 (18.2%) | 23 (3.3%) |
| 3-Person Households | 113 (16.3%) | 0 (0.0%) |
| 4-Person Households | 108 (15.6%) | 0 (0.0%) |
| 5-Person Households | 37 (5.3%) | 0 (0.0%) |
| 6-Person Households | 0 (0.0%) | 0 (0.0%) |
| 7+ Person Households | 0 (0.0%) | 0 (0.0%) |
| Total | 384 (55.5%) | 308 (44.5%) |
Female Fertility in Goliad
Fertility by Age in Goliad
Average fertility rate in Goliad is 49.0 births per 1,000 women. Women in the age bracket of 20 to 34 years have the highest fertility rate with 112.0 births per 1,000 women. Women in the age bracket of 20 to 34 years acount for 100.0% of all women with births.
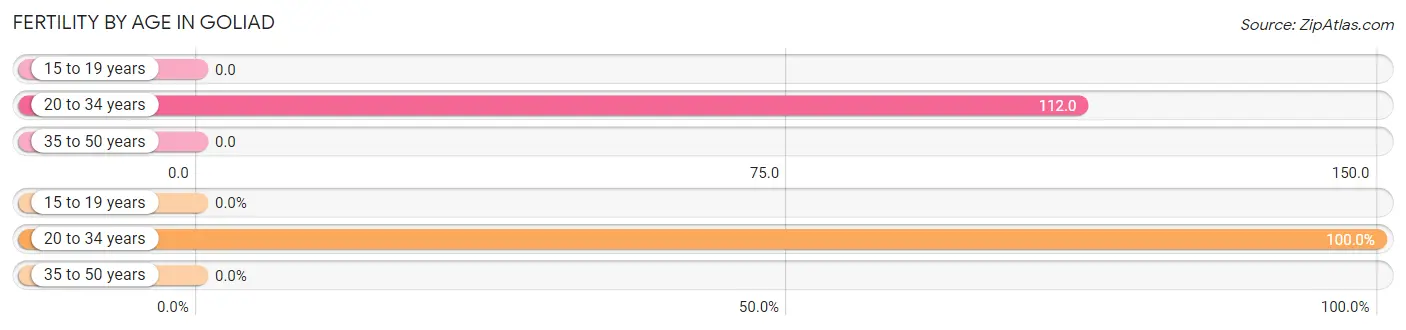
| Age Bracket | Women with Births | Births / 1,000 Women |
| 15 to 19 years | 0 (0.0%) | 0.0 |
| 20 to 34 years | 21 (100.0%) | 112.0 |
| 35 to 50 years | 0 (0.0%) | 0.0 |
| Total | 21 (100.0%) | 49.0 |
Fertility by Age by Marriage Status in Goliad
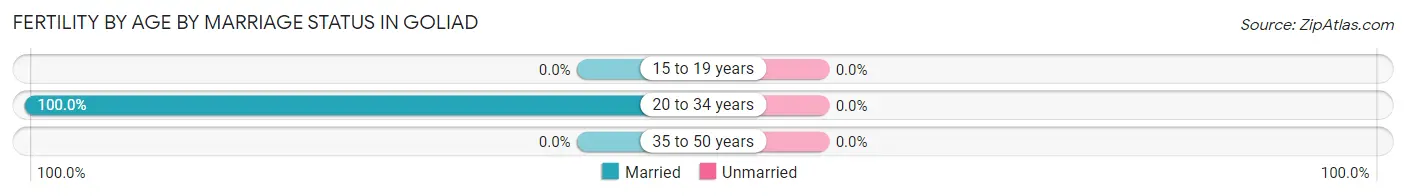
| Age Bracket | Married | Unmarried |
| 15 to 19 years | 0 (0.0%) | 0 (0.0%) |
| 20 to 34 years | 21 (100.0%) | 0 (0.0%) |
| 35 to 50 years | 0 (0.0%) | 0 (0.0%) |
| Total | 21 (100.0%) | 0 (0.0%) |
Fertility by Education in Goliad
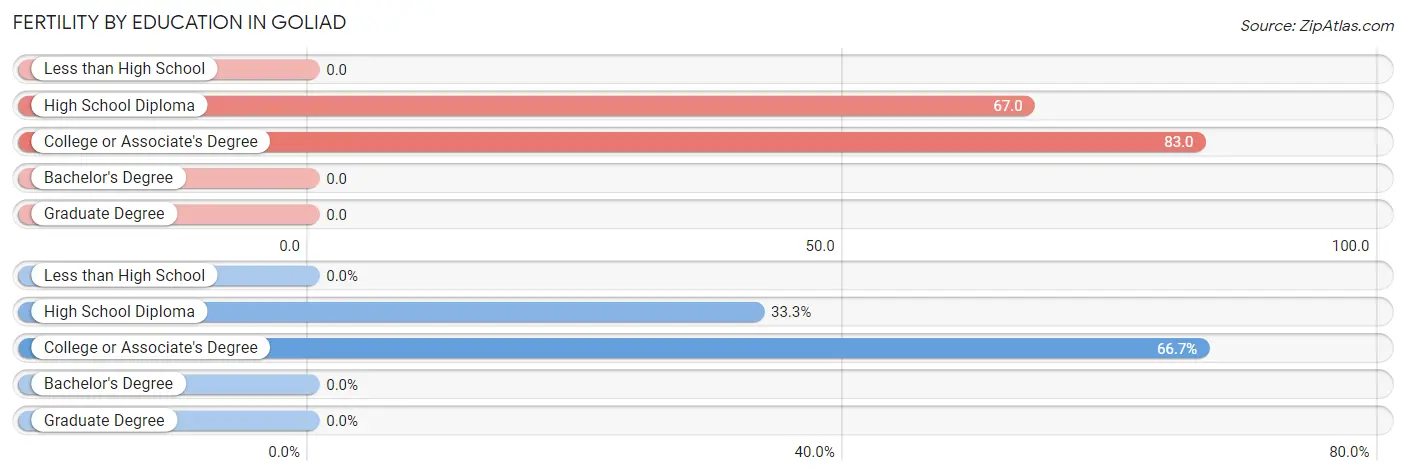
| Educational Attainment | Women with Births | Births / 1,000 Women |
| Less than High School | 0 (0.0%) | 0.0 |
| High School Diploma | 7 (33.3%) | 67.0 |
| College or Associate's Degree | 14 (66.7%) | 83.0 |
| Bachelor's Degree | 0 (0.0%) | 0.0 |
| Graduate Degree | 0 (0.0%) | 0.0 |
| Total | 21 (100.0%) | 49.0 |
Fertility by Education by Marriage Status in Goliad
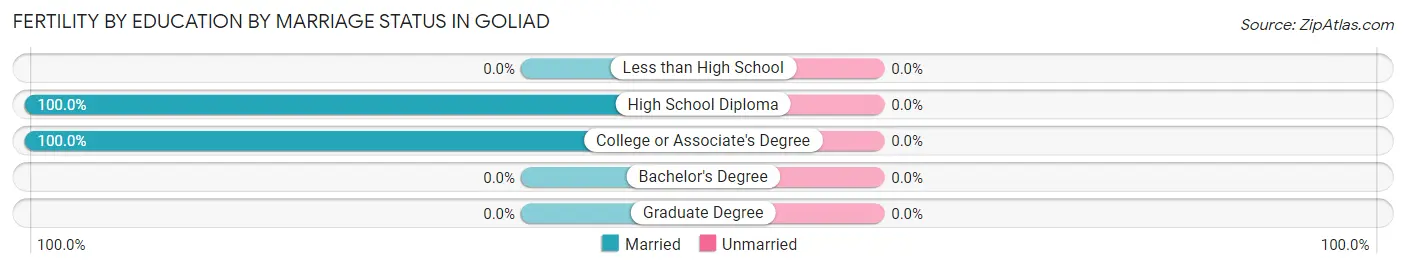
| Educational Attainment | Married | Unmarried |
| Less than High School | 0 (0.0%) | 0 (0.0%) |
| High School Diploma | 7 (100.0%) | 0 (0.0%) |
| College or Associate's Degree | 14 (100.0%) | 0 (0.0%) |
| Bachelor's Degree | 0 (0.0%) | 0 (0.0%) |
| Graduate Degree | 0 (0.0%) | 0 (0.0%) |
| Total | 21 (100.0%) | 0 (0.0%) |
Employment Characteristics in Goliad
Employment by Class of Employer in Goliad
Among the 673 employed individuals in Goliad, private company employees (429 | 63.7%), local government employees (90 | 13.4%), and self-employed (not incorporated) (60 | 8.9%) make up the most common classes of employment.
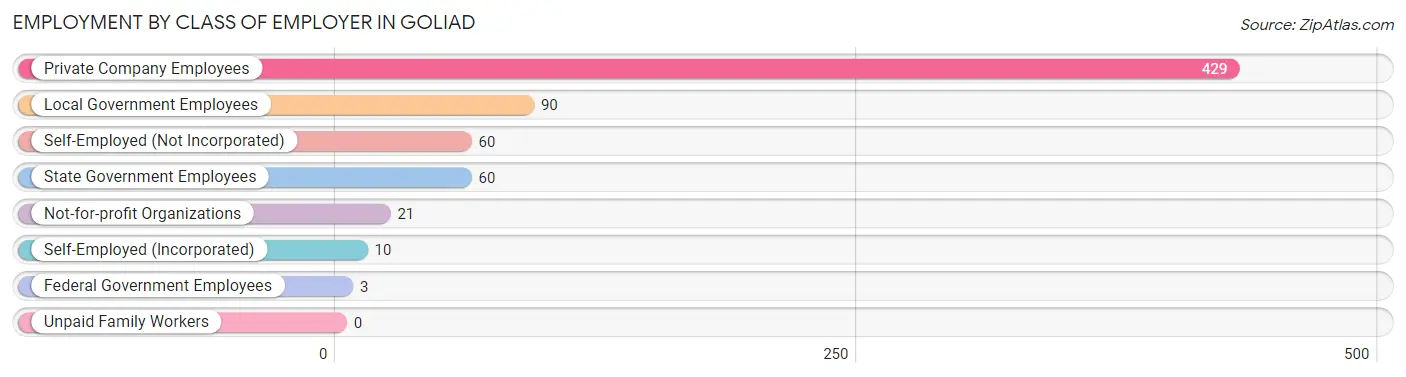
| Employer Class | # Employees | % Employees |
| Private Company Employees | 429 | 63.7% |
| Self-Employed (Incorporated) | 10 | 1.5% |
| Self-Employed (Not Incorporated) | 60 | 8.9% |
| Not-for-profit Organizations | 21 | 3.1% |
| Local Government Employees | 90 | 13.4% |
| State Government Employees | 60 | 8.9% |
| Federal Government Employees | 3 | 0.4% |
| Unpaid Family Workers | 0 | 0.0% |
| Total | 673 | 100.0% |
Employment Status by Age in Goliad
According to the labor force statistics for Goliad, out of the total population over 16 years of age (1,462), 50.5% or 738 individuals are in the labor force, with 8.9% or 66 of them unemployed. The age group with the highest labor force participation rate is 45 to 54 years, with 86.4% or 216 individuals in the labor force. Within the labor force, the 20 to 24 years age range has the highest percentage of unemployed individuals, with 37.6% or 32 of them being unemployed.
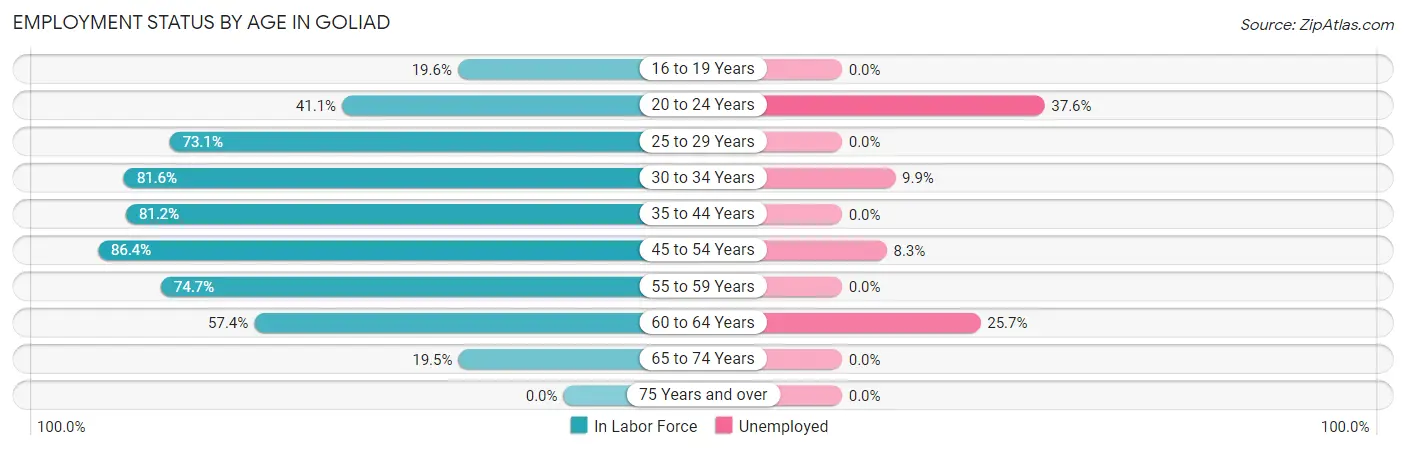
| Age Bracket | In Labor Force | Unemployed |
| 16 to 19 Years | 22 (19.6%) | 0 (0.0%) |
| 20 to 24 Years | 85 (41.1%) | 32 (37.6%) |
| 25 to 29 Years | 68 (73.1%) | 0 (0.0%) |
| 30 to 34 Years | 71 (81.6%) | 7 (9.9%) |
| 35 to 44 Years | 138 (81.2%) | 0 (0.0%) |
| 45 to 54 Years | 216 (86.4%) | 18 (8.3%) |
| 55 to 59 Years | 56 (74.7%) | 0 (0.0%) |
| 60 to 64 Years | 35 (57.4%) | 9 (25.7%) |
| 65 to 74 Years | 48 (19.5%) | 0 (0.0%) |
| 75 Years and over | 0 (0.0%) | 0 (0.0%) |
| Total | 738 (50.5%) | 66 (8.9%) |
Employment Status by Educational Attainment in Goliad
According to labor force statistics for Goliad, 79.3% of individuals (584) out of the total population between 25 and 64 years of age (736) are in the labor force, with 5.8% or 34 of them being unemployed. The group with the highest labor force participation rate are those with the educational attainment of bachelor's degree or higher, with 89.2% or 107 individuals in the labor force. Within the labor force, individuals with less than high school education have the highest percentage of unemployment, with 13.5% or 12 of them being unemployed.
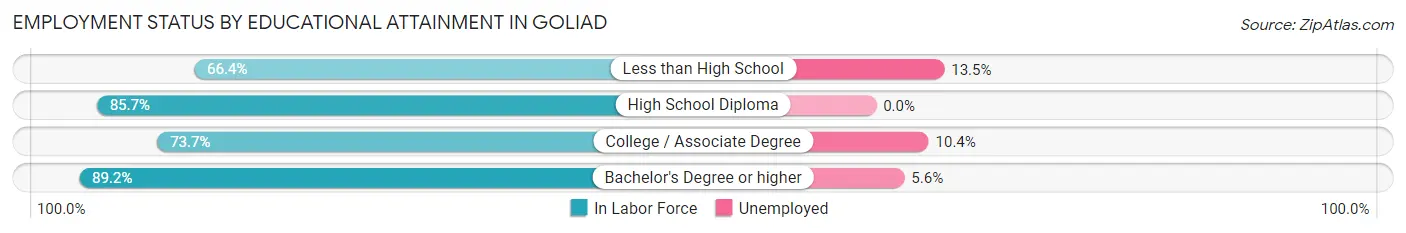
| Educational Attainment | In Labor Force | Unemployed |
| Less than High School | 89 (66.4%) | 18 (13.5%) |
| High School Diploma | 234 (85.7%) | 0 (0.0%) |
| College / Associate Degree | 154 (73.7%) | 22 (10.4%) |
| Bachelor's Degree or higher | 107 (89.2%) | 7 (5.6%) |
| Total | 584 (79.3%) | 43 (5.8%) |
Employment Occupations by Sex in Goliad
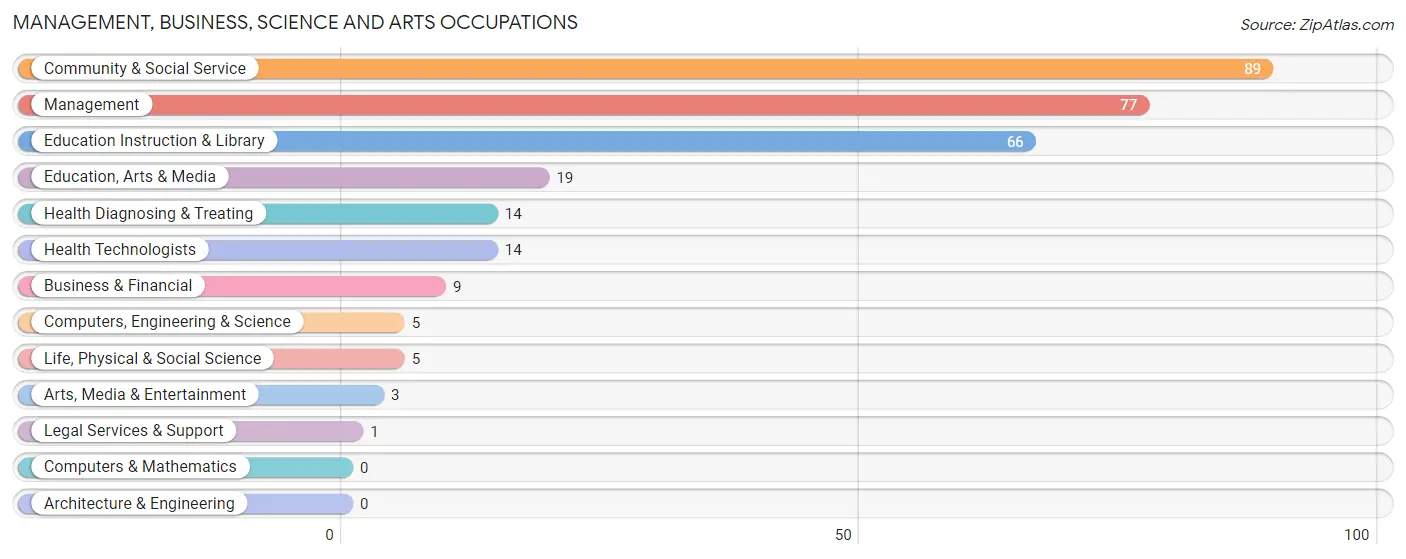
Management, Business, Science and Arts Occupations
The most common Management, Business, Science and Arts occupations in Goliad are Community & Social Service (89 | 13.2%), Management (77 | 11.4%), Education Instruction & Library (66 | 9.8%), Education, Arts & Media (19 | 2.8%), and Health Diagnosing & Treating (14 | 2.1%).
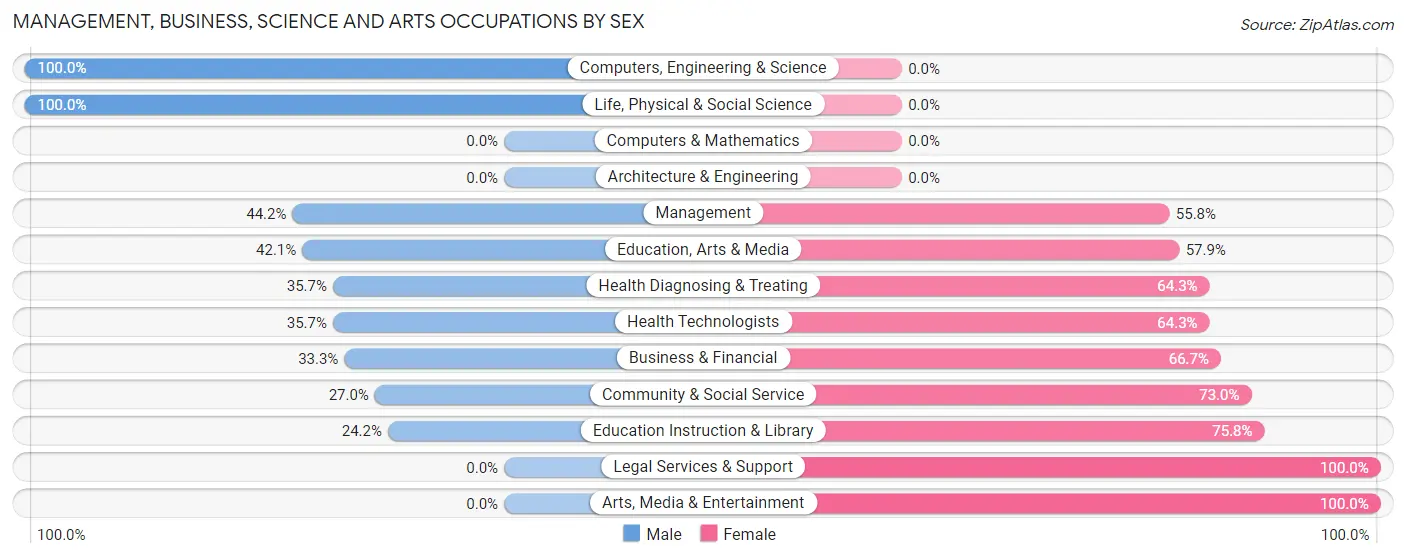
Management, Business, Science and Arts Occupations by Sex
Within the Management, Business, Science and Arts occupations in Goliad, the most male-oriented occupations are Computers, Engineering & Science (100.0%), Life, Physical & Social Science (100.0%), and Management (44.2%), while the most female-oriented occupations are Legal Services & Support (100.0%), Arts, Media & Entertainment (100.0%), and Education Instruction & Library (75.8%).
| Occupation | Male | Female |
| Management | 34 (44.2%) | 43 (55.8%) |
| Business & Financial | 3 (33.3%) | 6 (66.7%) |
| Computers, Engineering & Science | 5 (100.0%) | 0 (0.0%) |
| Computers & Mathematics | 0 (0.0%) | 0 (0.0%) |
| Architecture & Engineering | 0 (0.0%) | 0 (0.0%) |
| Life, Physical & Social Science | 5 (100.0%) | 0 (0.0%) |
| Community & Social Service | 24 (27.0%) | 65 (73.0%) |
| Education, Arts & Media | 8 (42.1%) | 11 (57.9%) |
| Legal Services & Support | 0 (0.0%) | 1 (100.0%) |
| Education Instruction & Library | 16 (24.2%) | 50 (75.8%) |
| Arts, Media & Entertainment | 0 (0.0%) | 3 (100.0%) |
| Health Diagnosing & Treating | 5 (35.7%) | 9 (64.3%) |
| Health Technologists | 5 (35.7%) | 9 (64.3%) |
| Total (Category) | 71 (36.6%) | 123 (63.4%) |
| Total (Overall) | 338 (50.2%) | 335 (49.8%) |
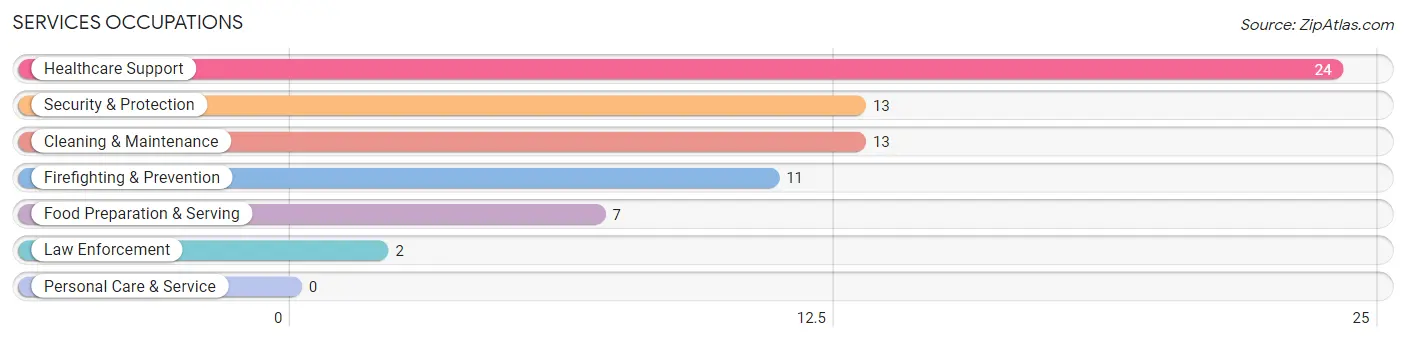
Services Occupations
The most common Services occupations in Goliad are Healthcare Support (24 | 3.6%), Security & Protection (13 | 1.9%), Cleaning & Maintenance (13 | 1.9%), Firefighting & Prevention (11 | 1.6%), and Food Preparation & Serving (7 | 1.0%).
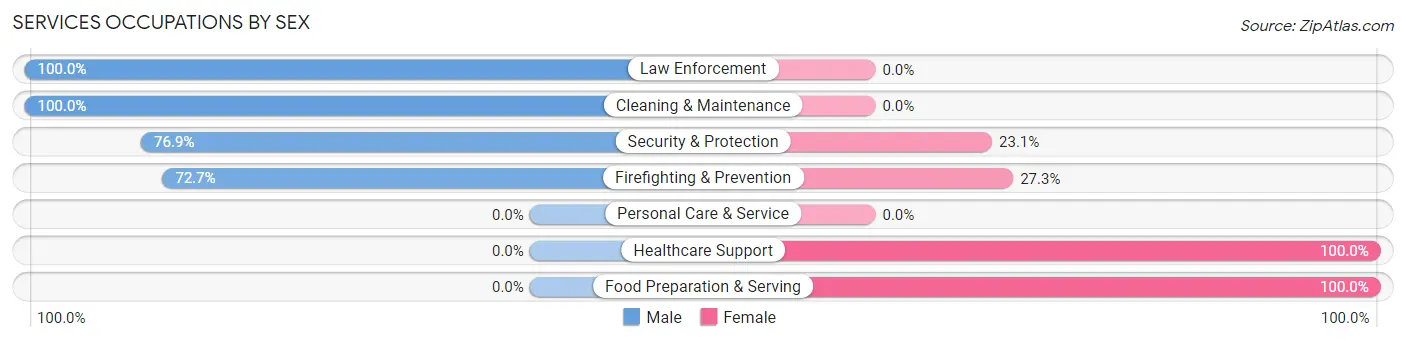
Services Occupations by Sex
Within the Services occupations in Goliad, the most male-oriented occupations are Law Enforcement (100.0%), Cleaning & Maintenance (100.0%), and Security & Protection (76.9%), while the most female-oriented occupations are Healthcare Support (100.0%), Food Preparation & Serving (100.0%), and Firefighting & Prevention (27.3%).
| Occupation | Male | Female |
| Healthcare Support | 0 (0.0%) | 24 (100.0%) |
| Security & Protection | 10 (76.9%) | 3 (23.1%) |
| Firefighting & Prevention | 8 (72.7%) | 3 (27.3%) |
| Law Enforcement | 2 (100.0%) | 0 (0.0%) |
| Food Preparation & Serving | 0 (0.0%) | 7 (100.0%) |
| Cleaning & Maintenance | 13 (100.0%) | 0 (0.0%) |
| Personal Care & Service | 0 (0.0%) | 0 (0.0%) |
| Total (Category) | 23 (40.4%) | 34 (59.7%) |
| Total (Overall) | 338 (50.2%) | 335 (49.8%) |
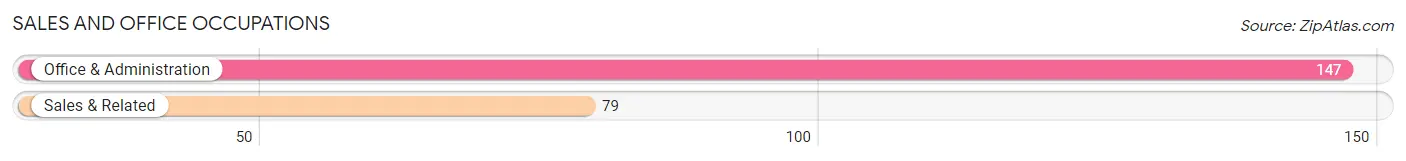
Sales and Office Occupations
The most common Sales and Office occupations in Goliad are Office & Administration (147 | 21.8%), and Sales & Related (79 | 11.7%).
Sales and Office Occupations by Sex
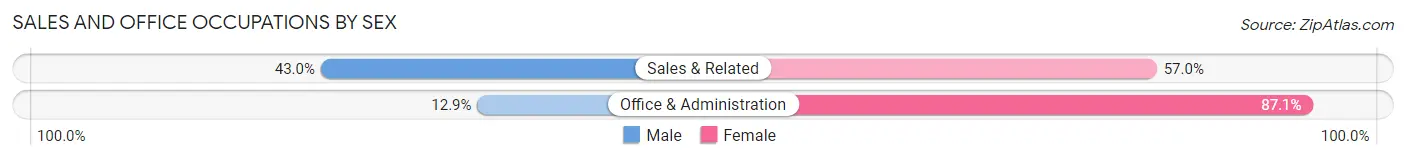
| Occupation | Male | Female |
| Sales & Related | 34 (43.0%) | 45 (57.0%) |
| Office & Administration | 19 (12.9%) | 128 (87.1%) |
| Total (Category) | 53 (23.4%) | 173 (76.5%) |
| Total (Overall) | 338 (50.2%) | 335 (49.8%) |
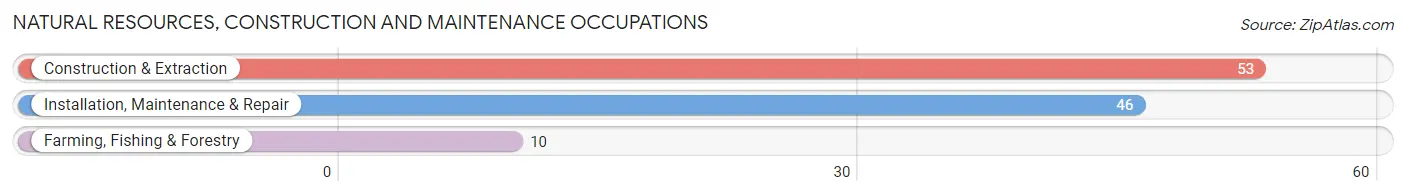
Natural Resources, Construction and Maintenance Occupations
The most common Natural Resources, Construction and Maintenance occupations in Goliad are Construction & Extraction (53 | 7.9%), Installation, Maintenance & Repair (46 | 6.8%), and Farming, Fishing & Forestry (10 | 1.5%).
Natural Resources, Construction and Maintenance Occupations by Sex
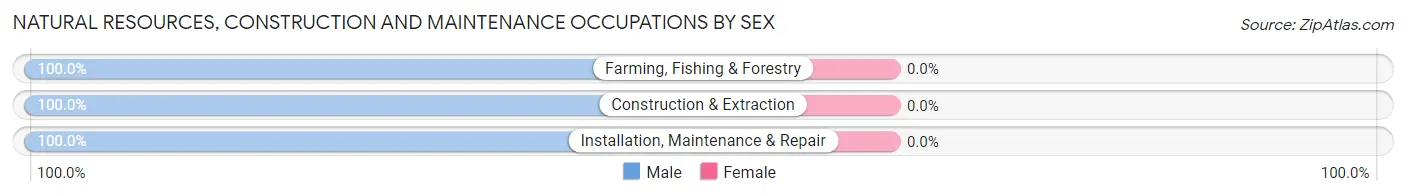
| Occupation | Male | Female |
| Farming, Fishing & Forestry | 10 (100.0%) | 0 (0.0%) |
| Construction & Extraction | 53 (100.0%) | 0 (0.0%) |
| Installation, Maintenance & Repair | 46 (100.0%) | 0 (0.0%) |
| Total (Category) | 109 (100.0%) | 0 (0.0%) |
| Total (Overall) | 338 (50.2%) | 335 (49.8%) |
Production, Transportation and Moving Occupations
The most common Production, Transportation and Moving occupations in Goliad are Transportation (40 | 5.9%), Material Moving (27 | 4.0%), and Production (20 | 3.0%).
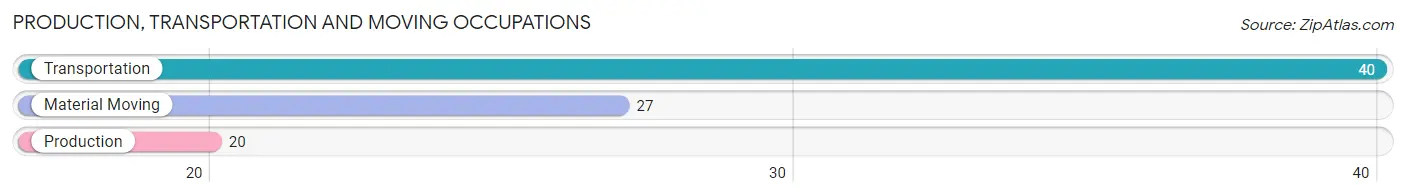
Production, Transportation and Moving Occupations by Sex
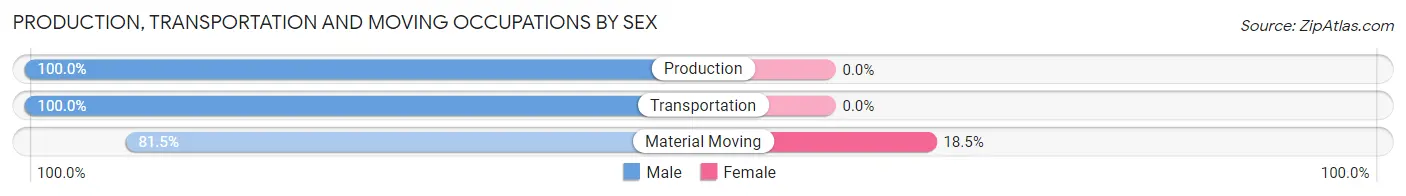
| Occupation | Male | Female |
| Production | 20 (100.0%) | 0 (0.0%) |
| Transportation | 40 (100.0%) | 0 (0.0%) |
| Material Moving | 22 (81.5%) | 5 (18.5%) |
| Total (Category) | 82 (94.3%) | 5 (5.8%) |
| Total (Overall) | 338 (50.2%) | 335 (49.8%) |
Employment Industries by Sex in Goliad
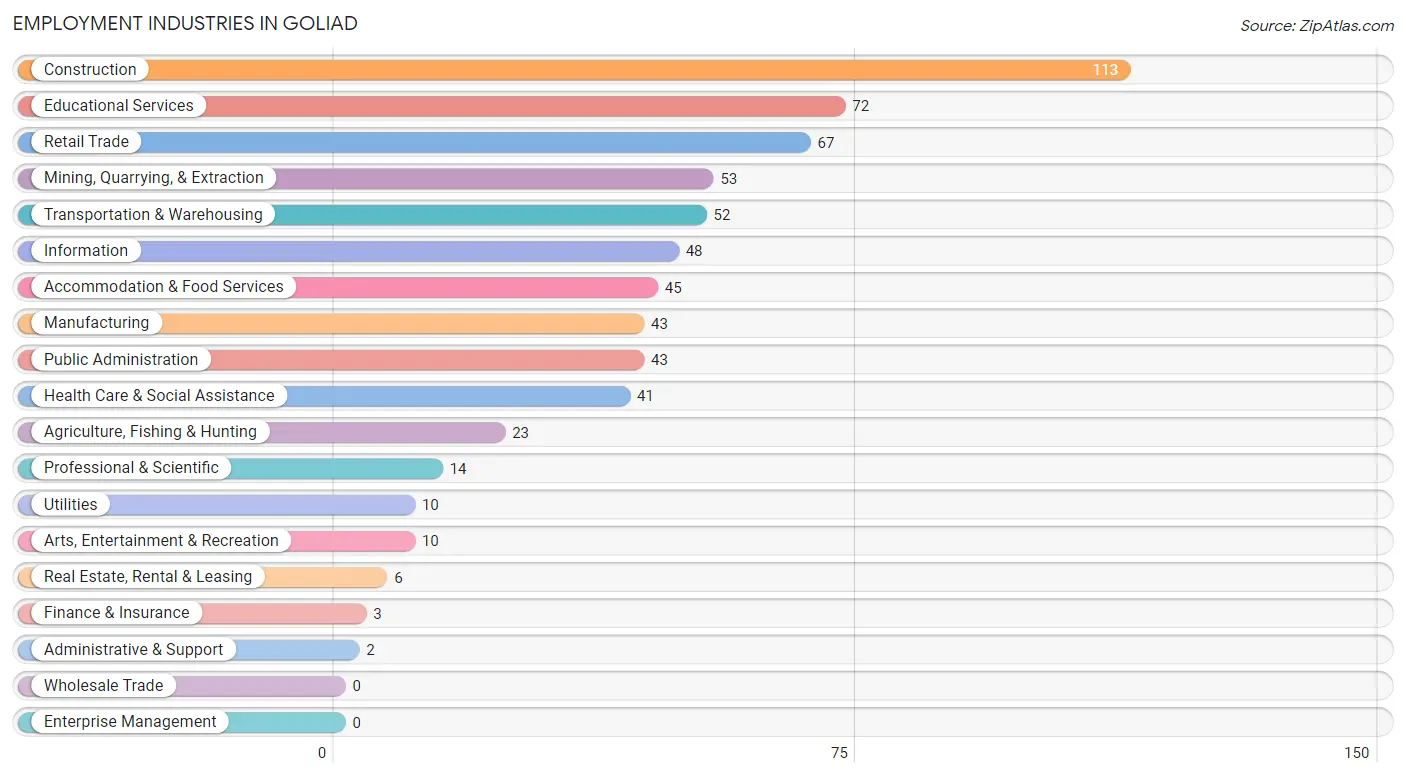
Employment Industries in Goliad
The major employment industries in Goliad include Construction (113 | 16.8%), Educational Services (72 | 10.7%), Retail Trade (67 | 10.0%), Mining, Quarrying, & Extraction (53 | 7.9%), and Transportation & Warehousing (52 | 7.7%).
Employment Industries by Sex in Goliad
The Goliad industries that see more men than women are Agriculture, Fishing & Hunting (100.0%), Manufacturing (100.0%), and Utilities (100.0%), whereas the industries that tend to have a higher number of women are Information (100.0%), Finance & Insurance (100.0%), and Professional & Scientific (100.0%).
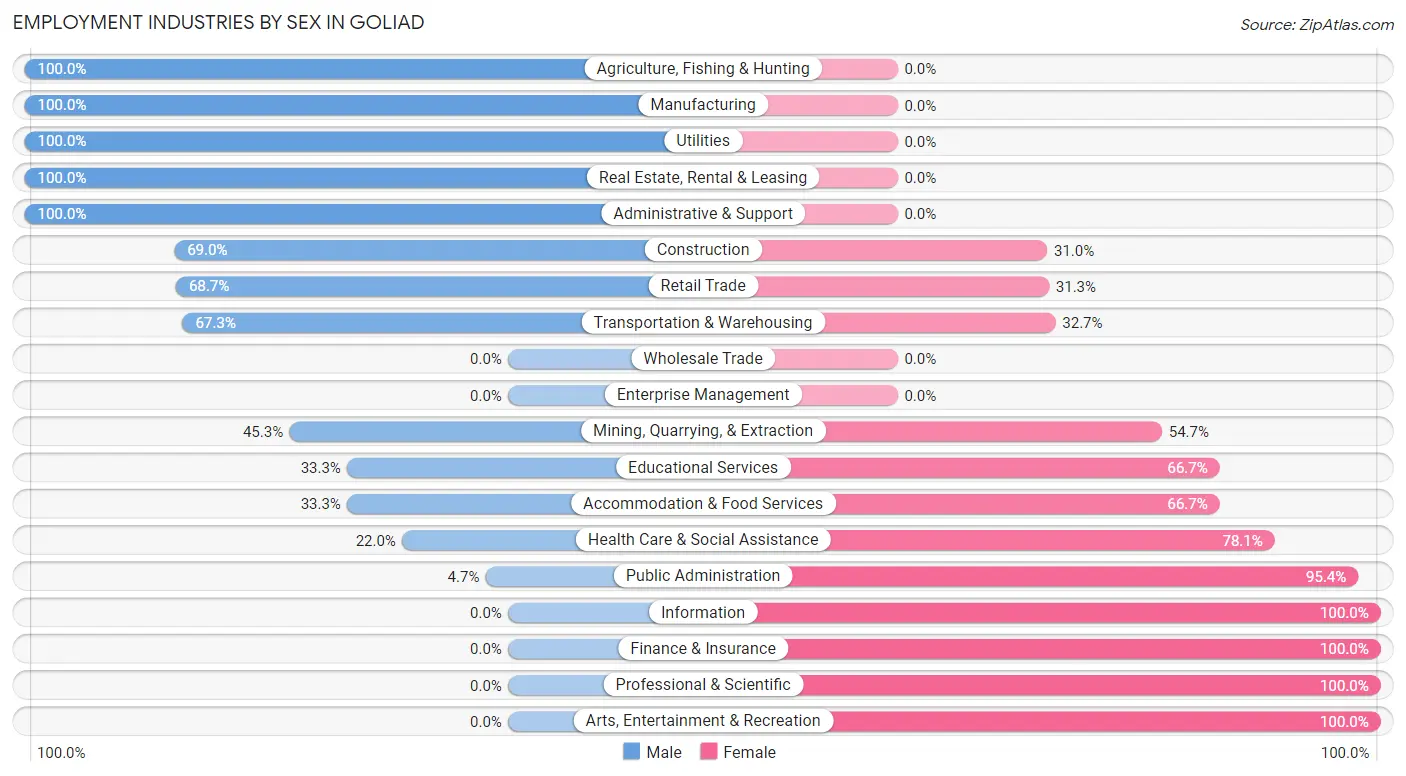
| Industry | Male | Female |
| Agriculture, Fishing & Hunting | 23 (100.0%) | 0 (0.0%) |
| Mining, Quarrying, & Extraction | 24 (45.3%) | 29 (54.7%) |
| Construction | 78 (69.0%) | 35 (31.0%) |
| Manufacturing | 43 (100.0%) | 0 (0.0%) |
| Wholesale Trade | 0 (0.0%) | 0 (0.0%) |
| Retail Trade | 46 (68.7%) | 21 (31.3%) |
| Transportation & Warehousing | 35 (67.3%) | 17 (32.7%) |
| Utilities | 10 (100.0%) | 0 (0.0%) |
| Information | 0 (0.0%) | 48 (100.0%) |
| Finance & Insurance | 0 (0.0%) | 3 (100.0%) |
| Real Estate, Rental & Leasing | 6 (100.0%) | 0 (0.0%) |
| Professional & Scientific | 0 (0.0%) | 14 (100.0%) |
| Enterprise Management | 0 (0.0%) | 0 (0.0%) |
| Administrative & Support | 2 (100.0%) | 0 (0.0%) |
| Educational Services | 24 (33.3%) | 48 (66.7%) |
| Health Care & Social Assistance | 9 (22.0%) | 32 (78.0%) |
| Arts, Entertainment & Recreation | 0 (0.0%) | 10 (100.0%) |
| Accommodation & Food Services | 15 (33.3%) | 30 (66.7%) |
| Public Administration | 2 (4.6%) | 41 (95.4%) |
| Total | 338 (50.2%) | 335 (49.8%) |
Education in Goliad
School Enrollment in Goliad
The most common levels of schooling among the 473 students in Goliad are high school (137 | 29.0%), middle school (118 | 24.9%), and elementary school (102 | 21.6%).
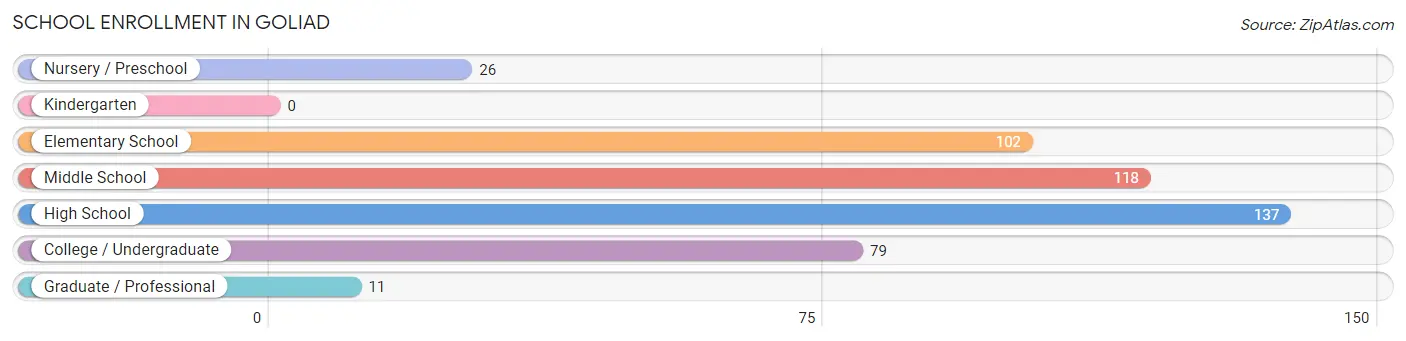
| School Level | # Students | % Students |
| Nursery / Preschool | 26 | 5.5% |
| Kindergarten | 0 | 0.0% |
| Elementary School | 102 | 21.6% |
| Middle School | 118 | 24.9% |
| High School | 137 | 29.0% |
| College / Undergraduate | 79 | 16.7% |
| Graduate / Professional | 11 | 2.3% |
| Total | 473 | 100.0% |
School Enrollment by Age by Funding Source in Goliad
Out of a total of 473 students who are enrolled in schools in Goliad, 41 (8.7%) attend a private institution, while the remaining 432 (91.3%) are enrolled in public schools. The age group of 18 to 19 year olds has the highest likelihood of being enrolled in private schools, with 13 (100.0% in the age bracket) enrolled. Conversely, the age group of 3 to 4 year olds has the lowest likelihood of being enrolled in a private school, with 5 (100.0% in the age bracket) attending a public institution.
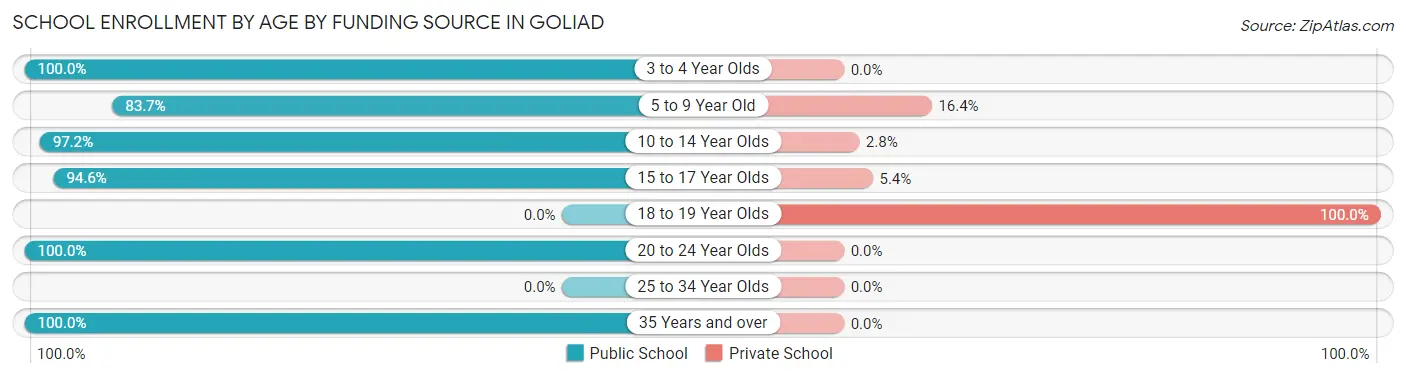
| Age Bracket | Public School | Private School |
| 3 to 4 Year Olds | 5 (100.0%) | 0 (0.0%) |
| 5 to 9 Year Old | 87 (83.7%) | 17 (16.4%) |
| 10 to 14 Year Olds | 137 (97.2%) | 4 (2.8%) |
| 15 to 17 Year Olds | 123 (94.6%) | 7 (5.4%) |
| 18 to 19 Year Olds | 0 (0.0%) | 13 (100.0%) |
| 20 to 24 Year Olds | 69 (100.0%) | 0 (0.0%) |
| 25 to 34 Year Olds | 0 (0.0%) | 0 (0.0%) |
| 35 Years and over | 11 (100.0%) | 0 (0.0%) |
| Total | 432 (91.3%) | 41 (8.7%) |
Educational Attainment by Field of Study in Goliad
Education (69 | 31.4%), business (47 | 21.4%), bio, nature & agricultural (22 | 10.0%), liberal arts & history (18 | 8.2%), and social sciences (16 | 7.3%) are the most common fields of study among 220 individuals in Goliad who have obtained a bachelor's degree or higher.
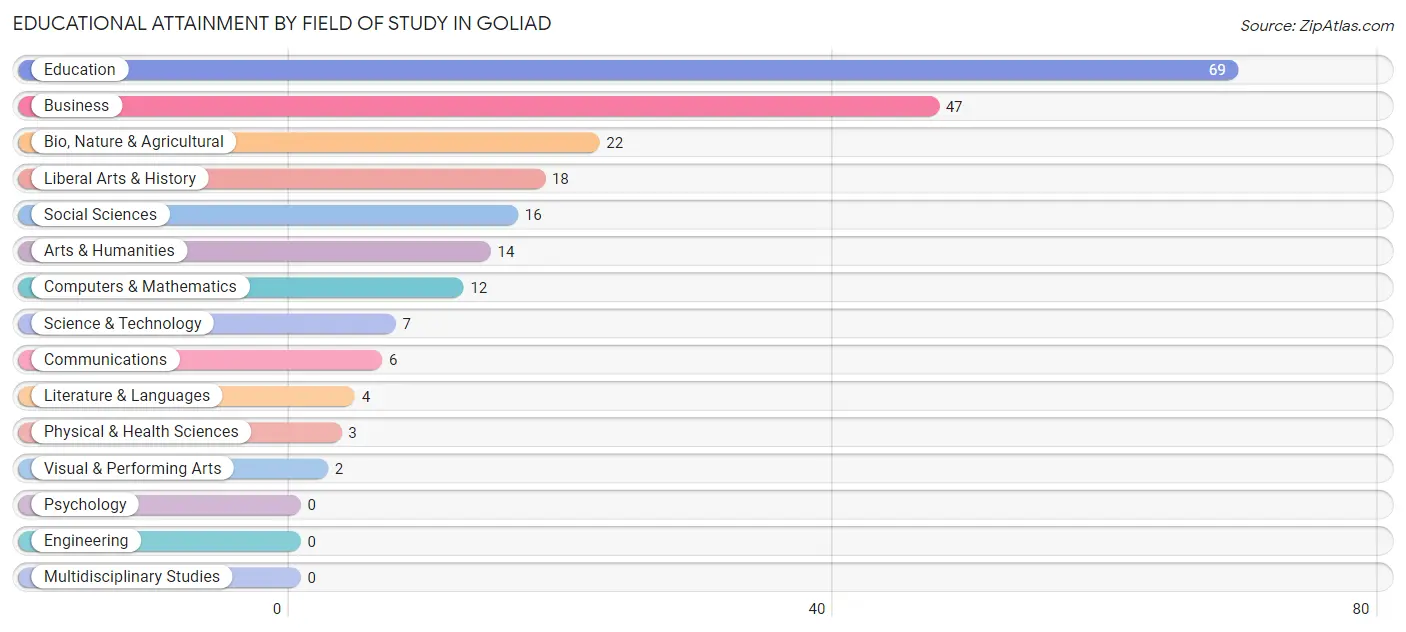
| Field of Study | # Graduates | % Graduates |
| Computers & Mathematics | 12 | 5.4% |
| Bio, Nature & Agricultural | 22 | 10.0% |
| Physical & Health Sciences | 3 | 1.4% |
| Psychology | 0 | 0.0% |
| Social Sciences | 16 | 7.3% |
| Engineering | 0 | 0.0% |
| Multidisciplinary Studies | 0 | 0.0% |
| Science & Technology | 7 | 3.2% |
| Business | 47 | 21.4% |
| Education | 69 | 31.4% |
| Literature & Languages | 4 | 1.8% |
| Liberal Arts & History | 18 | 8.2% |
| Visual & Performing Arts | 2 | 0.9% |
| Communications | 6 | 2.7% |
| Arts & Humanities | 14 | 6.4% |
| Total | 220 | 100.0% |
Transportation & Commute in Goliad
Vehicle Availability by Sex in Goliad
The most prevalent vehicle ownership categories in Goliad are males with 2 vehicles (128, accounting for 37.9%) and females with 2 vehicles (156, making up 38.2%).
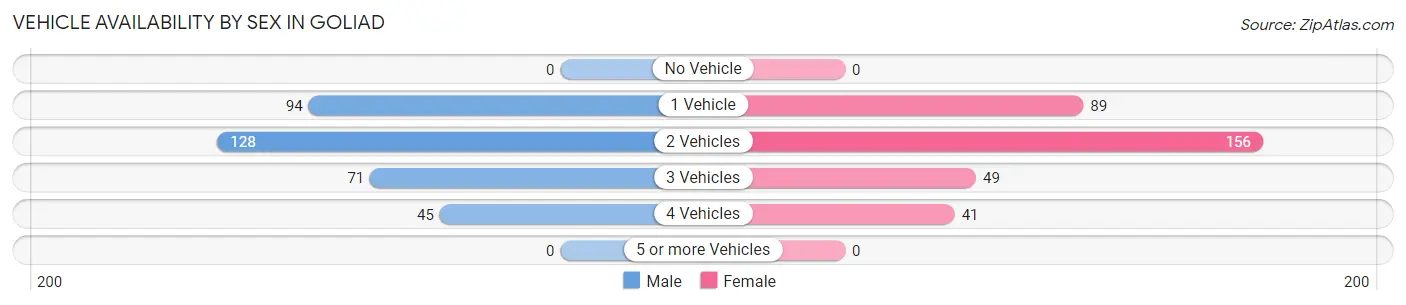
| Vehicles Available | Male | Female |
| No Vehicle | 0 (0.0%) | 0 (0.0%) |
| 1 Vehicle | 94 (27.8%) | 89 (26.6%) |
| 2 Vehicles | 128 (37.9%) | 156 (46.6%) |
| 3 Vehicles | 71 (21.0%) | 49 (14.6%) |
| 4 Vehicles | 45 (13.3%) | 41 (12.2%) |
| 5 or more Vehicles | 0 (0.0%) | 0 (0.0%) |
| Total | 338 (100.0%) | 335 (100.0%) |
Commute Time in Goliad
The most frequently occuring commute durations in Goliad are 30 to 34 minutes (180 commuters, 30.2%), 5 to 9 minutes (161 commuters, 27.0%), and less than 5 minutes (96 commuters, 16.1%).
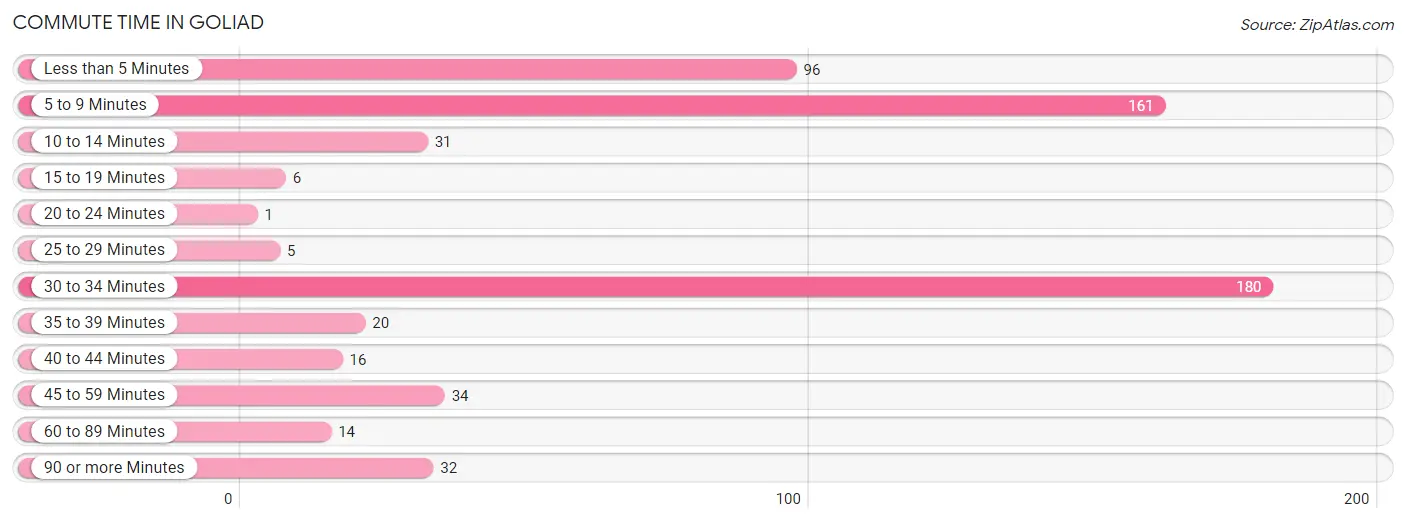
| Commute Time | # Commuters | % Commuters |
| Less than 5 Minutes | 96 | 16.1% |
| 5 to 9 Minutes | 161 | 27.0% |
| 10 to 14 Minutes | 31 | 5.2% |
| 15 to 19 Minutes | 6 | 1.0% |
| 20 to 24 Minutes | 1 | 0.2% |
| 25 to 29 Minutes | 5 | 0.8% |
| 30 to 34 Minutes | 180 | 30.2% |
| 35 to 39 Minutes | 20 | 3.4% |
| 40 to 44 Minutes | 16 | 2.7% |
| 45 to 59 Minutes | 34 | 5.7% |
| 60 to 89 Minutes | 14 | 2.4% |
| 90 or more Minutes | 32 | 5.4% |
Commute Time by Sex in Goliad
The most common commute times in Goliad are 30 to 34 minutes (121 commuters, 39.2%) for males and 5 to 9 minutes (111 commuters, 38.7%) for females.
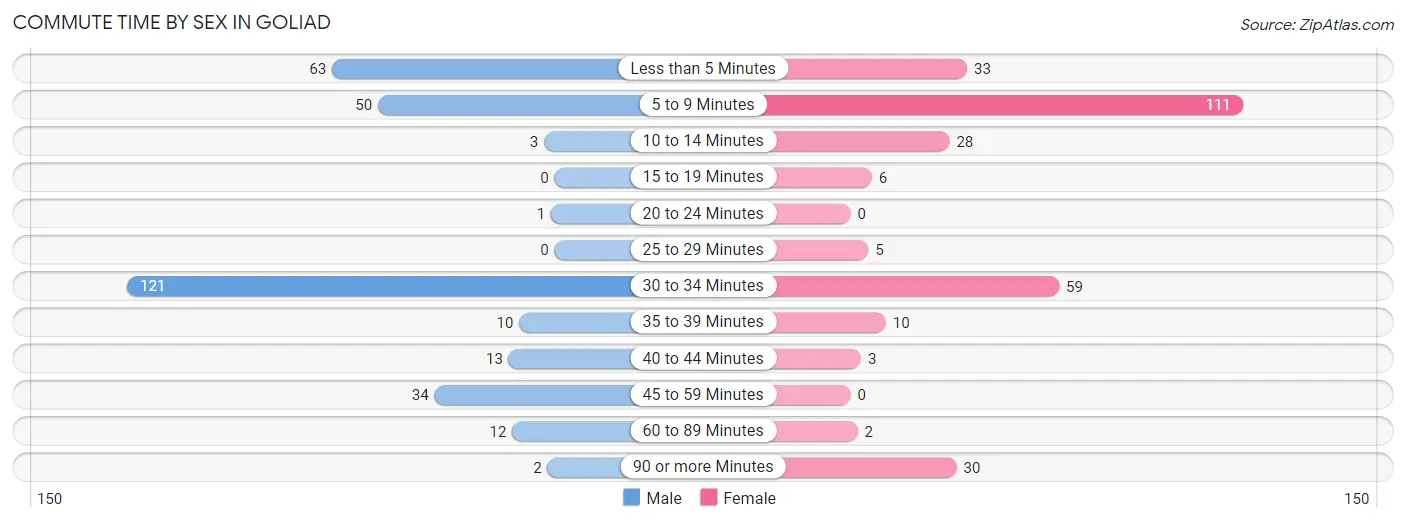
| Commute Time | Male | Female |
| Less than 5 Minutes | 63 (20.4%) | 33 (11.5%) |
| 5 to 9 Minutes | 50 (16.2%) | 111 (38.7%) |
| 10 to 14 Minutes | 3 (1.0%) | 28 (9.8%) |
| 15 to 19 Minutes | 0 (0.0%) | 6 (2.1%) |
| 20 to 24 Minutes | 1 (0.3%) | 0 (0.0%) |
| 25 to 29 Minutes | 0 (0.0%) | 5 (1.7%) |
| 30 to 34 Minutes | 121 (39.2%) | 59 (20.6%) |
| 35 to 39 Minutes | 10 (3.2%) | 10 (3.5%) |
| 40 to 44 Minutes | 13 (4.2%) | 3 (1.1%) |
| 45 to 59 Minutes | 34 (11.0%) | 0 (0.0%) |
| 60 to 89 Minutes | 12 (3.9%) | 2 (0.7%) |
| 90 or more Minutes | 2 (0.6%) | 30 (10.4%) |
Time of Departure to Work by Sex in Goliad
The most frequent times of departure to work in Goliad are 7:30 AM to 7:59 AM (58, 18.8%) for males and 7:30 AM to 7:59 AM (76, 26.5%) for females.
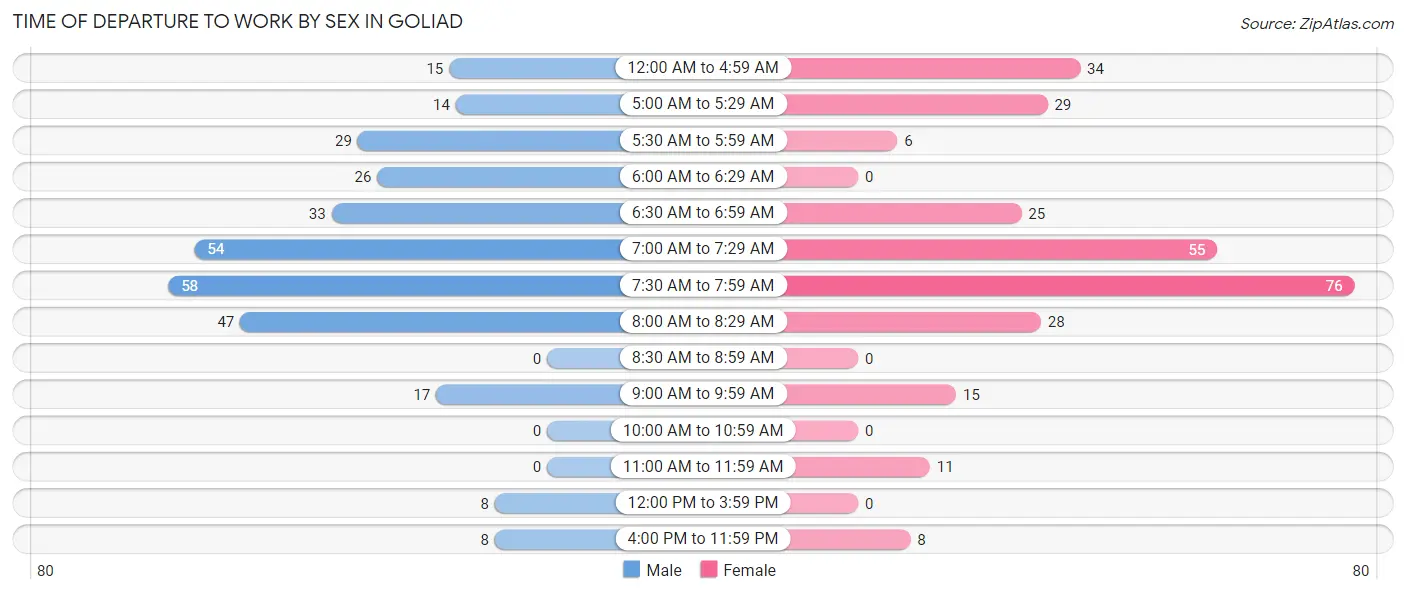
| Time of Departure | Male | Female |
| 12:00 AM to 4:59 AM | 15 (4.9%) | 34 (11.8%) |
| 5:00 AM to 5:29 AM | 14 (4.5%) | 29 (10.1%) |
| 5:30 AM to 5:59 AM | 29 (9.4%) | 6 (2.1%) |
| 6:00 AM to 6:29 AM | 26 (8.4%) | 0 (0.0%) |
| 6:30 AM to 6:59 AM | 33 (10.7%) | 25 (8.7%) |
| 7:00 AM to 7:29 AM | 54 (17.5%) | 55 (19.2%) |
| 7:30 AM to 7:59 AM | 58 (18.8%) | 76 (26.5%) |
| 8:00 AM to 8:29 AM | 47 (15.2%) | 28 (9.8%) |
| 8:30 AM to 8:59 AM | 0 (0.0%) | 0 (0.0%) |
| 9:00 AM to 9:59 AM | 17 (5.5%) | 15 (5.2%) |
| 10:00 AM to 10:59 AM | 0 (0.0%) | 0 (0.0%) |
| 11:00 AM to 11:59 AM | 0 (0.0%) | 11 (3.8%) |
| 12:00 PM to 3:59 PM | 8 (2.6%) | 0 (0.0%) |
| 4:00 PM to 11:59 PM | 8 (2.6%) | 8 (2.8%) |
| Total | 309 (100.0%) | 287 (100.0%) |
Housing Occupancy in Goliad
Occupancy by Ownership in Goliad
Of the total 692 dwellings in Goliad, owner-occupied units account for 471 (68.1%), while renter-occupied units make up 221 (31.9%).
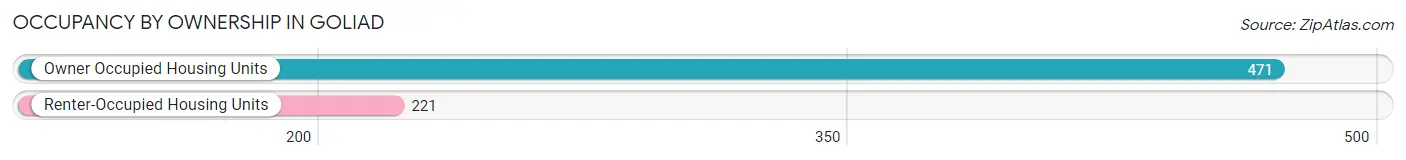
| Occupancy | # Housing Units | % Housing Units |
| Owner Occupied Housing Units | 471 | 68.1% |
| Renter-Occupied Housing Units | 221 | 31.9% |
| Total Occupied Housing Units | 692 | 100.0% |
Occupancy by Household Size in Goliad
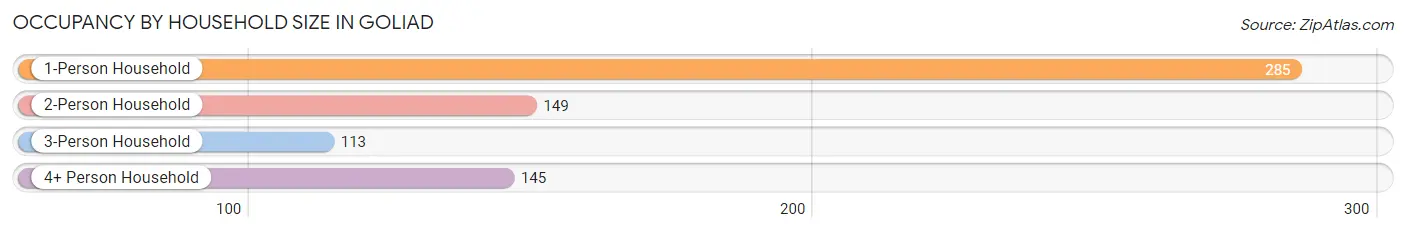
| Household Size | # Housing Units | % Housing Units |
| 1-Person Household | 285 | 41.2% |
| 2-Person Household | 149 | 21.5% |
| 3-Person Household | 113 | 16.3% |
| 4+ Person Household | 145 | 20.9% |
| Total Housing Units | 692 | 100.0% |
Occupancy by Ownership by Household Size in Goliad
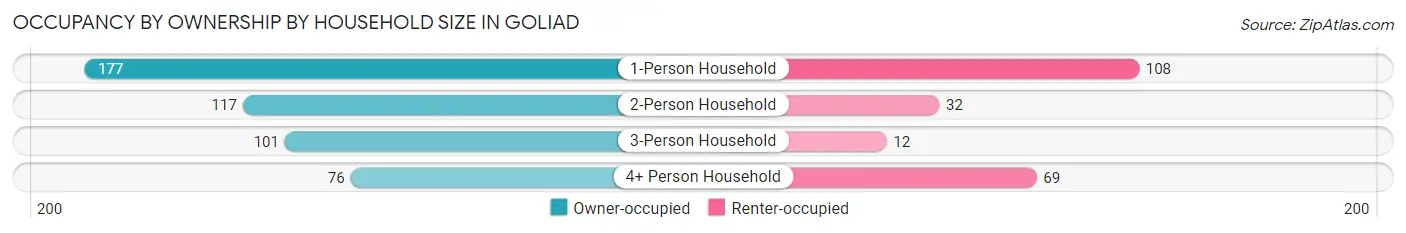
| Household Size | Owner-occupied | Renter-occupied |
| 1-Person Household | 177 (62.1%) | 108 (37.9%) |
| 2-Person Household | 117 (78.5%) | 32 (21.5%) |
| 3-Person Household | 101 (89.4%) | 12 (10.6%) |
| 4+ Person Household | 76 (52.4%) | 69 (47.6%) |
| Total Housing Units | 471 (68.1%) | 221 (31.9%) |
Occupancy by Educational Attainment in Goliad
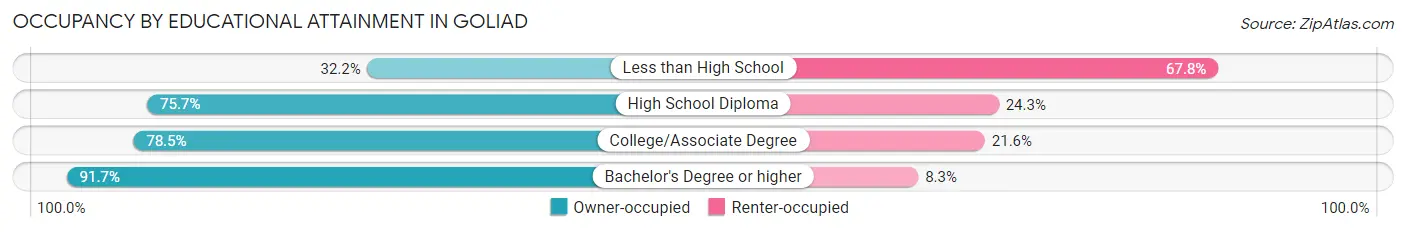
| Household Size | Owner-occupied | Renter-occupied |
| Less than High School | 57 (32.2%) | 120 (67.8%) |
| High School Diploma | 162 (75.7%) | 52 (24.3%) |
| College/Associate Degree | 142 (78.4%) | 39 (21.5%) |
| Bachelor's Degree or higher | 110 (91.7%) | 10 (8.3%) |
Occupancy by Age of Householder in Goliad
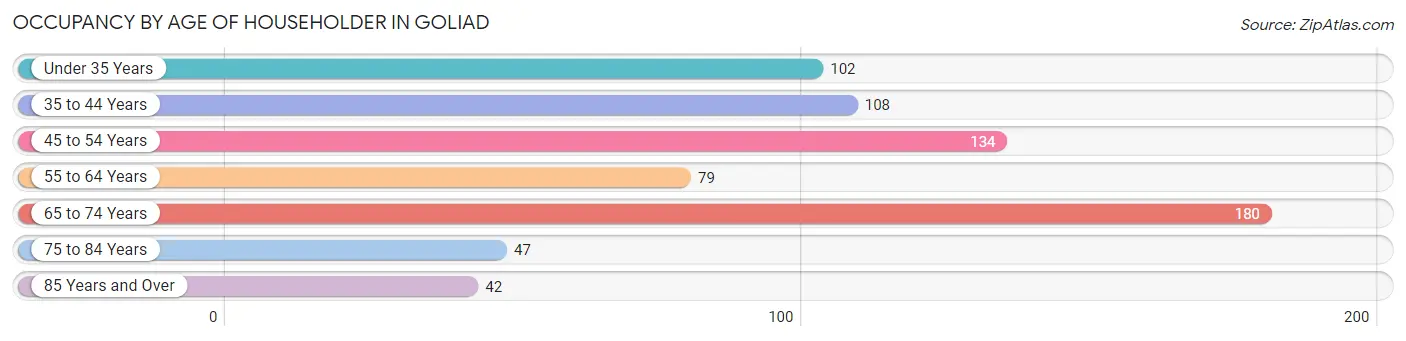
| Age Bracket | # Households | % Households |
| Under 35 Years | 102 | 14.7% |
| 35 to 44 Years | 108 | 15.6% |
| 45 to 54 Years | 134 | 19.4% |
| 55 to 64 Years | 79 | 11.4% |
| 65 to 74 Years | 180 | 26.0% |
| 75 to 84 Years | 47 | 6.8% |
| 85 Years and Over | 42 | 6.1% |
| Total | 692 | 100.0% |
Housing Finances in Goliad
Median Income by Occupancy in Goliad
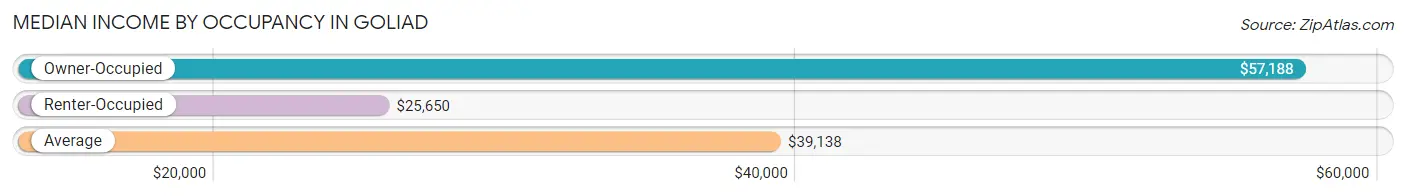
| Occupancy Type | # Households | Median Income |
| Owner-Occupied | 471 (68.1%) | $57,188 |
| Renter-Occupied | 221 (31.9%) | $25,650 |
| Average | 692 (100.0%) | $39,138 |
Occupancy by Householder Income Bracket in Goliad
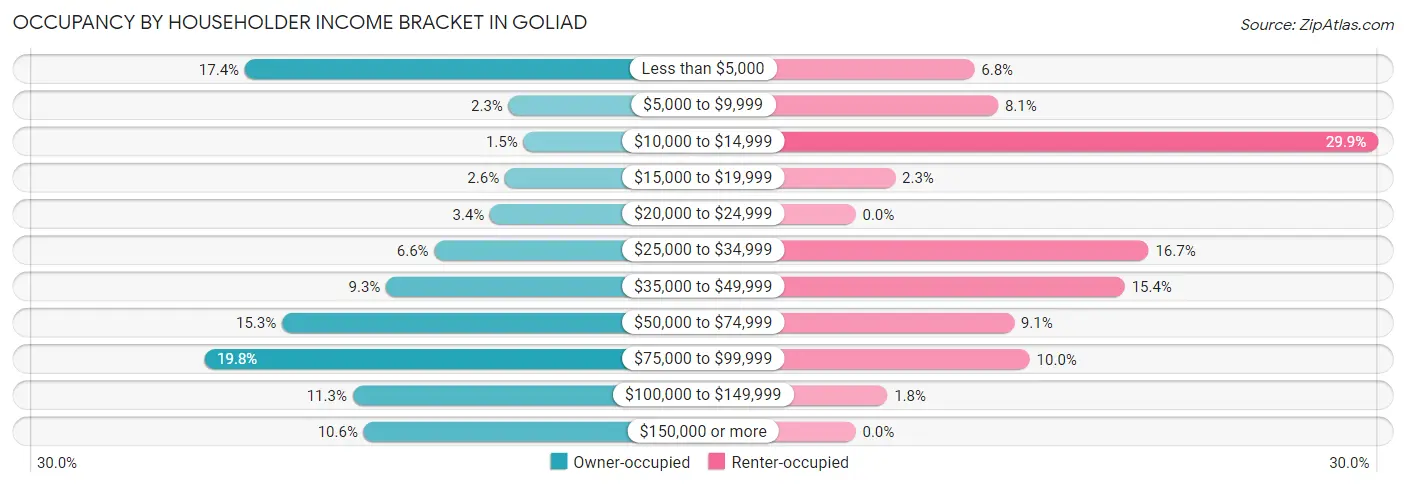
| Income Bracket | Owner-occupied | Renter-occupied |
| Less than $5,000 | 82 (17.4%) | 15 (6.8%) |
| $5,000 to $9,999 | 11 (2.3%) | 18 (8.1%) |
| $10,000 to $14,999 | 7 (1.5%) | 66 (29.9%) |
| $15,000 to $19,999 | 12 (2.5%) | 5 (2.3%) |
| $20,000 to $24,999 | 16 (3.4%) | 0 (0.0%) |
| $25,000 to $34,999 | 31 (6.6%) | 37 (16.7%) |
| $35,000 to $49,999 | 44 (9.3%) | 34 (15.4%) |
| $50,000 to $74,999 | 72 (15.3%) | 20 (9.0%) |
| $75,000 to $99,999 | 93 (19.8%) | 22 (10.0%) |
| $100,000 to $149,999 | 53 (11.3%) | 4 (1.8%) |
| $150,000 or more | 50 (10.6%) | 0 (0.0%) |
| Total | 471 (100.0%) | 221 (100.0%) |
Monthly Housing Cost Tiers in Goliad
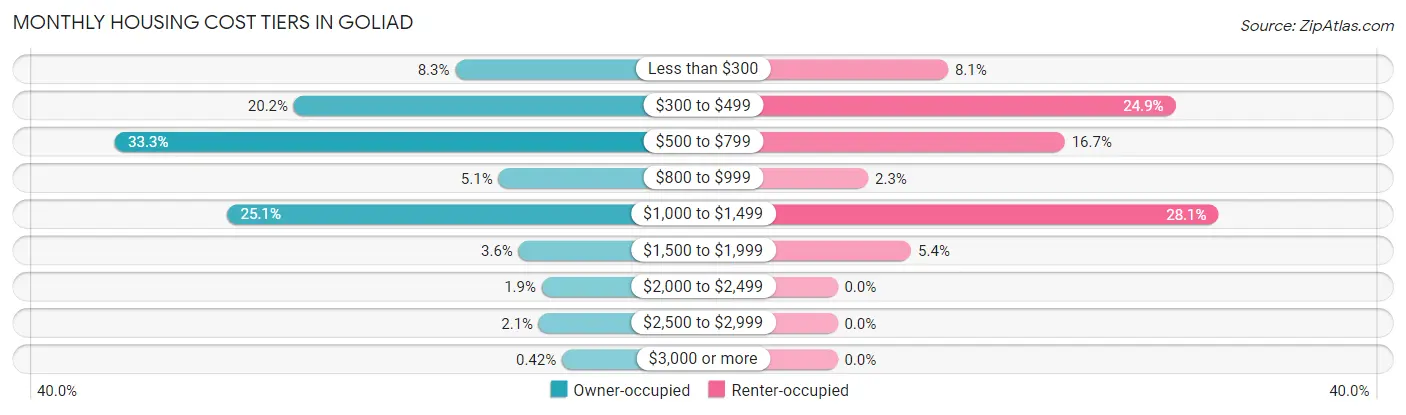
| Monthly Cost | Owner-occupied | Renter-occupied |
| Less than $300 | 39 (8.3%) | 18 (8.1%) |
| $300 to $499 | 95 (20.2%) | 55 (24.9%) |
| $500 to $799 | 157 (33.3%) | 37 (16.7%) |
| $800 to $999 | 24 (5.1%) | 5 (2.3%) |
| $1,000 to $1,499 | 118 (25.1%) | 62 (28.1%) |
| $1,500 to $1,999 | 17 (3.6%) | 12 (5.4%) |
| $2,000 to $2,499 | 9 (1.9%) | 0 (0.0%) |
| $2,500 to $2,999 | 10 (2.1%) | 0 (0.0%) |
| $3,000 or more | 2 (0.4%) | 0 (0.0%) |
| Total | 471 (100.0%) | 221 (100.0%) |
Physical Housing Characteristics in Goliad
Housing Structures in Goliad
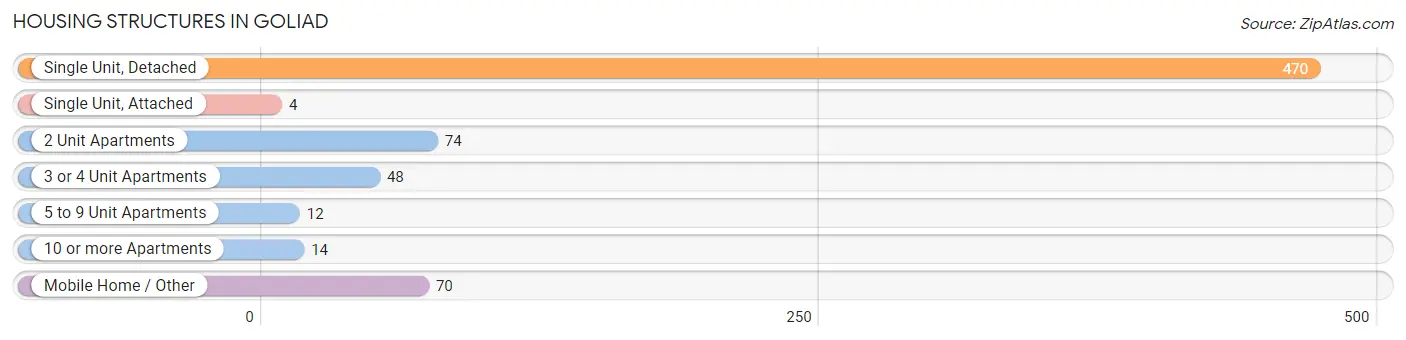
| Structure Type | # Housing Units | % Housing Units |
| Single Unit, Detached | 470 | 67.9% |
| Single Unit, Attached | 4 | 0.6% |
| 2 Unit Apartments | 74 | 10.7% |
| 3 or 4 Unit Apartments | 48 | 6.9% |
| 5 to 9 Unit Apartments | 12 | 1.7% |
| 10 or more Apartments | 14 | 2.0% |
| Mobile Home / Other | 70 | 10.1% |
| Total | 692 | 100.0% |
Housing Structures by Occupancy in Goliad
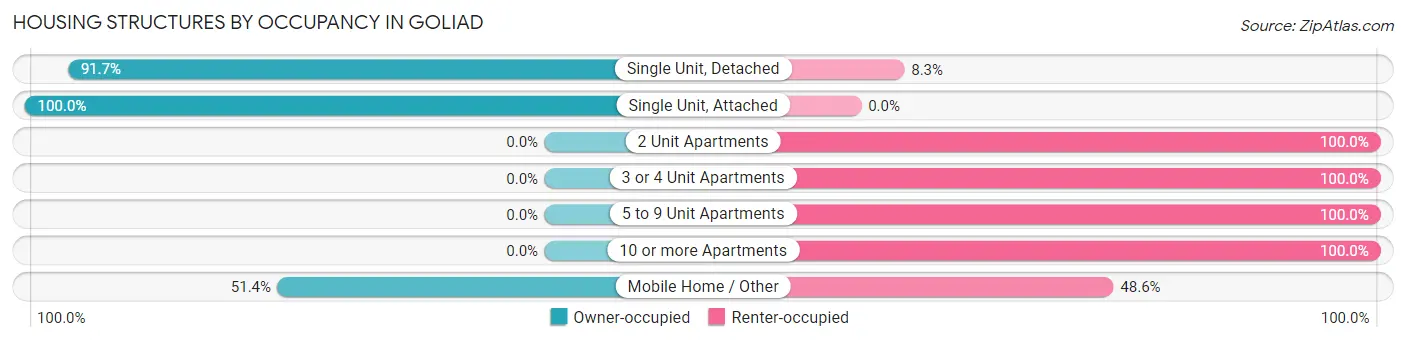
| Structure Type | Owner-occupied | Renter-occupied |
| Single Unit, Detached | 431 (91.7%) | 39 (8.3%) |
| Single Unit, Attached | 4 (100.0%) | 0 (0.0%) |
| 2 Unit Apartments | 0 (0.0%) | 74 (100.0%) |
| 3 or 4 Unit Apartments | 0 (0.0%) | 48 (100.0%) |
| 5 to 9 Unit Apartments | 0 (0.0%) | 12 (100.0%) |
| 10 or more Apartments | 0 (0.0%) | 14 (100.0%) |
| Mobile Home / Other | 36 (51.4%) | 34 (48.6%) |
| Total | 471 (68.1%) | 221 (31.9%) |
Housing Structures by Number of Rooms in Goliad
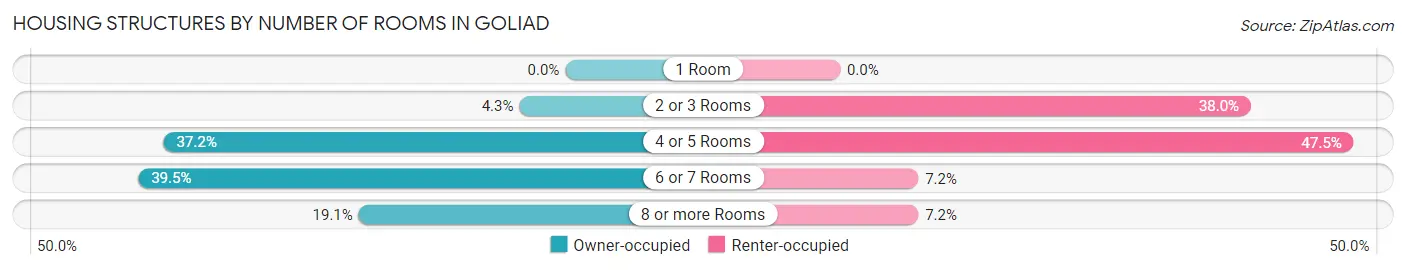
| Number of Rooms | Owner-occupied | Renter-occupied |
| 1 Room | 0 (0.0%) | 0 (0.0%) |
| 2 or 3 Rooms | 20 (4.3%) | 84 (38.0%) |
| 4 or 5 Rooms | 175 (37.1%) | 105 (47.5%) |
| 6 or 7 Rooms | 186 (39.5%) | 16 (7.2%) |
| 8 or more Rooms | 90 (19.1%) | 16 (7.2%) |
| Total | 471 (100.0%) | 221 (100.0%) |
Housing Structure by Heating Type in Goliad
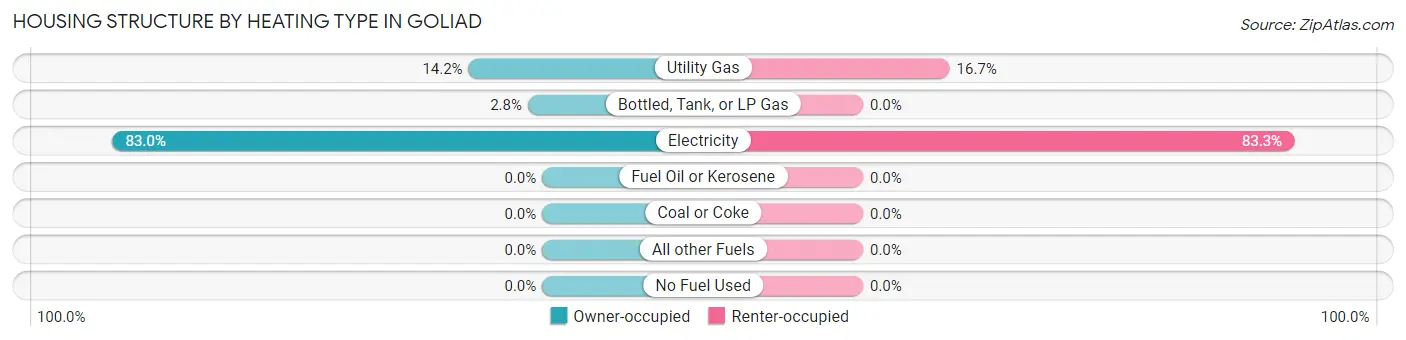
| Heating Type | Owner-occupied | Renter-occupied |
| Utility Gas | 67 (14.2%) | 37 (16.7%) |
| Bottled, Tank, or LP Gas | 13 (2.8%) | 0 (0.0%) |
| Electricity | 391 (83.0%) | 184 (83.3%) |
| Fuel Oil or Kerosene | 0 (0.0%) | 0 (0.0%) |
| Coal or Coke | 0 (0.0%) | 0 (0.0%) |
| All other Fuels | 0 (0.0%) | 0 (0.0%) |
| No Fuel Used | 0 (0.0%) | 0 (0.0%) |
| Total | 471 (100.0%) | 221 (100.0%) |
Household Vehicle Usage in Goliad
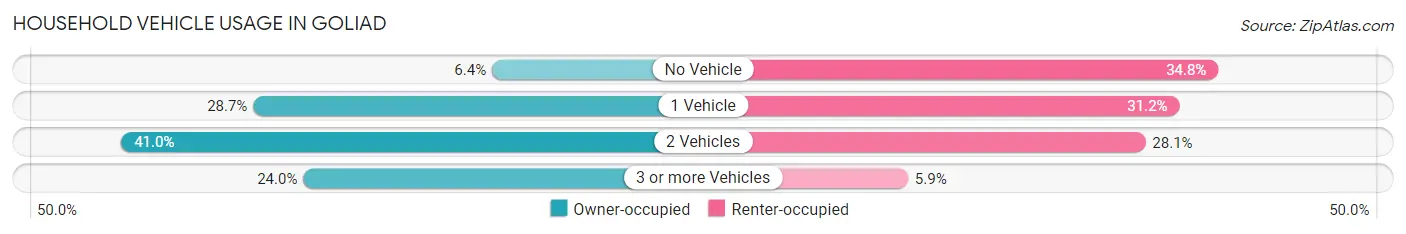
| Vehicles per Household | Owner-occupied | Renter-occupied |
| No Vehicle | 30 (6.4%) | 77 (34.8%) |
| 1 Vehicle | 135 (28.7%) | 69 (31.2%) |
| 2 Vehicles | 193 (41.0%) | 62 (28.1%) |
| 3 or more Vehicles | 113 (24.0%) | 13 (5.9%) |
| Total | 471 (100.0%) | 221 (100.0%) |
Real Estate & Mortgages in Goliad
Real Estate and Mortgage Overview in Goliad
| Characteristic | Without Mortgage | With Mortgage |
| Housing Units | 317 | 154 |
| Median Property Value | $187,100 | $161,800 |
| Median Household Income | $51,250 | $35 |
| Monthly Housing Costs | $584 | $2 |
| Real Estate Taxes | $2,141 | $8 |
Property Value by Mortgage Status in Goliad
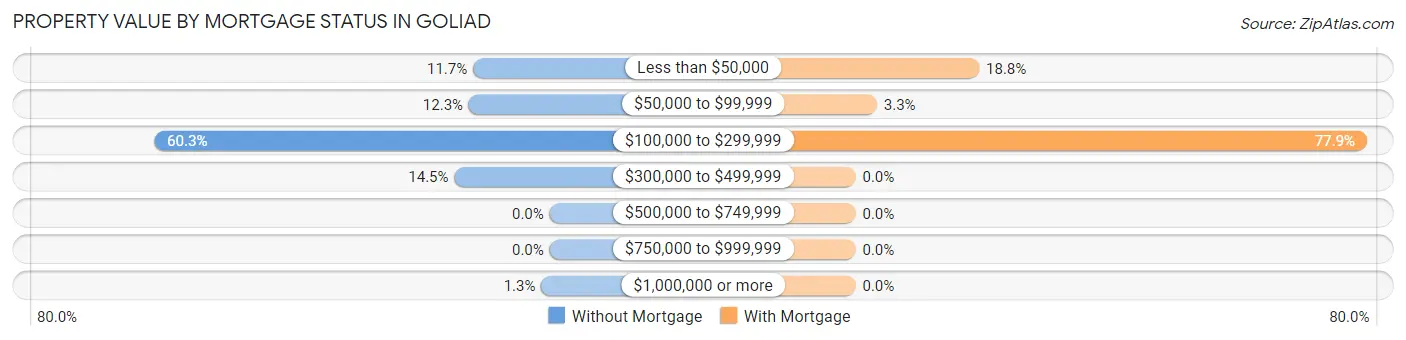
| Property Value | Without Mortgage | With Mortgage |
| Less than $50,000 | 37 (11.7%) | 29 (18.8%) |
| $50,000 to $99,999 | 39 (12.3%) | 5 (3.3%) |
| $100,000 to $299,999 | 191 (60.3%) | 120 (77.9%) |
| $300,000 to $499,999 | 46 (14.5%) | 0 (0.0%) |
| $500,000 to $749,999 | 0 (0.0%) | 0 (0.0%) |
| $750,000 to $999,999 | 0 (0.0%) | 0 (0.0%) |
| $1,000,000 or more | 4 (1.3%) | 0 (0.0%) |
| Total | 317 (100.0%) | 154 (100.0%) |
Household Income by Mortgage Status in Goliad
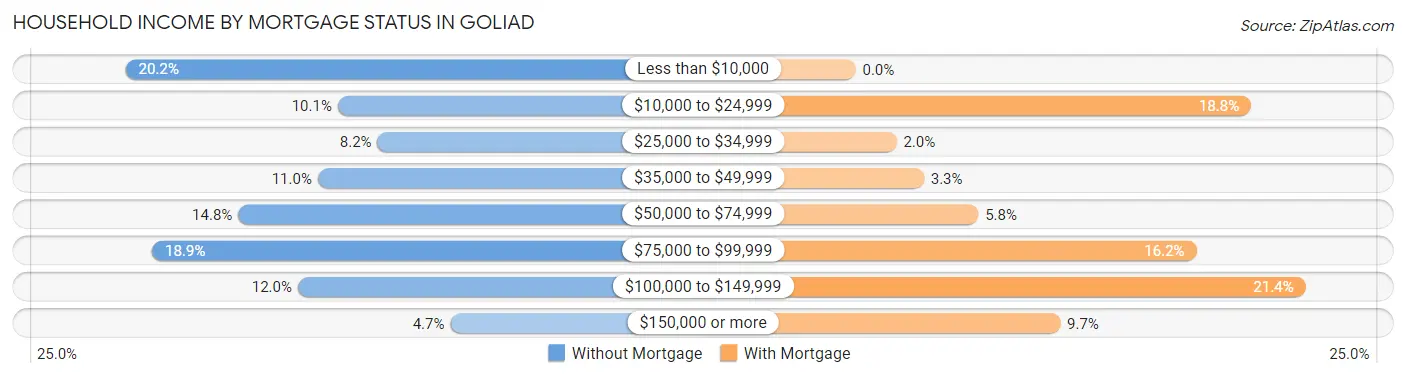
| Household Income | Without Mortgage | With Mortgage |
| Less than $10,000 | 64 (20.2%) | 0 (0.0%) |
| $10,000 to $24,999 | 32 (10.1%) | 29 (18.8%) |
| $25,000 to $34,999 | 26 (8.2%) | 3 (1.9%) |
| $35,000 to $49,999 | 35 (11.0%) | 5 (3.3%) |
| $50,000 to $74,999 | 47 (14.8%) | 9 (5.8%) |
| $75,000 to $99,999 | 60 (18.9%) | 25 (16.2%) |
| $100,000 to $149,999 | 38 (12.0%) | 33 (21.4%) |
| $150,000 or more | 15 (4.7%) | 15 (9.7%) |
| Total | 317 (100.0%) | 154 (100.0%) |
Property Value to Household Income Ratio in Goliad
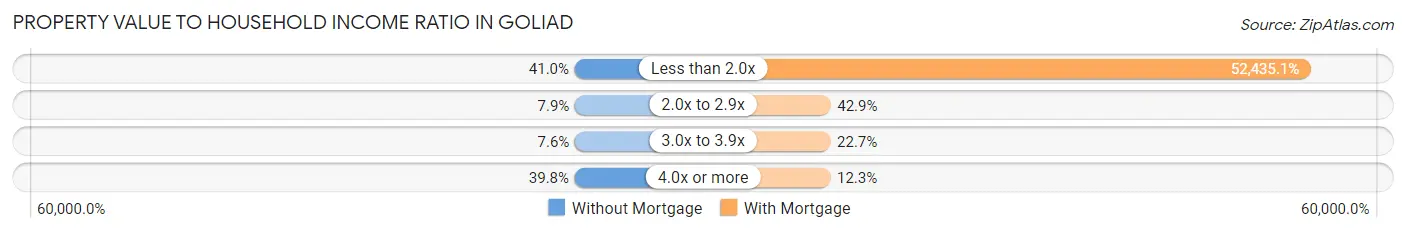
| Value-to-Income Ratio | Without Mortgage | With Mortgage |
| Less than 2.0x | 130 (41.0%) | 80,750 (52,435.1%) |
| 2.0x to 2.9x | 25 (7.9%) | 66 (42.9%) |
| 3.0x to 3.9x | 24 (7.6%) | 35 (22.7%) |
| 4.0x or more | 126 (39.8%) | 19 (12.3%) |
| Total | 317 (100.0%) | 154 (100.0%) |
Real Estate Taxes by Mortgage Status in Goliad
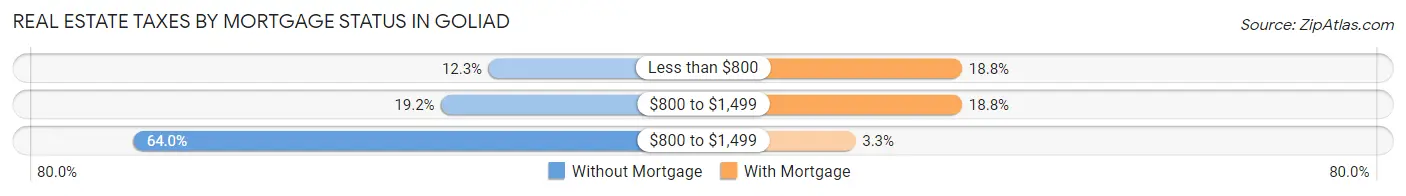
| Property Taxes | Without Mortgage | With Mortgage |
| Less than $800 | 39 (12.3%) | 29 (18.8%) |
| $800 to $1,499 | 61 (19.2%) | 29 (18.8%) |
| $800 to $1,499 | 203 (64.0%) | 5 (3.3%) |
| Total | 317 (100.0%) | 154 (100.0%) |
Health & Disability in Goliad
Health Insurance Coverage by Age in Goliad
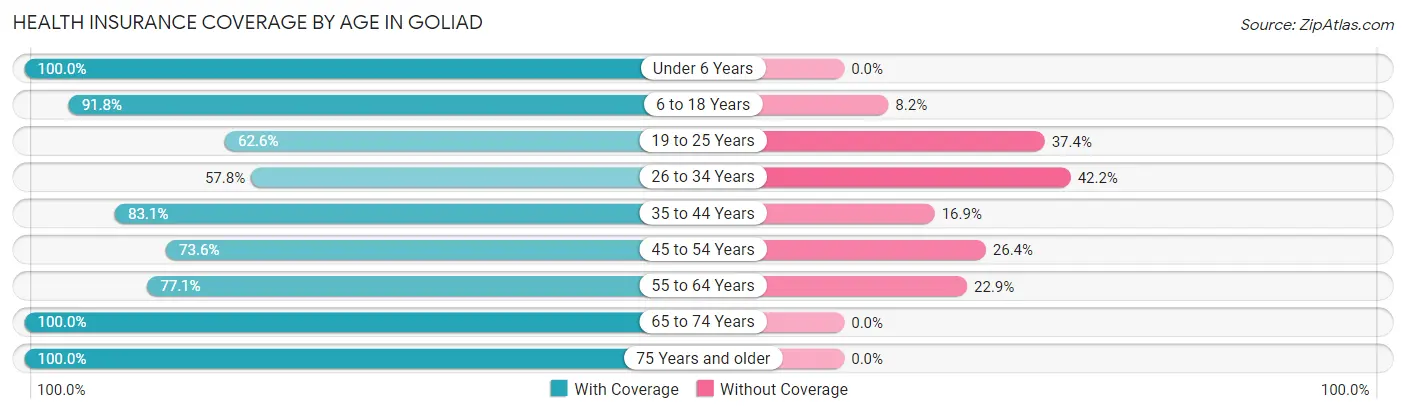
| Age Bracket | With Coverage | Without Coverage |
| Under 6 Years | 73 (100.0%) | 0 (0.0%) |
| 6 to 18 Years | 357 (91.8%) | 32 (8.2%) |
| 19 to 25 Years | 134 (62.6%) | 80 (37.4%) |
| 26 to 34 Years | 78 (57.8%) | 57 (42.2%) |
| 35 to 44 Years | 138 (83.1%) | 28 (16.9%) |
| 45 to 54 Years | 184 (73.6%) | 66 (26.4%) |
| 55 to 64 Years | 101 (77.1%) | 30 (22.9%) |
| 65 to 74 Years | 238 (100.0%) | 0 (0.0%) |
| 75 Years and older | 125 (100.0%) | 0 (0.0%) |
| Total | 1,428 (83.0%) | 293 (17.0%) |
Health Insurance Coverage by Citizenship Status in Goliad
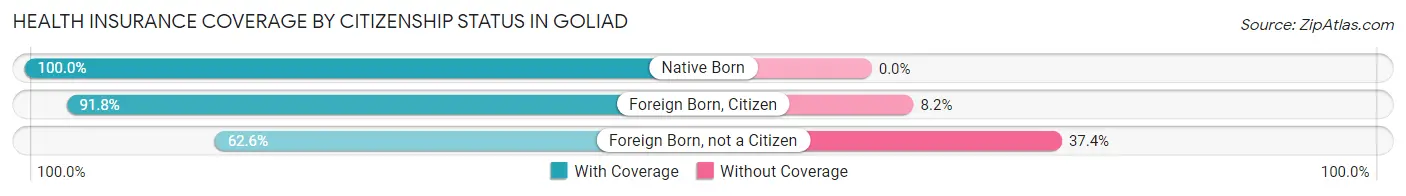
| Citizenship Status | With Coverage | Without Coverage |
| Native Born | 73 (100.0%) | 0 (0.0%) |
| Foreign Born, Citizen | 357 (91.8%) | 32 (8.2%) |
| Foreign Born, not a Citizen | 134 (62.6%) | 80 (37.4%) |
Health Insurance Coverage by Household Income in Goliad
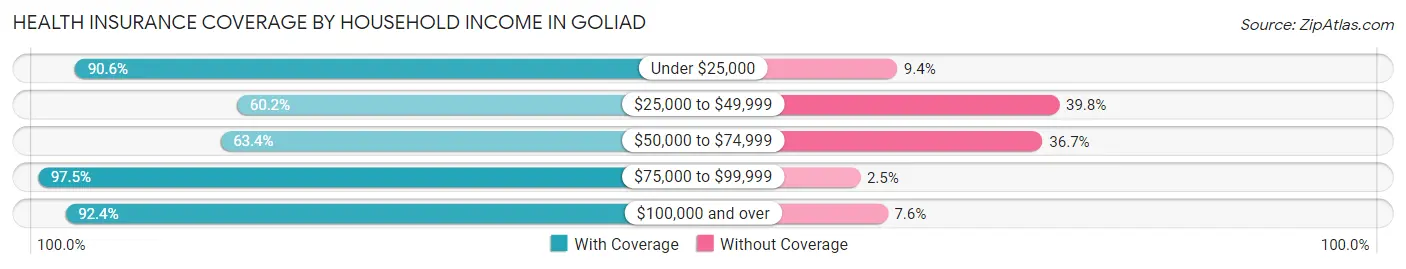
| Household Income | With Coverage | Without Coverage |
| Under $25,000 | 280 (90.6%) | 29 (9.4%) |
| $25,000 to $49,999 | 212 (60.2%) | 140 (39.8%) |
| $50,000 to $74,999 | 140 (63.3%) | 81 (36.6%) |
| $75,000 to $99,999 | 396 (97.5%) | 10 (2.5%) |
| $100,000 and over | 400 (92.4%) | 33 (7.6%) |
Public vs Private Health Insurance Coverage by Age in Goliad
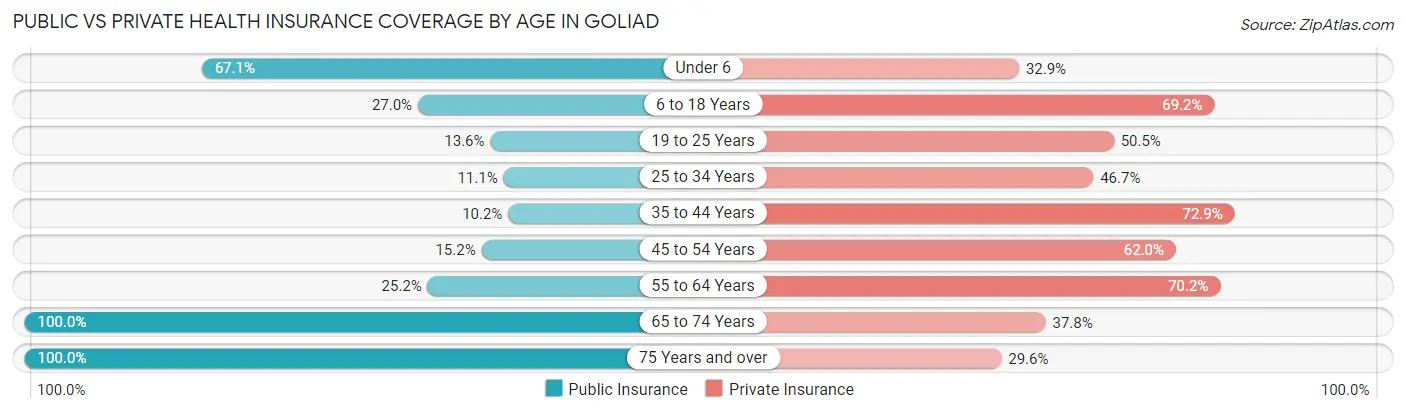
| Age Bracket | Public Insurance | Private Insurance |
| Under 6 | 49 (67.1%) | 24 (32.9%) |
| 6 to 18 Years | 105 (27.0%) | 269 (69.2%) |
| 19 to 25 Years | 29 (13.6%) | 108 (50.5%) |
| 25 to 34 Years | 15 (11.1%) | 63 (46.7%) |
| 35 to 44 Years | 17 (10.2%) | 121 (72.9%) |
| 45 to 54 Years | 38 (15.2%) | 155 (62.0%) |
| 55 to 64 Years | 33 (25.2%) | 92 (70.2%) |
| 65 to 74 Years | 238 (100.0%) | 90 (37.8%) |
| 75 Years and over | 125 (100.0%) | 37 (29.6%) |
| Total | 649 (37.7%) | 959 (55.7%) |
Disability Status by Sex by Age in Goliad
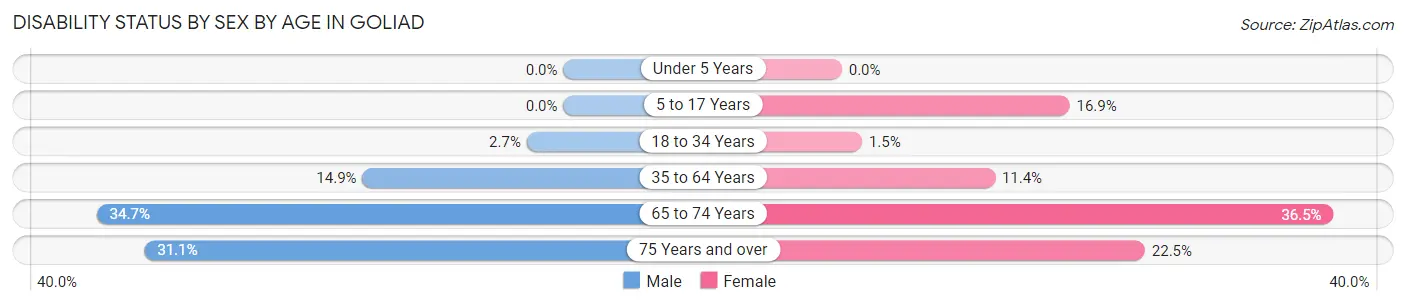
| Age Bracket | Male | Female |
| Under 5 Years | 0 (0.0%) | 0 (0.0%) |
| 5 to 17 Years | 0 (0.0%) | 35 (16.9%) |
| 18 to 34 Years | 5 (2.7%) | 3 (1.5%) |
| 35 to 64 Years | 37 (14.9%) | 34 (11.4%) |
| 65 to 74 Years | 35 (34.6%) | 50 (36.5%) |
| 75 Years and over | 14 (31.1%) | 18 (22.5%) |
Disability Class by Sex by Age in Goliad
Disability Class: Hearing Difficulty
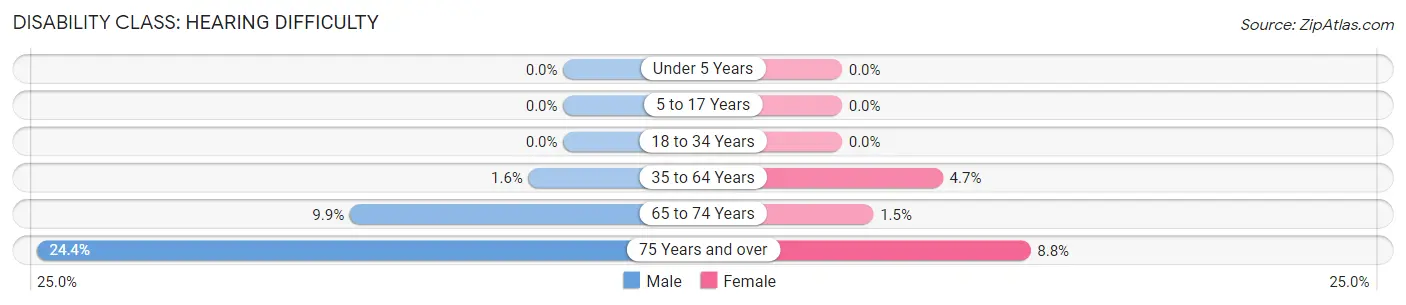
| Age Bracket | Male | Female |
| Under 5 Years | 0 (0.0%) | 0 (0.0%) |
| 5 to 17 Years | 0 (0.0%) | 0 (0.0%) |
| 18 to 34 Years | 0 (0.0%) | 0 (0.0%) |
| 35 to 64 Years | 4 (1.6%) | 14 (4.7%) |
| 65 to 74 Years | 10 (9.9%) | 2 (1.5%) |
| 75 Years and over | 11 (24.4%) | 7 (8.7%) |
Disability Class: Vision Difficulty
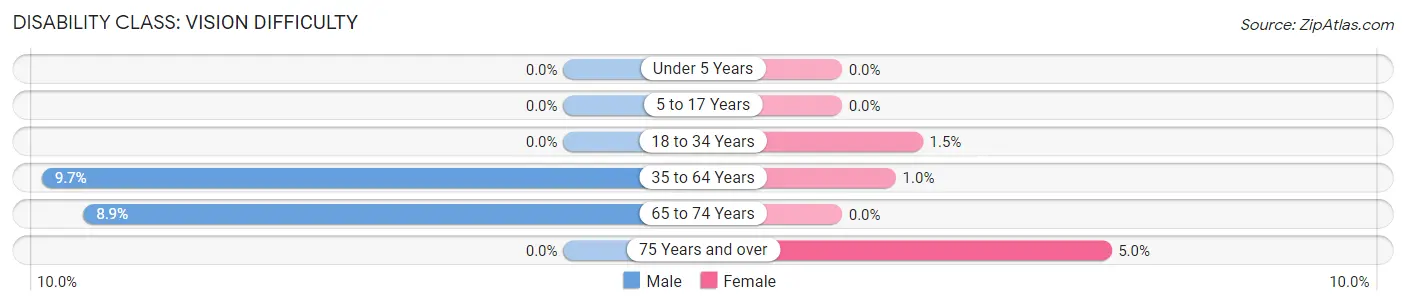
| Age Bracket | Male | Female |
| Under 5 Years | 0 (0.0%) | 0 (0.0%) |
| 5 to 17 Years | 0 (0.0%) | 0 (0.0%) |
| 18 to 34 Years | 0 (0.0%) | 3 (1.5%) |
| 35 to 64 Years | 24 (9.7%) | 3 (1.0%) |
| 65 to 74 Years | 9 (8.9%) | 0 (0.0%) |
| 75 Years and over | 0 (0.0%) | 4 (5.0%) |
Disability Class: Cognitive Difficulty
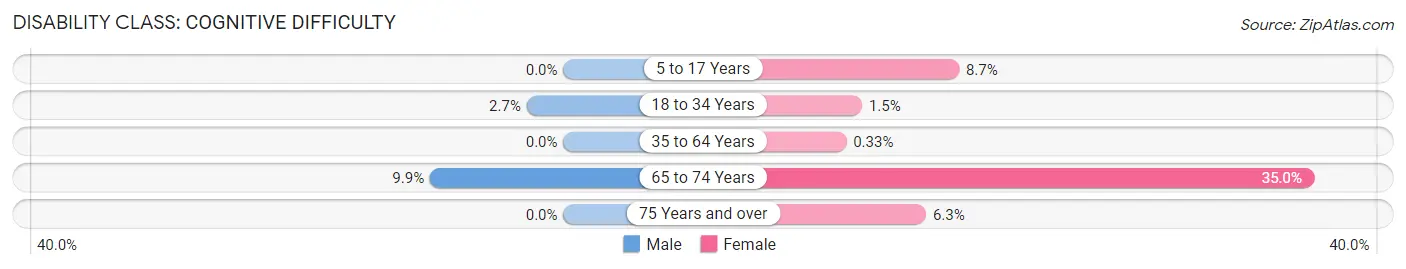
| Age Bracket | Male | Female |
| 5 to 17 Years | 0 (0.0%) | 18 (8.7%) |
| 18 to 34 Years | 5 (2.7%) | 3 (1.5%) |
| 35 to 64 Years | 0 (0.0%) | 1 (0.3%) |
| 65 to 74 Years | 10 (9.9%) | 48 (35.0%) |
| 75 Years and over | 0 (0.0%) | 5 (6.2%) |
Disability Class: Ambulatory Difficulty
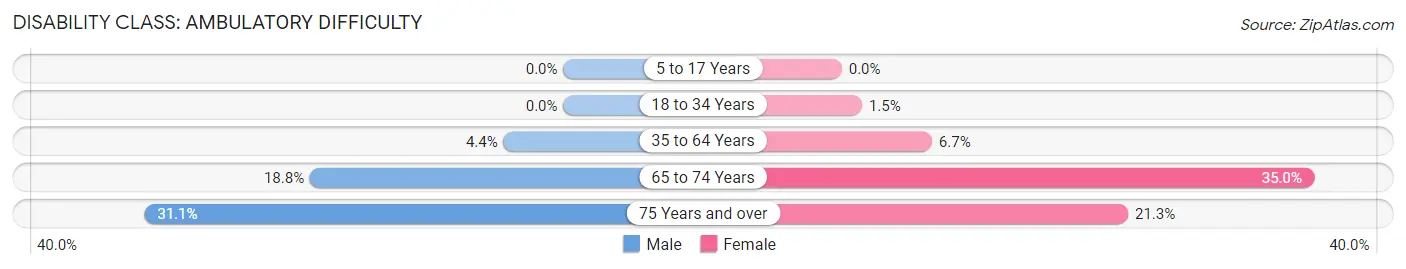
| Age Bracket | Male | Female |
| 5 to 17 Years | 0 (0.0%) | 0 (0.0%) |
| 18 to 34 Years | 0 (0.0%) | 3 (1.5%) |
| 35 to 64 Years | 11 (4.4%) | 20 (6.7%) |
| 65 to 74 Years | 19 (18.8%) | 48 (35.0%) |
| 75 Years and over | 14 (31.1%) | 17 (21.2%) |
Disability Class: Self-Care Difficulty
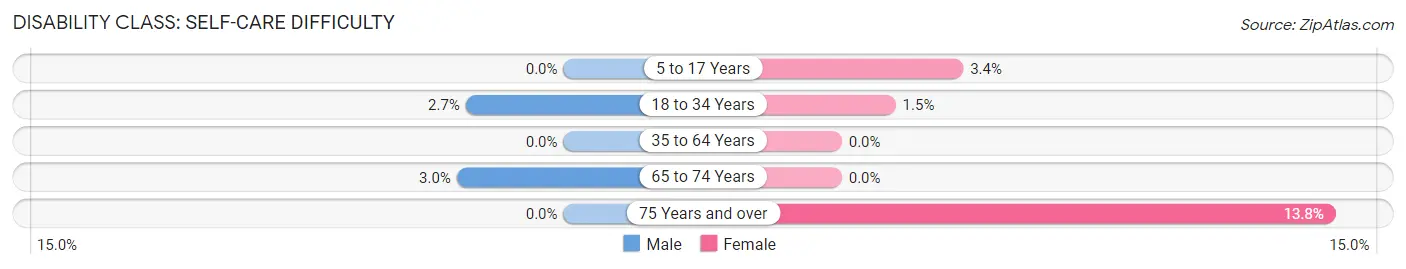
| Age Bracket | Male | Female |
| 5 to 17 Years | 0 (0.0%) | 7 (3.4%) |
| 18 to 34 Years | 5 (2.7%) | 3 (1.5%) |
| 35 to 64 Years | 0 (0.0%) | 0 (0.0%) |
| 65 to 74 Years | 3 (3.0%) | 0 (0.0%) |
| 75 Years and over | 0 (0.0%) | 11 (13.8%) |
Technology Access in Goliad
Computing Device Access in Goliad
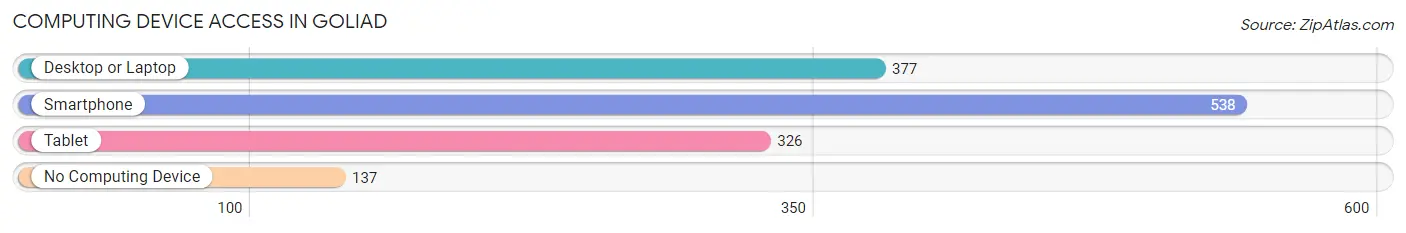
| Device Type | # Households | % Households |
| Desktop or Laptop | 377 | 54.5% |
| Smartphone | 538 | 77.7% |
| Tablet | 326 | 47.1% |
| No Computing Device | 137 | 19.8% |
| Total | 692 | 100.0% |
Internet Access in Goliad
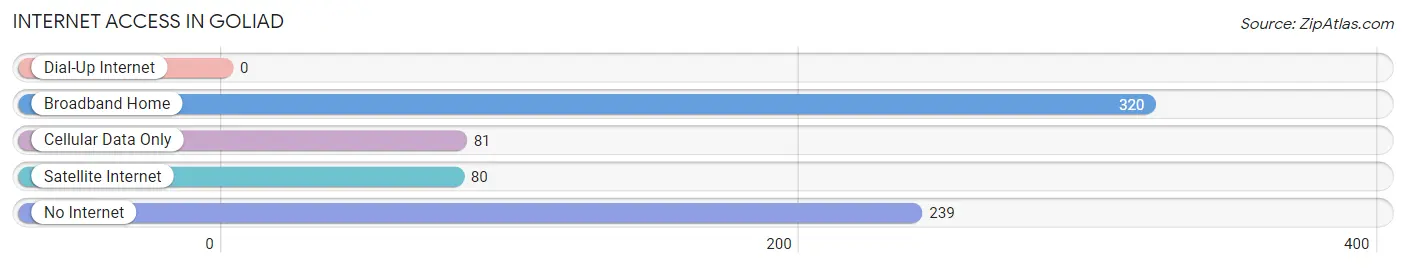
| Internet Type | # Households | % Households |
| Dial-Up Internet | 0 | 0.0% |
| Broadband Home | 320 | 46.2% |
| Cellular Data Only | 81 | 11.7% |
| Satellite Internet | 80 | 11.6% |
| No Internet | 239 | 34.5% |
| Total | 692 | 100.0% |
Goliad Summary
Goliad, Texas is a small town located in the southeastern part of the state, about halfway between San Antonio and Corpus Christi. It is the county seat of Goliad County and has a population of about 1,908 people as of the 2010 census. The town was founded in 1749 by the Spanish explorer, Don Jose de Escandon, and was named after the mission of Nuestra Senora de Goliad, which was established in the area in 1749.
Geography
Goliad is located in the Coastal Plains region of Texas, about 50 miles southeast of San Antonio and about 70 miles southwest of Corpus Christi. The town is situated on the San Antonio River, which flows through the area and provides a source of water for the town. The terrain is mostly flat, with some rolling hills in the area. The climate is generally mild, with temperatures ranging from the mid-50s in the winter to the mid-90s in the summer.
Economy
Goliad’s economy is largely based on agriculture, with cotton, corn, and sorghum being the main crops. The town also has a number of small businesses, including restaurants, retail stores, and service providers. The town is also home to a number of historic sites, including the Presidio La Bahia, which is a Spanish fort that was built in 1749. The fort is now a state historic site and is open to the public.
Demographics
As of the 2010 census, Goliad had a population of 1,908 people. The racial makeup of the town was 79.3% White, 0.6% African American, 0.3% Native American, 0.2% Asian, 0.1% Pacific Islander, 17.2% from other races, and 2.5% from two or more races. Hispanic or Latino of any race were 37.2% of the population.
The median income for a household in Goliad was $30,938, and the median income for a family was $37,917. The per capita income for the town was $15,945. About 18.2% of families and 22.2% of the population were below the poverty line, including 28.3% of those under age 18 and 16.2% of those age 65 or over.
Conclusion
Goliad, Texas is a small town located in the southeastern part of the state, about halfway between San Antonio and Corpus Christi. It is the county seat of Goliad County and has a population of about 1,908 people as of the 2010 census. The town was founded in 1749 by the Spanish explorer, Don Jose de Escandon, and was named after the mission of Nuestra Senora de Goliad, which was established in the area in 1749. The town’s economy is largely based on agriculture, with cotton, corn, and sorghum being the main crops. The town also has a number of small businesses, including restaurants, retail stores, and service providers. The town is also home to a number of historic sites, including the Presidio La Bahia, which is a Spanish fort that was built in 1749. The racial makeup of the town was 79.3% White, 0.6% African American, 0.3% Native American, 0.2% Asian, 0.1% Pacific Islander, 17.2% from other races, and 2.5% from two or more races. Hispanic or Latino of any race were 37.2% of the population. Goliad is a small town with a rich history and a diverse population.
Common Questions
What is Per Capita Income in Goliad?
Per Capita income in Goliad is $22,444.
What is the Median Family Income in Goliad?
Median Family Income in Goliad is $66,389.
What is the Median Household income in Goliad?
Median Household Income in Goliad is $39,138.
What is Income or Wage Gap in Goliad?
Income or Wage Gap in Goliad is 17.2%.
Women in Goliad earn 82.8 cents for every dollar earned by a man.
What is Inequality or Gini Index in Goliad?
Inequality or Gini Index in Goliad is 0.51.
What is the Total Population of Goliad?
Total Population of Goliad is 1,816.
What is the Total Male Population of Goliad?
Total Male Population of Goliad is 833.
What is the Total Female Population of Goliad?
Total Female Population of Goliad is 983.
What is the Ratio of Males per 100 Females in Goliad?
There are 84.74 Males per 100 Females in Goliad.
What is the Ratio of Females per 100 Males in Goliad?
There are 118.01 Females per 100 Males in Goliad.
What is the Median Population Age in Goliad?
Median Population Age in Goliad is 38.4 Years.
What is the Average Family Size in Goliad
Average Family Size in Goliad is 3.6 People.
What is the Average Household Size in Goliad
Average Household Size in Goliad is 2.5 People.
How Large is the Labor Force in Goliad?
There are 738 People in the Labor Forcein in Goliad.
What is the Percentage of People in the Labor Force in Goliad?
50.5% of People are in the Labor Force in Goliad.
What is the Unemployment Rate in Goliad?
Unemployment Rate in Goliad is 8.9%.