New Waverly, TX Map & Demographics
New Waverly Map
New Waverly Overview
$26,324
PER CAPITA INCOME
$86,477
AVG FAMILY INCOME
$45,799
AVG HOUSEHOLD INCOME
21.9%
WAGE / INCOME GAP [ % ]
78.1¢/ $1
WAGE / INCOME GAP [ $ ]
0.53
INEQUALITY / GINI INDEX
1,102
TOTAL POPULATION
617
MALE POPULATION
485
FEMALE POPULATION
127.22
MALES / 100 FEMALES
78.61
FEMALES / 100 MALES
35.7
MEDIAN AGE
3.7
AVG FAMILY SIZE
3.0
AVG HOUSEHOLD SIZE
378
LABOR FORCE [ PEOPLE ]
46.1%
PERCENT IN LABOR FORCE
3.2%
UNEMPLOYMENT RATE
New Waverly Zip Codes
New Waverly Area Codes
Income in New Waverly
Income Overview in New Waverly
Per Capita Income in New Waverly is $26,324, while median incomes of families and households are $86,477 and $45,799 respectively.
| Characteristic | Number | Measure |
| Per Capita Income | 1,102 | $26,324 |
| Median Family Income | 241 | $86,477 |
| Mean Family Income | 241 | $95,144 |
| Median Household Income | 371 | $45,799 |
| Mean Household Income | 371 | $69,699 |
| Income Deficit | 241 | $0 |
| Wage / Income Gap (%) | 1,102 | 21.87% |
| Wage / Income Gap ($) | 1,102 | 78.13¢ per $1 |
| Gini / Inequality Index | 1,102 | 0.53 |
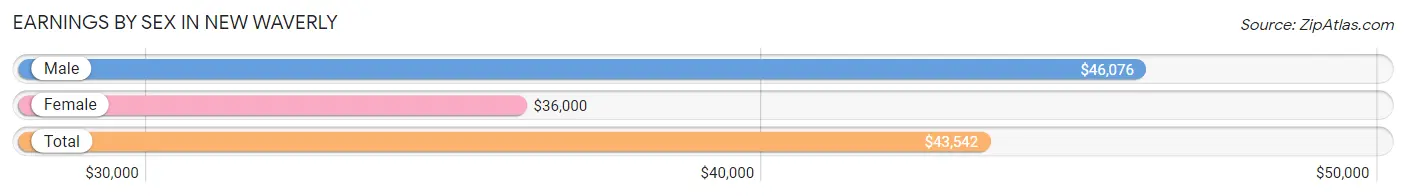
Earnings by Sex in New Waverly
Average Earnings in New Waverly are $43,542, $46,076 for men and $36,000 for women, a difference of 21.9%.
| Sex | Number | Average Earnings |
| Male | 263 (68.7%) | $46,076 |
| Female | 120 (31.3%) | $36,000 |
| Total | 383 (100.0%) | $43,542 |
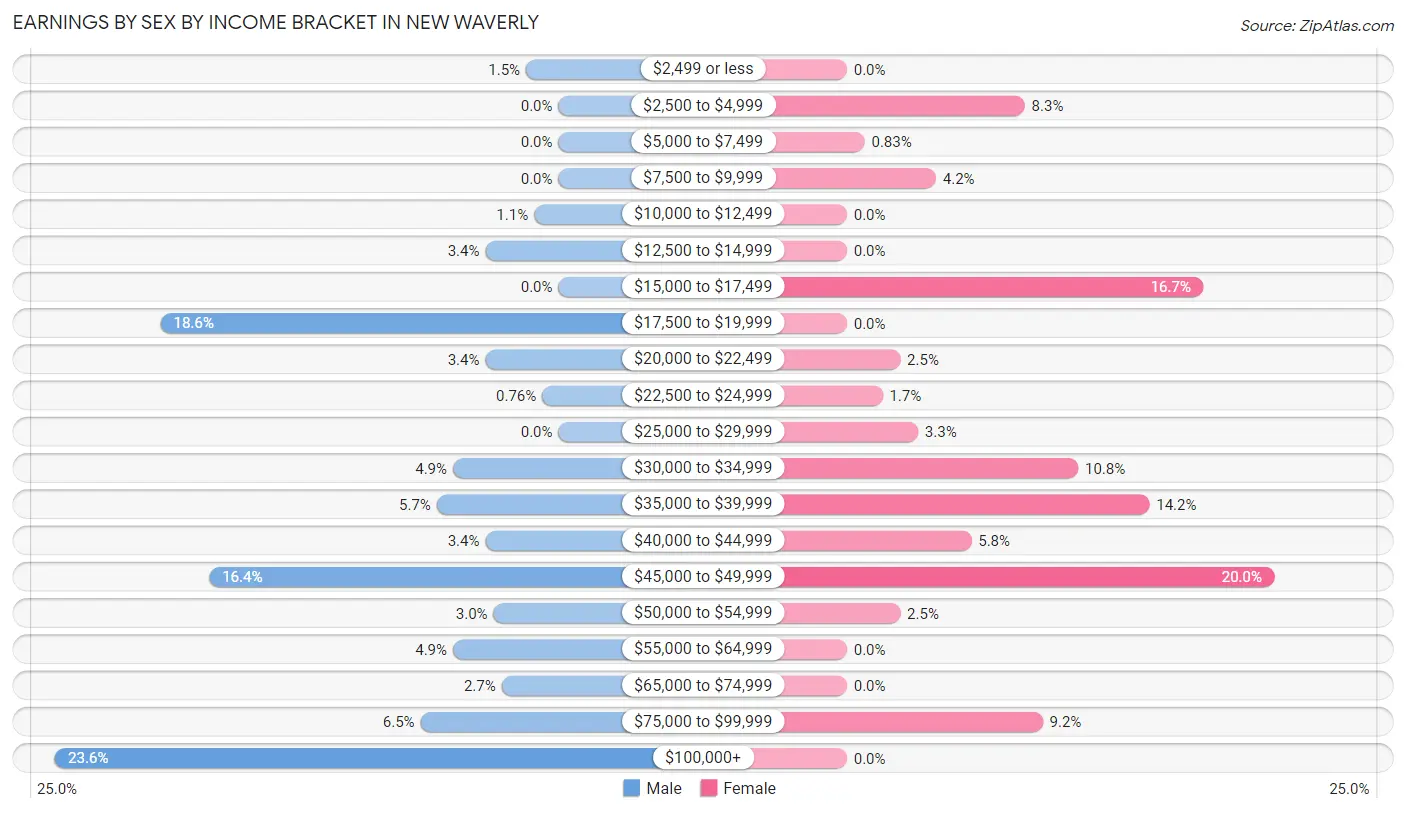
Earnings by Sex by Income Bracket in New Waverly
The most common earnings brackets in New Waverly are $100,000+ for men (62 | 23.6%) and $45,000 to $49,999 for women (24 | 20.0%).
| Income | Male | Female |
| $2,499 or less | 4 (1.5%) | 0 (0.0%) |
| $2,500 to $4,999 | 0 (0.0%) | 10 (8.3%) |
| $5,000 to $7,499 | 0 (0.0%) | 1 (0.8%) |
| $7,500 to $9,999 | 0 (0.0%) | 5 (4.2%) |
| $10,000 to $12,499 | 3 (1.1%) | 0 (0.0%) |
| $12,500 to $14,999 | 9 (3.4%) | 0 (0.0%) |
| $15,000 to $17,499 | 0 (0.0%) | 20 (16.7%) |
| $17,500 to $19,999 | 49 (18.6%) | 0 (0.0%) |
| $20,000 to $22,499 | 9 (3.4%) | 3 (2.5%) |
| $22,500 to $24,999 | 2 (0.8%) | 2 (1.7%) |
| $25,000 to $29,999 | 0 (0.0%) | 4 (3.3%) |
| $30,000 to $34,999 | 13 (4.9%) | 13 (10.8%) |
| $35,000 to $39,999 | 15 (5.7%) | 17 (14.2%) |
| $40,000 to $44,999 | 9 (3.4%) | 7 (5.8%) |
| $45,000 to $49,999 | 43 (16.4%) | 24 (20.0%) |
| $50,000 to $54,999 | 8 (3.0%) | 3 (2.5%) |
| $55,000 to $64,999 | 13 (4.9%) | 0 (0.0%) |
| $65,000 to $74,999 | 7 (2.7%) | 0 (0.0%) |
| $75,000 to $99,999 | 17 (6.5%) | 11 (9.2%) |
| $100,000+ | 62 (23.6%) | 0 (0.0%) |
| Total | 263 (100.0%) | 120 (100.0%) |
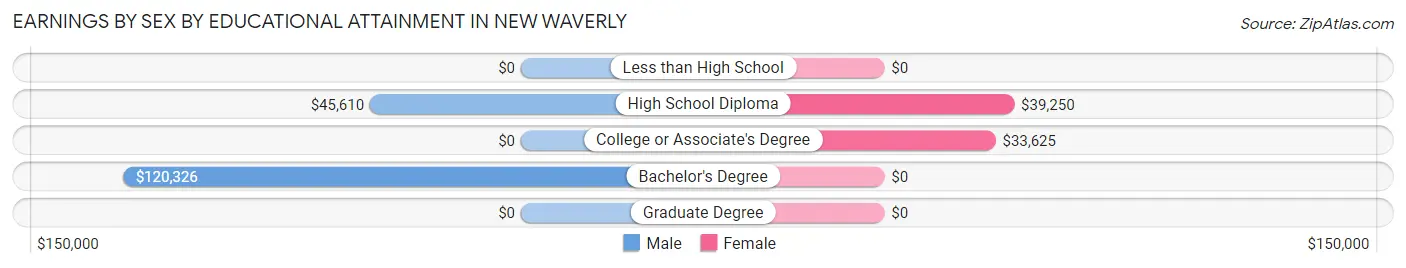
Earnings by Sex by Educational Attainment in New Waverly
Average earnings in New Waverly are $46,453 for men and $36,250 for women, a difference of 22.0%. Men with an educational attainment of bachelor's degree enjoy the highest average annual earnings of $120,326, while those with high school diploma education earn the least with $45,610. Women with an educational attainment of high school diploma earn the most with the average annual earnings of $39,250, while those with college or associate's degree education have the smallest earnings of $33,625.
| Educational Attainment | Male Income | Female Income |
| Less than High School | - | - |
| High School Diploma | $45,610 | $39,250 |
| College or Associate's Degree | - | - |
| Bachelor's Degree | $120,326 | $0 |
| Graduate Degree | - | - |
| Total | $46,453 | $36,250 |
Family Income in New Waverly
Family Income Brackets in New Waverly
According to the New Waverly family income data, there are 60 families falling into the $100,000 to $149,999 income range, which is the most common income bracket and makes up 24.9% of all families.
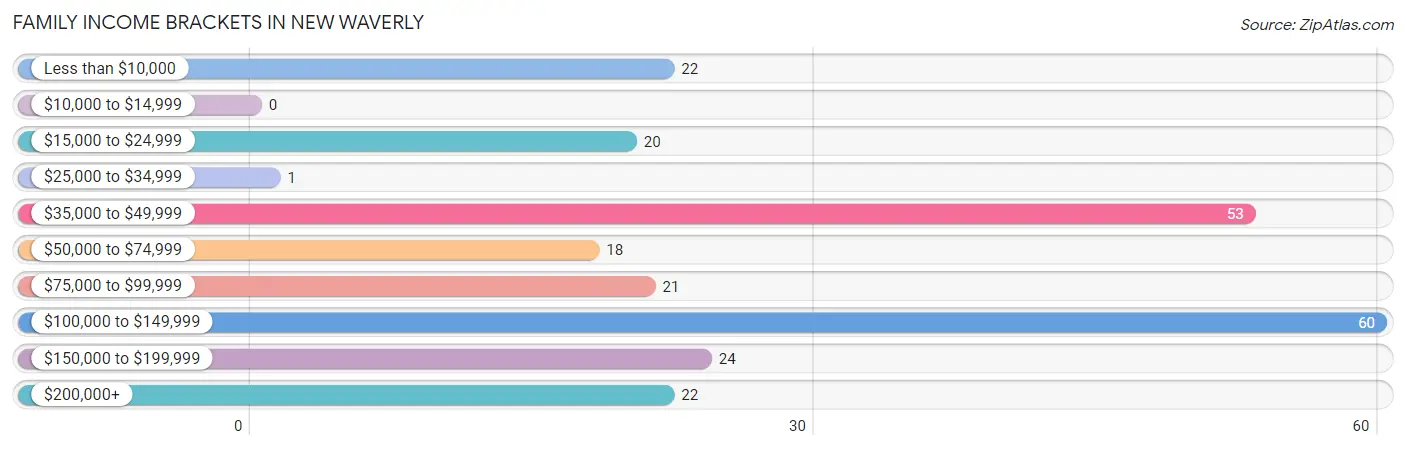
| Income Bracket | # Families | % Families |
| Less than $10,000 | 22 | 9.1% |
| $10,000 to $14,999 | 0 | 0.0% |
| $15,000 to $24,999 | 20 | 8.3% |
| $25,000 to $34,999 | 1 | 0.4% |
| $35,000 to $49,999 | 53 | 22.0% |
| $50,000 to $74,999 | 18 | 7.5% |
| $75,000 to $99,999 | 21 | 8.7% |
| $100,000 to $149,999 | 60 | 24.9% |
| $150,000 to $199,999 | 24 | 10.0% |
| $200,000+ | 22 | 9.1% |
Family Income by Famaliy Size in New Waverly
3-person families (99 | 41.1%) account for the highest median family income in New Waverly with $120,163 per family, while 3-person families (99 | 41.1%) have the highest median income of $40,054 per family member.
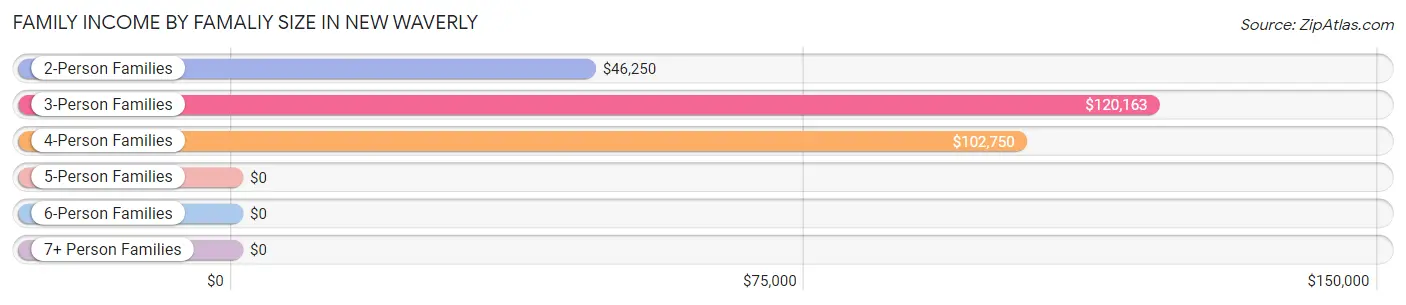
| Income Bracket | # Families | Median Income |
| 2-Person Families | 45 (18.7%) | $46,250 |
| 3-Person Families | 99 (41.1%) | $120,163 |
| 4-Person Families | 63 (26.1%) | $102,750 |
| 5-Person Families | 32 (13.3%) | $0 |
| 6-Person Families | 2 (0.8%) | $0 |
| 7+ Person Families | 0 (0.0%) | $0 |
| Total | 241 (100.0%) | $86,477 |
Family Income by Number of Earners in New Waverly
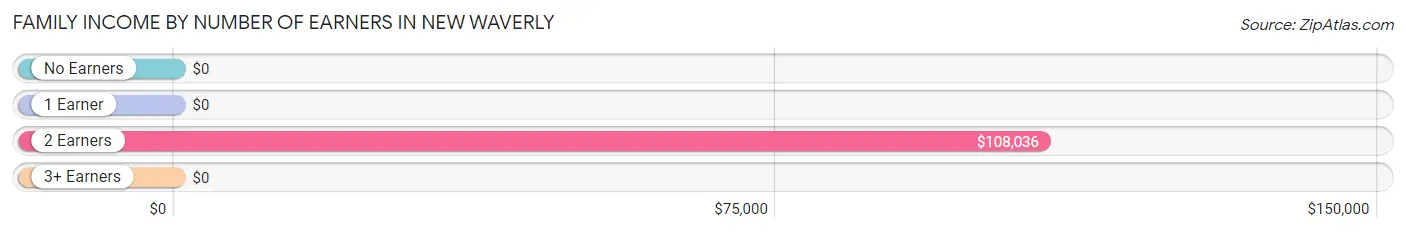
| Number of Earners | # Families | Median Income |
| No Earners | 49 (20.3%) | $0 |
| 1 Earner | 96 (39.8%) | $0 |
| 2 Earners | 69 (28.6%) | $108,036 |
| 3+ Earners | 27 (11.2%) | $0 |
| Total | 241 (100.0%) | $86,477 |
Household Income in New Waverly
Household Income Brackets in New Waverly
With 73 households falling in the category, the less than $10,000 income range is the most frequent in New Waverly, accounting for 19.7% of all households. In contrast, only 3 households (0.8%) fall into the $25,000 to $34,999 income bracket, making it the least populous group.
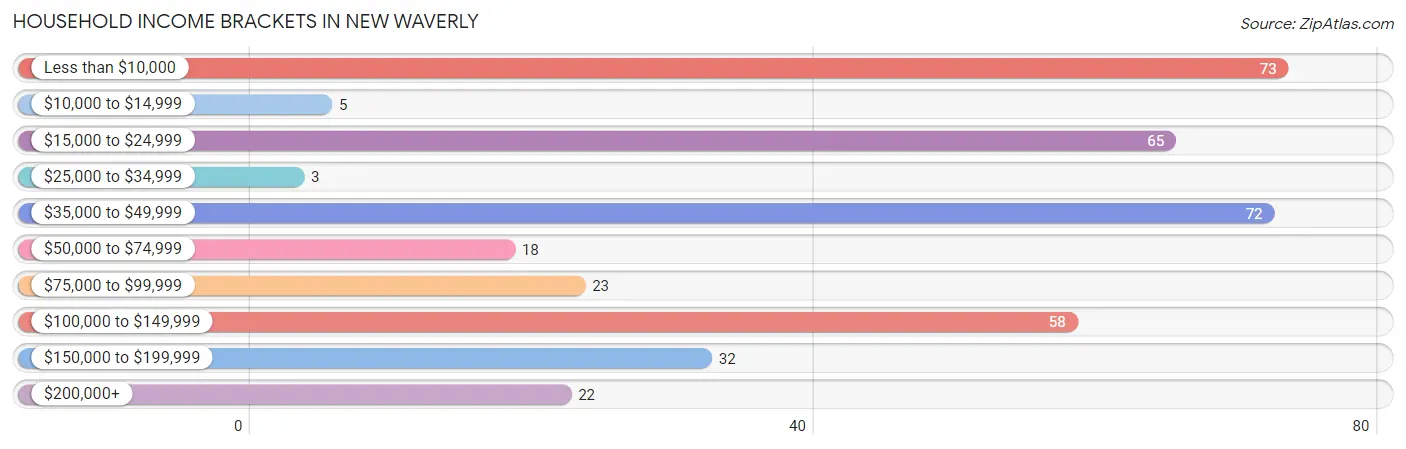
| Income Bracket | # Households | % Households |
| Less than $10,000 | 73 | 19.7% |
| $10,000 to $14,999 | 5 | 1.3% |
| $15,000 to $24,999 | 65 | 17.5% |
| $25,000 to $34,999 | 3 | 0.8% |
| $35,000 to $49,999 | 72 | 19.4% |
| $50,000 to $74,999 | 18 | 4.9% |
| $75,000 to $99,999 | 23 | 6.2% |
| $100,000 to $149,999 | 58 | 15.6% |
| $150,000 to $199,999 | 32 | 8.6% |
| $200,000+ | 22 | 5.9% |
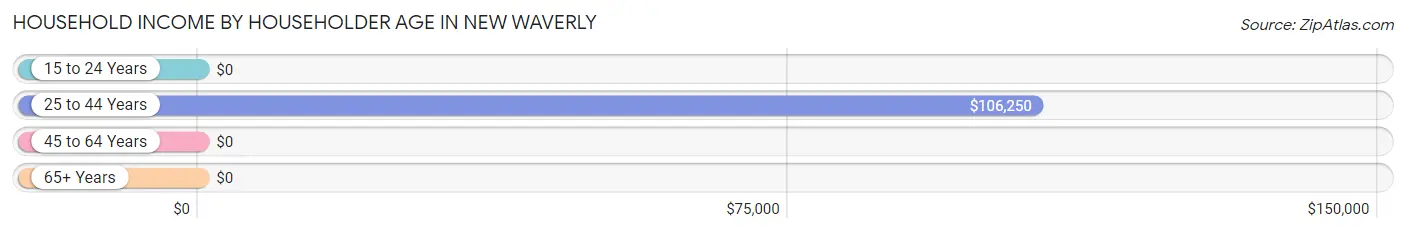
Household Income by Householder Age in New Waverly
The median household income in New Waverly is $45,799, with the highest median household income of $106,250 found in the 25 to 44 years age bracket for the primary householder. A total of 154 households (41.5%) fall into this category. Meanwhile, the 15 to 24 years age bracket for the primary householder has the lowest median household income of $0, with 19 households (5.1%) in this group.
| Income Bracket | # Households | Median Income |
| 15 to 24 Years | 19 (5.1%) | $0 |
| 25 to 44 Years | 154 (41.5%) | $106,250 |
| 45 to 64 Years | 131 (35.3%) | $0 |
| 65+ Years | 67 (18.1%) | $0 |
| Total | 371 (100.0%) | $45,799 |
Poverty in New Waverly
Income Below Poverty by Sex and Age in New Waverly
With 27.6% poverty level for males and 16.5% for females among the residents of New Waverly, 12 to 14 year old males and 18 to 24 year old females are the most vulnerable to poverty, with 18 males (100.0%) and 11 females (61.1%) in their respective age groups living below the poverty level.
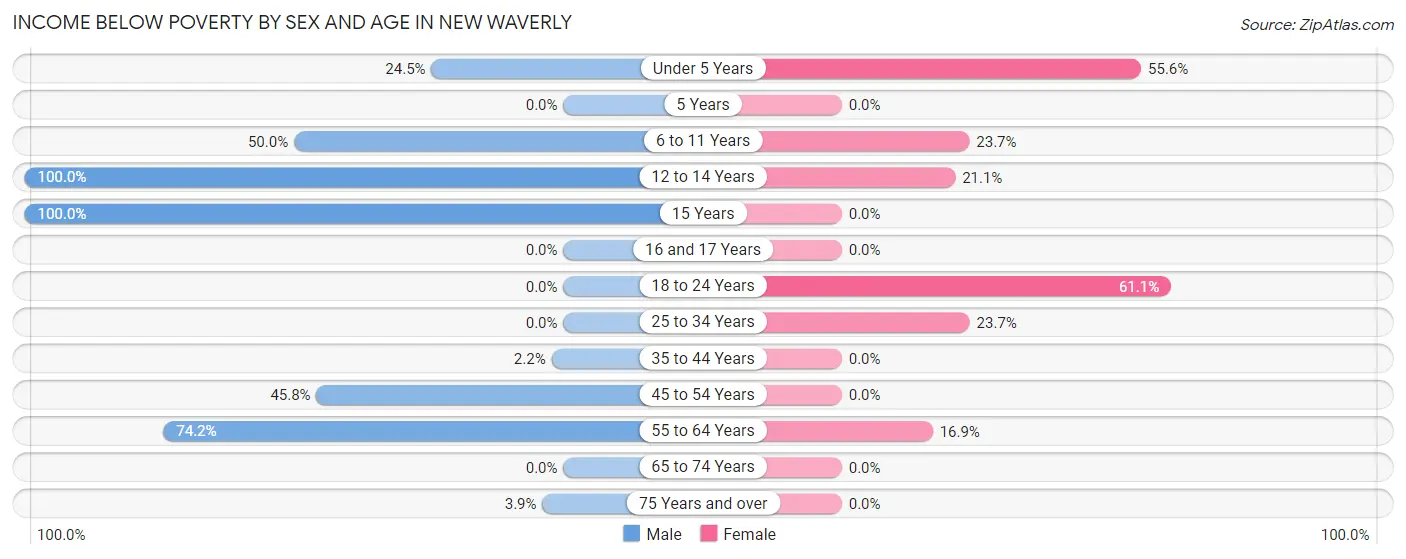
| Age Bracket | Male | Female |
| Under 5 Years | 12 (24.5%) | 10 (55.6%) |
| 5 Years | 0 (0.0%) | 0 (0.0%) |
| 6 to 11 Years | 22 (50.0%) | 27 (23.7%) |
| 12 to 14 Years | 18 (100.0%) | 4 (21.0%) |
| 15 Years | 4 (100.0%) | 0 (0.0%) |
| 16 and 17 Years | 0 (0.0%) | 0 (0.0%) |
| 18 to 24 Years | 0 (0.0%) | 11 (61.1%) |
| 25 to 34 Years | 0 (0.0%) | 14 (23.7%) |
| 35 to 44 Years | 2 (2.2%) | 0 (0.0%) |
| 45 to 54 Years | 11 (45.8%) | 0 (0.0%) |
| 55 to 64 Years | 98 (74.2%) | 14 (16.9%) |
| 65 to 74 Years | 0 (0.0%) | 0 (0.0%) |
| 75 Years and over | 3 (3.9%) | 0 (0.0%) |
| Total | 170 (27.6%) | 80 (16.5%) |
Income Above Poverty by Sex and Age in New Waverly
According to the poverty statistics in New Waverly, males aged 16 and 17 years and females aged 5 years are the age groups that are most secure financially, with 100.0% of males and 100.0% of females in these age groups living above the poverty line.
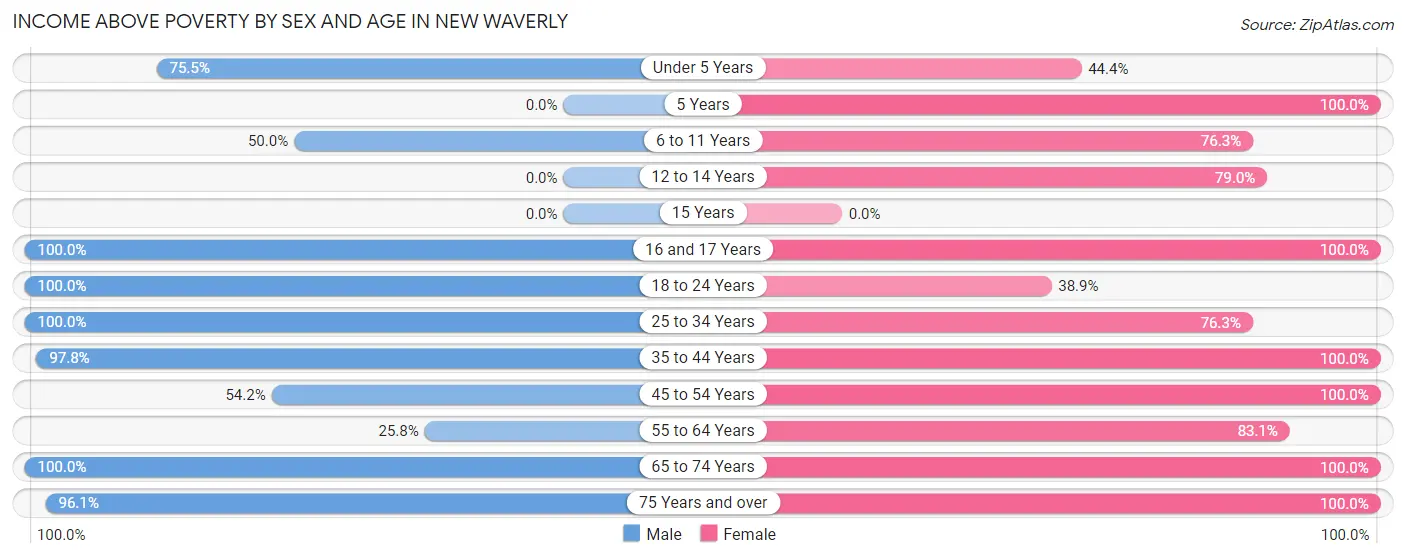
| Age Bracket | Male | Female |
| Under 5 Years | 37 (75.5%) | 8 (44.4%) |
| 5 Years | 0 (0.0%) | 16 (100.0%) |
| 6 to 11 Years | 22 (50.0%) | 87 (76.3%) |
| 12 to 14 Years | 0 (0.0%) | 15 (78.9%) |
| 15 Years | 0 (0.0%) | 0 (0.0%) |
| 16 and 17 Years | 4 (100.0%) | 8 (100.0%) |
| 18 to 24 Years | 34 (100.0%) | 7 (38.9%) |
| 25 to 34 Years | 122 (100.0%) | 45 (76.3%) |
| 35 to 44 Years | 89 (97.8%) | 52 (100.0%) |
| 45 to 54 Years | 13 (54.2%) | 37 (100.0%) |
| 55 to 64 Years | 34 (25.8%) | 69 (83.1%) |
| 65 to 74 Years | 18 (100.0%) | 18 (100.0%) |
| 75 Years and over | 74 (96.1%) | 43 (100.0%) |
| Total | 447 (72.5%) | 405 (83.5%) |
Income Below Poverty Among Married-Couple Families in New Waverly
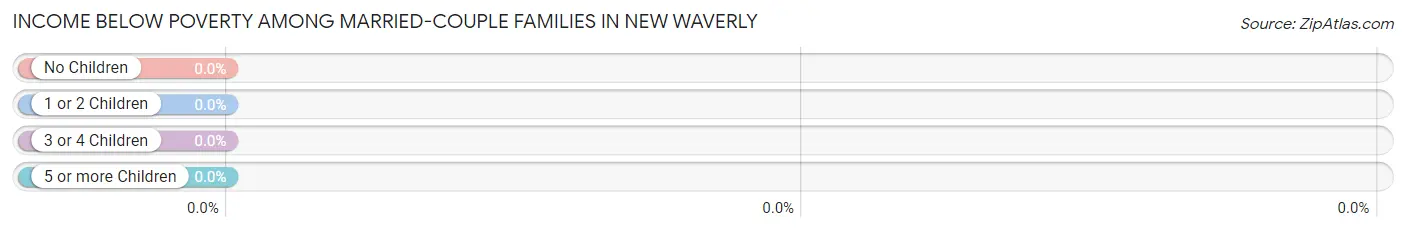
| Children | Above Poverty | Below Poverty |
| No Children | 50 (100.0%) | 0 (0.0%) |
| 1 or 2 Children | 77 (100.0%) | 0 (0.0%) |
| 3 or 4 Children | 23 (100.0%) | 0 (0.0%) |
| 5 or more Children | 0 (0.0%) | 0 (0.0%) |
| Total | 150 (100.0%) | 0 (0.0%) |
Income Below Poverty Among Single-Parent Households in New Waverly
According to the poverty data in New Waverly, 30.2% or 13 single-father households and 52.1% or 25 single-mother households are living below the poverty line. Among single-father households, those with 1 or 2 children have the highest poverty rate, with 11 households (100.0%) experiencing poverty. Likewise, among single-mother households, those with 3 or 4 children have the highest poverty rate, with 11 households (73.3%) falling below the poverty line.
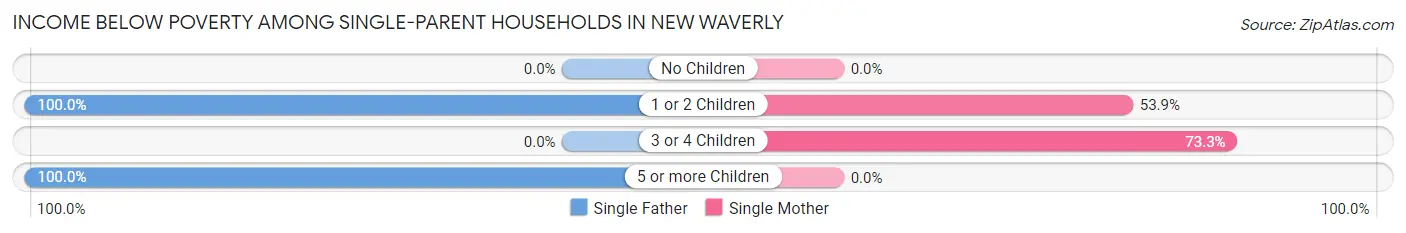
| Children | Single Father | Single Mother |
| No Children | 0 (0.0%) | 0 (0.0%) |
| 1 or 2 Children | 11 (100.0%) | 14 (53.8%) |
| 3 or 4 Children | 0 (0.0%) | 11 (73.3%) |
| 5 or more Children | 2 (100.0%) | 0 (0.0%) |
| Total | 13 (30.2%) | 25 (52.1%) |
Income Below Poverty Among Married-Couple vs Single-Parent Households in New Waverly
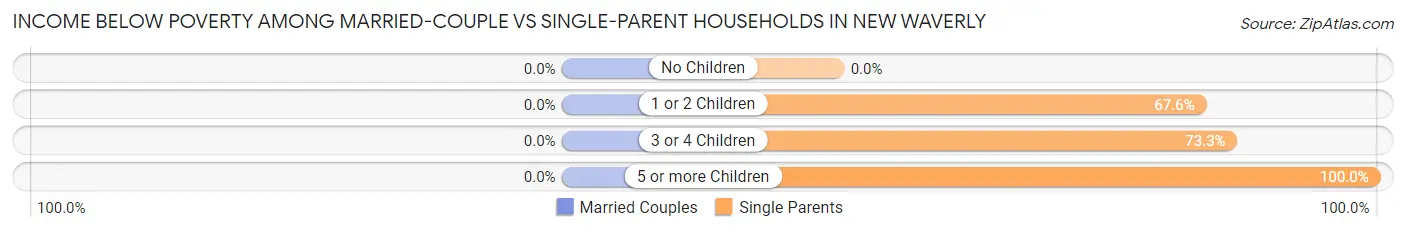
| Children | Married-Couple Families | Single-Parent Households |
| No Children | 0 (0.0%) | 0 (0.0%) |
| 1 or 2 Children | 0 (0.0%) | 25 (67.6%) |
| 3 or 4 Children | 0 (0.0%) | 11 (73.3%) |
| 5 or more Children | 0 (0.0%) | 2 (100.0%) |
| Total | 0 (0.0%) | 38 (41.8%) |
Race in New Waverly
The most populous races in New Waverly are White / Caucasian (928 | 84.2%), Black / African American (78 | 7.1%), and Asian (77 | 7.0%).
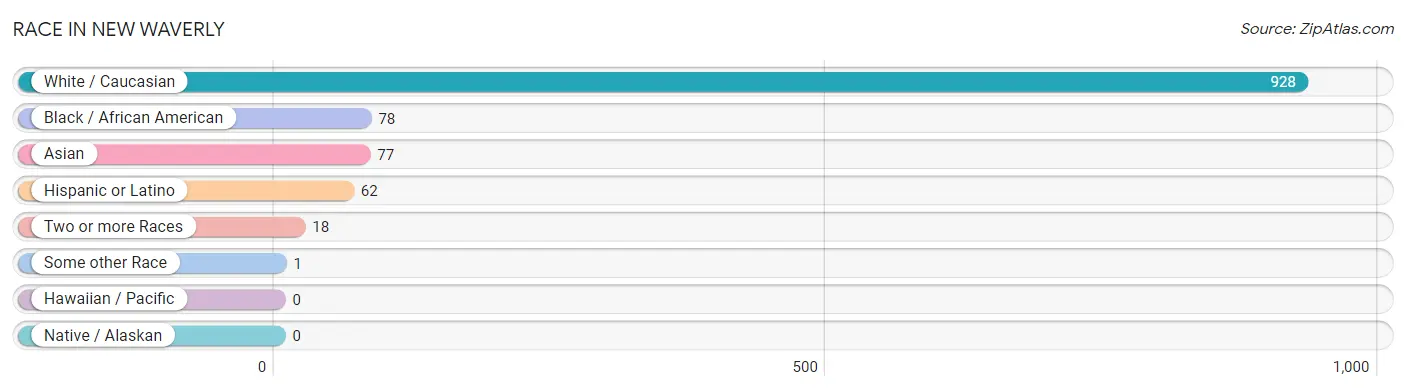
| Race | # Population | % Population |
| Asian | 77 | 7.0% |
| Black / African American | 78 | 7.1% |
| Hawaiian / Pacific | 0 | 0.0% |
| Hispanic or Latino | 62 | 5.6% |
| Native / Alaskan | 0 | 0.0% |
| White / Caucasian | 928 | 84.2% |
| Two or more Races | 18 | 1.6% |
| Some other Race | 1 | 0.1% |
| Total | 1,102 | 100.0% |
Ancestry in New Waverly
The most populous ancestries reported in New Waverly are English (266 | 24.1%), German (134 | 12.2%), American (122 | 11.1%), Norwegian (96 | 8.7%), and Irish (82 | 7.4%), together accounting for 63.5% of all New Waverly residents.
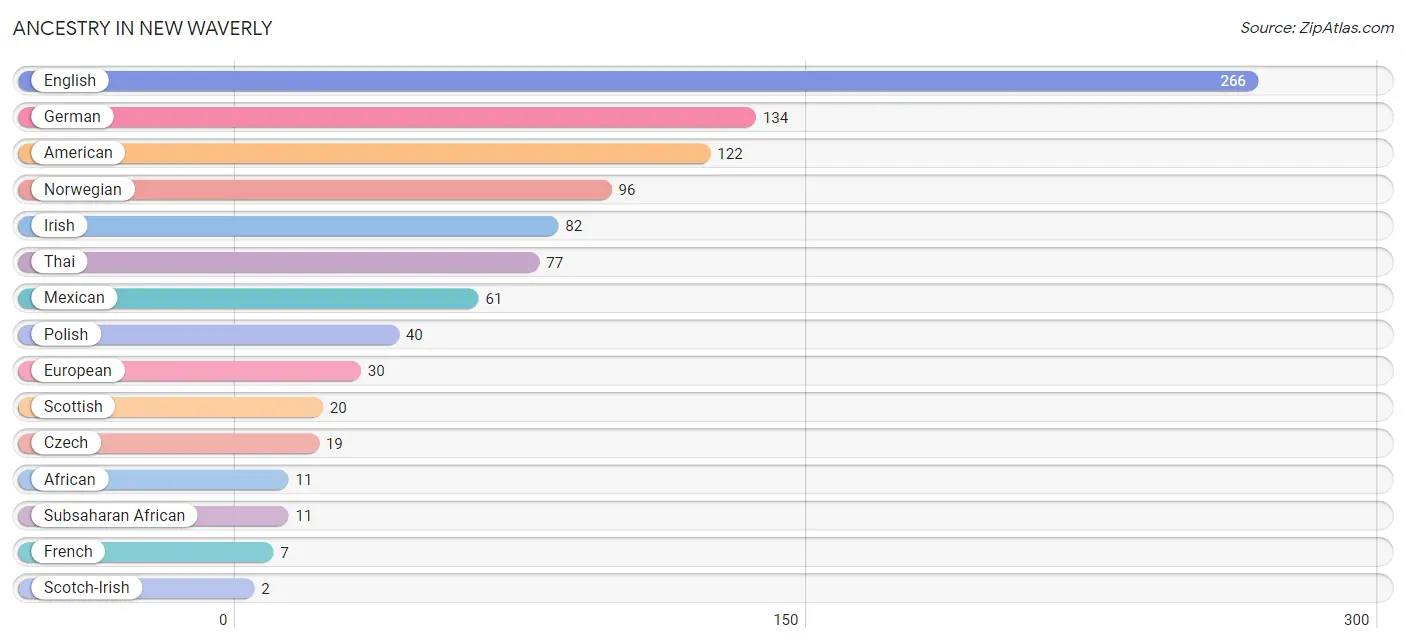
| Ancestry | # Population | % Population |
| African | 11 | 1.0% |
| American | 122 | 11.1% |
| Central American | 1 | 0.1% |
| Czech | 19 | 1.7% |
| English | 266 | 24.1% |
| European | 30 | 2.7% |
| French | 7 | 0.6% |
| German | 134 | 12.2% |
| Irish | 82 | 7.4% |
| Mexican | 61 | 5.5% |
| Norwegian | 96 | 8.7% |
| Polish | 40 | 3.6% |
| Salvadoran | 1 | 0.1% |
| Scotch-Irish | 2 | 0.2% |
| Scottish | 20 | 1.8% |
| Subsaharan African | 11 | 1.0% |
| Thai | 77 | 7.0% | View All 17 Rows |
Immigrants in New Waverly
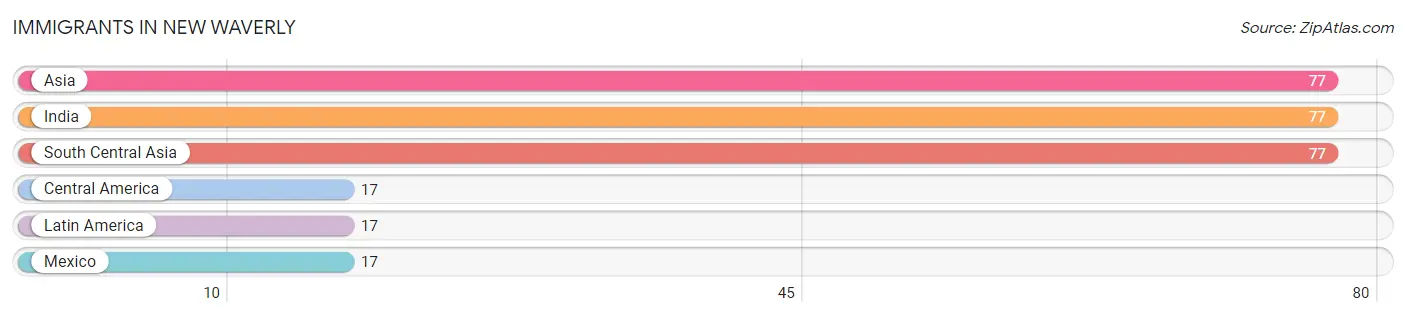
The most numerous immigrant groups reported in New Waverly came from Asia (77 | 7.0%), India (77 | 7.0%), South Central Asia (77 | 7.0%), Central America (17 | 1.5%), and Latin America (17 | 1.5%), together accounting for 24.0% of all New Waverly residents.
| Immigration Origin | # Population | % Population |
| Asia | 77 | 7.0% |
| Central America | 17 | 1.5% |
| India | 77 | 7.0% |
| Latin America | 17 | 1.5% |
| Mexico | 17 | 1.5% |
| South Central Asia | 77 | 7.0% | View All 6 Rows |
Sex and Age in New Waverly
Sex and Age in New Waverly
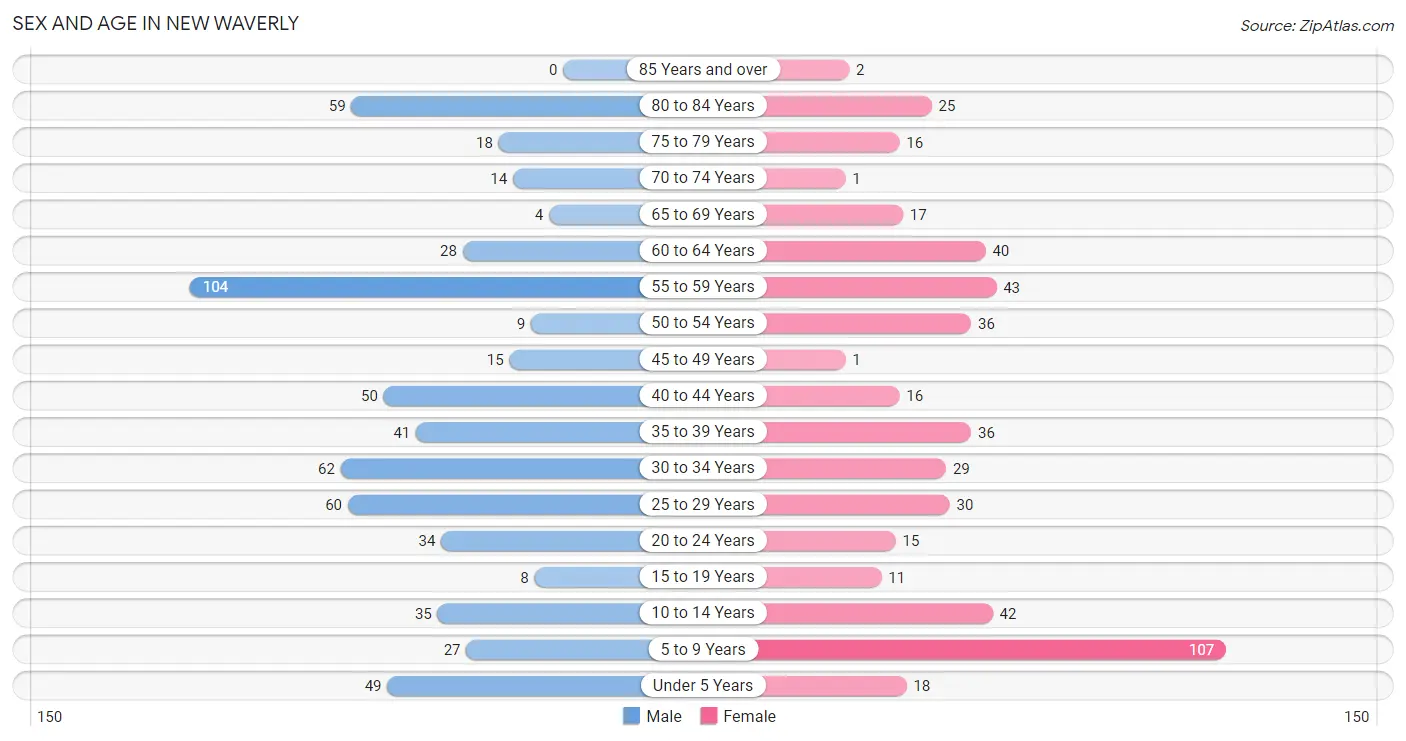
The most populous age groups in New Waverly are 55 to 59 Years (104 | 16.9%) for men and 5 to 9 Years (107 | 22.1%) for women.
| Age Bracket | Male | Female |
| Under 5 Years | 49 (7.9%) | 18 (3.7%) |
| 5 to 9 Years | 27 (4.4%) | 107 (22.1%) |
| 10 to 14 Years | 35 (5.7%) | 42 (8.7%) |
| 15 to 19 Years | 8 (1.3%) | 11 (2.3%) |
| 20 to 24 Years | 34 (5.5%) | 15 (3.1%) |
| 25 to 29 Years | 60 (9.7%) | 30 (6.2%) |
| 30 to 34 Years | 62 (10.1%) | 29 (6.0%) |
| 35 to 39 Years | 41 (6.7%) | 36 (7.4%) |
| 40 to 44 Years | 50 (8.1%) | 16 (3.3%) |
| 45 to 49 Years | 15 (2.4%) | 1 (0.2%) |
| 50 to 54 Years | 9 (1.5%) | 36 (7.4%) |
| 55 to 59 Years | 104 (16.9%) | 43 (8.9%) |
| 60 to 64 Years | 28 (4.5%) | 40 (8.3%) |
| 65 to 69 Years | 4 (0.6%) | 17 (3.5%) |
| 70 to 74 Years | 14 (2.3%) | 1 (0.2%) |
| 75 to 79 Years | 18 (2.9%) | 16 (3.3%) |
| 80 to 84 Years | 59 (9.6%) | 25 (5.1%) |
| 85 Years and over | 0 (0.0%) | 2 (0.4%) |
| Total | 617 (100.0%) | 485 (100.0%) |
Families and Households in New Waverly
Median Family Size in New Waverly
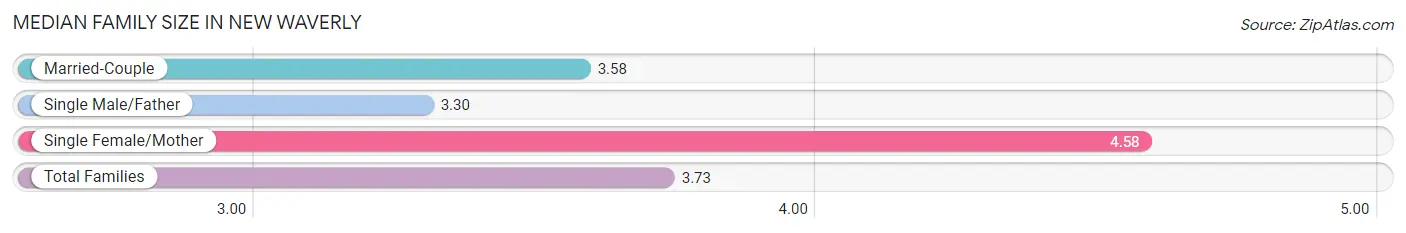
The median family size in New Waverly is 3.73 persons per family, with single female/mother families (48 | 19.9%) accounting for the largest median family size of 4.58 persons per family. On the other hand, single male/father families (43 | 17.8%) represent the smallest median family size with 3.30 persons per family.
| Family Type | # Families | Family Size |
| Married-Couple | 150 (62.2%) | 3.58 |
| Single Male/Father | 43 (17.8%) | 3.30 |
| Single Female/Mother | 48 (19.9%) | 4.58 |
| Total Families | 241 (100.0%) | 3.73 |
Median Household Size in New Waverly
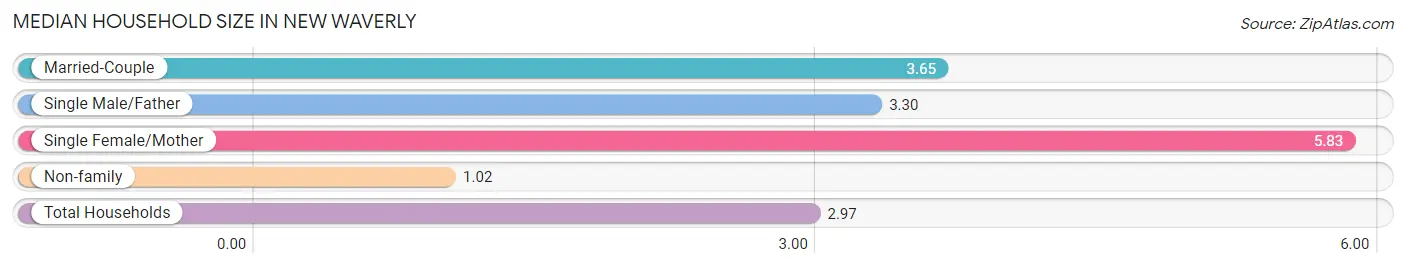
The median household size in New Waverly is 2.97 persons per household, with single female/mother households (48 | 12.9%) accounting for the largest median household size of 5.83 persons per household. non-family households (130 | 35.0%) represent the smallest median household size with 1.02 persons per household.
| Household Type | # Households | Household Size |
| Married-Couple | 150 (40.4%) | 3.65 |
| Single Male/Father | 43 (11.6%) | 3.30 |
| Single Female/Mother | 48 (12.9%) | 5.83 |
| Non-family | 130 (35.0%) | 1.02 |
| Total Households | 371 (100.0%) | 2.97 |
Household Size by Marriage Status in New Waverly
Out of a total of 371 households in New Waverly, 241 (65.0%) are family households, while 130 (35.0%) are nonfamily households. The most numerous type of family households are 3-person households, comprising 98, and the most common type of nonfamily households are 1-person households, comprising 127.
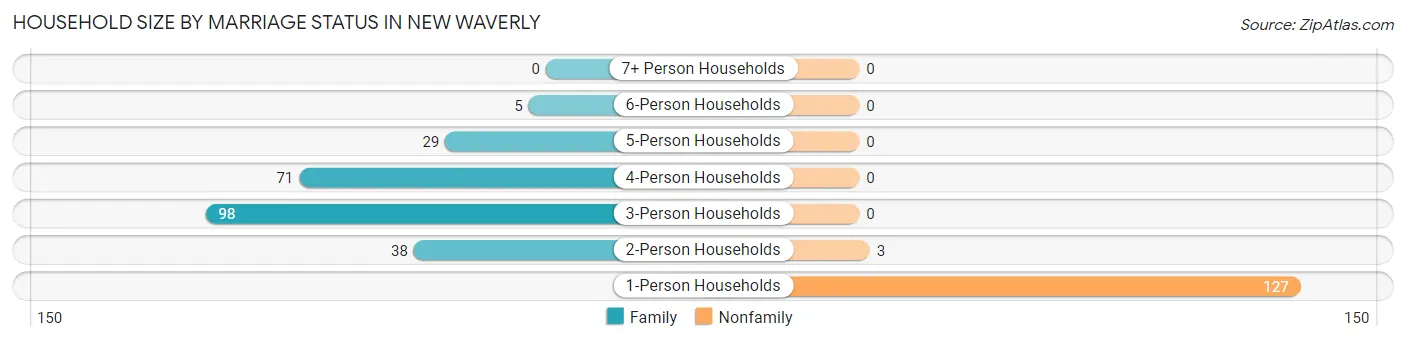
| Household Size | Family Households | Nonfamily Households |
| 1-Person Households | - | 127 (34.2%) |
| 2-Person Households | 38 (10.2%) | 3 (0.8%) |
| 3-Person Households | 98 (26.4%) | 0 (0.0%) |
| 4-Person Households | 71 (19.1%) | 0 (0.0%) |
| 5-Person Households | 29 (7.8%) | 0 (0.0%) |
| 6-Person Households | 5 (1.3%) | 0 (0.0%) |
| 7+ Person Households | 0 (0.0%) | 0 (0.0%) |
| Total | 241 (65.0%) | 130 (35.0%) |
Female Fertility in New Waverly
Fertility by Age in New Waverly
Average fertility rate in New Waverly is 71.0 births per 1,000 women. Women in the age bracket of 20 to 34 years have the highest fertility rate with 135.0 births per 1,000 women. Women in the age bracket of 20 to 34 years acount for 100.0% of all women with births.
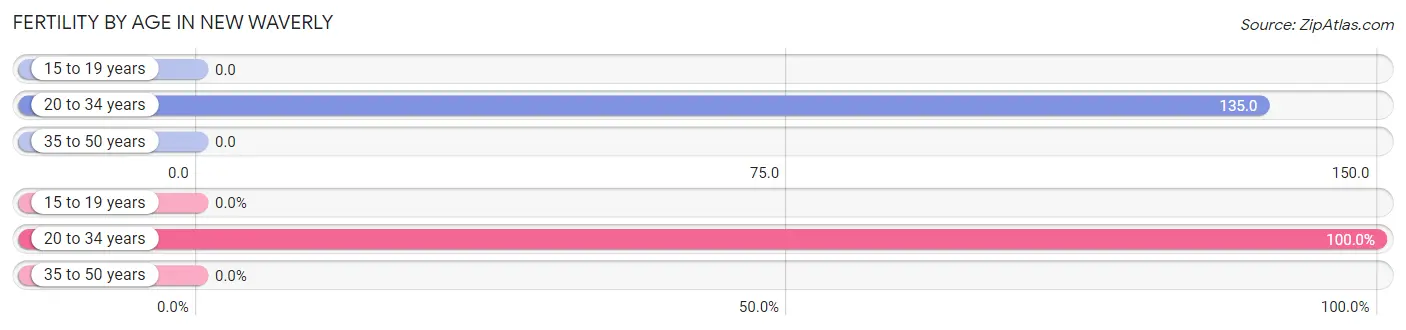
| Age Bracket | Women with Births | Births / 1,000 Women |
| 15 to 19 years | 0 (0.0%) | 0.0 |
| 20 to 34 years | 10 (100.0%) | 135.0 |
| 35 to 50 years | 0 (0.0%) | 0.0 |
| Total | 10 (100.0%) | 71.0 |
Fertility by Age by Marriage Status in New Waverly
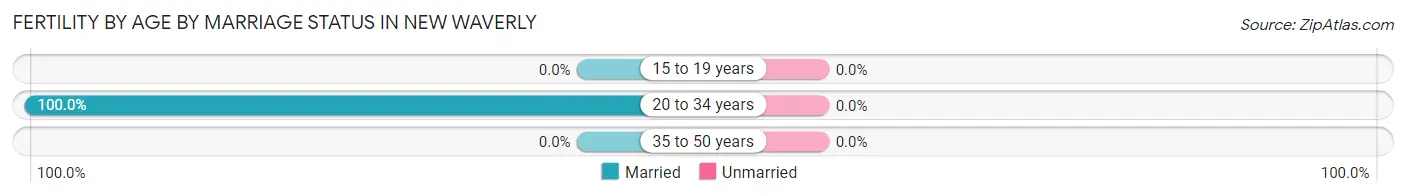
| Age Bracket | Married | Unmarried |
| 15 to 19 years | 0 (0.0%) | 0 (0.0%) |
| 20 to 34 years | 10 (100.0%) | 0 (0.0%) |
| 35 to 50 years | 0 (0.0%) | 0 (0.0%) |
| Total | 10 (100.0%) | 0 (0.0%) |
Fertility by Education in New Waverly
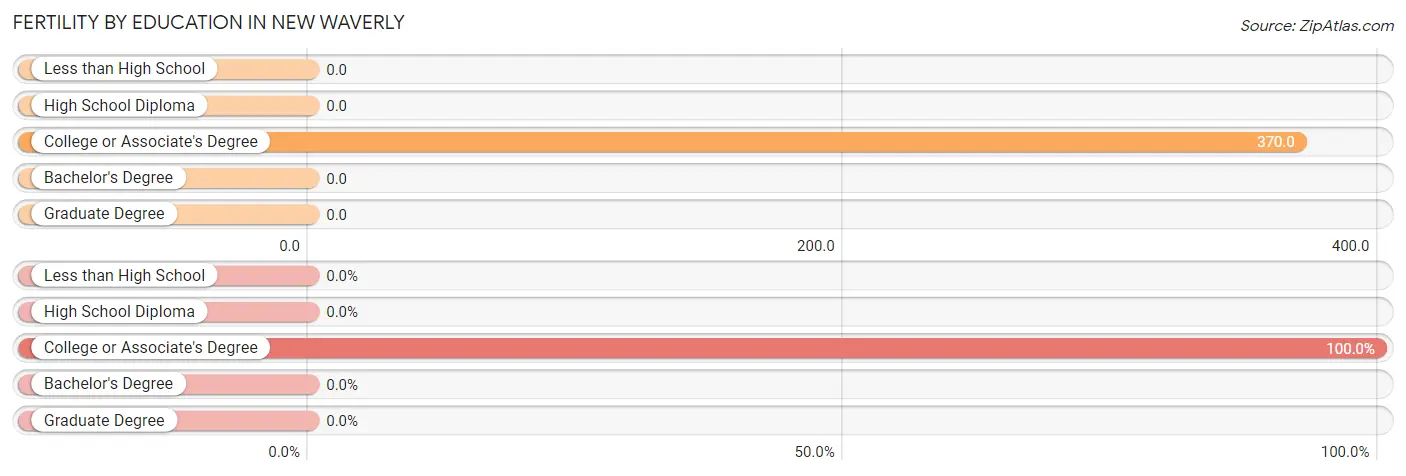
| Educational Attainment | Women with Births | Births / 1,000 Women |
| Less than High School | 0 (0.0%) | 0.0 |
| High School Diploma | 0 (0.0%) | 0.0 |
| College or Associate's Degree | 10 (100.0%) | 370.0 |
| Bachelor's Degree | 0 (0.0%) | 0.0 |
| Graduate Degree | 0 (0.0%) | 0.0 |
| Total | 10 (100.0%) | 71.0 |
Fertility by Education by Marriage Status in New Waverly
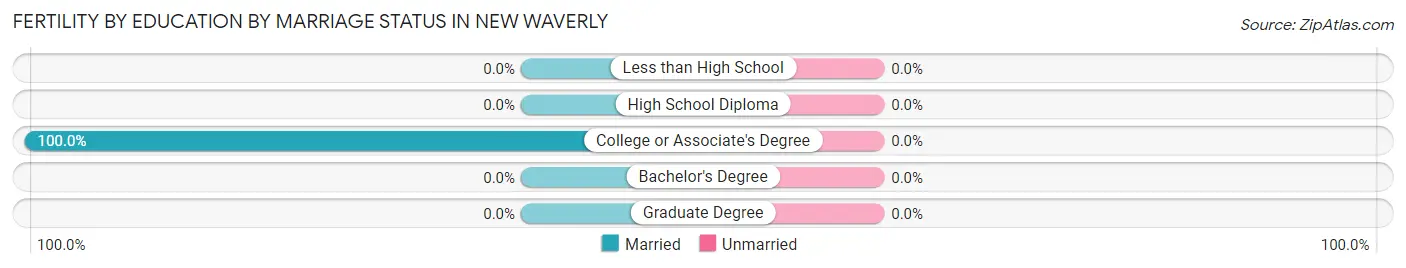
| Educational Attainment | Married | Unmarried |
| Less than High School | 0 (0.0%) | 0 (0.0%) |
| High School Diploma | 0 (0.0%) | 0 (0.0%) |
| College or Associate's Degree | 10 (100.0%) | 0 (0.0%) |
| Bachelor's Degree | 0 (0.0%) | 0 (0.0%) |
| Graduate Degree | 0 (0.0%) | 0 (0.0%) |
| Total | 10 (100.0%) | 0 (0.0%) |
Employment Characteristics in New Waverly
Employment by Class of Employer in New Waverly
Among the 366 employed individuals in New Waverly, private company employees (212 | 57.9%), state government employees (62 | 16.9%), and local government employees (53 | 14.5%) make up the most common classes of employment.
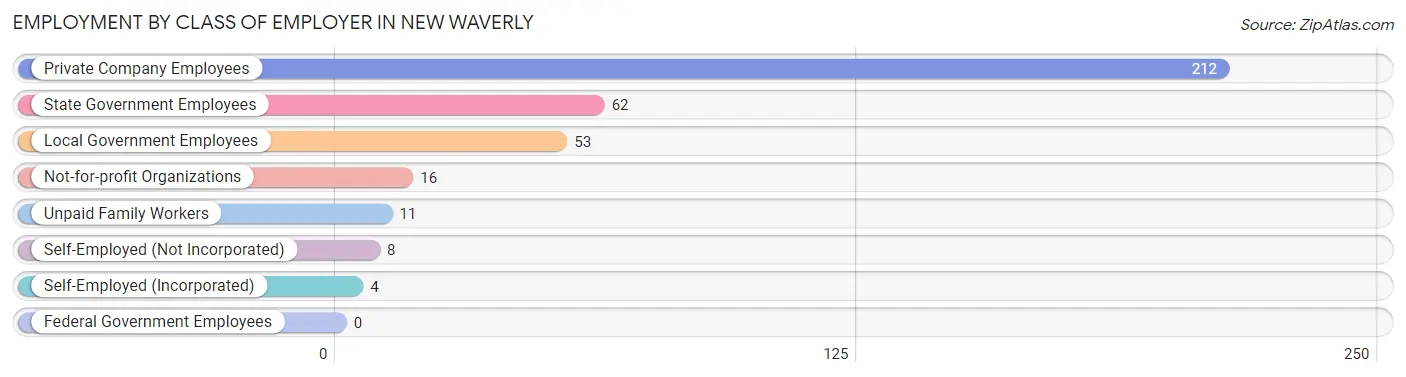
| Employer Class | # Employees | % Employees |
| Private Company Employees | 212 | 57.9% |
| Self-Employed (Incorporated) | 4 | 1.1% |
| Self-Employed (Not Incorporated) | 8 | 2.2% |
| Not-for-profit Organizations | 16 | 4.4% |
| Local Government Employees | 53 | 14.5% |
| State Government Employees | 62 | 16.9% |
| Federal Government Employees | 0 | 0.0% |
| Unpaid Family Workers | 11 | 3.0% |
| Total | 366 | 100.0% |
Employment Status by Age in New Waverly
According to the labor force statistics for New Waverly, out of the total population over 16 years of age (820), 46.1% or 378 individuals are in the labor force, with 3.2% or 12 of them unemployed. The age group with the highest labor force participation rate is 30 to 34 years, with 100.0% or 91 individuals in the labor force. Within the labor force, the 25 to 29 years age range has the highest percentage of unemployed individuals, with 13.8% or 12 of them being unemployed.
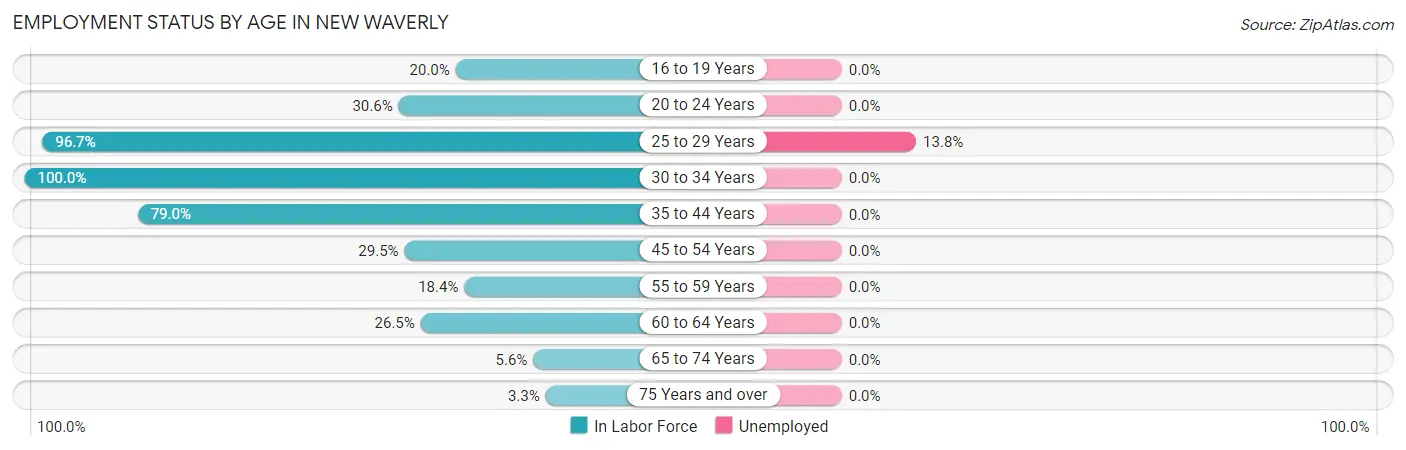
| Age Bracket | In Labor Force | Unemployed |
| 16 to 19 Years | 3 (20.0%) | 0 (0.0%) |
| 20 to 24 Years | 15 (30.6%) | 0 (0.0%) |
| 25 to 29 Years | 87 (96.7%) | 12 (13.8%) |
| 30 to 34 Years | 91 (100.0%) | 0 (0.0%) |
| 35 to 44 Years | 113 (79.0%) | 0 (0.0%) |
| 45 to 54 Years | 18 (29.5%) | 0 (0.0%) |
| 55 to 59 Years | 27 (18.4%) | 0 (0.0%) |
| 60 to 64 Years | 18 (26.5%) | 0 (0.0%) |
| 65 to 74 Years | 2 (5.6%) | 0 (0.0%) |
| 75 Years and over | 4 (3.3%) | 0 (0.0%) |
| Total | 378 (46.1%) | 12 (3.2%) |
Employment Status by Educational Attainment in New Waverly
According to labor force statistics for New Waverly, 59.0% of individuals (354) out of the total population between 25 and 64 years of age (600) are in the labor force, with 3.4% or 12 of them being unemployed. The group with the highest labor force participation rate are those with the educational attainment of bachelor's degree or higher, with 76.0% or 79 individuals in the labor force. Within the labor force, individuals with high school diploma education have the highest percentage of unemployment, with 5.8% or 12 of them being unemployed.
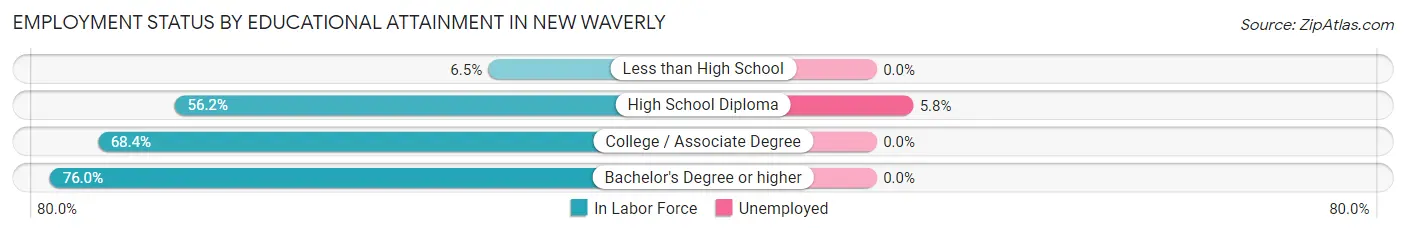
| Educational Attainment | In Labor Force | Unemployed |
| Less than High School | 2 (6.5%) | 0 (0.0%) |
| High School Diploma | 208 (56.2%) | 21 (5.8%) |
| College / Associate Degree | 65 (68.4%) | 0 (0.0%) |
| Bachelor's Degree or higher | 79 (76.0%) | 0 (0.0%) |
| Total | 354 (59.0%) | 20 (3.4%) |
Employment Occupations by Sex in New Waverly
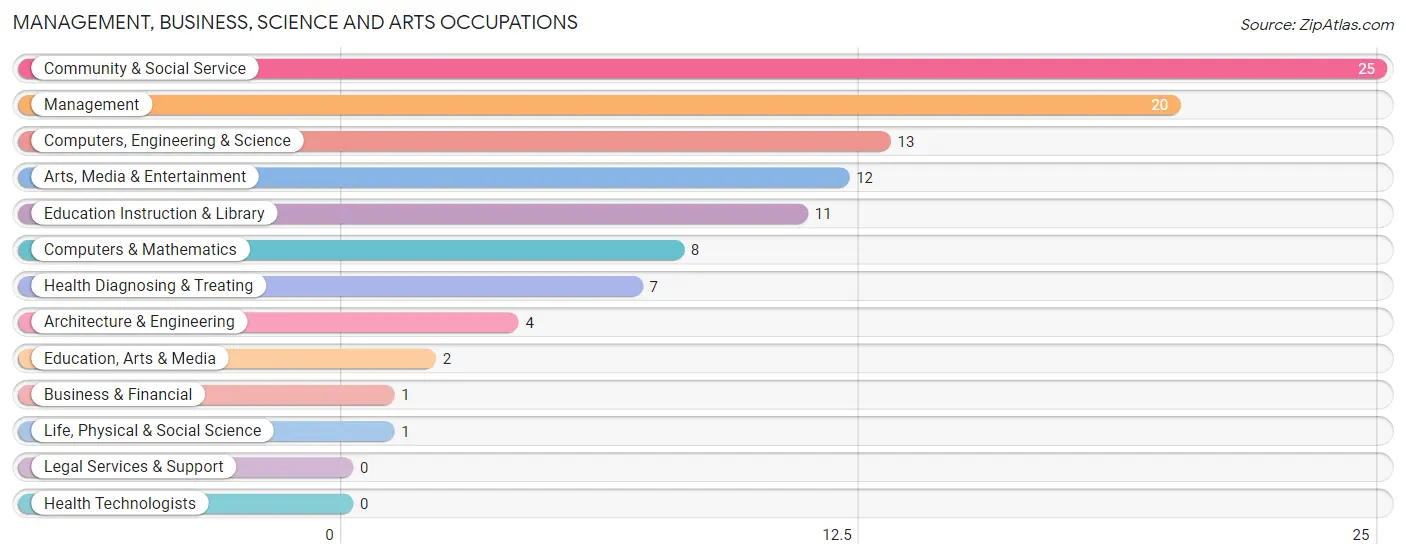
Management, Business, Science and Arts Occupations
The most common Management, Business, Science and Arts occupations in New Waverly are Community & Social Service (25 | 6.8%), Management (20 | 5.5%), Computers, Engineering & Science (13 | 3.5%), Arts, Media & Entertainment (12 | 3.3%), and Education Instruction & Library (11 | 3.0%).
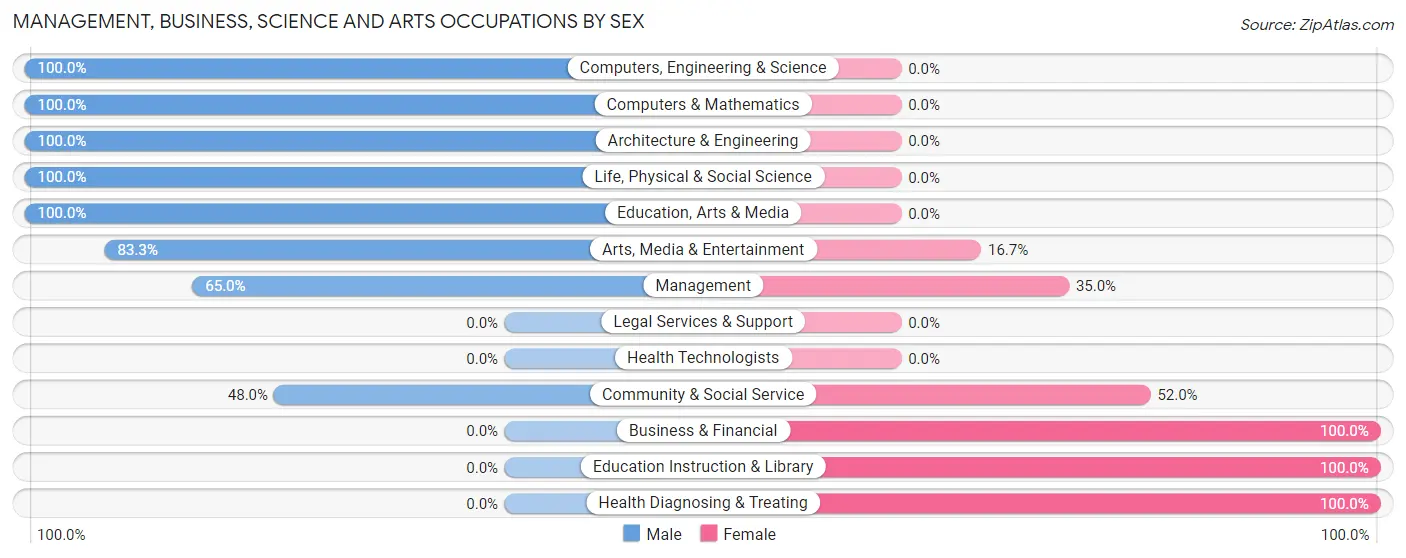
Management, Business, Science and Arts Occupations by Sex
Within the Management, Business, Science and Arts occupations in New Waverly, the most male-oriented occupations are Computers, Engineering & Science (100.0%), Computers & Mathematics (100.0%), and Architecture & Engineering (100.0%), while the most female-oriented occupations are Business & Financial (100.0%), Education Instruction & Library (100.0%), and Health Diagnosing & Treating (100.0%).
| Occupation | Male | Female |
| Management | 13 (65.0%) | 7 (35.0%) |
| Business & Financial | 0 (0.0%) | 1 (100.0%) |
| Computers, Engineering & Science | 13 (100.0%) | 0 (0.0%) |
| Computers & Mathematics | 8 (100.0%) | 0 (0.0%) |
| Architecture & Engineering | 4 (100.0%) | 0 (0.0%) |
| Life, Physical & Social Science | 1 (100.0%) | 0 (0.0%) |
| Community & Social Service | 12 (48.0%) | 13 (52.0%) |
| Education, Arts & Media | 2 (100.0%) | 0 (0.0%) |
| Legal Services & Support | 0 (0.0%) | 0 (0.0%) |
| Education Instruction & Library | 0 (0.0%) | 11 (100.0%) |
| Arts, Media & Entertainment | 10 (83.3%) | 2 (16.7%) |
| Health Diagnosing & Treating | 0 (0.0%) | 7 (100.0%) |
| Health Technologists | 0 (0.0%) | 0 (0.0%) |
| Total (Category) | 38 (57.6%) | 28 (42.4%) |
| Total (Overall) | 258 (70.5%) | 108 (29.5%) |
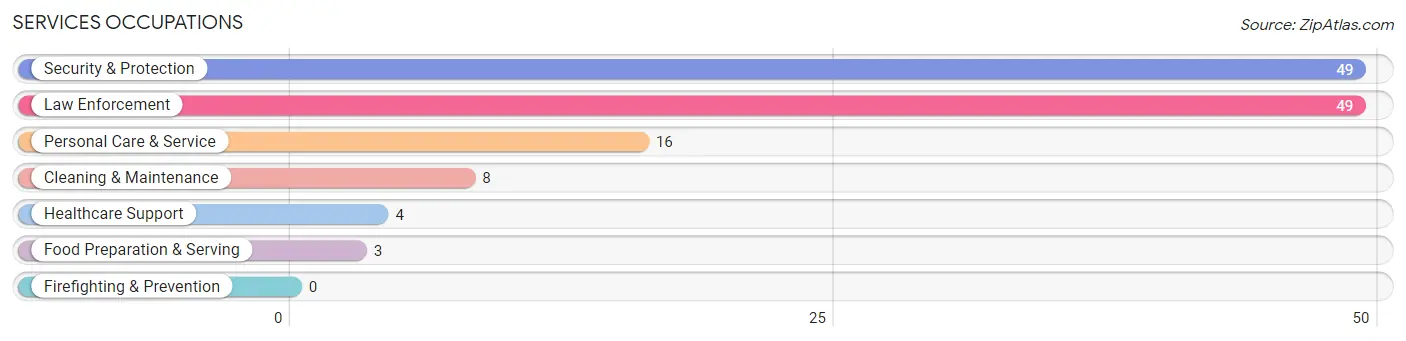
Services Occupations
The most common Services occupations in New Waverly are Security & Protection (49 | 13.4%), Law Enforcement (49 | 13.4%), Personal Care & Service (16 | 4.4%), Cleaning & Maintenance (8 | 2.2%), and Healthcare Support (4 | 1.1%).
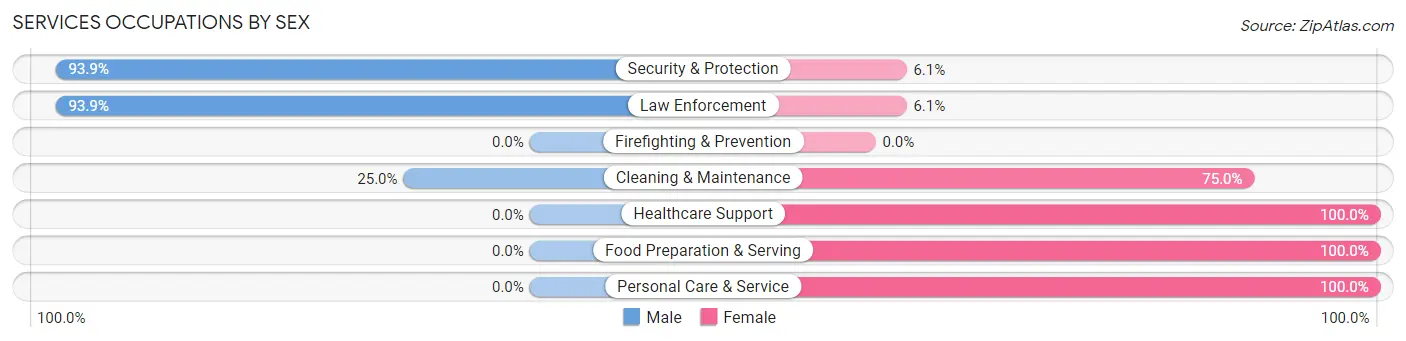
Services Occupations by Sex
Within the Services occupations in New Waverly, the most male-oriented occupations are Security & Protection (93.9%), Law Enforcement (93.9%), and Cleaning & Maintenance (25.0%), while the most female-oriented occupations are Healthcare Support (100.0%), Food Preparation & Serving (100.0%), and Personal Care & Service (100.0%).
| Occupation | Male | Female |
| Healthcare Support | 0 (0.0%) | 4 (100.0%) |
| Security & Protection | 46 (93.9%) | 3 (6.1%) |
| Firefighting & Prevention | 0 (0.0%) | 0 (0.0%) |
| Law Enforcement | 46 (93.9%) | 3 (6.1%) |
| Food Preparation & Serving | 0 (0.0%) | 3 (100.0%) |
| Cleaning & Maintenance | 2 (25.0%) | 6 (75.0%) |
| Personal Care & Service | 0 (0.0%) | 16 (100.0%) |
| Total (Category) | 48 (60.0%) | 32 (40.0%) |
| Total (Overall) | 258 (70.5%) | 108 (29.5%) |
Sales and Office Occupations
The most common Sales and Office occupations in New Waverly are Office & Administration (40 | 10.9%), and Sales & Related (17 | 4.6%).

Sales and Office Occupations by Sex

| Occupation | Male | Female |
| Sales & Related | 2 (11.8%) | 15 (88.2%) |
| Office & Administration | 11 (27.5%) | 29 (72.5%) |
| Total (Category) | 13 (22.8%) | 44 (77.2%) |
| Total (Overall) | 258 (70.5%) | 108 (29.5%) |
Natural Resources, Construction and Maintenance Occupations
The most common Natural Resources, Construction and Maintenance occupations in New Waverly are Construction & Extraction (77 | 21.0%), Installation, Maintenance & Repair (12 | 3.3%), and Farming, Fishing & Forestry (11 | 3.0%).
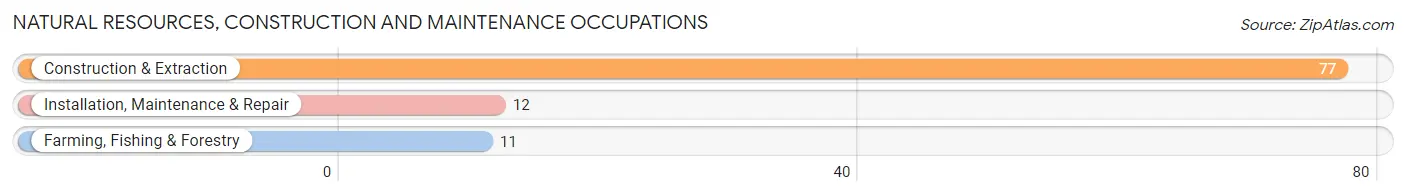
Natural Resources, Construction and Maintenance Occupations by Sex
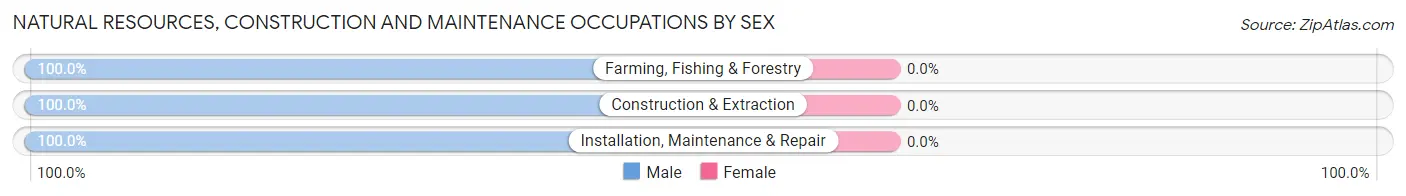
| Occupation | Male | Female |
| Farming, Fishing & Forestry | 11 (100.0%) | 0 (0.0%) |
| Construction & Extraction | 77 (100.0%) | 0 (0.0%) |
| Installation, Maintenance & Repair | 12 (100.0%) | 0 (0.0%) |
| Total (Category) | 100 (100.0%) | 0 (0.0%) |
| Total (Overall) | 258 (70.5%) | 108 (29.5%) |
Production, Transportation and Moving Occupations
The most common Production, Transportation and Moving occupations in New Waverly are Transportation (41 | 11.2%), Material Moving (13 | 3.5%), and Production (9 | 2.5%).
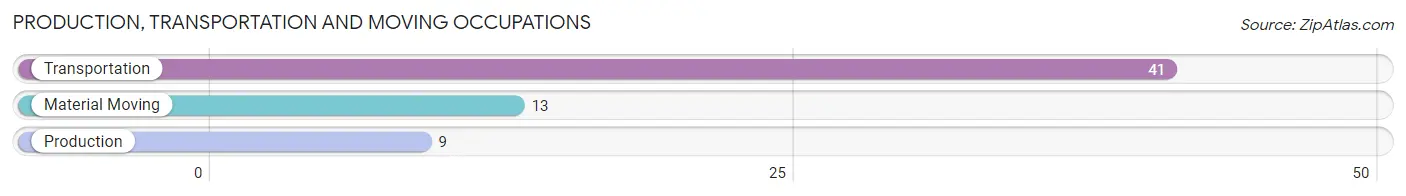
Production, Transportation and Moving Occupations by Sex
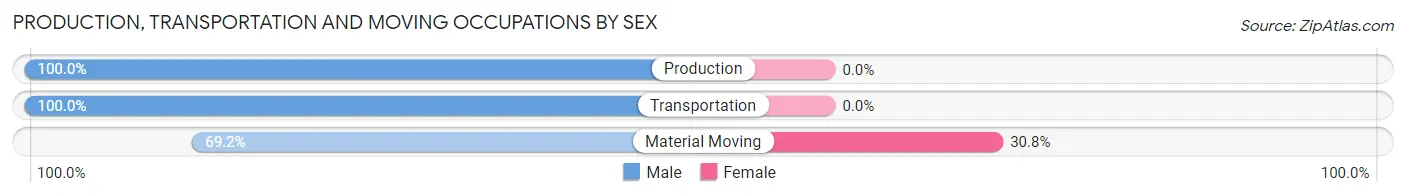
| Occupation | Male | Female |
| Production | 9 (100.0%) | 0 (0.0%) |
| Transportation | 41 (100.0%) | 0 (0.0%) |
| Material Moving | 9 (69.2%) | 4 (30.8%) |
| Total (Category) | 59 (93.6%) | 4 (6.4%) |
| Total (Overall) | 258 (70.5%) | 108 (29.5%) |
Employment Industries by Sex in New Waverly
Employment Industries in New Waverly
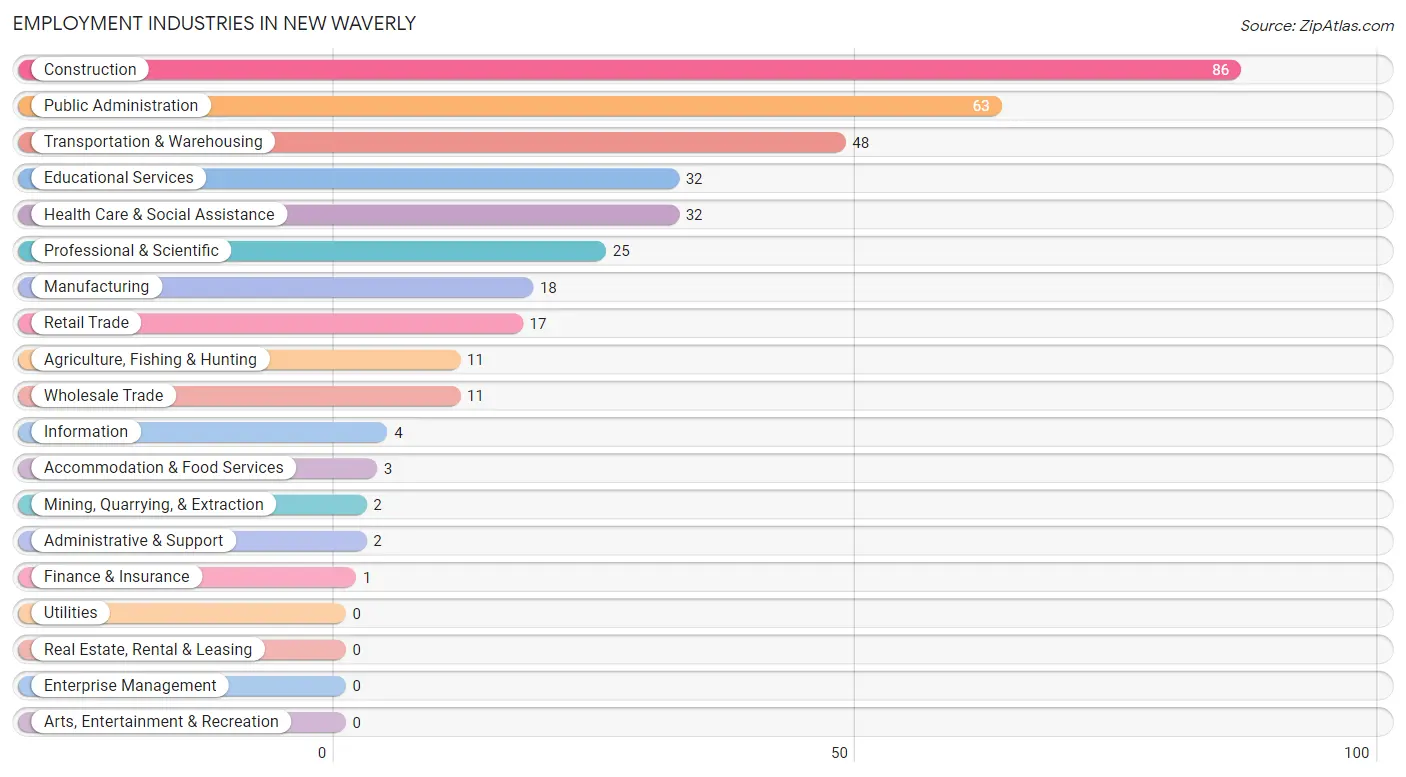
The major employment industries in New Waverly include Construction (86 | 23.5%), Public Administration (63 | 17.2%), Transportation & Warehousing (48 | 13.1%), Educational Services (32 | 8.7%), and Health Care & Social Assistance (32 | 8.7%).
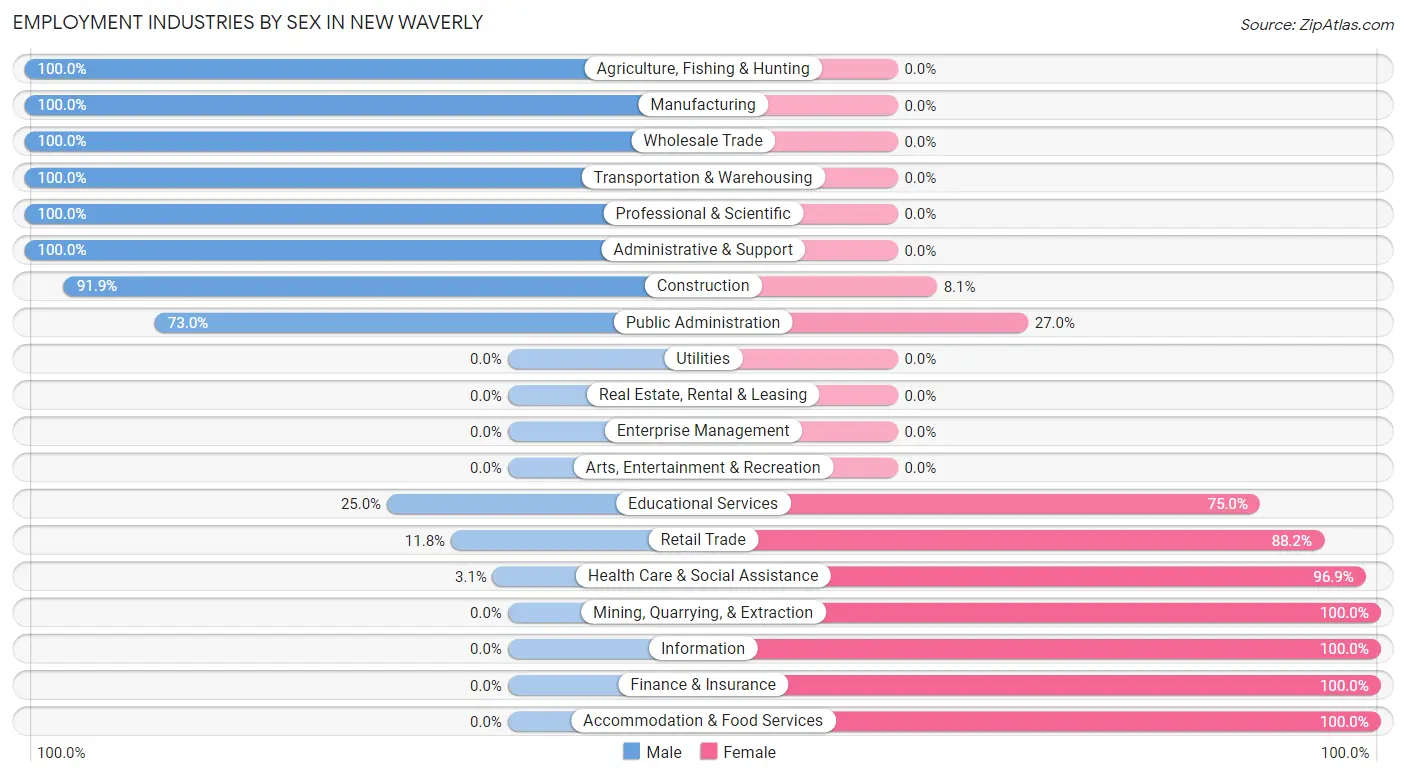
Employment Industries by Sex in New Waverly
The New Waverly industries that see more men than women are Agriculture, Fishing & Hunting (100.0%), Manufacturing (100.0%), and Wholesale Trade (100.0%), whereas the industries that tend to have a higher number of women are Mining, Quarrying, & Extraction (100.0%), Information (100.0%), and Finance & Insurance (100.0%).
| Industry | Male | Female |
| Agriculture, Fishing & Hunting | 11 (100.0%) | 0 (0.0%) |
| Mining, Quarrying, & Extraction | 0 (0.0%) | 2 (100.0%) |
| Construction | 79 (91.9%) | 7 (8.1%) |
| Manufacturing | 18 (100.0%) | 0 (0.0%) |
| Wholesale Trade | 11 (100.0%) | 0 (0.0%) |
| Retail Trade | 2 (11.8%) | 15 (88.2%) |
| Transportation & Warehousing | 48 (100.0%) | 0 (0.0%) |
| Utilities | 0 (0.0%) | 0 (0.0%) |
| Information | 0 (0.0%) | 4 (100.0%) |
| Finance & Insurance | 0 (0.0%) | 1 (100.0%) |
| Real Estate, Rental & Leasing | 0 (0.0%) | 0 (0.0%) |
| Professional & Scientific | 25 (100.0%) | 0 (0.0%) |
| Enterprise Management | 0 (0.0%) | 0 (0.0%) |
| Administrative & Support | 2 (100.0%) | 0 (0.0%) |
| Educational Services | 8 (25.0%) | 24 (75.0%) |
| Health Care & Social Assistance | 1 (3.1%) | 31 (96.9%) |
| Arts, Entertainment & Recreation | 0 (0.0%) | 0 (0.0%) |
| Accommodation & Food Services | 0 (0.0%) | 3 (100.0%) |
| Public Administration | 46 (73.0%) | 17 (27.0%) |
| Total | 258 (70.5%) | 108 (29.5%) |
Education in New Waverly
School Enrollment in New Waverly
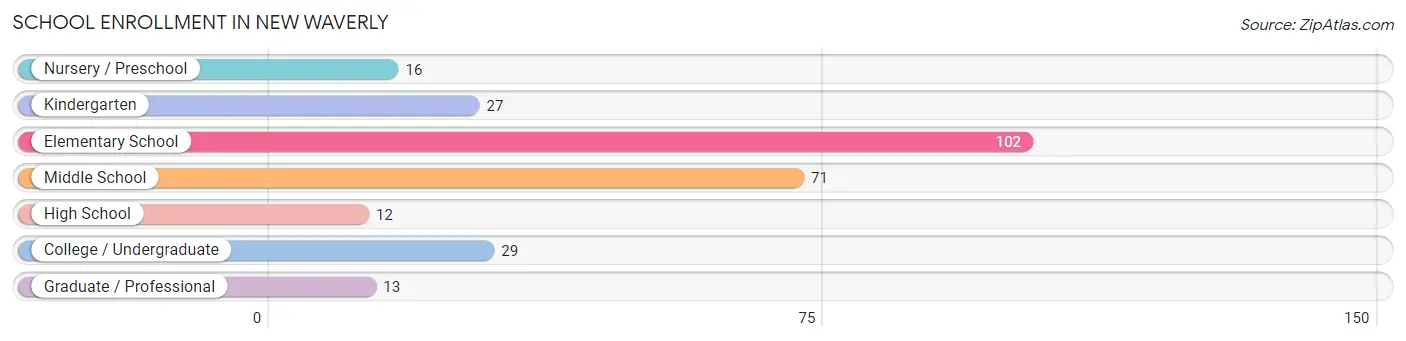
The most common levels of schooling among the 270 students in New Waverly are elementary school (102 | 37.8%), middle school (71 | 26.3%), and college / undergraduate (29 | 10.7%).
| School Level | # Students | % Students |
| Nursery / Preschool | 16 | 5.9% |
| Kindergarten | 27 | 10.0% |
| Elementary School | 102 | 37.8% |
| Middle School | 71 | 26.3% |
| High School | 12 | 4.4% |
| College / Undergraduate | 29 | 10.7% |
| Graduate / Professional | 13 | 4.8% |
| Total | 270 | 100.0% |
School Enrollment by Age by Funding Source in New Waverly
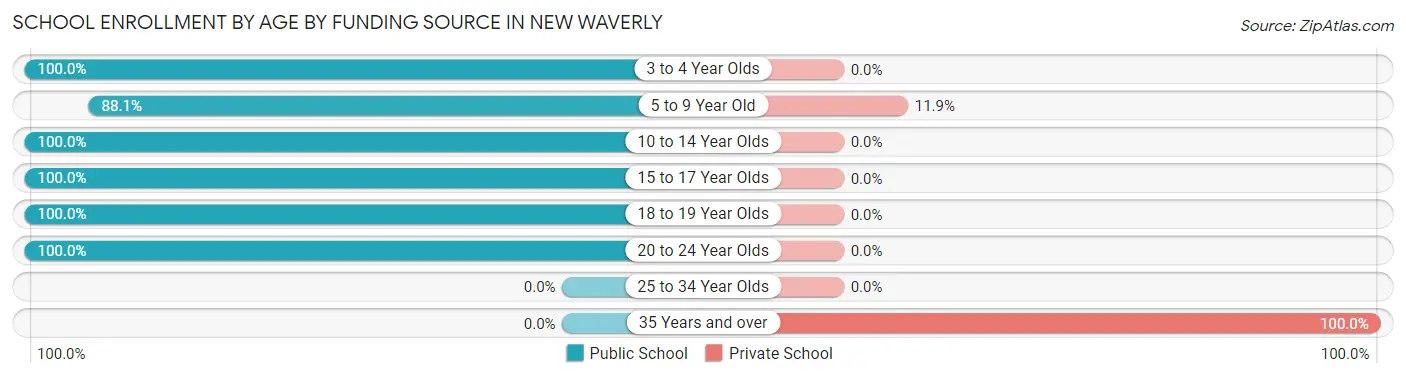
Out of a total of 270 students who are enrolled in schools in New Waverly, 29 (10.7%) attend a private institution, while the remaining 241 (89.3%) are enrolled in public schools. The age group of 35 years and over has the highest likelihood of being enrolled in private schools, with 13 (100.0% in the age bracket) enrolled. Conversely, the age group of 3 to 4 year olds has the lowest likelihood of being enrolled in a private school, with 5 (100.0% in the age bracket) attending a public institution.
| Age Bracket | Public School | Private School |
| 3 to 4 Year Olds | 5 (100.0%) | 0 (0.0%) |
| 5 to 9 Year Old | 118 (88.1%) | 16 (11.9%) |
| 10 to 14 Year Olds | 77 (100.0%) | 0 (0.0%) |
| 15 to 17 Year Olds | 16 (100.0%) | 0 (0.0%) |
| 18 to 19 Year Olds | 3 (100.0%) | 0 (0.0%) |
| 20 to 24 Year Olds | 22 (100.0%) | 0 (0.0%) |
| 25 to 34 Year Olds | 0 (0.0%) | 0 (0.0%) |
| 35 Years and over | 0 (0.0%) | 13 (100.0%) |
| Total | 241 (89.3%) | 29 (10.7%) |
Educational Attainment by Field of Study in New Waverly
Education (34 | 27.2%), business (29 | 23.2%), science & technology (16 | 12.8%), liberal arts & history (13 | 10.4%), and bio, nature & agricultural (9 | 7.2%) are the most common fields of study among 125 individuals in New Waverly who have obtained a bachelor's degree or higher.
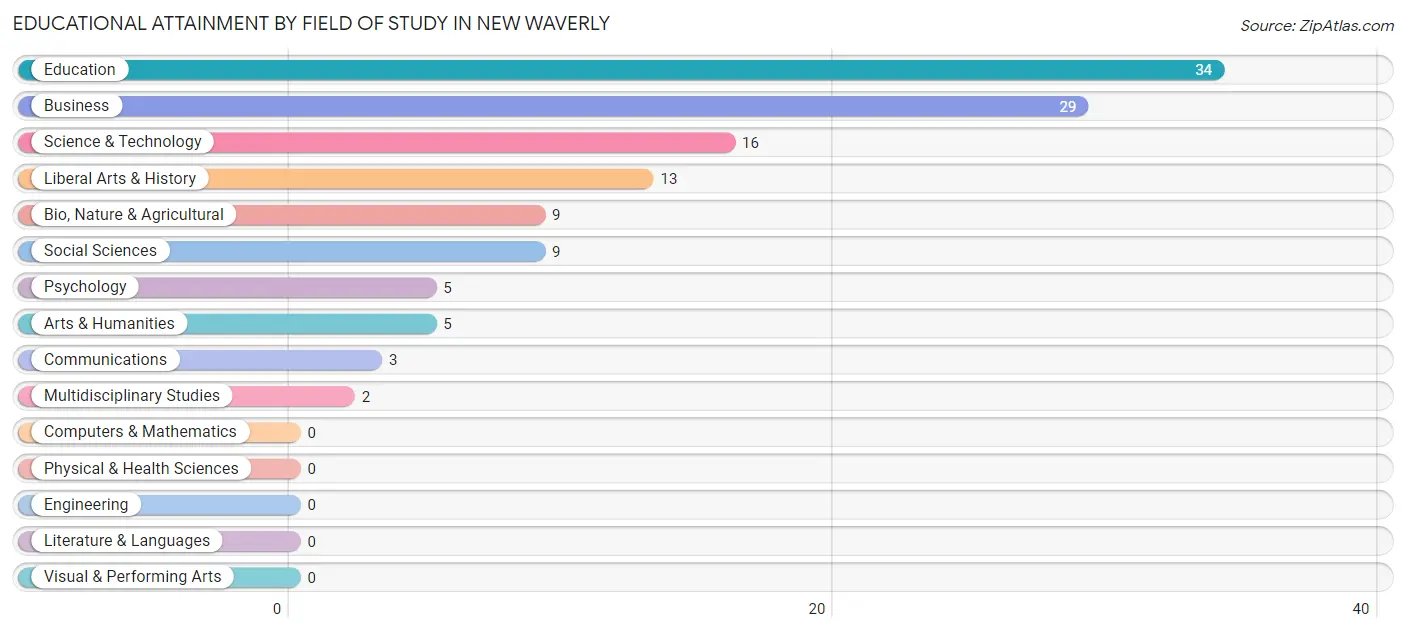
| Field of Study | # Graduates | % Graduates |
| Computers & Mathematics | 0 | 0.0% |
| Bio, Nature & Agricultural | 9 | 7.2% |
| Physical & Health Sciences | 0 | 0.0% |
| Psychology | 5 | 4.0% |
| Social Sciences | 9 | 7.2% |
| Engineering | 0 | 0.0% |
| Multidisciplinary Studies | 2 | 1.6% |
| Science & Technology | 16 | 12.8% |
| Business | 29 | 23.2% |
| Education | 34 | 27.2% |
| Literature & Languages | 0 | 0.0% |
| Liberal Arts & History | 13 | 10.4% |
| Visual & Performing Arts | 0 | 0.0% |
| Communications | 3 | 2.4% |
| Arts & Humanities | 5 | 4.0% |
| Total | 125 | 100.0% |
Transportation & Commute in New Waverly
Vehicle Availability by Sex in New Waverly
The most prevalent vehicle ownership categories in New Waverly are males with 2 vehicles (107, accounting for 41.5%) and females with 2 vehicles (37, making up 99.1%).
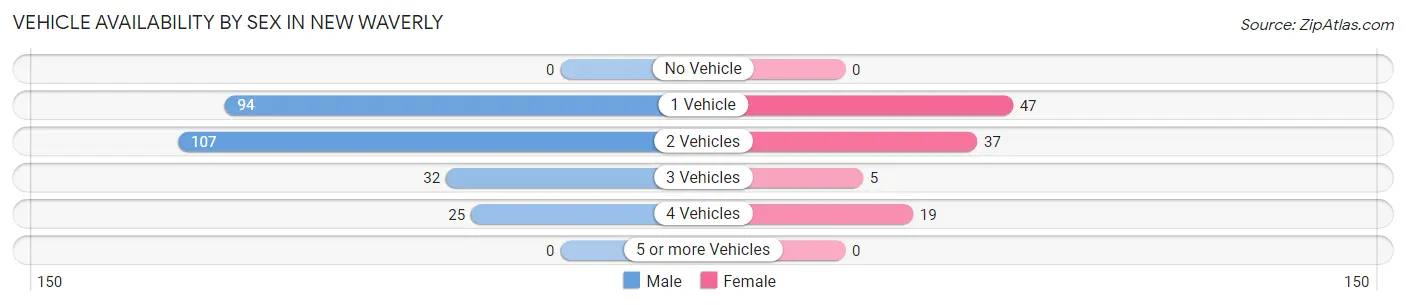
| Vehicles Available | Male | Female |
| No Vehicle | 0 (0.0%) | 0 (0.0%) |
| 1 Vehicle | 94 (36.4%) | 47 (43.5%) |
| 2 Vehicles | 107 (41.5%) | 37 (34.3%) |
| 3 Vehicles | 32 (12.4%) | 5 (4.6%) |
| 4 Vehicles | 25 (9.7%) | 19 (17.6%) |
| 5 or more Vehicles | 0 (0.0%) | 0 (0.0%) |
| Total | 258 (100.0%) | 108 (100.0%) |
Commute Time in New Waverly
The most frequently occuring commute durations in New Waverly are 30 to 34 minutes (139 commuters, 38.0%), 35 to 39 minutes (38 commuters, 10.4%), and 15 to 19 minutes (36 commuters, 9.8%).
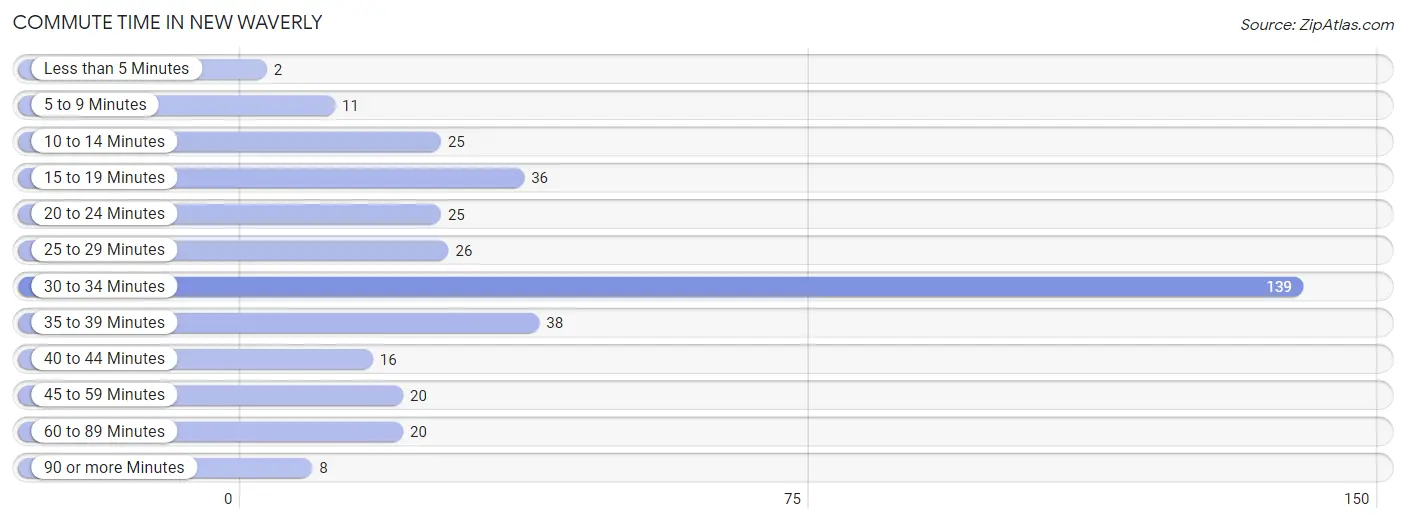
| Commute Time | # Commuters | % Commuters |
| Less than 5 Minutes | 2 | 0.5% |
| 5 to 9 Minutes | 11 | 3.0% |
| 10 to 14 Minutes | 25 | 6.8% |
| 15 to 19 Minutes | 36 | 9.8% |
| 20 to 24 Minutes | 25 | 6.8% |
| 25 to 29 Minutes | 26 | 7.1% |
| 30 to 34 Minutes | 139 | 38.0% |
| 35 to 39 Minutes | 38 | 10.4% |
| 40 to 44 Minutes | 16 | 4.4% |
| 45 to 59 Minutes | 20 | 5.5% |
| 60 to 89 Minutes | 20 | 5.5% |
| 90 or more Minutes | 8 | 2.2% |
Commute Time by Sex in New Waverly
The most common commute times in New Waverly are 30 to 34 minutes (125 commuters, 48.4%) for males and 15 to 19 minutes (22 commuters, 20.4%) for females.
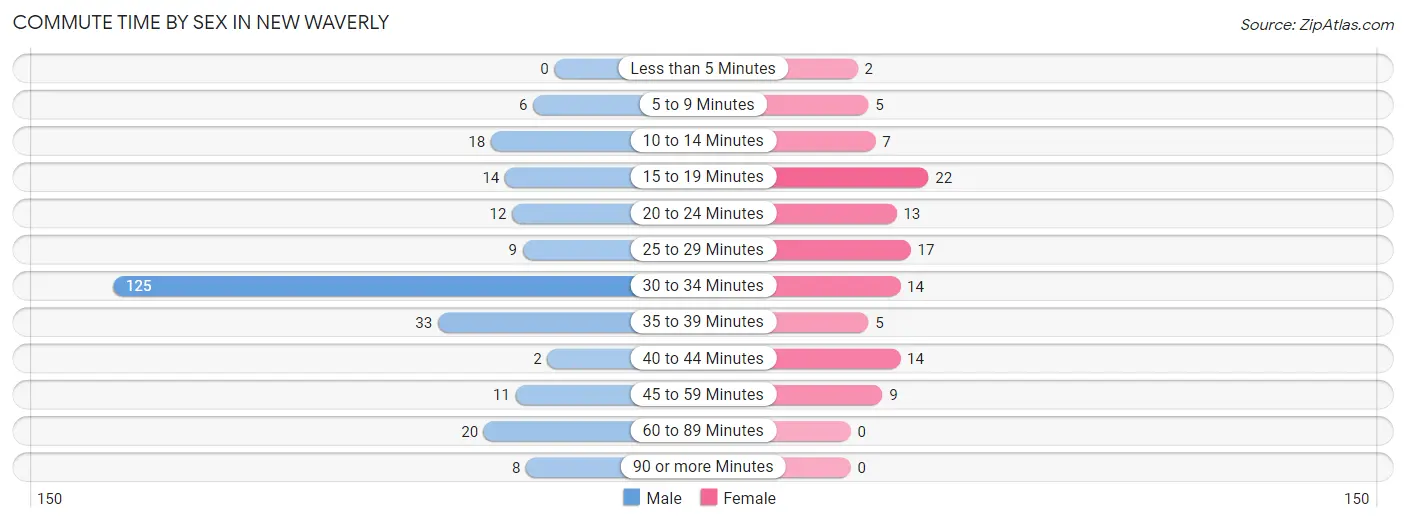
| Commute Time | Male | Female |
| Less than 5 Minutes | 0 (0.0%) | 2 (1.8%) |
| 5 to 9 Minutes | 6 (2.3%) | 5 (4.6%) |
| 10 to 14 Minutes | 18 (7.0%) | 7 (6.5%) |
| 15 to 19 Minutes | 14 (5.4%) | 22 (20.4%) |
| 20 to 24 Minutes | 12 (4.6%) | 13 (12.0%) |
| 25 to 29 Minutes | 9 (3.5%) | 17 (15.7%) |
| 30 to 34 Minutes | 125 (48.4%) | 14 (13.0%) |
| 35 to 39 Minutes | 33 (12.8%) | 5 (4.6%) |
| 40 to 44 Minutes | 2 (0.8%) | 14 (13.0%) |
| 45 to 59 Minutes | 11 (4.3%) | 9 (8.3%) |
| 60 to 89 Minutes | 20 (7.7%) | 0 (0.0%) |
| 90 or more Minutes | 8 (3.1%) | 0 (0.0%) |
Time of Departure to Work by Sex in New Waverly
The most frequent times of departure to work in New Waverly are 6:00 AM to 6:29 AM (87, 33.7%) for males and 6:00 AM to 6:29 AM (41, 38.0%) for females.
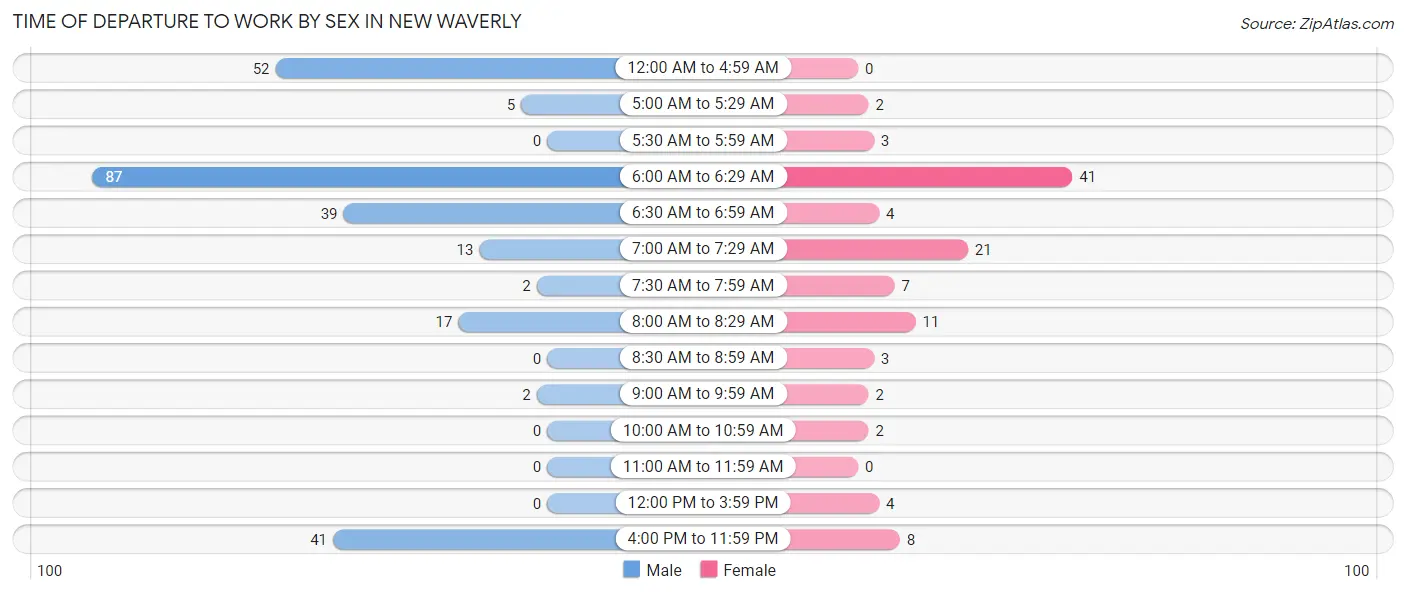
| Time of Departure | Male | Female |
| 12:00 AM to 4:59 AM | 52 (20.2%) | 0 (0.0%) |
| 5:00 AM to 5:29 AM | 5 (1.9%) | 2 (1.8%) |
| 5:30 AM to 5:59 AM | 0 (0.0%) | 3 (2.8%) |
| 6:00 AM to 6:29 AM | 87 (33.7%) | 41 (38.0%) |
| 6:30 AM to 6:59 AM | 39 (15.1%) | 4 (3.7%) |
| 7:00 AM to 7:29 AM | 13 (5.0%) | 21 (19.4%) |
| 7:30 AM to 7:59 AM | 2 (0.8%) | 7 (6.5%) |
| 8:00 AM to 8:29 AM | 17 (6.6%) | 11 (10.2%) |
| 8:30 AM to 8:59 AM | 0 (0.0%) | 3 (2.8%) |
| 9:00 AM to 9:59 AM | 2 (0.8%) | 2 (1.8%) |
| 10:00 AM to 10:59 AM | 0 (0.0%) | 2 (1.8%) |
| 11:00 AM to 11:59 AM | 0 (0.0%) | 0 (0.0%) |
| 12:00 PM to 3:59 PM | 0 (0.0%) | 4 (3.7%) |
| 4:00 PM to 11:59 PM | 41 (15.9%) | 8 (7.4%) |
| Total | 258 (100.0%) | 108 (100.0%) |
Housing Occupancy in New Waverly
Occupancy by Ownership in New Waverly
Of the total 371 dwellings in New Waverly, owner-occupied units account for 232 (62.5%), while renter-occupied units make up 139 (37.5%).
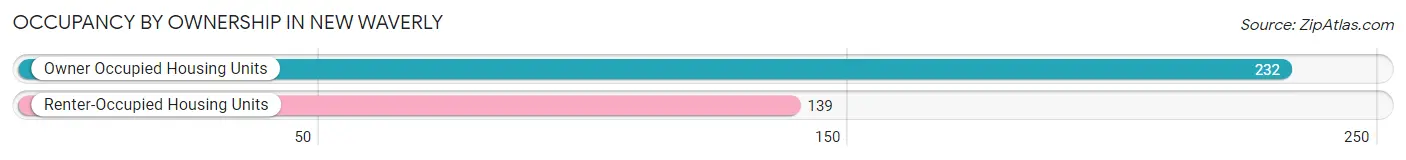
| Occupancy | # Housing Units | % Housing Units |
| Owner Occupied Housing Units | 232 | 62.5% |
| Renter-Occupied Housing Units | 139 | 37.5% |
| Total Occupied Housing Units | 371 | 100.0% |
Occupancy by Household Size in New Waverly
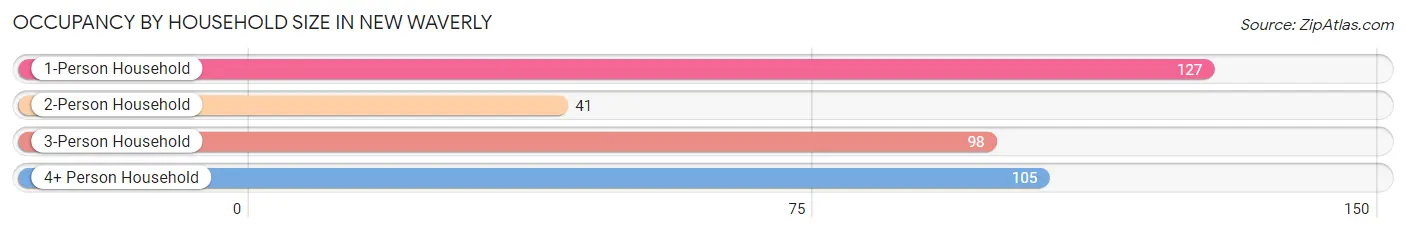
| Household Size | # Housing Units | % Housing Units |
| 1-Person Household | 127 | 34.2% |
| 2-Person Household | 41 | 11.1% |
| 3-Person Household | 98 | 26.4% |
| 4+ Person Household | 105 | 28.3% |
| Total Housing Units | 371 | 100.0% |
Occupancy by Ownership by Household Size in New Waverly
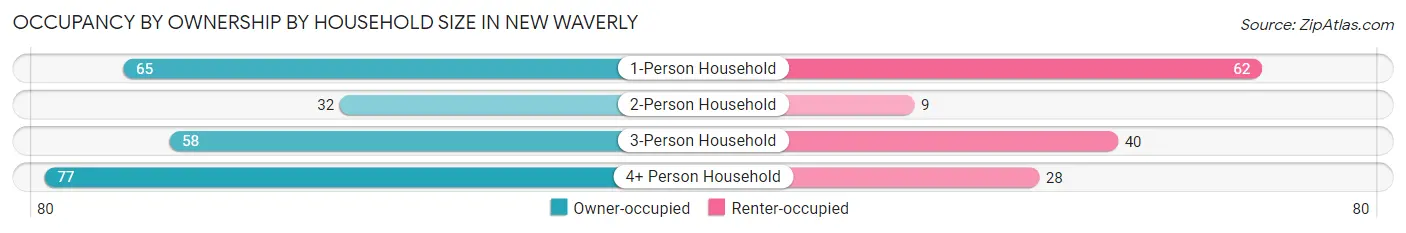
| Household Size | Owner-occupied | Renter-occupied |
| 1-Person Household | 65 (51.2%) | 62 (48.8%) |
| 2-Person Household | 32 (78.0%) | 9 (22.0%) |
| 3-Person Household | 58 (59.2%) | 40 (40.8%) |
| 4+ Person Household | 77 (73.3%) | 28 (26.7%) |
| Total Housing Units | 232 (62.5%) | 139 (37.5%) |
Occupancy by Educational Attainment in New Waverly
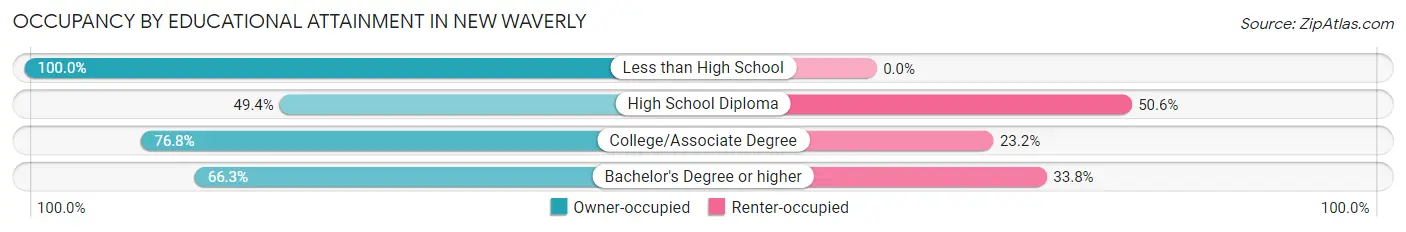
| Household Size | Owner-occupied | Renter-occupied |
| Less than High School | 18 (100.0%) | 0 (0.0%) |
| High School Diploma | 88 (49.4%) | 90 (50.6%) |
| College/Associate Degree | 73 (76.8%) | 22 (23.2%) |
| Bachelor's Degree or higher | 53 (66.2%) | 27 (33.8%) |
Occupancy by Age of Householder in New Waverly
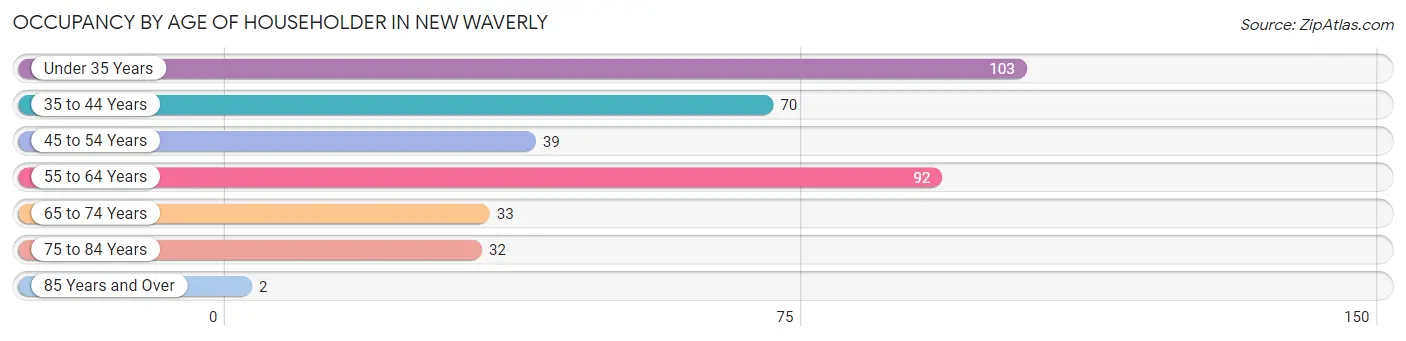
| Age Bracket | # Households | % Households |
| Under 35 Years | 103 | 27.8% |
| 35 to 44 Years | 70 | 18.9% |
| 45 to 54 Years | 39 | 10.5% |
| 55 to 64 Years | 92 | 24.8% |
| 65 to 74 Years | 33 | 8.9% |
| 75 to 84 Years | 32 | 8.6% |
| 85 Years and Over | 2 | 0.5% |
| Total | 371 | 100.0% |
Housing Finances in New Waverly
Median Income by Occupancy in New Waverly
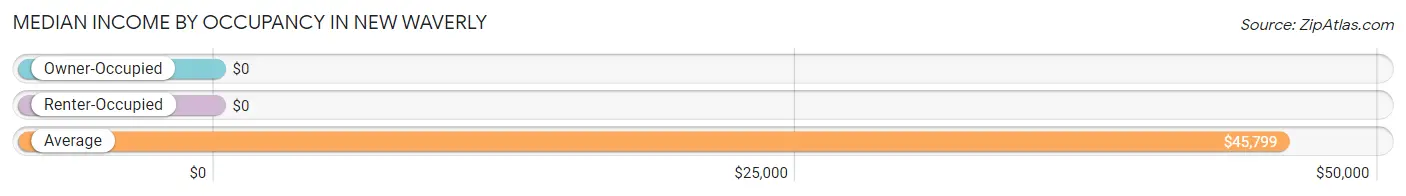
| Occupancy Type | # Households | Median Income |
| Owner-Occupied | 232 (62.5%) | $0 |
| Renter-Occupied | 139 (37.5%) | $0 |
| Average | 371 (100.0%) | $45,799 |
Occupancy by Householder Income Bracket in New Waverly
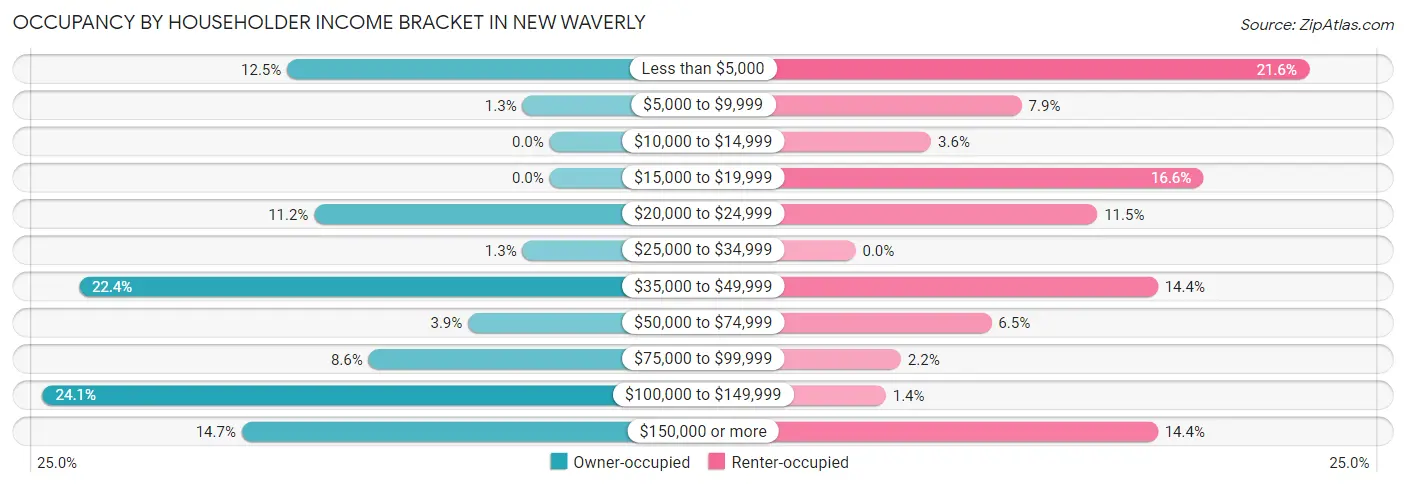
| Income Bracket | Owner-occupied | Renter-occupied |
| Less than $5,000 | 29 (12.5%) | 30 (21.6%) |
| $5,000 to $9,999 | 3 (1.3%) | 11 (7.9%) |
| $10,000 to $14,999 | 0 (0.0%) | 5 (3.6%) |
| $15,000 to $19,999 | 0 (0.0%) | 23 (16.6%) |
| $20,000 to $24,999 | 26 (11.2%) | 16 (11.5%) |
| $25,000 to $34,999 | 3 (1.3%) | 0 (0.0%) |
| $35,000 to $49,999 | 52 (22.4%) | 20 (14.4%) |
| $50,000 to $74,999 | 9 (3.9%) | 9 (6.5%) |
| $75,000 to $99,999 | 20 (8.6%) | 3 (2.2%) |
| $100,000 to $149,999 | 56 (24.1%) | 2 (1.4%) |
| $150,000 or more | 34 (14.7%) | 20 (14.4%) |
| Total | 232 (100.0%) | 139 (100.0%) |
Monthly Housing Cost Tiers in New Waverly
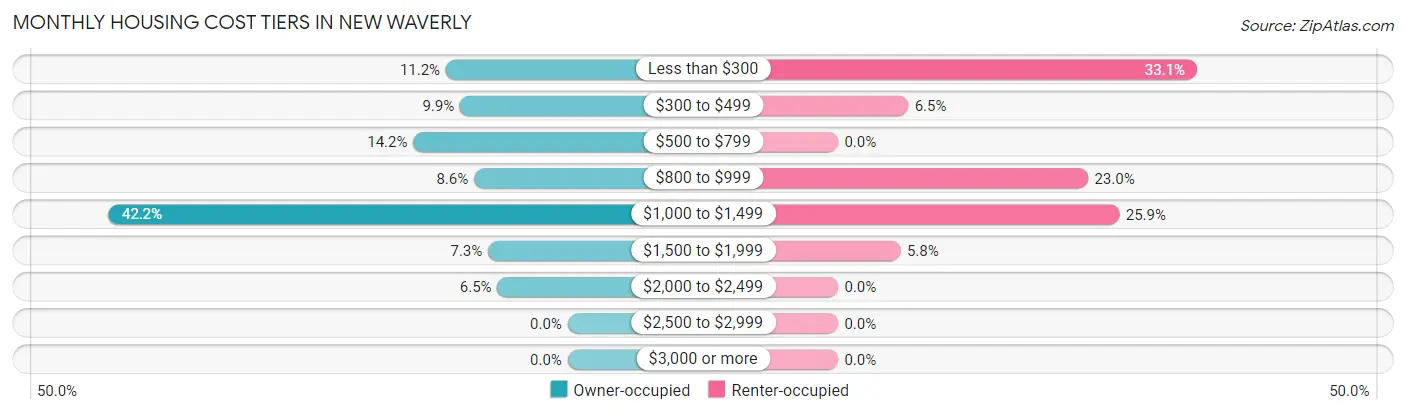
| Monthly Cost | Owner-occupied | Renter-occupied |
| Less than $300 | 26 (11.2%) | 46 (33.1%) |
| $300 to $499 | 23 (9.9%) | 9 (6.5%) |
| $500 to $799 | 33 (14.2%) | 0 (0.0%) |
| $800 to $999 | 20 (8.6%) | 32 (23.0%) |
| $1,000 to $1,499 | 98 (42.2%) | 36 (25.9%) |
| $1,500 to $1,999 | 17 (7.3%) | 8 (5.8%) |
| $2,000 to $2,499 | 15 (6.5%) | 0 (0.0%) |
| $2,500 to $2,999 | 0 (0.0%) | 0 (0.0%) |
| $3,000 or more | 0 (0.0%) | 0 (0.0%) |
| Total | 232 (100.0%) | 139 (100.0%) |
Physical Housing Characteristics in New Waverly
Housing Structures in New Waverly
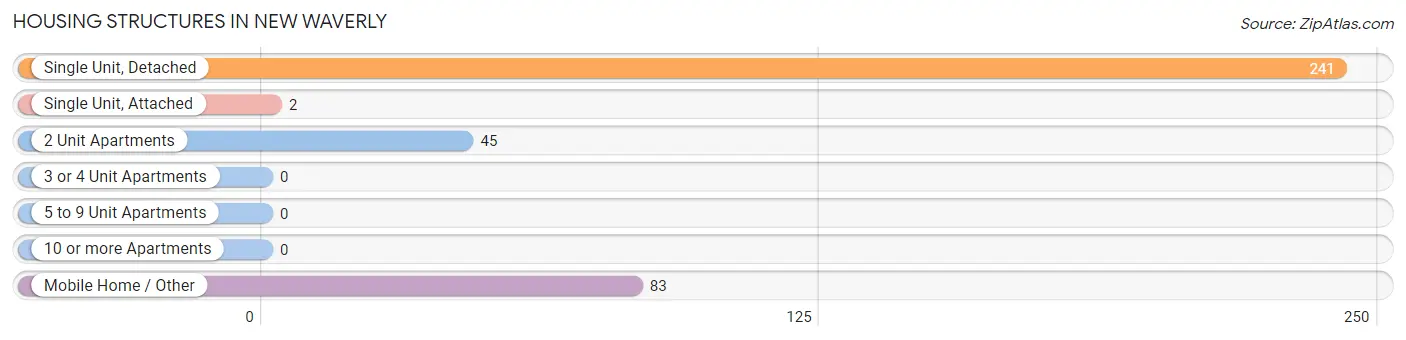
| Structure Type | # Housing Units | % Housing Units |
| Single Unit, Detached | 241 | 65.0% |
| Single Unit, Attached | 2 | 0.5% |
| 2 Unit Apartments | 45 | 12.1% |
| 3 or 4 Unit Apartments | 0 | 0.0% |
| 5 to 9 Unit Apartments | 0 | 0.0% |
| 10 or more Apartments | 0 | 0.0% |
| Mobile Home / Other | 83 | 22.4% |
| Total | 371 | 100.0% |
Housing Structures by Occupancy in New Waverly
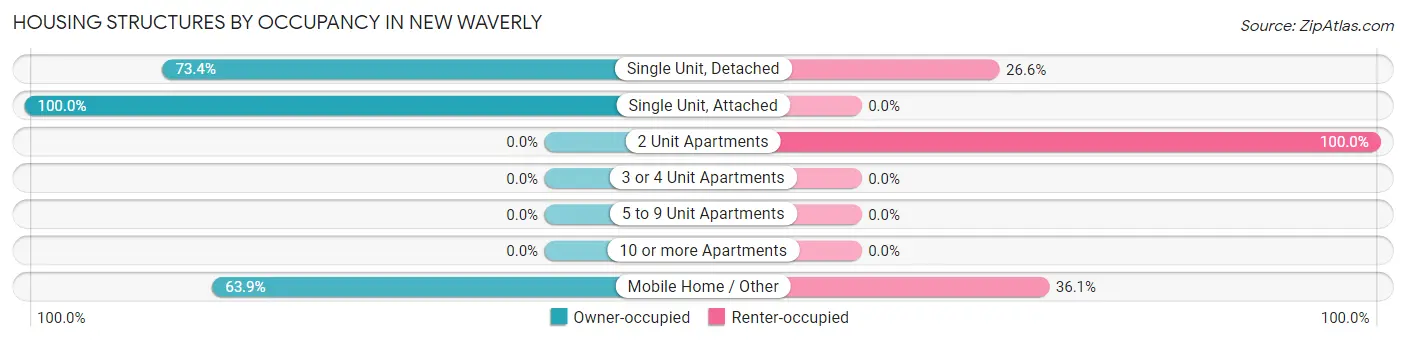
| Structure Type | Owner-occupied | Renter-occupied |
| Single Unit, Detached | 177 (73.4%) | 64 (26.6%) |
| Single Unit, Attached | 2 (100.0%) | 0 (0.0%) |
| 2 Unit Apartments | 0 (0.0%) | 45 (100.0%) |
| 3 or 4 Unit Apartments | 0 (0.0%) | 0 (0.0%) |
| 5 to 9 Unit Apartments | 0 (0.0%) | 0 (0.0%) |
| 10 or more Apartments | 0 (0.0%) | 0 (0.0%) |
| Mobile Home / Other | 53 (63.9%) | 30 (36.1%) |
| Total | 232 (62.5%) | 139 (37.5%) |
Housing Structures by Number of Rooms in New Waverly
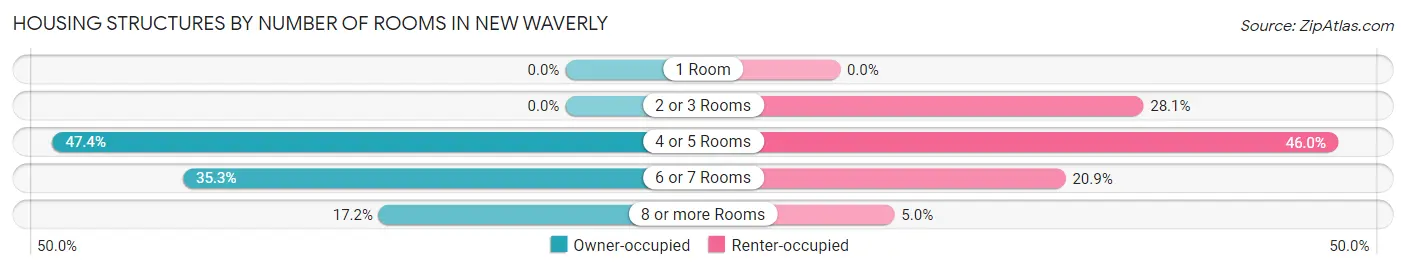
| Number of Rooms | Owner-occupied | Renter-occupied |
| 1 Room | 0 (0.0%) | 0 (0.0%) |
| 2 or 3 Rooms | 0 (0.0%) | 39 (28.1%) |
| 4 or 5 Rooms | 110 (47.4%) | 64 (46.0%) |
| 6 or 7 Rooms | 82 (35.3%) | 29 (20.9%) |
| 8 or more Rooms | 40 (17.2%) | 7 (5.0%) |
| Total | 232 (100.0%) | 139 (100.0%) |
Housing Structure by Heating Type in New Waverly
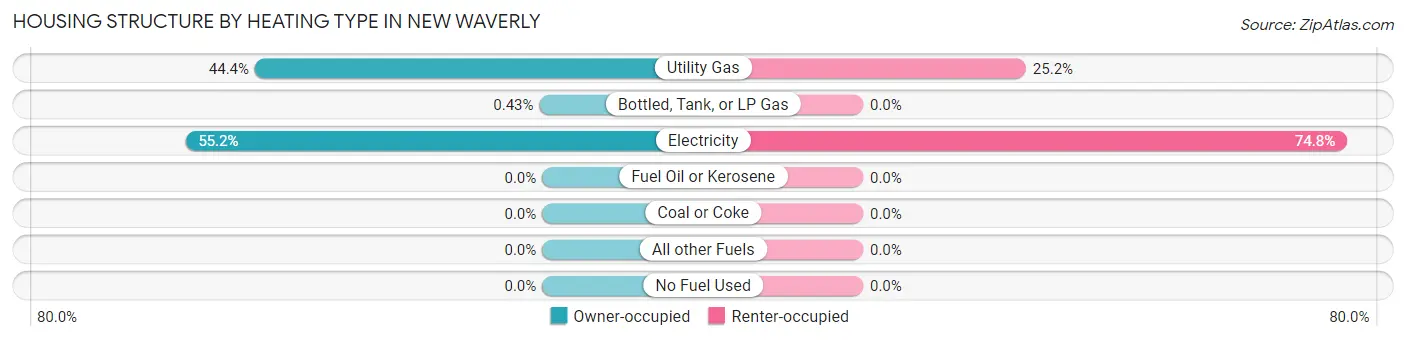
| Heating Type | Owner-occupied | Renter-occupied |
| Utility Gas | 103 (44.4%) | 35 (25.2%) |
| Bottled, Tank, or LP Gas | 1 (0.4%) | 0 (0.0%) |
| Electricity | 128 (55.2%) | 104 (74.8%) |
| Fuel Oil or Kerosene | 0 (0.0%) | 0 (0.0%) |
| Coal or Coke | 0 (0.0%) | 0 (0.0%) |
| All other Fuels | 0 (0.0%) | 0 (0.0%) |
| No Fuel Used | 0 (0.0%) | 0 (0.0%) |
| Total | 232 (100.0%) | 139 (100.0%) |
Household Vehicle Usage in New Waverly
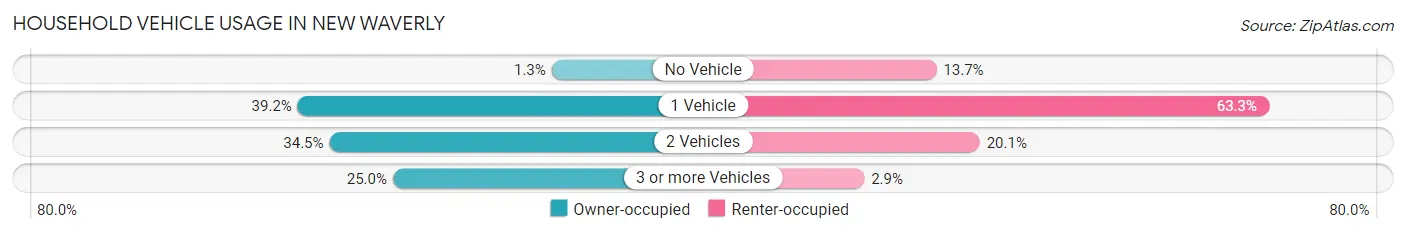
| Vehicles per Household | Owner-occupied | Renter-occupied |
| No Vehicle | 3 (1.3%) | 19 (13.7%) |
| 1 Vehicle | 91 (39.2%) | 88 (63.3%) |
| 2 Vehicles | 80 (34.5%) | 28 (20.1%) |
| 3 or more Vehicles | 58 (25.0%) | 4 (2.9%) |
| Total | 232 (100.0%) | 139 (100.0%) |
Real Estate & Mortgages in New Waverly
Real Estate and Mortgage Overview in New Waverly
| Characteristic | Without Mortgage | With Mortgage |
| Housing Units | 98 | 134 |
| Median Property Value | $106,700 | $209,200 |
| Median Household Income | $39,833 | $22 |
| Monthly Housing Costs | $500 | $0 |
| Real Estate Taxes | $1,650 | $3 |
Property Value by Mortgage Status in New Waverly
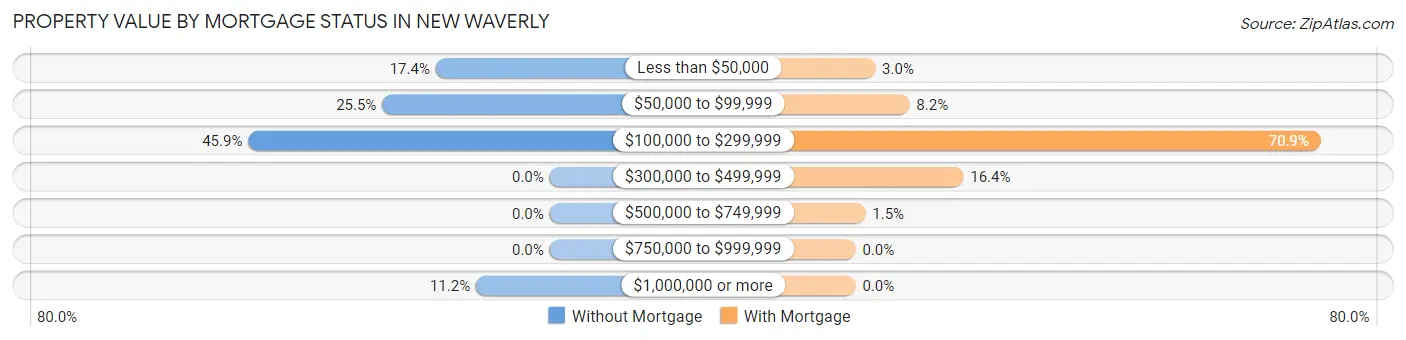
| Property Value | Without Mortgage | With Mortgage |
| Less than $50,000 | 17 (17.3%) | 4 (3.0%) |
| $50,000 to $99,999 | 25 (25.5%) | 11 (8.2%) |
| $100,000 to $299,999 | 45 (45.9%) | 95 (70.9%) |
| $300,000 to $499,999 | 0 (0.0%) | 22 (16.4%) |
| $500,000 to $749,999 | 0 (0.0%) | 2 (1.5%) |
| $750,000 to $999,999 | 0 (0.0%) | 0 (0.0%) |
| $1,000,000 or more | 11 (11.2%) | 0 (0.0%) |
| Total | 98 (100.0%) | 134 (100.0%) |
Household Income by Mortgage Status in New Waverly
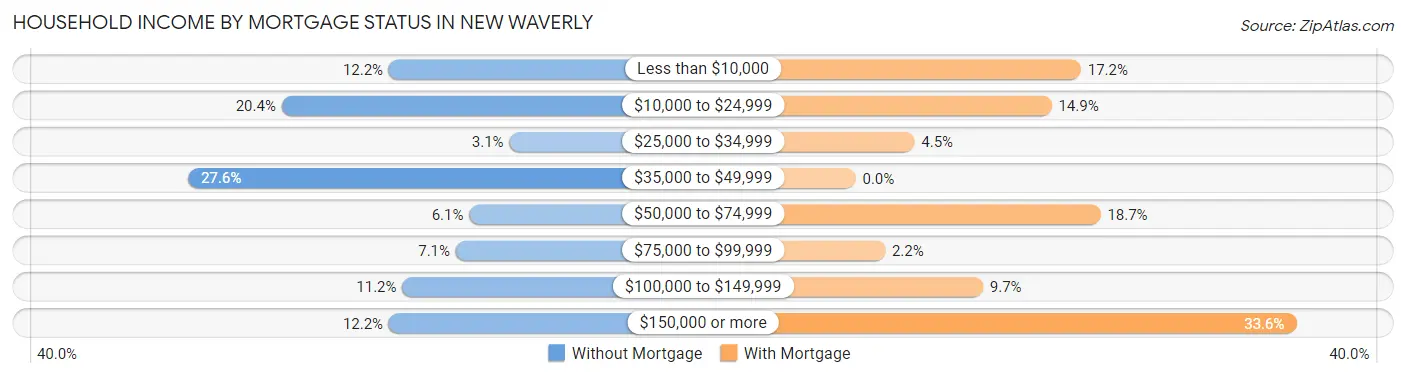
| Household Income | Without Mortgage | With Mortgage |
| Less than $10,000 | 12 (12.2%) | 23 (17.2%) |
| $10,000 to $24,999 | 20 (20.4%) | 20 (14.9%) |
| $25,000 to $34,999 | 3 (3.1%) | 6 (4.5%) |
| $35,000 to $49,999 | 27 (27.6%) | 0 (0.0%) |
| $50,000 to $74,999 | 6 (6.1%) | 25 (18.7%) |
| $75,000 to $99,999 | 7 (7.1%) | 3 (2.2%) |
| $100,000 to $149,999 | 11 (11.2%) | 13 (9.7%) |
| $150,000 or more | 12 (12.2%) | 45 (33.6%) |
| Total | 98 (100.0%) | 134 (100.0%) |
Property Value to Household Income Ratio in New Waverly
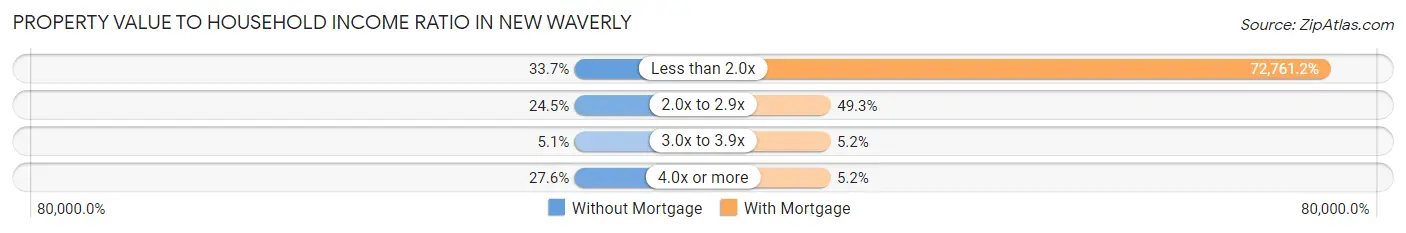
| Value-to-Income Ratio | Without Mortgage | With Mortgage |
| Less than 2.0x | 33 (33.7%) | 97,500 (72,761.2%) |
| 2.0x to 2.9x | 24 (24.5%) | 66 (49.2%) |
| 3.0x to 3.9x | 5 (5.1%) | 7 (5.2%) |
| 4.0x or more | 27 (27.6%) | 7 (5.2%) |
| Total | 98 (100.0%) | 134 (100.0%) |
Real Estate Taxes by Mortgage Status in New Waverly
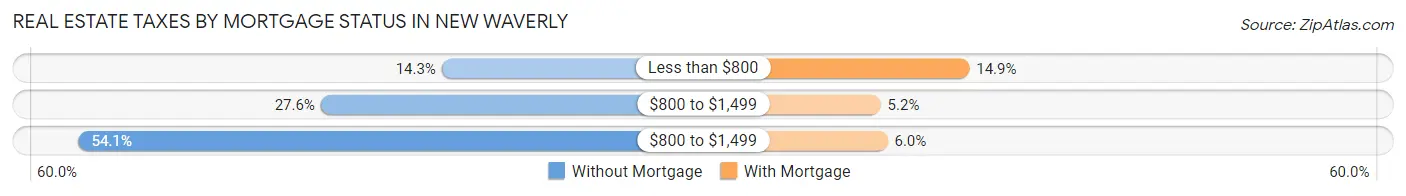
| Property Taxes | Without Mortgage | With Mortgage |
| Less than $800 | 14 (14.3%) | 20 (14.9%) |
| $800 to $1,499 | 27 (27.6%) | 7 (5.2%) |
| $800 to $1,499 | 53 (54.1%) | 8 (6.0%) |
| Total | 98 (100.0%) | 134 (100.0%) |
Health & Disability in New Waverly
Health Insurance Coverage by Age in New Waverly
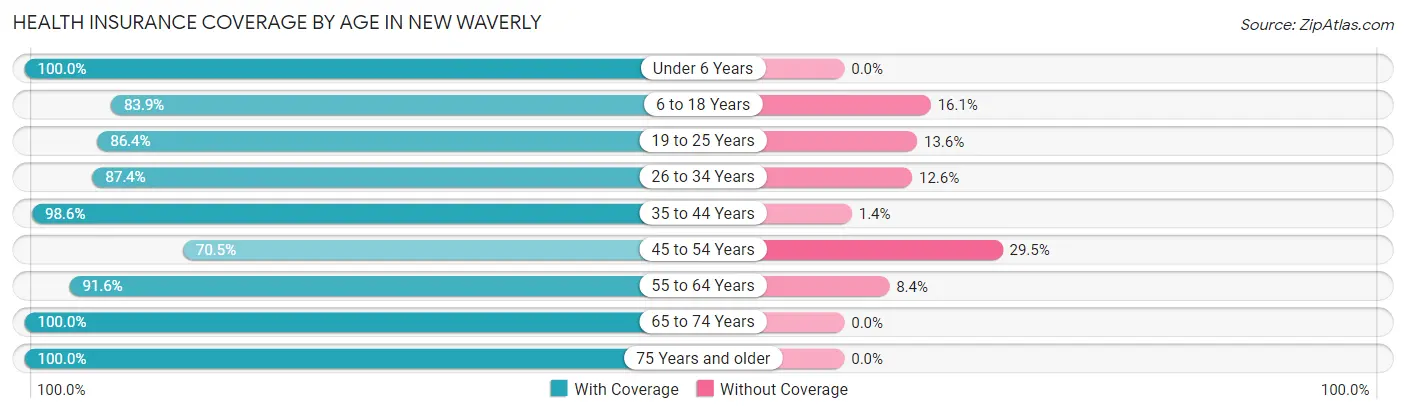
| Age Bracket | With Coverage | Without Coverage |
| Under 6 Years | 83 (100.0%) | 0 (0.0%) |
| 6 to 18 Years | 177 (83.9%) | 34 (16.1%) |
| 19 to 25 Years | 51 (86.4%) | 8 (13.6%) |
| 26 to 34 Years | 152 (87.4%) | 22 (12.6%) |
| 35 to 44 Years | 141 (98.6%) | 2 (1.4%) |
| 45 to 54 Years | 43 (70.5%) | 18 (29.5%) |
| 55 to 64 Years | 197 (91.6%) | 18 (8.4%) |
| 65 to 74 Years | 36 (100.0%) | 0 (0.0%) |
| 75 Years and older | 120 (100.0%) | 0 (0.0%) |
| Total | 1,000 (90.7%) | 102 (9.3%) |
Health Insurance Coverage by Citizenship Status in New Waverly
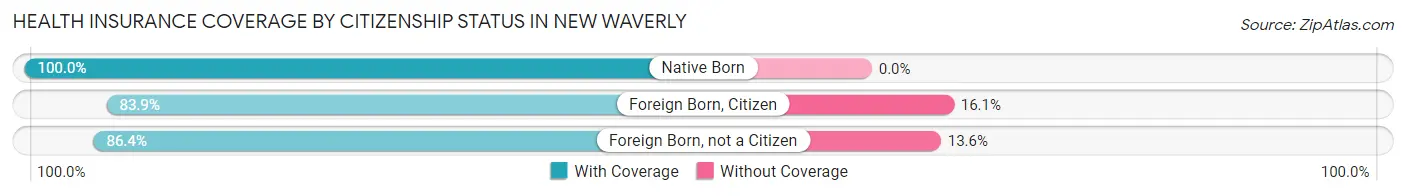
| Citizenship Status | With Coverage | Without Coverage |
| Native Born | 83 (100.0%) | 0 (0.0%) |
| Foreign Born, Citizen | 177 (83.9%) | 34 (16.1%) |
| Foreign Born, not a Citizen | 51 (86.4%) | 8 (13.6%) |
Health Insurance Coverage by Household Income in New Waverly
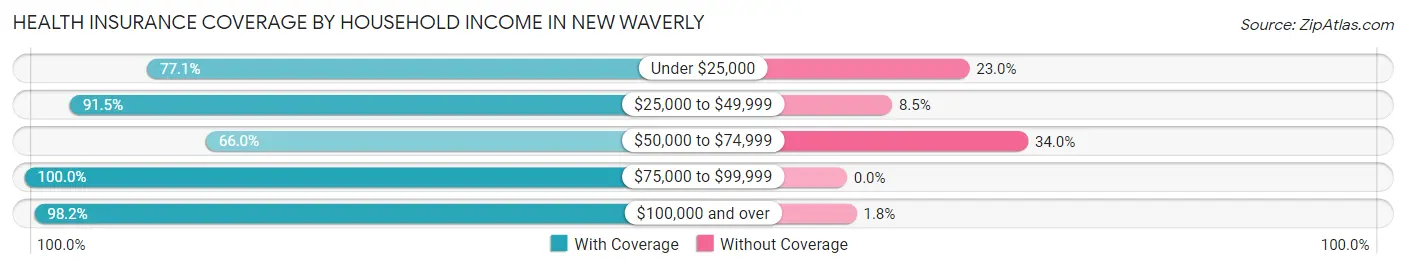
| Household Income | With Coverage | Without Coverage |
| Under $25,000 | 188 (77.0%) | 56 (23.0%) |
| $25,000 to $49,999 | 227 (91.5%) | 21 (8.5%) |
| $50,000 to $74,999 | 35 (66.0%) | 18 (34.0%) |
| $75,000 to $99,999 | 172 (100.0%) | 0 (0.0%) |
| $100,000 and over | 378 (98.2%) | 7 (1.8%) |
Public vs Private Health Insurance Coverage by Age in New Waverly
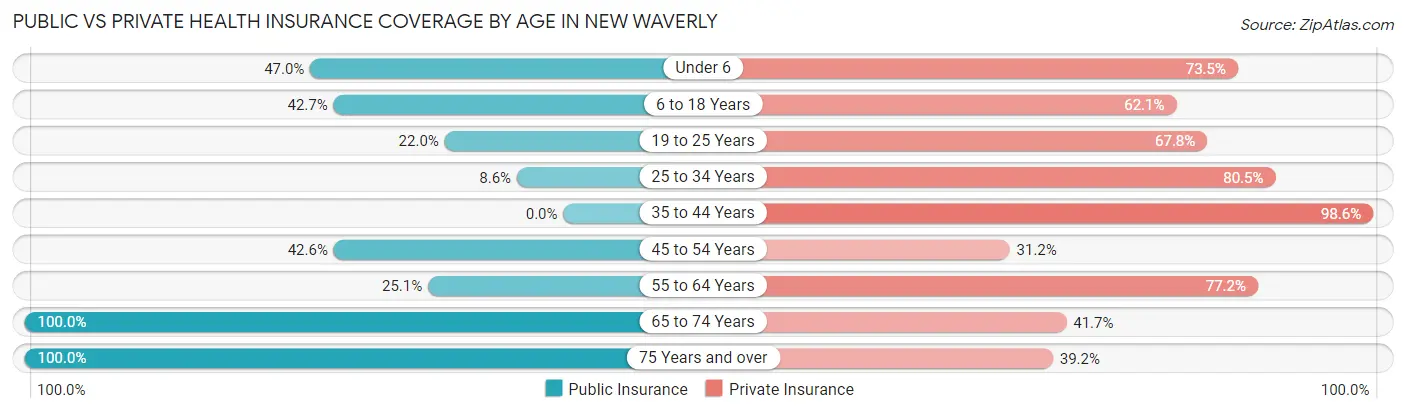
| Age Bracket | Public Insurance | Private Insurance |
| Under 6 | 39 (47.0%) | 61 (73.5%) |
| 6 to 18 Years | 90 (42.6%) | 131 (62.1%) |
| 19 to 25 Years | 13 (22.0%) | 40 (67.8%) |
| 25 to 34 Years | 15 (8.6%) | 140 (80.5%) |
| 35 to 44 Years | 0 (0.0%) | 141 (98.6%) |
| 45 to 54 Years | 26 (42.6%) | 19 (31.1%) |
| 55 to 64 Years | 54 (25.1%) | 166 (77.2%) |
| 65 to 74 Years | 36 (100.0%) | 15 (41.7%) |
| 75 Years and over | 120 (100.0%) | 47 (39.2%) |
| Total | 393 (35.7%) | 760 (69.0%) |
Disability Status by Sex by Age in New Waverly
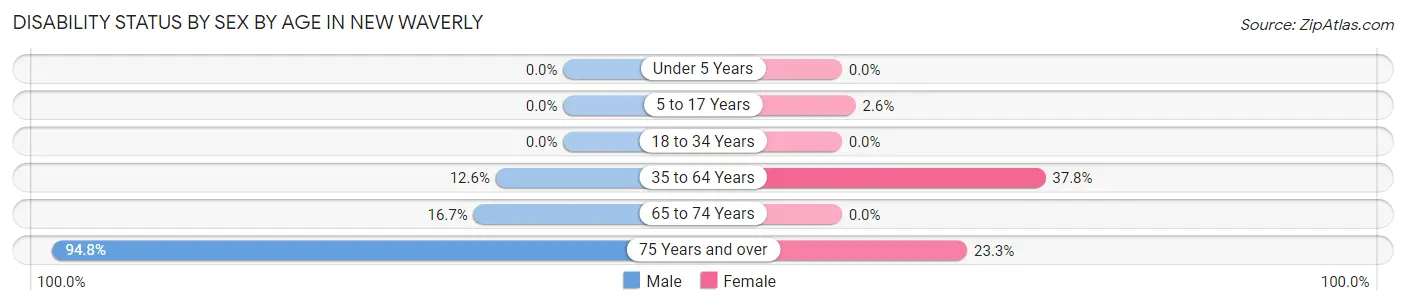
| Age Bracket | Male | Female |
| Under 5 Years | 0 (0.0%) | 0 (0.0%) |
| 5 to 17 Years | 0 (0.0%) | 4 (2.5%) |
| 18 to 34 Years | 0 (0.0%) | 0 (0.0%) |
| 35 to 64 Years | 31 (12.6%) | 65 (37.8%) |
| 65 to 74 Years | 3 (16.7%) | 0 (0.0%) |
| 75 Years and over | 73 (94.8%) | 10 (23.3%) |
Disability Class by Sex by Age in New Waverly
Disability Class: Hearing Difficulty
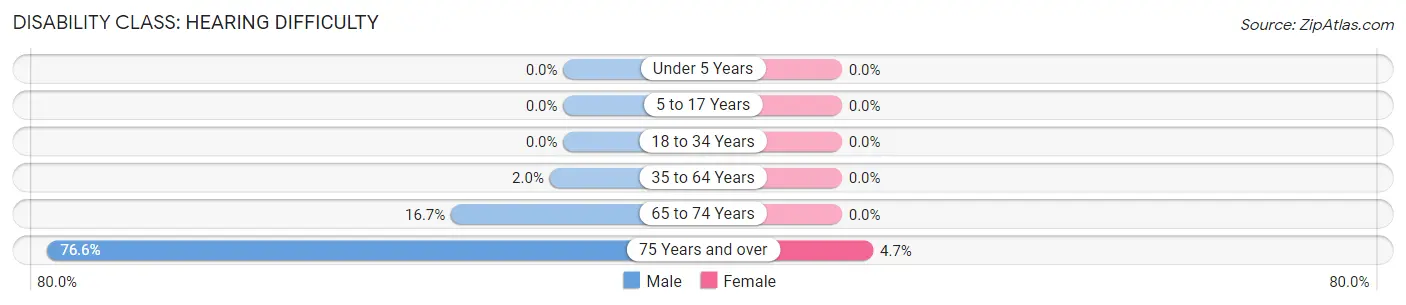
| Age Bracket | Male | Female |
| Under 5 Years | 0 (0.0%) | 0 (0.0%) |
| 5 to 17 Years | 0 (0.0%) | 0 (0.0%) |
| 18 to 34 Years | 0 (0.0%) | 0 (0.0%) |
| 35 to 64 Years | 5 (2.0%) | 0 (0.0%) |
| 65 to 74 Years | 3 (16.7%) | 0 (0.0%) |
| 75 Years and over | 59 (76.6%) | 2 (4.6%) |
Disability Class: Vision Difficulty
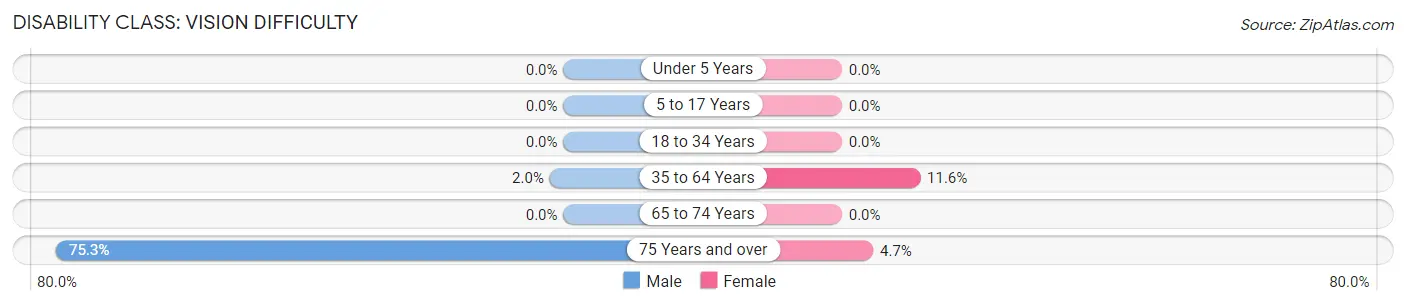
| Age Bracket | Male | Female |
| Under 5 Years | 0 (0.0%) | 0 (0.0%) |
| 5 to 17 Years | 0 (0.0%) | 0 (0.0%) |
| 18 to 34 Years | 0 (0.0%) | 0 (0.0%) |
| 35 to 64 Years | 5 (2.0%) | 20 (11.6%) |
| 65 to 74 Years | 0 (0.0%) | 0 (0.0%) |
| 75 Years and over | 58 (75.3%) | 2 (4.6%) |
Disability Class: Cognitive Difficulty
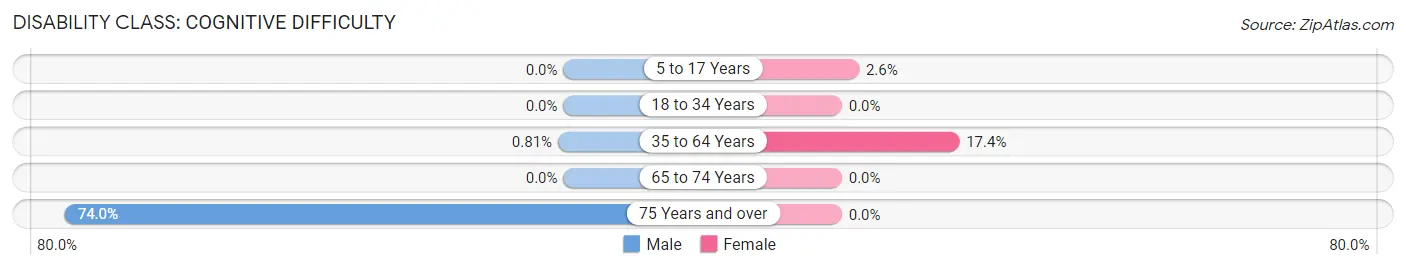
| Age Bracket | Male | Female |
| 5 to 17 Years | 0 (0.0%) | 4 (2.5%) |
| 18 to 34 Years | 0 (0.0%) | 0 (0.0%) |
| 35 to 64 Years | 2 (0.8%) | 30 (17.4%) |
| 65 to 74 Years | 0 (0.0%) | 0 (0.0%) |
| 75 Years and over | 57 (74.0%) | 0 (0.0%) |
Disability Class: Ambulatory Difficulty
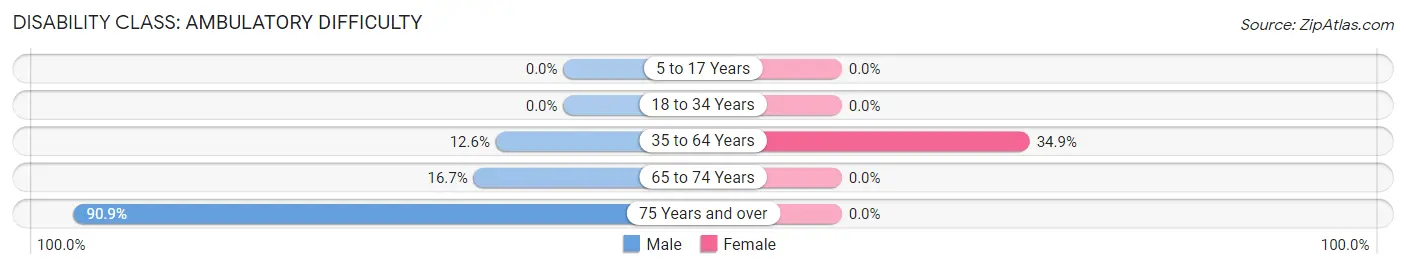
| Age Bracket | Male | Female |
| 5 to 17 Years | 0 (0.0%) | 0 (0.0%) |
| 18 to 34 Years | 0 (0.0%) | 0 (0.0%) |
| 35 to 64 Years | 31 (12.6%) | 60 (34.9%) |
| 65 to 74 Years | 3 (16.7%) | 0 (0.0%) |
| 75 Years and over | 70 (90.9%) | 0 (0.0%) |
Disability Class: Self-Care Difficulty
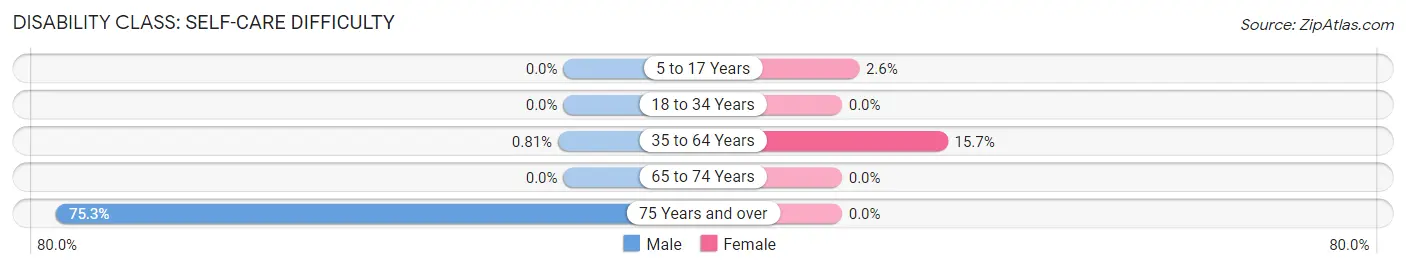
| Age Bracket | Male | Female |
| 5 to 17 Years | 0 (0.0%) | 4 (2.5%) |
| 18 to 34 Years | 0 (0.0%) | 0 (0.0%) |
| 35 to 64 Years | 2 (0.8%) | 27 (15.7%) |
| 65 to 74 Years | 0 (0.0%) | 0 (0.0%) |
| 75 Years and over | 58 (75.3%) | 0 (0.0%) |
Technology Access in New Waverly
Computing Device Access in New Waverly
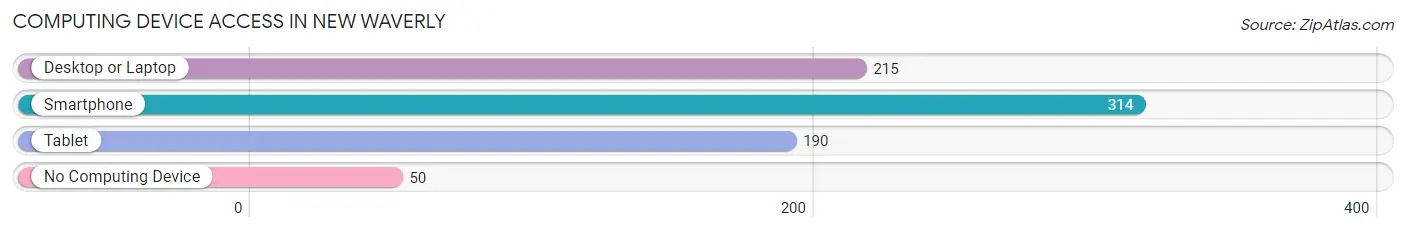
| Device Type | # Households | % Households |
| Desktop or Laptop | 215 | 58.0% |
| Smartphone | 314 | 84.6% |
| Tablet | 190 | 51.2% |
| No Computing Device | 50 | 13.5% |
| Total | 371 | 100.0% |
Internet Access in New Waverly
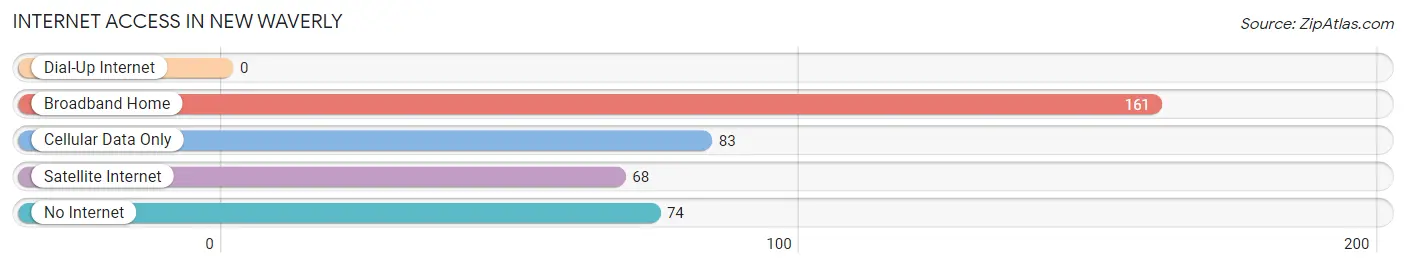
| Internet Type | # Households | % Households |
| Dial-Up Internet | 0 | 0.0% |
| Broadband Home | 161 | 43.4% |
| Cellular Data Only | 83 | 22.4% |
| Satellite Internet | 68 | 18.3% |
| No Internet | 74 | 20.0% |
| Total | 371 | 100.0% |
New Waverly Summary
Waverly, Texas is a small town located in Walker County, Texas. It is situated about 25 miles north of Huntsville and about 75 miles north of Houston. The town was founded in 1873 and was named after the Waverly Novels by Sir Walter Scott. The town has a population of about 1,000 people and is a rural community with a strong agricultural base.
History
The town of Waverly was founded in 1873 by a group of settlers from the nearby town of Huntsville. The settlers were looking for a place to settle and start a new life. The town was named after the Waverly Novels by Sir Walter Scott. The town was originally a farming community and the main crops grown were cotton, corn, and hay. The town also had a sawmill and a gristmill.
In the early 1900s, the town began to grow and the population increased. The town had a post office, a school, a bank, and several stores. The town also had a cotton gin and a blacksmith shop. The town was also home to a number of churches, including the First Baptist Church, the Methodist Church, and the Presbyterian Church.
In the 1920s, the town began to decline as the population decreased and the economy shifted away from agriculture. The town was hit hard by the Great Depression and many of the businesses closed. The town was also affected by the Dust Bowl and many of the farms were abandoned.
In the 1950s, the town began to experience a resurgence as the economy shifted back to agriculture. The town was also home to a number of small businesses, including a grocery store, a hardware store, and a feed store. The town also had a movie theater and a bowling alley.
Geography
Waverly is located in Walker County, Texas. The town is situated about 25 miles north of Huntsville and about 75 miles north of Houston. The town is located in the East Texas Piney Woods region and is surrounded by rolling hills and forests. The town is located on the banks of the Trinity River and is home to a number of small lakes and ponds.
Economy
The economy of Waverly is largely based on agriculture. The town is home to a number of farms that grow cotton, corn, hay, and other crops. The town also has a number of small businesses, including a grocery store, a hardware store, and a feed store. The town is also home to a number of manufacturing companies, including a furniture factory and a plastics factory.
Demographics
As of the 2010 census, the population of Waverly was 1,000 people. The town is predominantly white, with about 90% of the population being white. The town also has a small Hispanic population, with about 5% of the population being Hispanic. The median household income in Waverly is $35,000 and the median home value is $90,000.
Conclusion
Waverly, Texas is a small town located in Walker County, Texas. It is situated about 25 miles north of Huntsville and about 75 miles north of Houston. The town was founded in 1873 and was named after the Waverly Novels by Sir Walter Scott. The town has a population of about 1,000 people and is a rural community with a strong agricultural base. The economy of Waverly is largely based on agriculture and the town is home to a number of small businesses. The town is predominantly white, with about 90% of the population being white. The median household income in Waverly is $35,000 and the median home value is $90,000.
Common Questions
What is Per Capita Income in New Waverly?
Per Capita income in New Waverly is $26,324.
What is the Median Family Income in New Waverly?
Median Family Income in New Waverly is $86,477.
What is the Median Household income in New Waverly?
Median Household Income in New Waverly is $45,799.
What is Income or Wage Gap in New Waverly?
Income or Wage Gap in New Waverly is 21.9%.
Women in New Waverly earn 78.1 cents for every dollar earned by a man.
What is Inequality or Gini Index in New Waverly?
Inequality or Gini Index in New Waverly is 0.53.
What is the Total Population of New Waverly?
Total Population of New Waverly is 1,102.
What is the Total Male Population of New Waverly?
Total Male Population of New Waverly is 617.
What is the Total Female Population of New Waverly?
Total Female Population of New Waverly is 485.
What is the Ratio of Males per 100 Females in New Waverly?
There are 127.22 Males per 100 Females in New Waverly.
What is the Ratio of Females per 100 Males in New Waverly?
There are 78.61 Females per 100 Males in New Waverly.
What is the Median Population Age in New Waverly?
Median Population Age in New Waverly is 35.7 Years.
What is the Average Family Size in New Waverly
Average Family Size in New Waverly is 3.7 People.
What is the Average Household Size in New Waverly
Average Household Size in New Waverly is 3.0 People.
How Large is the Labor Force in New Waverly?
There are 378 People in the Labor Forcein in New Waverly.
What is the Percentage of People in the Labor Force in New Waverly?
46.1% of People are in the Labor Force in New Waverly.
What is the Unemployment Rate in New Waverly?
Unemployment Rate in New Waverly is 3.2%.