San Augustine, TX Map & Demographics
San Augustine Map
San Augustine Overview
$20,119
PER CAPITA INCOME
$42,935
AVG FAMILY INCOME
$24,628
AVG HOUSEHOLD INCOME
55.1%
WAGE / INCOME GAP [ % ]
44.9¢/ $1
WAGE / INCOME GAP [ $ ]
0.58
INEQUALITY / GINI INDEX
1,845
TOTAL POPULATION
892
MALE POPULATION
953
FEMALE POPULATION
93.60
MALES / 100 FEMALES
106.84
FEMALES / 100 MALES
48.9
MEDIAN AGE
3.1
AVG FAMILY SIZE
2.1
AVG HOUSEHOLD SIZE
638
LABOR FORCE [ PEOPLE ]
41.8%
PERCENT IN LABOR FORCE
19.7%
UNEMPLOYMENT RATE
San Augustine Zip Codes
San Augustine Area Codes
Income in San Augustine
Income Overview in San Augustine
Per Capita Income in San Augustine is $20,119, while median incomes of families and households are $42,935 and $24,628 respectively.
| Characteristic | Number | Measure |
| Per Capita Income | 1,845 | $20,119 |
| Median Family Income | 398 | $42,935 |
| Mean Family Income | 398 | $59,186 |
| Median Household Income | 798 | $24,628 |
| Mean Household Income | 798 | $39,346 |
| Income Deficit | 398 | $0 |
| Wage / Income Gap (%) | 1,845 | 55.14% |
| Wage / Income Gap ($) | 1,845 | 44.86¢ per $1 |
| Gini / Inequality Index | 1,845 | 0.58 |
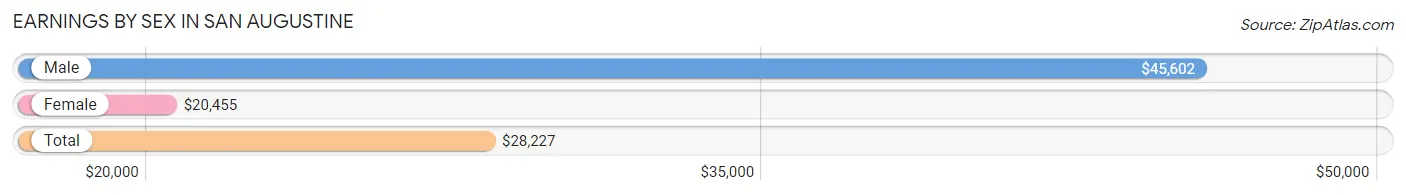
Earnings by Sex in San Augustine
Average Earnings in San Augustine are $28,227, $45,602 for men and $20,455 for women, a difference of 55.1%.
| Sex | Number | Average Earnings |
| Male | 235 (40.3%) | $45,602 |
| Female | 348 (59.7%) | $20,455 |
| Total | 583 (100.0%) | $28,227 |
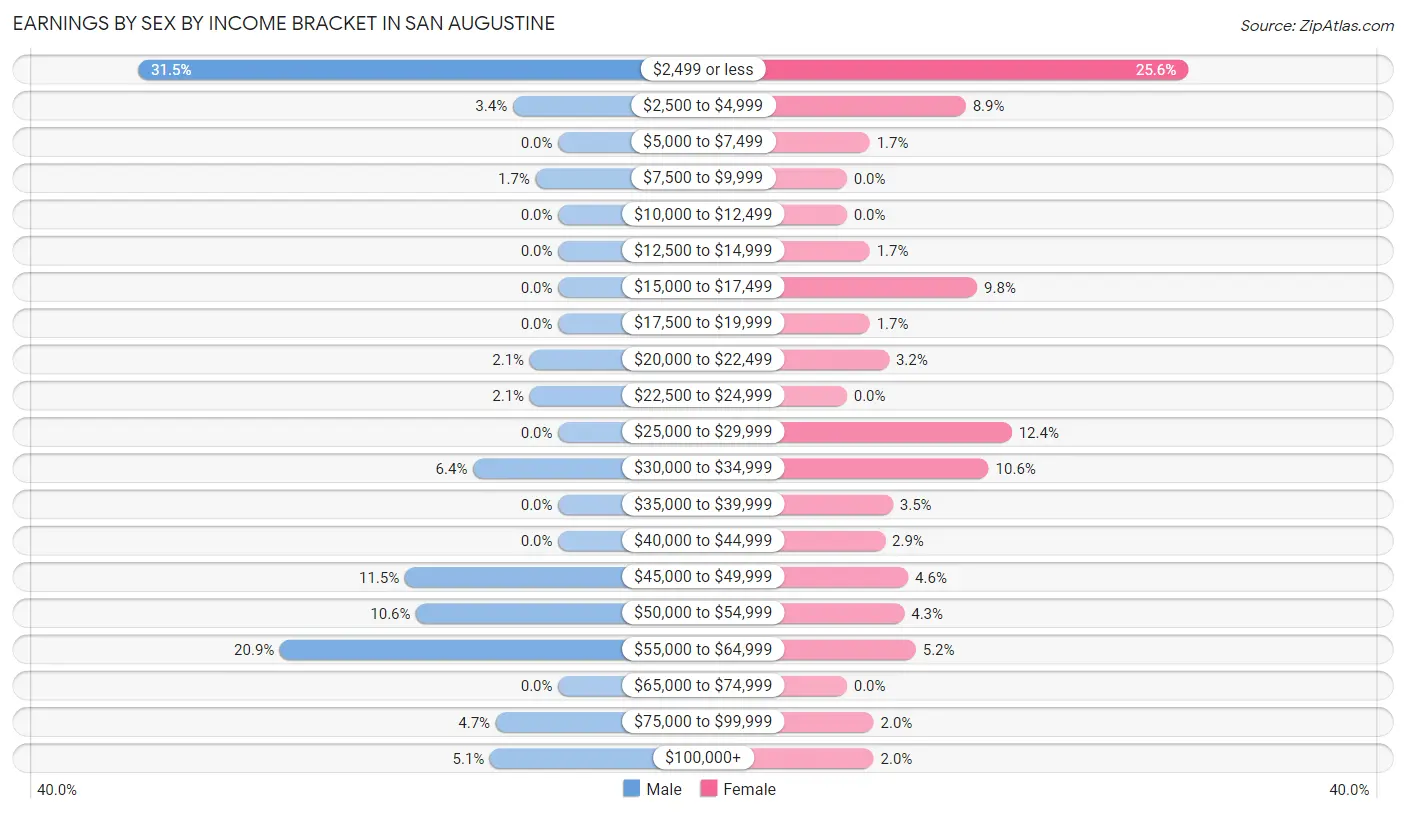
Earnings by Sex by Income Bracket in San Augustine
The most common earnings brackets in San Augustine are $2,499 or less for men (74 | 31.5%) and $2,499 or less for women (89 | 25.6%).
| Income | Male | Female |
| $2,499 or less | 74 (31.5%) | 89 (25.6%) |
| $2,500 to $4,999 | 8 (3.4%) | 31 (8.9%) |
| $5,000 to $7,499 | 0 (0.0%) | 6 (1.7%) |
| $7,500 to $9,999 | 4 (1.7%) | 0 (0.0%) |
| $10,000 to $12,499 | 0 (0.0%) | 0 (0.0%) |
| $12,500 to $14,999 | 0 (0.0%) | 6 (1.7%) |
| $15,000 to $17,499 | 0 (0.0%) | 34 (9.8%) |
| $17,500 to $19,999 | 0 (0.0%) | 6 (1.7%) |
| $20,000 to $22,499 | 5 (2.1%) | 11 (3.2%) |
| $22,500 to $24,999 | 5 (2.1%) | 0 (0.0%) |
| $25,000 to $29,999 | 0 (0.0%) | 43 (12.4%) |
| $30,000 to $34,999 | 15 (6.4%) | 37 (10.6%) |
| $35,000 to $39,999 | 0 (0.0%) | 12 (3.5%) |
| $40,000 to $44,999 | 0 (0.0%) | 10 (2.9%) |
| $45,000 to $49,999 | 27 (11.5%) | 16 (4.6%) |
| $50,000 to $54,999 | 25 (10.6%) | 15 (4.3%) |
| $55,000 to $64,999 | 49 (20.8%) | 18 (5.2%) |
| $65,000 to $74,999 | 0 (0.0%) | 0 (0.0%) |
| $75,000 to $99,999 | 11 (4.7%) | 7 (2.0%) |
| $100,000+ | 12 (5.1%) | 7 (2.0%) |
| Total | 235 (100.0%) | 348 (100.0%) |
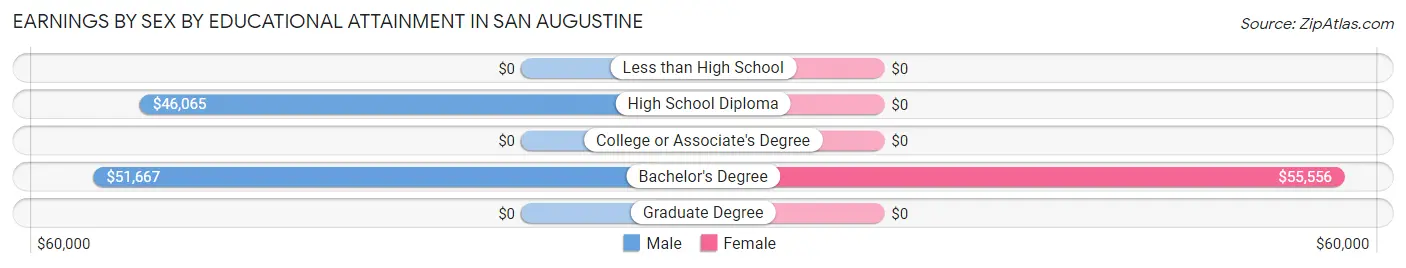
Earnings by Sex by Educational Attainment in San Augustine
Average earnings in San Augustine are $47,269 for men and $20,114 for women, a difference of 57.5%. Men with an educational attainment of bachelor's degree enjoy the highest average annual earnings of $51,667, while those with high school diploma education earn the least with $46,065. Women with an educational attainment of bachelor's degree earn the most with the average annual earnings of $55,556, while those with bachelor's degree education have the smallest earnings of $55,556.
| Educational Attainment | Male Income | Female Income |
| Less than High School | - | - |
| High School Diploma | $46,065 | $0 |
| College or Associate's Degree | - | - |
| Bachelor's Degree | $51,667 | $55,556 |
| Graduate Degree | - | - |
| Total | $47,269 | $20,114 |
Family Income in San Augustine
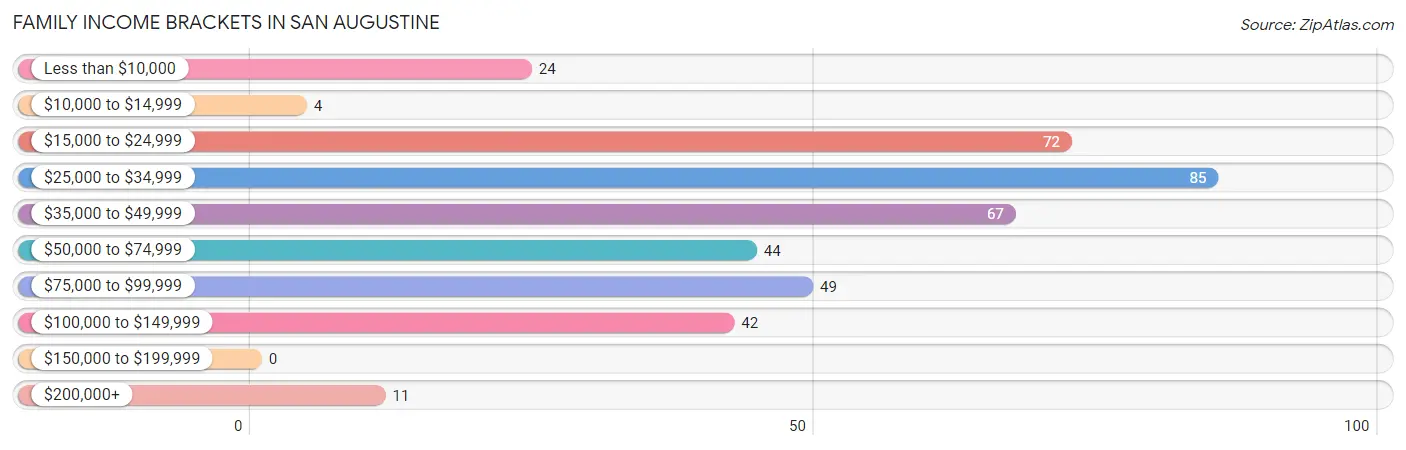
Family Income Brackets in San Augustine
According to the San Augustine family income data, there are 85 families falling into the $25,000 to $34,999 income range, which is the most common income bracket and makes up 21.4% of all families.
| Income Bracket | # Families | % Families |
| Less than $10,000 | 24 | 6.0% |
| $10,000 to $14,999 | 4 | 1.0% |
| $15,000 to $24,999 | 72 | 18.1% |
| $25,000 to $34,999 | 85 | 21.4% |
| $35,000 to $49,999 | 67 | 16.8% |
| $50,000 to $74,999 | 44 | 11.1% |
| $75,000 to $99,999 | 49 | 12.3% |
| $100,000 to $149,999 | 42 | 10.6% |
| $150,000 to $199,999 | 0 | 0.0% |
| $200,000+ | 11 | 2.8% |
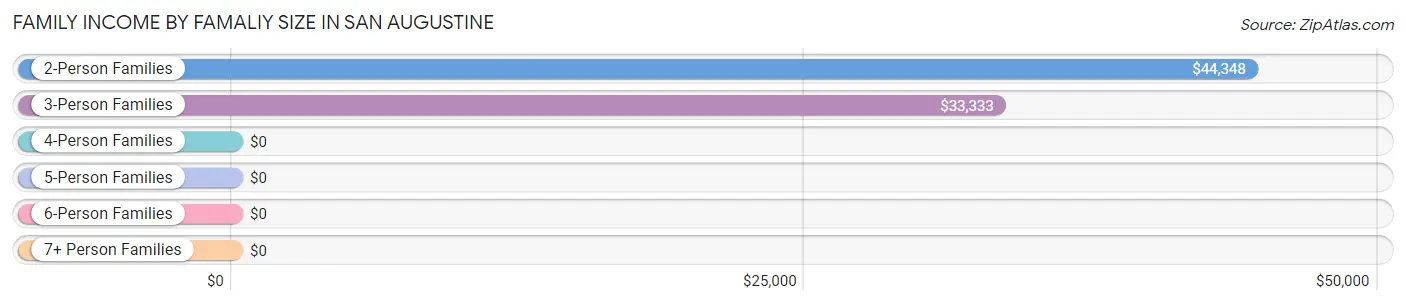
Family Income by Famaliy Size in San Augustine
2-person families (270 | 67.8%) account for the highest median family income in San Augustine with $44,348 per family, while 2-person families (270 | 67.8%) have the highest median income of $22,174 per family member.
| Income Bracket | # Families | Median Income |
| 2-Person Families | 270 (67.8%) | $44,348 |
| 3-Person Families | 100 (25.1%) | $33,333 |
| 4-Person Families | 11 (2.8%) | $0 |
| 5-Person Families | 17 (4.3%) | $0 |
| 6-Person Families | 0 (0.0%) | $0 |
| 7+ Person Families | 0 (0.0%) | $0 |
| Total | 398 (100.0%) | $42,935 |
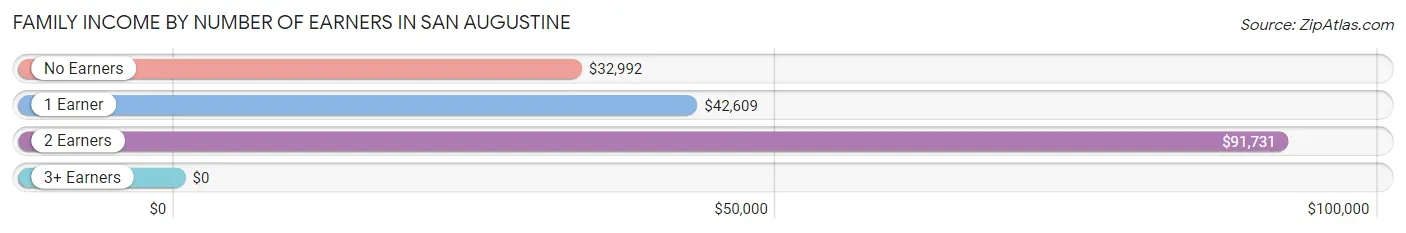
Family Income by Number of Earners in San Augustine
| Number of Earners | # Families | Median Income |
| No Earners | 125 (31.4%) | $32,992 |
| 1 Earner | 214 (53.8%) | $42,609 |
| 2 Earners | 46 (11.6%) | $91,731 |
| 3+ Earners | 13 (3.3%) | $0 |
| Total | 398 (100.0%) | $42,935 |
Household Income in San Augustine
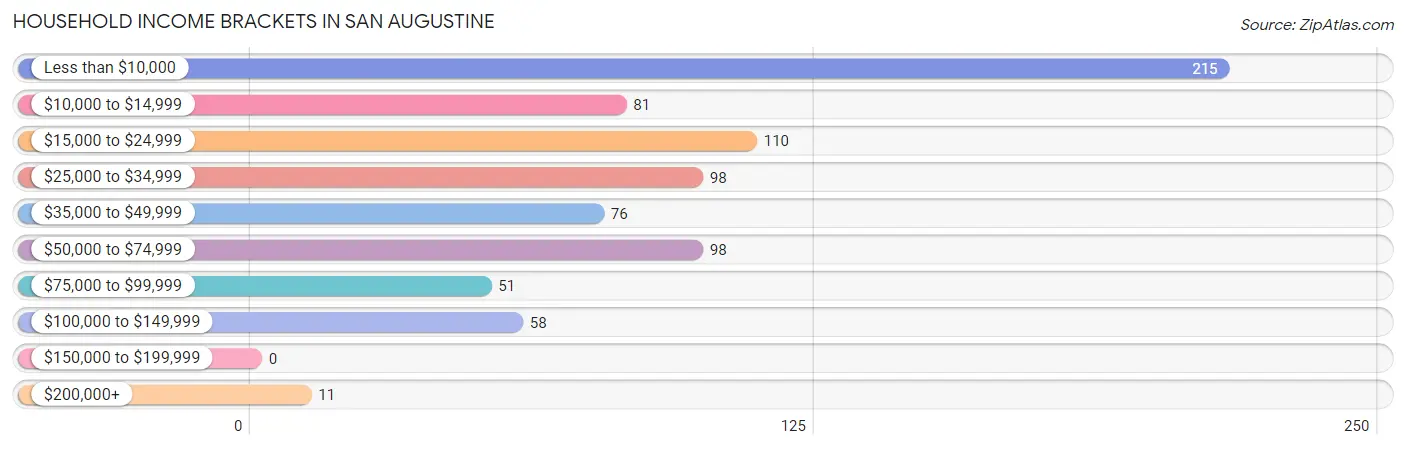
Household Income Brackets in San Augustine
With 215 households falling in the category, the less than $10,000 income range is the most frequent in San Augustine, accounting for 26.9% of all households.
| Income Bracket | # Households | % Households |
| Less than $10,000 | 215 | 26.9% |
| $10,000 to $14,999 | 81 | 10.2% |
| $15,000 to $24,999 | 110 | 13.8% |
| $25,000 to $34,999 | 98 | 12.3% |
| $35,000 to $49,999 | 76 | 9.5% |
| $50,000 to $74,999 | 98 | 12.3% |
| $75,000 to $99,999 | 51 | 6.4% |
| $100,000 to $149,999 | 58 | 7.3% |
| $150,000 to $199,999 | 0 | 0.0% |
| $200,000+ | 11 | 1.4% |
Household Income by Householder Age in San Augustine
The median household income in San Augustine is $24,628, with the highest median household income of $24,792 found in the 65+ years age bracket for the primary householder. A total of 364 households (45.6%) fall into this category. Meanwhile, the 15 to 24 years age bracket for the primary householder has the lowest median household income of $0, with 10 households (1.3%) in this group.
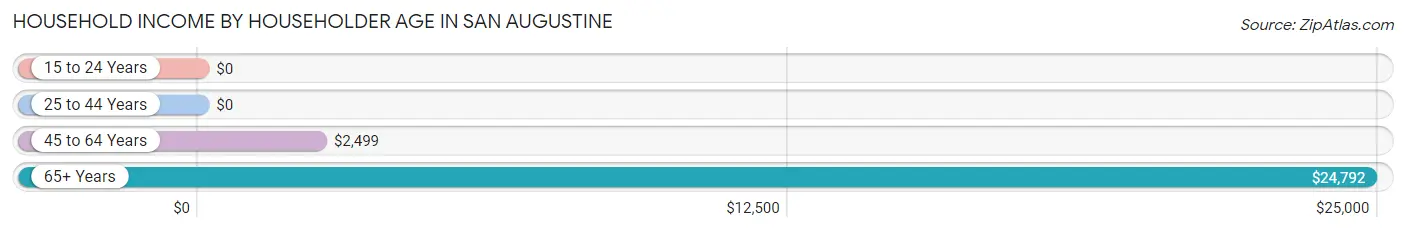
| Income Bracket | # Households | Median Income |
| 15 to 24 Years | 10 (1.3%) | $0 |
| 25 to 44 Years | 185 (23.2%) | $0 |
| 45 to 64 Years | 239 (29.9%) | $2,499 |
| 65+ Years | 364 (45.6%) | $24,792 |
| Total | 798 (100.0%) | $24,628 |
Poverty in San Augustine
Income Below Poverty by Sex and Age in San Augustine
With 30.5% poverty level for males and 33.2% for females among the residents of San Augustine, 75 year old and over males and 5 year old females are the most vulnerable to poverty, with 67 males (62.6%) and 15 females (88.2%) in their respective age groups living below the poverty level.
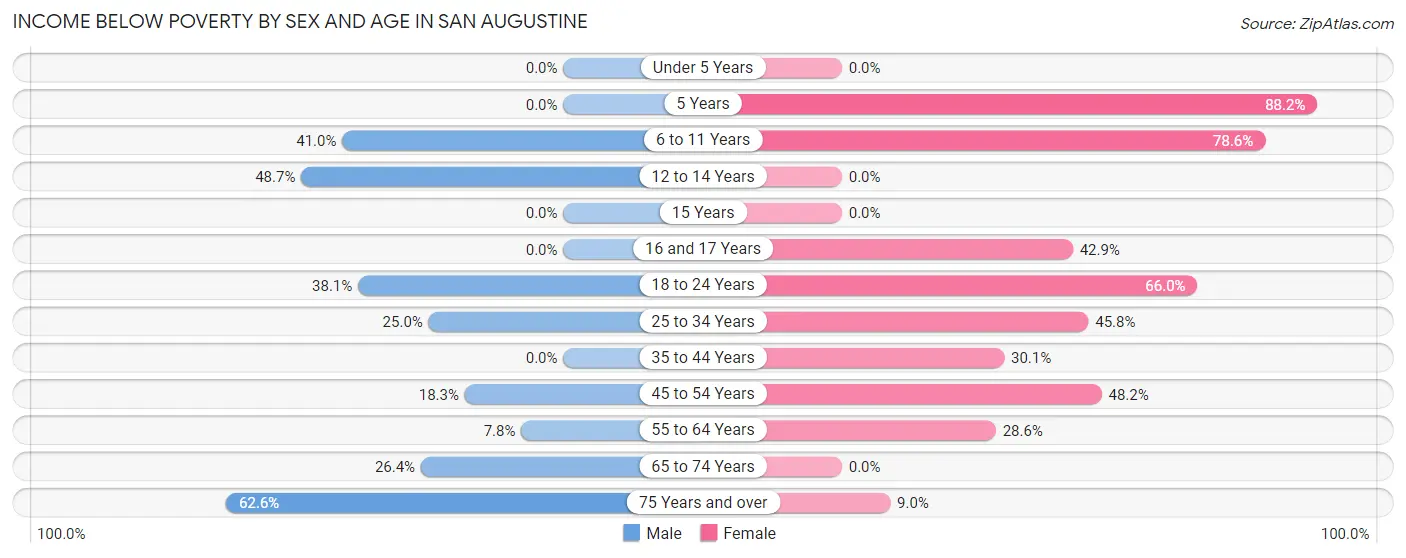
| Age Bracket | Male | Female |
| Under 5 Years | 0 (0.0%) | 0 (0.0%) |
| 5 Years | 0 (0.0%) | 15 (88.2%) |
| 6 to 11 Years | 32 (41.0%) | 55 (78.6%) |
| 12 to 14 Years | 36 (48.6%) | 0 (0.0%) |
| 15 Years | 0 (0.0%) | 0 (0.0%) |
| 16 and 17 Years | 0 (0.0%) | 3 (42.9%) |
| 18 to 24 Years | 16 (38.1%) | 33 (66.0%) |
| 25 to 34 Years | 38 (25.0%) | 27 (45.8%) |
| 35 to 44 Years | 0 (0.0%) | 28 (30.1%) |
| 45 to 54 Years | 28 (18.3%) | 81 (48.2%) |
| 55 to 64 Years | 5 (7.8%) | 28 (28.6%) |
| 65 to 74 Years | 37 (26.4%) | 0 (0.0%) |
| 75 Years and over | 67 (62.6%) | 12 (9.0%) |
| Total | 259 (30.5%) | 282 (33.2%) |
Income Above Poverty by Sex and Age in San Augustine
According to the poverty statistics in San Augustine, males aged under 5 years and females aged 12 to 14 years are the age groups that are most secure financially, with 100.0% of males and 100.0% of females in these age groups living above the poverty line.
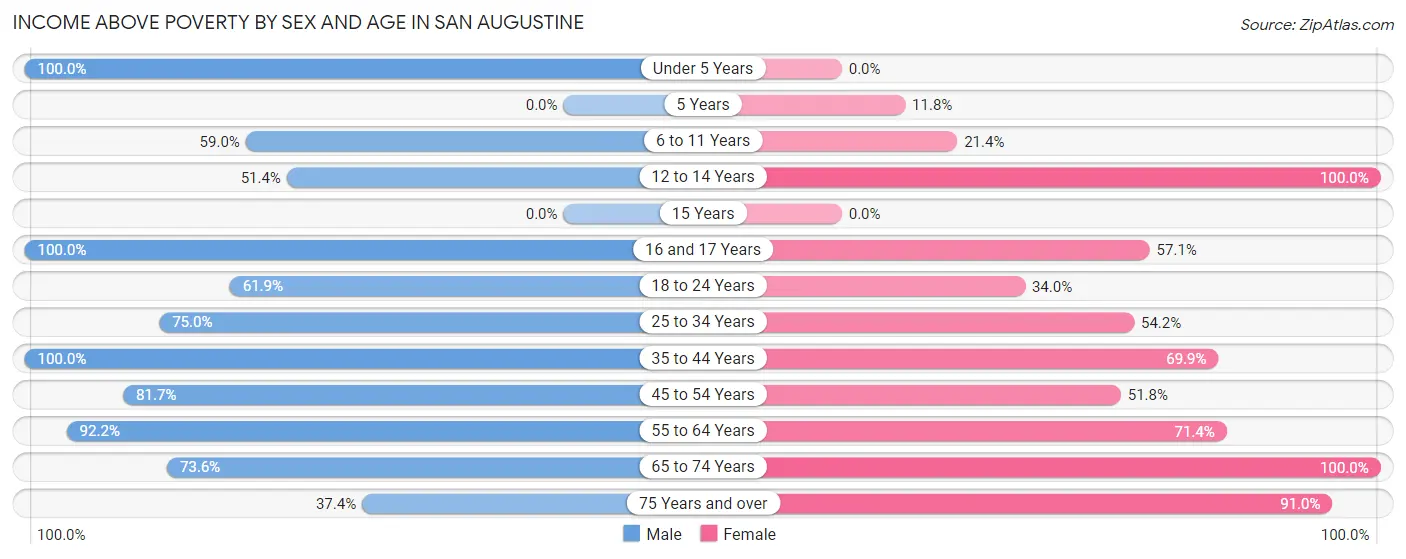
| Age Bracket | Male | Female |
| Under 5 Years | 19 (100.0%) | 0 (0.0%) |
| 5 Years | 0 (0.0%) | 2 (11.8%) |
| 6 to 11 Years | 46 (59.0%) | 15 (21.4%) |
| 12 to 14 Years | 38 (51.3%) | 59 (100.0%) |
| 15 Years | 0 (0.0%) | 0 (0.0%) |
| 16 and 17 Years | 4 (100.0%) | 4 (57.1%) |
| 18 to 24 Years | 26 (61.9%) | 17 (34.0%) |
| 25 to 34 Years | 114 (75.0%) | 32 (54.2%) |
| 35 to 44 Years | 15 (100.0%) | 65 (69.9%) |
| 45 to 54 Years | 125 (81.7%) | 87 (51.8%) |
| 55 to 64 Years | 59 (92.2%) | 70 (71.4%) |
| 65 to 74 Years | 103 (73.6%) | 95 (100.0%) |
| 75 Years and over | 40 (37.4%) | 122 (91.0%) |
| Total | 589 (69.5%) | 568 (66.8%) |
Income Below Poverty Among Married-Couple Families in San Augustine
The poverty statistics for married-couple families in San Augustine show that 2.3% or 5 of the total 214 families live below the poverty line. Families with 1 or 2 children have the highest poverty rate of 7.0%, comprising of 5 families. On the other hand, families with no children have the lowest poverty rate of 0.0%, which includes 0 families.
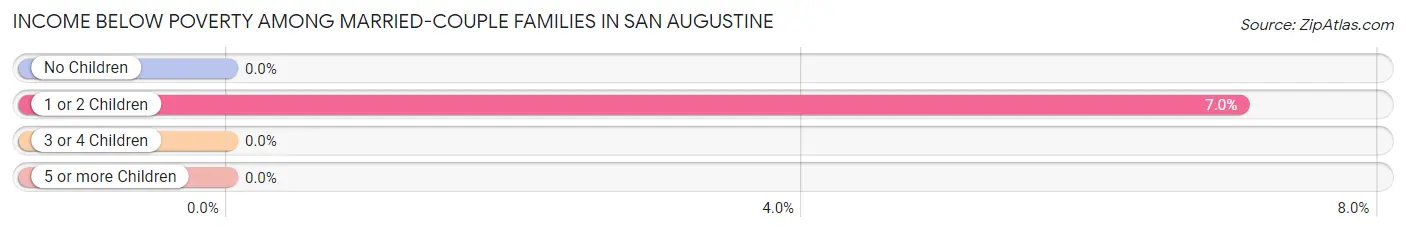
| Children | Above Poverty | Below Poverty |
| No Children | 143 (100.0%) | 0 (0.0%) |
| 1 or 2 Children | 66 (93.0%) | 5 (7.0%) |
| 3 or 4 Children | 0 (0.0%) | 0 (0.0%) |
| 5 or more Children | 0 (0.0%) | 0 (0.0%) |
| Total | 209 (97.7%) | 5 (2.3%) |
Income Below Poverty Among Single-Parent Households in San Augustine
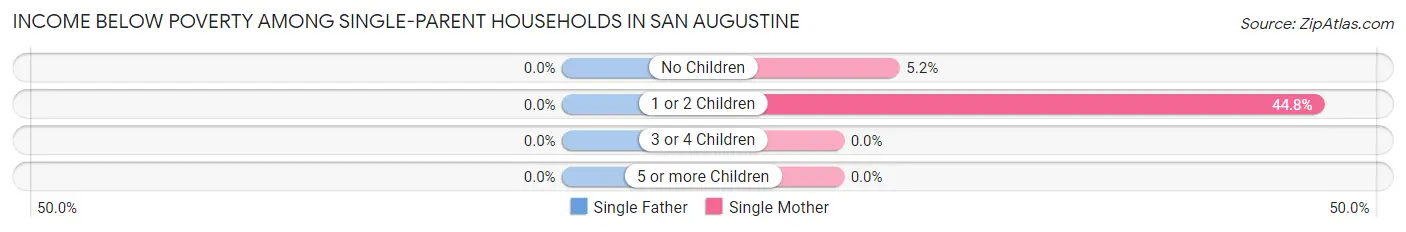
| Children | Single Father | Single Mother |
| No Children | 0 (0.0%) | 4 (5.2%) |
| 1 or 2 Children | 0 (0.0%) | 47 (44.8%) |
| 3 or 4 Children | 0 (0.0%) | 0 (0.0%) |
| 5 or more Children | 0 (0.0%) | 0 (0.0%) |
| Total | 0 (0.0%) | 51 (28.0%) |
Income Below Poverty Among Married-Couple vs Single-Parent Households in San Augustine
The poverty data for San Augustine shows that 5 of the married-couple family households (2.3%) and 51 of the single-parent households (27.7%) are living below the poverty level. Within the married-couple family households, those with 1 or 2 children have the highest poverty rate, with 5 households (7.0%) falling below the poverty line. Among the single-parent households, those with 1 or 2 children have the highest poverty rate, with 47 household (43.9%) living below poverty.
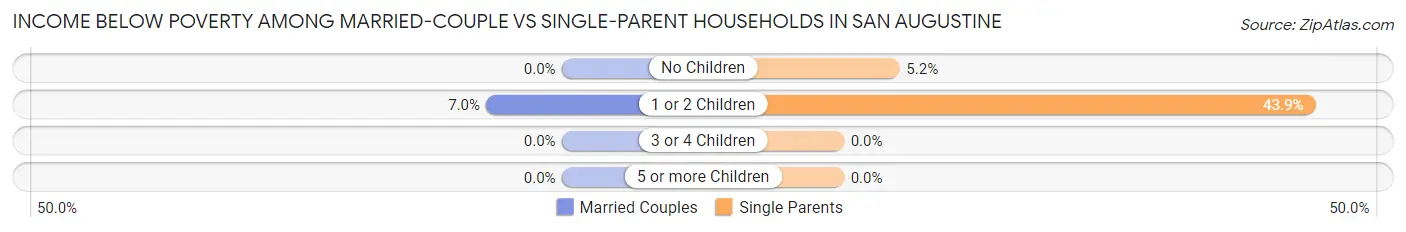
| Children | Married-Couple Families | Single-Parent Households |
| No Children | 0 (0.0%) | 4 (5.2%) |
| 1 or 2 Children | 5 (7.0%) | 47 (43.9%) |
| 3 or 4 Children | 0 (0.0%) | 0 (0.0%) |
| 5 or more Children | 0 (0.0%) | 0 (0.0%) |
| Total | 5 (2.3%) | 51 (27.7%) |
Race in San Augustine
The most populous races in San Augustine are Black / African American (935 | 50.7%), White / Caucasian (806 | 43.7%), and Hispanic or Latino (197 | 10.7%).
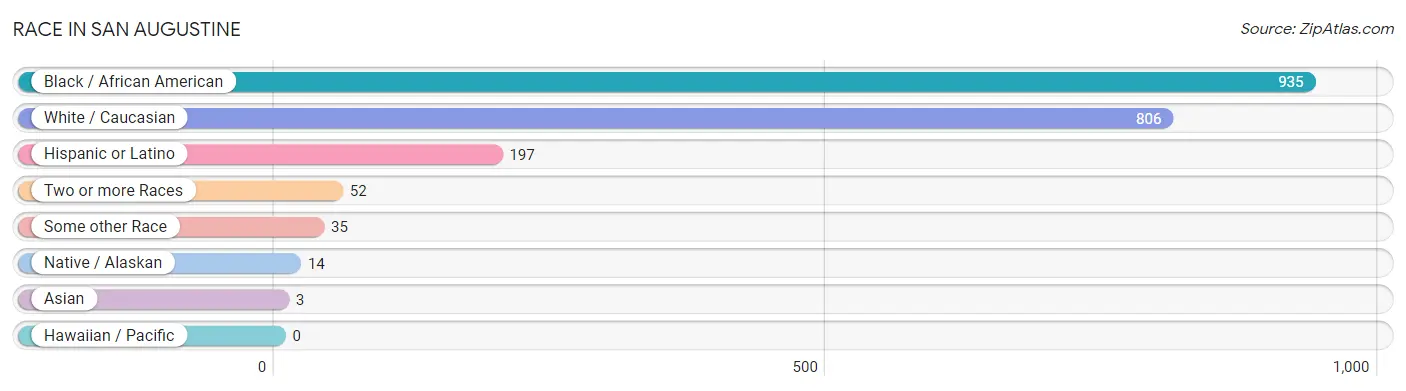
| Race | # Population | % Population |
| Asian | 3 | 0.2% |
| Black / African American | 935 | 50.7% |
| Hawaiian / Pacific | 0 | 0.0% |
| Hispanic or Latino | 197 | 10.7% |
| Native / Alaskan | 14 | 0.8% |
| White / Caucasian | 806 | 43.7% |
| Two or more Races | 52 | 2.8% |
| Some other Race | 35 | 1.9% |
| Total | 1,845 | 100.0% |
Ancestry in San Augustine
The most populous ancestries reported in San Augustine are American (186 | 10.1%), Mexican (185 | 10.0%), African (112 | 6.1%), Subsaharan African (112 | 6.1%), and English (101 | 5.5%), together accounting for 37.7% of all San Augustine residents.
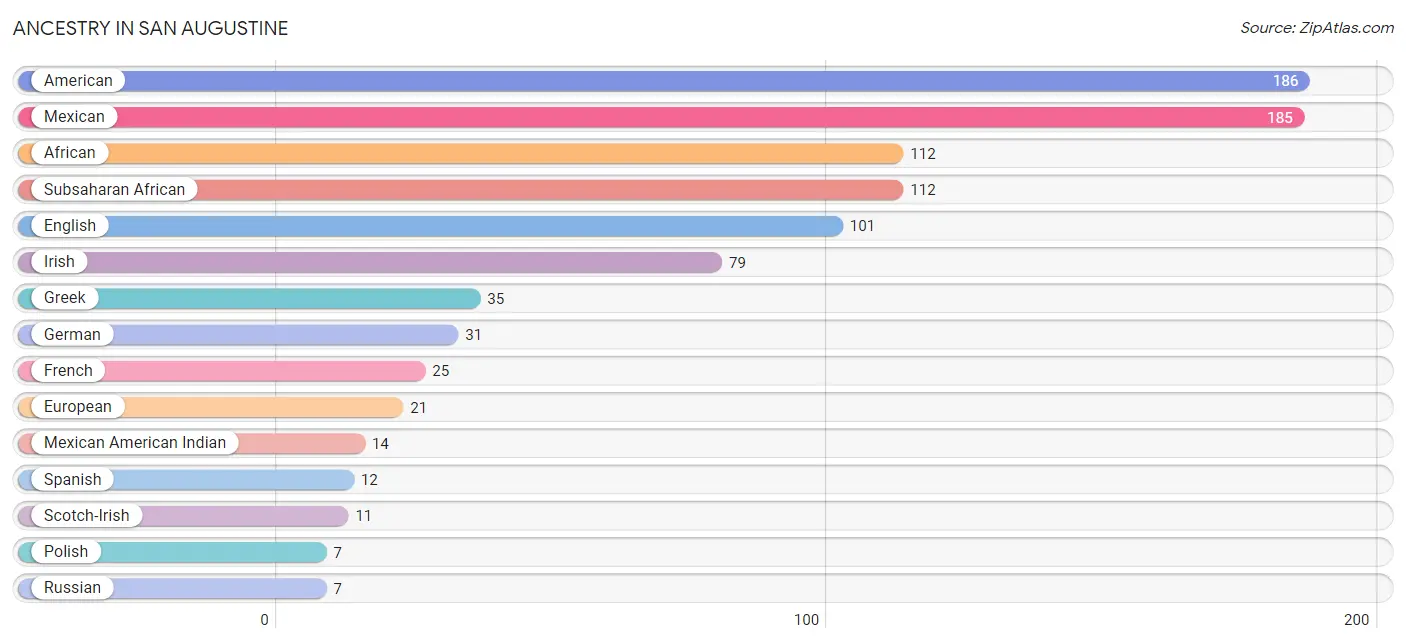
| Ancestry | # Population | % Population |
| African | 112 | 6.1% |
| American | 186 | 10.1% |
| Eastern European | 3 | 0.2% |
| English | 101 | 5.5% |
| European | 21 | 1.1% |
| French | 25 | 1.4% |
| German | 31 | 1.7% |
| Greek | 35 | 1.9% |
| Hungarian | 4 | 0.2% |
| Irish | 79 | 4.3% |
| Mexican | 185 | 10.0% |
| Mexican American Indian | 14 | 0.8% |
| Polish | 7 | 0.4% |
| Russian | 7 | 0.4% |
| Scotch-Irish | 11 | 0.6% |
| Spanish | 12 | 0.6% |
| Subsaharan African | 112 | 6.1% |
| Thai | 3 | 0.2% | View All 18 Rows |
Immigrants in San Augustine
The most numerous immigrant groups reported in San Augustine came from Central America (122 | 6.6%), Latin America (122 | 6.6%), and Mexico (122 | 6.6%), together accounting for 19.8% of all San Augustine residents.
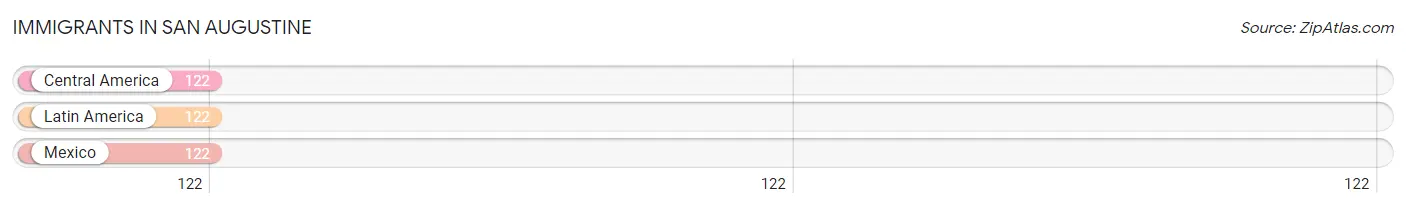
| Immigration Origin | # Population | % Population |
| Central America | 122 | 6.6% |
| Latin America | 122 | 6.6% |
| Mexico | 122 | 6.6% | View All 3 Rows |
Sex and Age in San Augustine
Sex and Age in San Augustine
The most populous age groups in San Augustine are 25 to 29 Years (140 | 15.7%) for men and 45 to 49 Years (151 | 15.8%) for women.
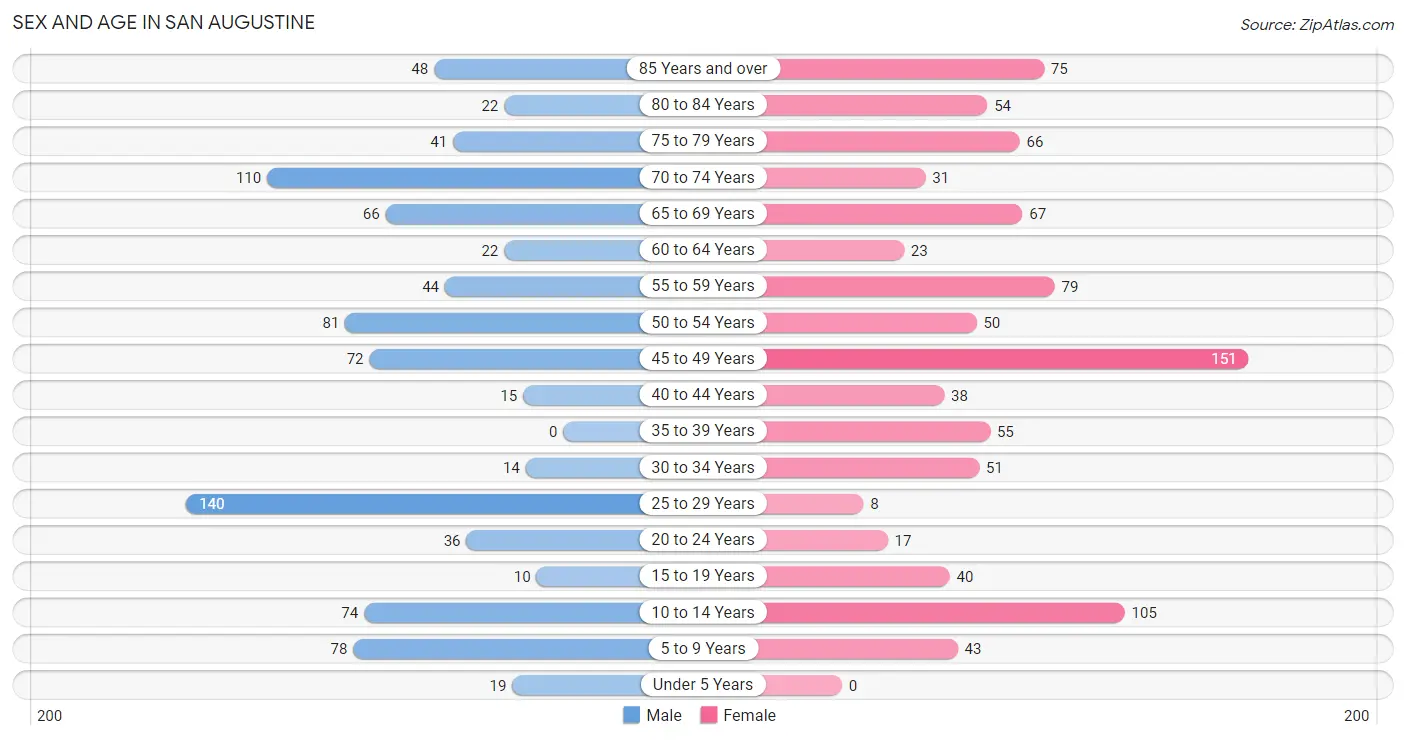
| Age Bracket | Male | Female |
| Under 5 Years | 19 (2.1%) | 0 (0.0%) |
| 5 to 9 Years | 78 (8.7%) | 43 (4.5%) |
| 10 to 14 Years | 74 (8.3%) | 105 (11.0%) |
| 15 to 19 Years | 10 (1.1%) | 40 (4.2%) |
| 20 to 24 Years | 36 (4.0%) | 17 (1.8%) |
| 25 to 29 Years | 140 (15.7%) | 8 (0.8%) |
| 30 to 34 Years | 14 (1.6%) | 51 (5.3%) |
| 35 to 39 Years | 0 (0.0%) | 55 (5.8%) |
| 40 to 44 Years | 15 (1.7%) | 38 (4.0%) |
| 45 to 49 Years | 72 (8.1%) | 151 (15.8%) |
| 50 to 54 Years | 81 (9.1%) | 50 (5.2%) |
| 55 to 59 Years | 44 (4.9%) | 79 (8.3%) |
| 60 to 64 Years | 22 (2.5%) | 23 (2.4%) |
| 65 to 69 Years | 66 (7.4%) | 67 (7.0%) |
| 70 to 74 Years | 110 (12.3%) | 31 (3.3%) |
| 75 to 79 Years | 41 (4.6%) | 66 (6.9%) |
| 80 to 84 Years | 22 (2.5%) | 54 (5.7%) |
| 85 Years and over | 48 (5.4%) | 75 (7.9%) |
| Total | 892 (100.0%) | 953 (100.0%) |
Families and Households in San Augustine
Median Family Size in San Augustine
The median family size in San Augustine is 3.11 persons per family, with married-couple families (214 | 53.8%) accounting for the largest median family size of 3.11 persons per family. On the other hand, single male/father families (2 | 0.5%) represent the smallest median family size with 3.00 persons per family.
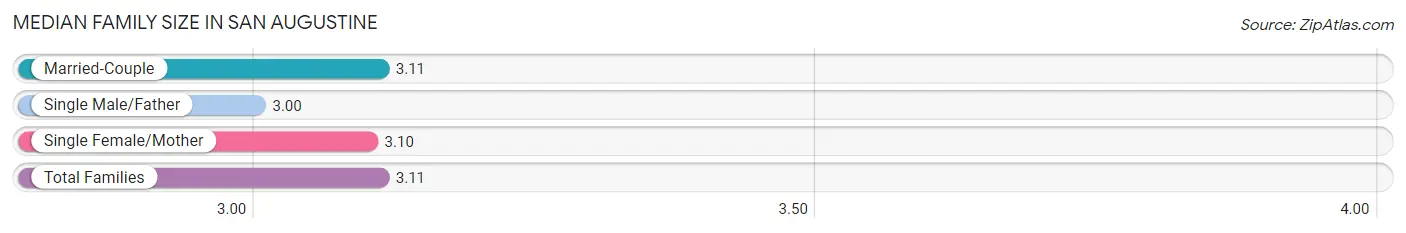
| Family Type | # Families | Family Size |
| Married-Couple | 214 (53.8%) | 3.11 |
| Single Male/Father | 2 (0.5%) | 3.00 |
| Single Female/Mother | 182 (45.7%) | 3.10 |
| Total Families | 398 (100.0%) | 3.11 |
Median Household Size in San Augustine
The median household size in San Augustine is 2.10 persons per household, with single male/father households (2 | 0.3%) accounting for the largest median household size of 14.5 persons per household. non-family households (400 | 50.1%) represent the smallest median household size with 1.01 persons per household.
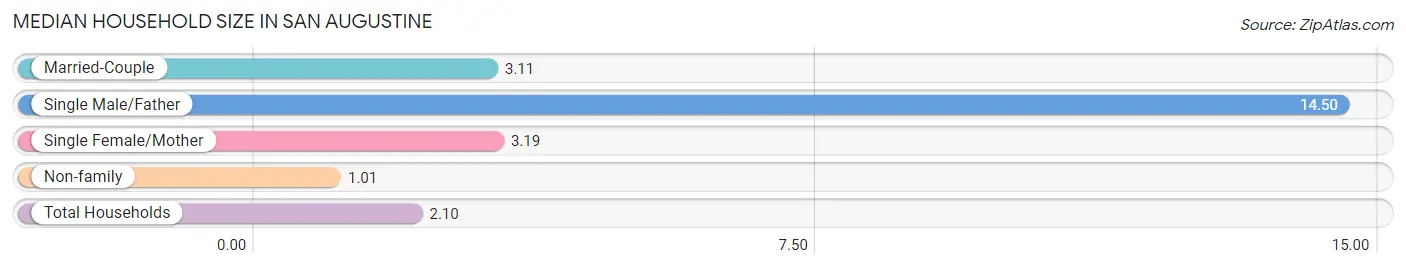
| Household Type | # Households | Household Size |
| Married-Couple | 214 (26.8%) | 3.11 |
| Single Male/Father | 2 (0.3%) | 14.50 |
| Single Female/Mother | 182 (22.8%) | 3.19 |
| Non-family | 400 (50.1%) | 1.01 |
| Total Households | 798 (100.0%) | 2.10 |
Household Size by Marriage Status in San Augustine
Out of a total of 798 households in San Augustine, 398 (49.9%) are family households, while 400 (50.1%) are nonfamily households. The most numerous type of family households are 2-person households, comprising 247, and the most common type of nonfamily households are 1-person households, comprising 396.
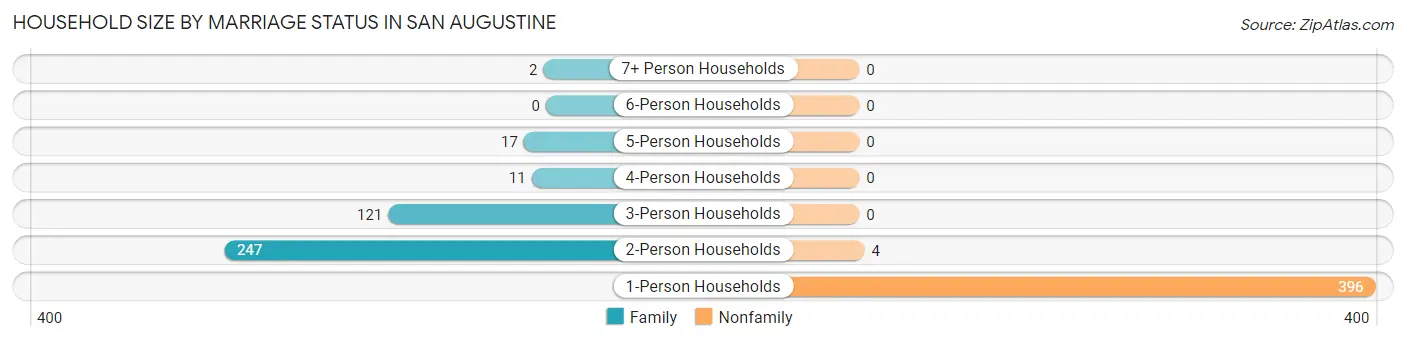
| Household Size | Family Households | Nonfamily Households |
| 1-Person Households | - | 396 (49.6%) |
| 2-Person Households | 247 (30.9%) | 4 (0.5%) |
| 3-Person Households | 121 (15.2%) | 0 (0.0%) |
| 4-Person Households | 11 (1.4%) | 0 (0.0%) |
| 5-Person Households | 17 (2.1%) | 0 (0.0%) |
| 6-Person Households | 0 (0.0%) | 0 (0.0%) |
| 7+ Person Households | 2 (0.3%) | 0 (0.0%) |
| Total | 398 (49.9%) | 400 (50.1%) |
Female Fertility in San Augustine
Fertility by Age in San Augustine
Average fertility rate in San Augustine is 44.0 births per 1,000 women. Women in the age bracket of 15 to 19 years have the highest fertility rate with 400.0 births per 1,000 women. Women in the age bracket of 15 to 19 years acount for 100.0% of all women with births.
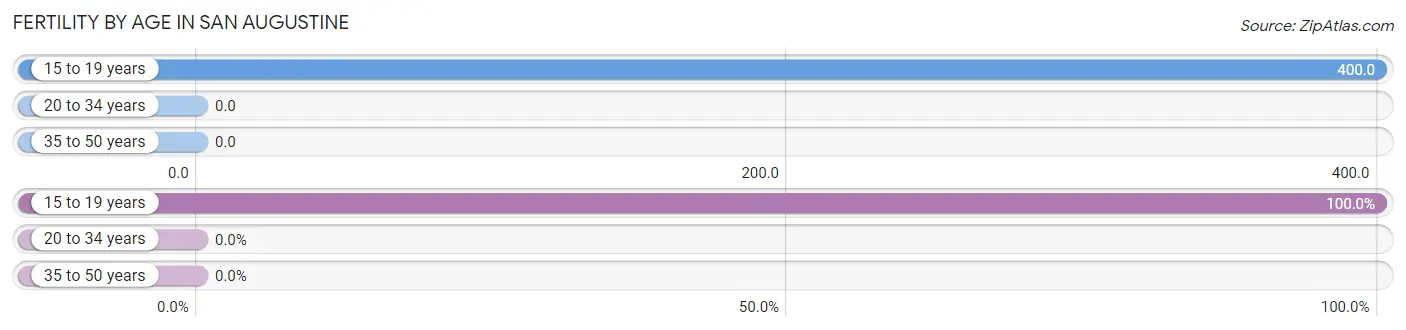
| Age Bracket | Women with Births | Births / 1,000 Women |
| 15 to 19 years | 16 (100.0%) | 400.0 |
| 20 to 34 years | 0 (0.0%) | 0.0 |
| 35 to 50 years | 0 (0.0%) | 0.0 |
| Total | 16 (100.0%) | 44.0 |
Fertility by Age by Marriage Status in San Augustine
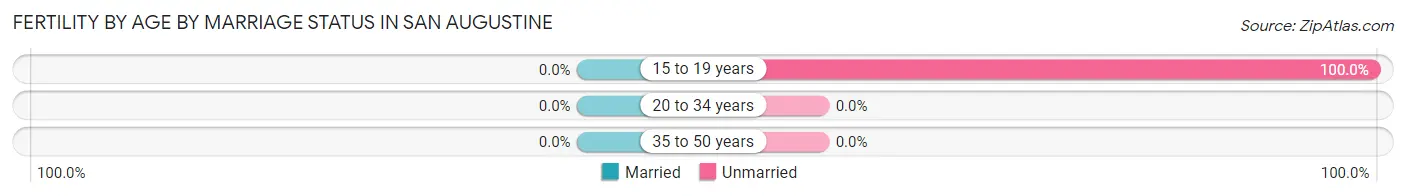
| Age Bracket | Married | Unmarried |
| 15 to 19 years | 0 (0.0%) | 16 (100.0%) |
| 20 to 34 years | 0 (0.0%) | 0 (0.0%) |
| 35 to 50 years | 0 (0.0%) | 0 (0.0%) |
| Total | 0 (0.0%) | 16 (100.0%) |
Fertility by Education in San Augustine
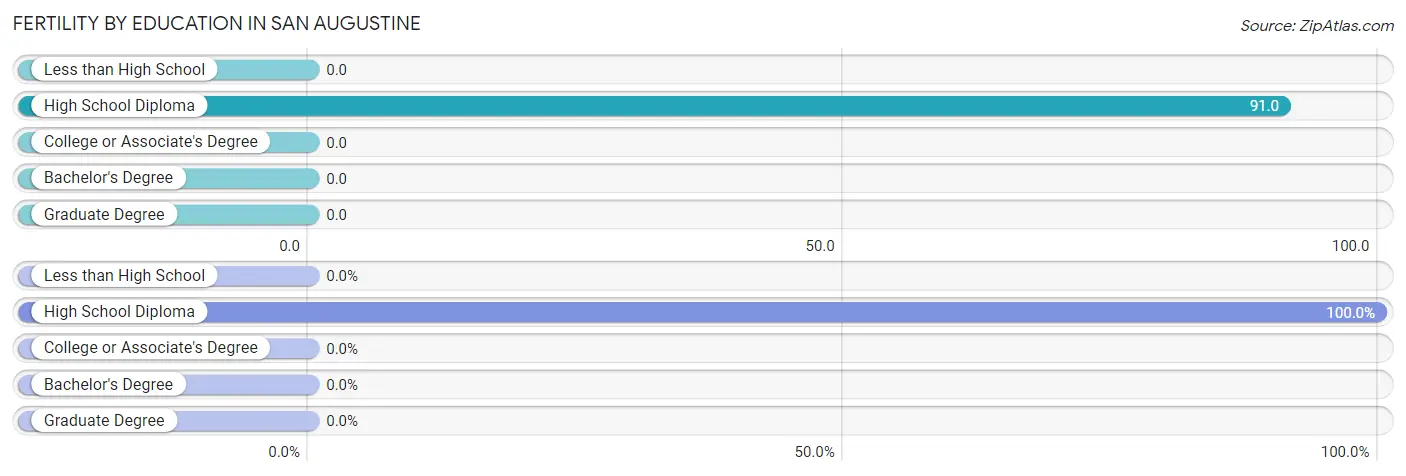
| Educational Attainment | Women with Births | Births / 1,000 Women |
| Less than High School | 0 (0.0%) | 0.0 |
| High School Diploma | 16 (100.0%) | 91.0 |
| College or Associate's Degree | 0 (0.0%) | 0.0 |
| Bachelor's Degree | 0 (0.0%) | 0.0 |
| Graduate Degree | 0 (0.0%) | 0.0 |
| Total | 16 (100.0%) | 44.0 |
Fertility by Education by Marriage Status in San Augustine
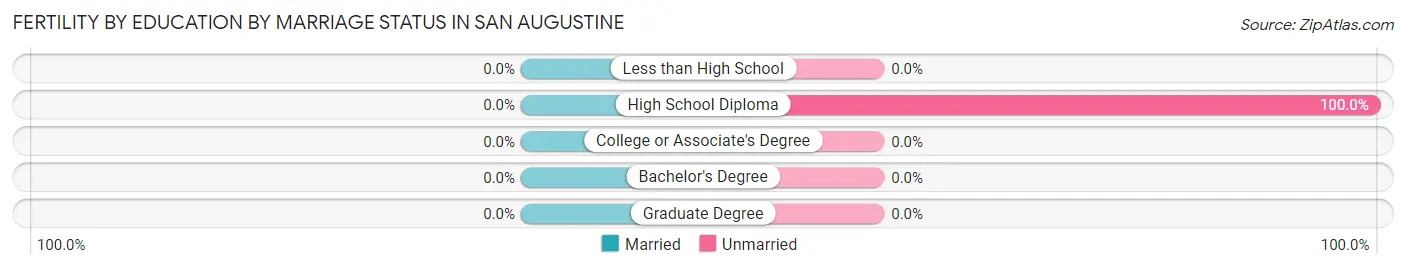
| Educational Attainment | Married | Unmarried |
| Less than High School | 0 (0.0%) | 0 (0.0%) |
| High School Diploma | 0 (0.0%) | 16 (100.0%) |
| College or Associate's Degree | 0 (0.0%) | 0 (0.0%) |
| Bachelor's Degree | 0 (0.0%) | 0 (0.0%) |
| Graduate Degree | 0 (0.0%) | 0 (0.0%) |
| Total | 0 (0.0%) | 16 (100.0%) |
Employment Characteristics in San Augustine
Employment by Class of Employer in San Augustine
Among the 512 employed individuals in San Augustine, private company employees (353 | 69.0%), not-for-profit organizations (51 | 10.0%), and state government employees (50 | 9.8%) make up the most common classes of employment.
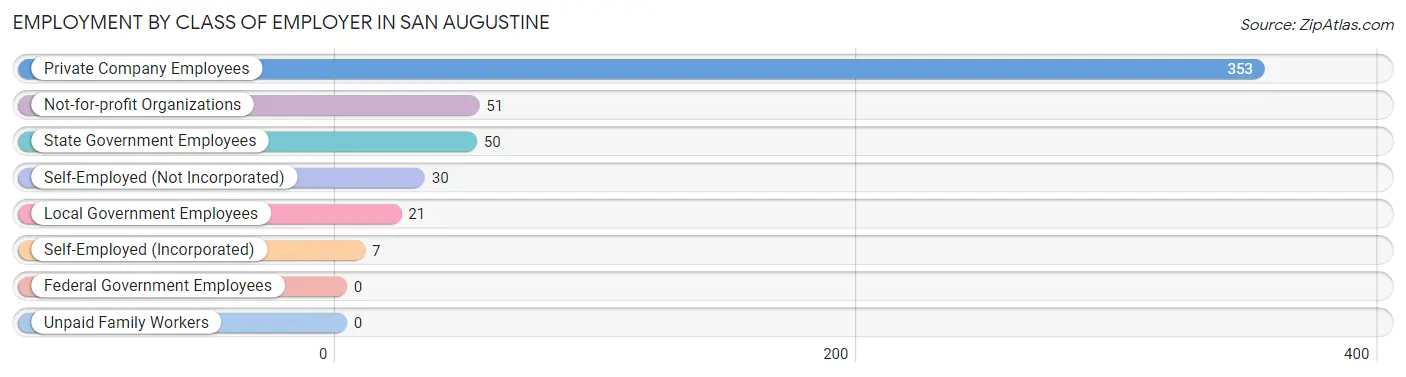
| Employer Class | # Employees | % Employees |
| Private Company Employees | 353 | 69.0% |
| Self-Employed (Incorporated) | 7 | 1.4% |
| Self-Employed (Not Incorporated) | 30 | 5.9% |
| Not-for-profit Organizations | 51 | 10.0% |
| Local Government Employees | 21 | 4.1% |
| State Government Employees | 50 | 9.8% |
| Federal Government Employees | 0 | 0.0% |
| Unpaid Family Workers | 0 | 0.0% |
| Total | 512 | 100.0% |
Employment Status by Age in San Augustine
According to the labor force statistics for San Augustine, out of the total population over 16 years of age (1,526), 41.8% or 638 individuals are in the labor force, with 19.7% or 126 of them unemployed. The age group with the highest labor force participation rate is 30 to 34 years, with 93.8% or 61 individuals in the labor force. Within the labor force, the 20 to 24 years age range has the highest percentage of unemployed individuals, with 78.8% or 26 of them being unemployed.
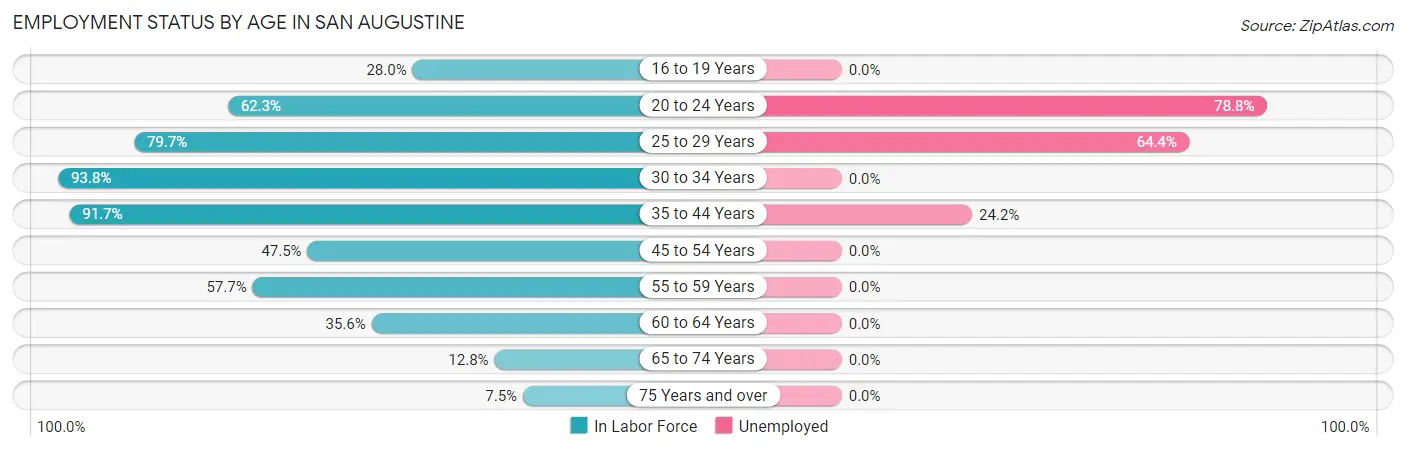
| Age Bracket | In Labor Force | Unemployed |
| 16 to 19 Years | 14 (28.0%) | 0 (0.0%) |
| 20 to 24 Years | 33 (62.3%) | 26 (78.8%) |
| 25 to 29 Years | 118 (79.7%) | 76 (64.4%) |
| 30 to 34 Years | 61 (93.8%) | 0 (0.0%) |
| 35 to 44 Years | 99 (91.7%) | 24 (24.2%) |
| 45 to 54 Years | 168 (47.5%) | 0 (0.0%) |
| 55 to 59 Years | 71 (57.7%) | 0 (0.0%) |
| 60 to 64 Years | 16 (35.6%) | 0 (0.0%) |
| 65 to 74 Years | 35 (12.8%) | 0 (0.0%) |
| 75 Years and over | 23 (7.5%) | 0 (0.0%) |
| Total | 638 (41.8%) | 126 (19.7%) |
Employment Status by Educational Attainment in San Augustine
According to labor force statistics for San Augustine, 63.2% of individuals (533) out of the total population between 25 and 64 years of age (843) are in the labor force, with 18.8% or 100 of them being unemployed. The group with the highest labor force participation rate are those with the educational attainment of bachelor's degree or higher, with 83.5% or 96 individuals in the labor force. Within the labor force, individuals with high school diploma education have the highest percentage of unemployment, with 24.4% or 76 of them being unemployed.
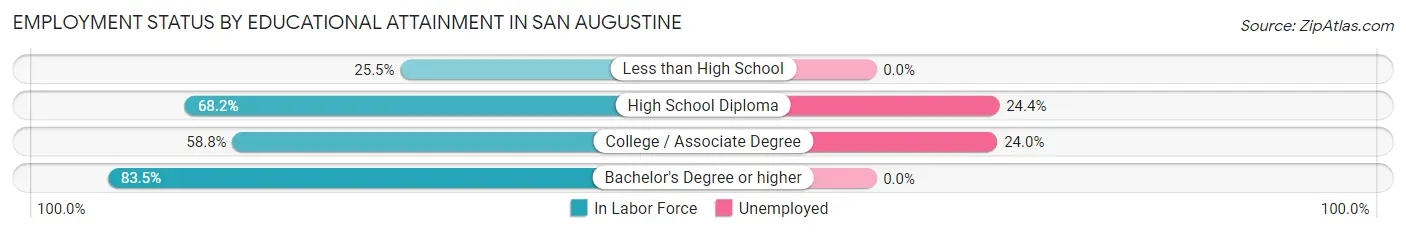
| Educational Attainment | In Labor Force | Unemployed |
| Less than High School | 26 (25.5%) | 0 (0.0%) |
| High School Diploma | 311 (68.2%) | 111 (24.4%) |
| College / Associate Degree | 100 (58.8%) | 41 (24.0%) |
| Bachelor's Degree or higher | 96 (83.5%) | 0 (0.0%) |
| Total | 533 (63.2%) | 158 (18.8%) |
Employment Occupations by Sex in San Augustine
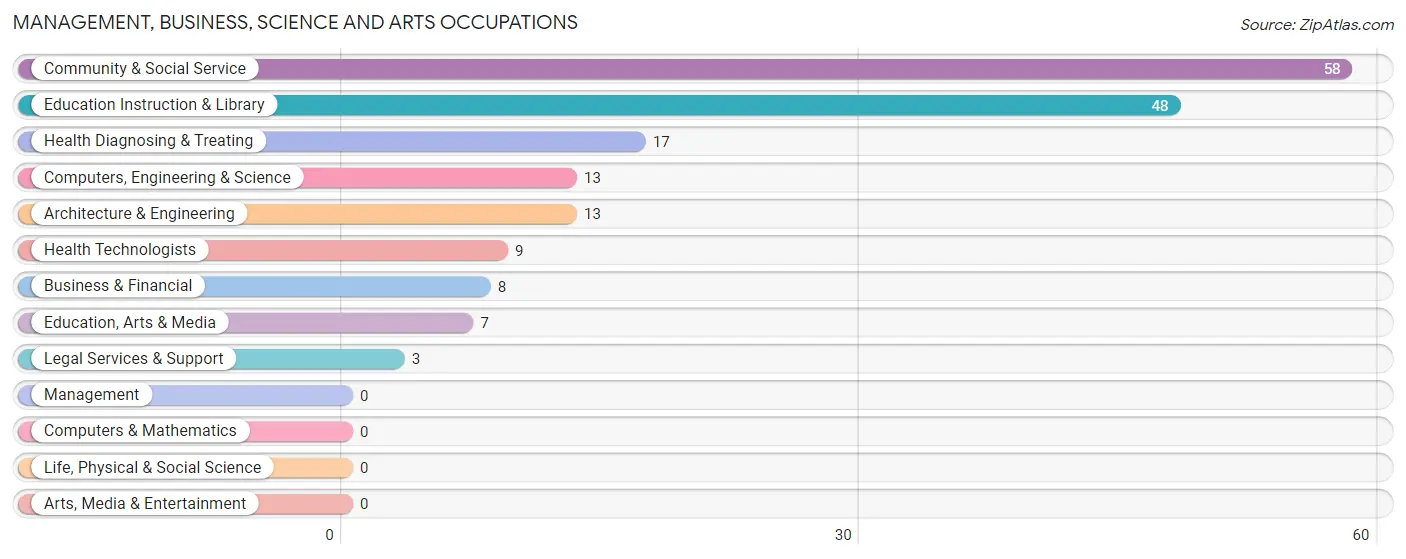
Management, Business, Science and Arts Occupations
The most common Management, Business, Science and Arts occupations in San Augustine are Community & Social Service (58 | 11.3%), Education Instruction & Library (48 | 9.4%), Health Diagnosing & Treating (17 | 3.3%), Computers, Engineering & Science (13 | 2.5%), and Architecture & Engineering (13 | 2.5%).
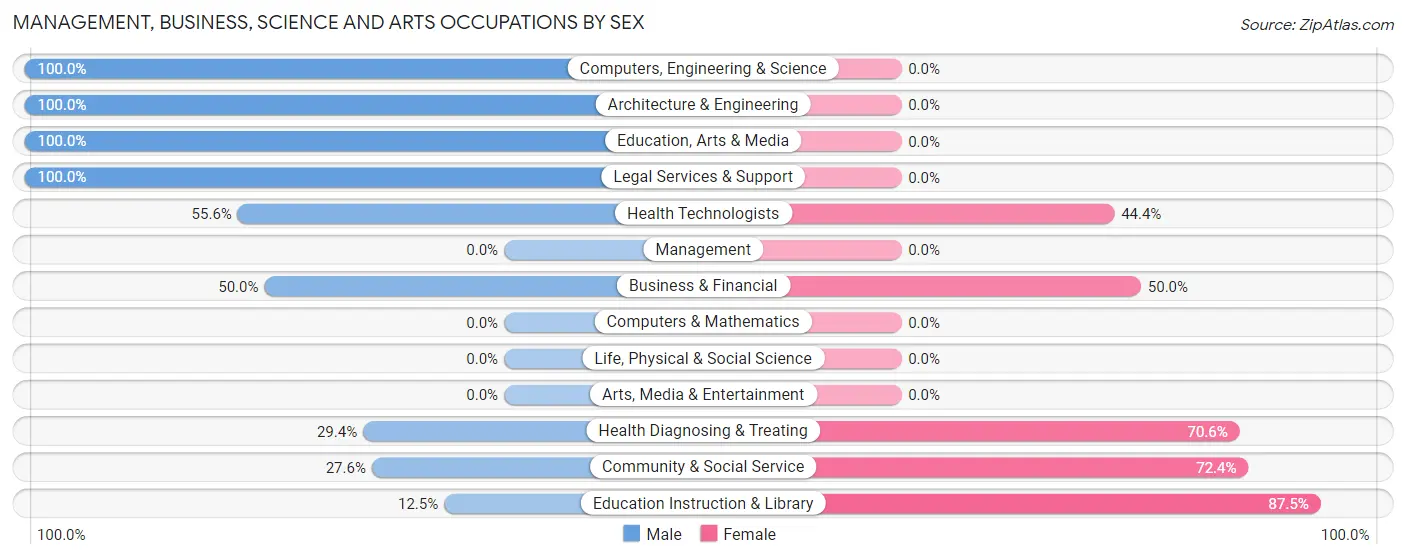
Management, Business, Science and Arts Occupations by Sex
Within the Management, Business, Science and Arts occupations in San Augustine, the most male-oriented occupations are Computers, Engineering & Science (100.0%), Architecture & Engineering (100.0%), and Education, Arts & Media (100.0%), while the most female-oriented occupations are Education Instruction & Library (87.5%), Community & Social Service (72.4%), and Health Diagnosing & Treating (70.6%).
| Occupation | Male | Female |
| Management | 0 (0.0%) | 0 (0.0%) |
| Business & Financial | 4 (50.0%) | 4 (50.0%) |
| Computers, Engineering & Science | 13 (100.0%) | 0 (0.0%) |
| Computers & Mathematics | 0 (0.0%) | 0 (0.0%) |
| Architecture & Engineering | 13 (100.0%) | 0 (0.0%) |
| Life, Physical & Social Science | 0 (0.0%) | 0 (0.0%) |
| Community & Social Service | 16 (27.6%) | 42 (72.4%) |
| Education, Arts & Media | 7 (100.0%) | 0 (0.0%) |
| Legal Services & Support | 3 (100.0%) | 0 (0.0%) |
| Education Instruction & Library | 6 (12.5%) | 42 (87.5%) |
| Arts, Media & Entertainment | 0 (0.0%) | 0 (0.0%) |
| Health Diagnosing & Treating | 5 (29.4%) | 12 (70.6%) |
| Health Technologists | 5 (55.6%) | 4 (44.4%) |
| Total (Category) | 38 (39.6%) | 58 (60.4%) |
| Total (Overall) | 194 (37.9%) | 318 (62.1%) |
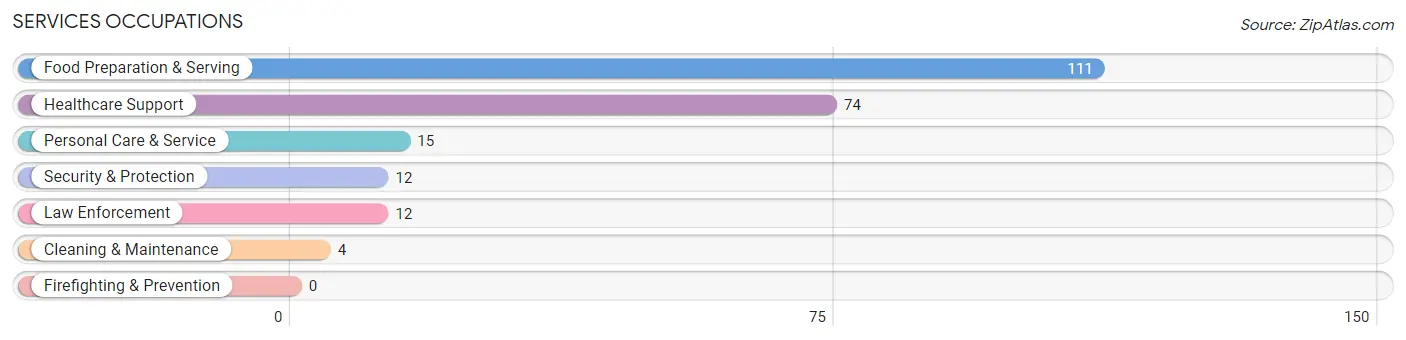
Services Occupations
The most common Services occupations in San Augustine are Food Preparation & Serving (111 | 21.7%), Healthcare Support (74 | 14.4%), Personal Care & Service (15 | 2.9%), Security & Protection (12 | 2.3%), and Law Enforcement (12 | 2.3%).
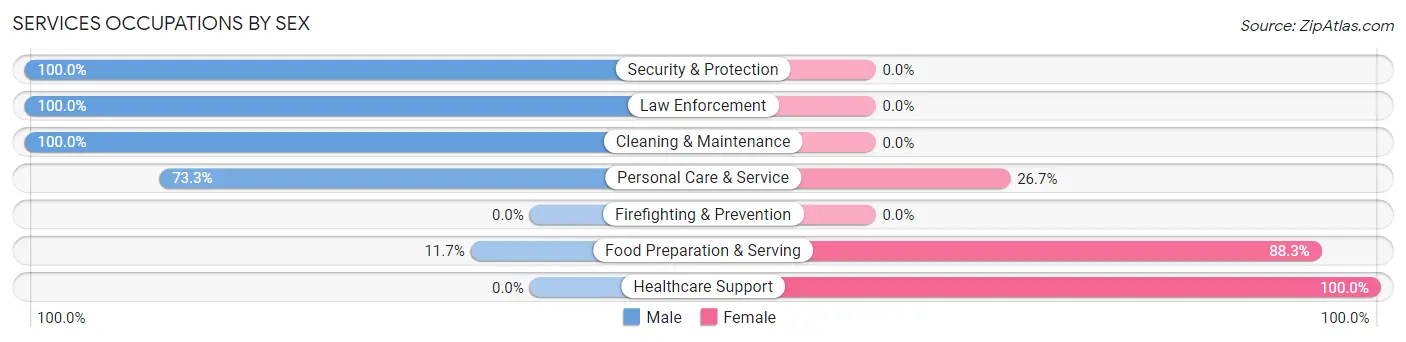
Services Occupations by Sex
Within the Services occupations in San Augustine, the most male-oriented occupations are Security & Protection (100.0%), Law Enforcement (100.0%), and Cleaning & Maintenance (100.0%), while the most female-oriented occupations are Healthcare Support (100.0%), Food Preparation & Serving (88.3%), and Personal Care & Service (26.7%).
| Occupation | Male | Female |
| Healthcare Support | 0 (0.0%) | 74 (100.0%) |
| Security & Protection | 12 (100.0%) | 0 (0.0%) |
| Firefighting & Prevention | 0 (0.0%) | 0 (0.0%) |
| Law Enforcement | 12 (100.0%) | 0 (0.0%) |
| Food Preparation & Serving | 13 (11.7%) | 98 (88.3%) |
| Cleaning & Maintenance | 4 (100.0%) | 0 (0.0%) |
| Personal Care & Service | 11 (73.3%) | 4 (26.7%) |
| Total (Category) | 40 (18.5%) | 176 (81.5%) |
| Total (Overall) | 194 (37.9%) | 318 (62.1%) |
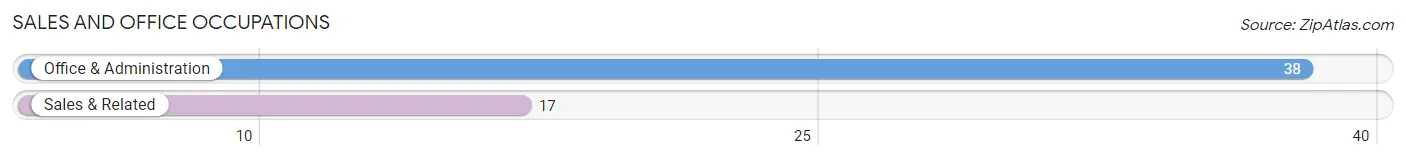
Sales and Office Occupations
The most common Sales and Office occupations in San Augustine are Office & Administration (38 | 7.4%), and Sales & Related (17 | 3.3%).
Sales and Office Occupations by Sex
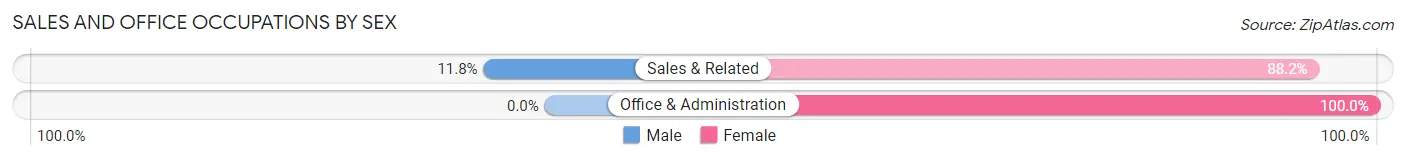
| Occupation | Male | Female |
| Sales & Related | 2 (11.8%) | 15 (88.2%) |
| Office & Administration | 0 (0.0%) | 38 (100.0%) |
| Total (Category) | 2 (3.6%) | 53 (96.4%) |
| Total (Overall) | 194 (37.9%) | 318 (62.1%) |
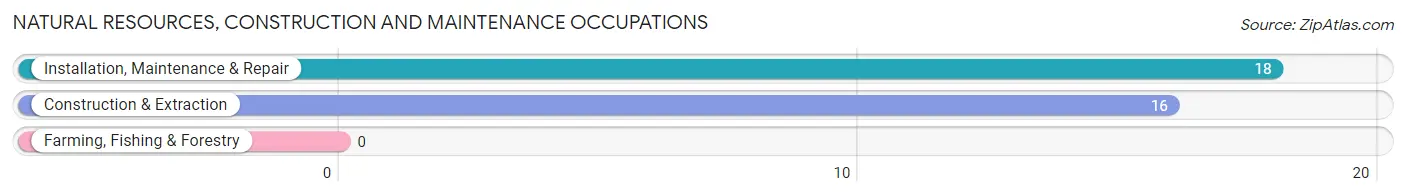
Natural Resources, Construction and Maintenance Occupations
The most common Natural Resources, Construction and Maintenance occupations in San Augustine are Installation, Maintenance & Repair (18 | 3.5%), and Construction & Extraction (16 | 3.1%).
Natural Resources, Construction and Maintenance Occupations by Sex
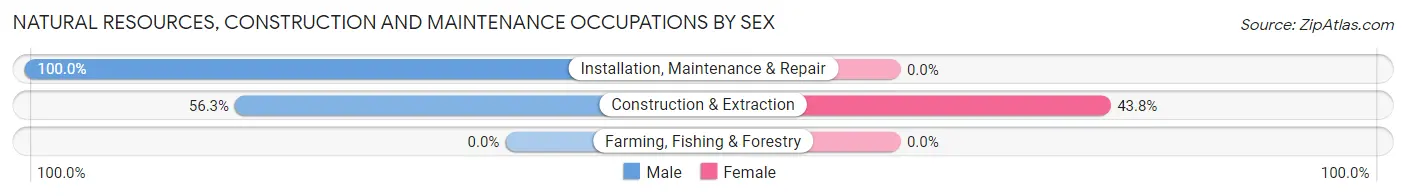
| Occupation | Male | Female |
| Farming, Fishing & Forestry | 0 (0.0%) | 0 (0.0%) |
| Construction & Extraction | 9 (56.2%) | 7 (43.8%) |
| Installation, Maintenance & Repair | 18 (100.0%) | 0 (0.0%) |
| Total (Category) | 27 (79.4%) | 7 (20.6%) |
| Total (Overall) | 194 (37.9%) | 318 (62.1%) |
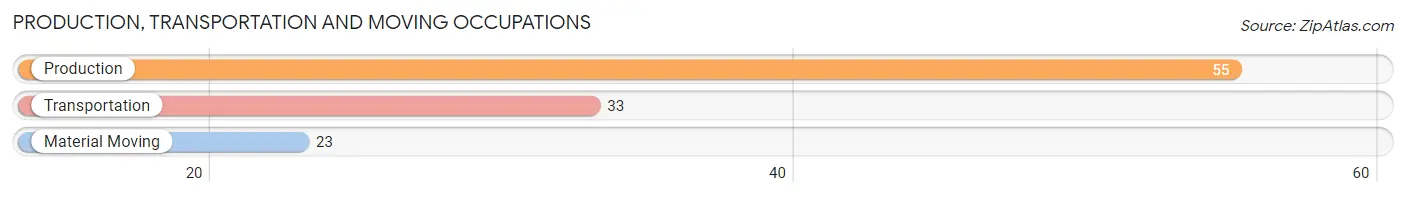
Production, Transportation and Moving Occupations
The most common Production, Transportation and Moving occupations in San Augustine are Production (55 | 10.7%), Transportation (33 | 6.5%), and Material Moving (23 | 4.5%).
Production, Transportation and Moving Occupations by Sex
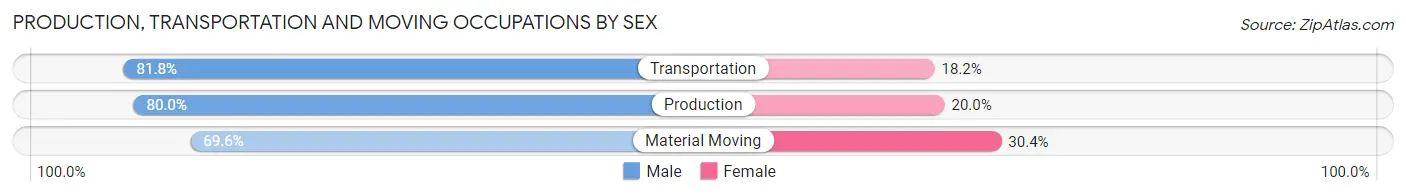
| Occupation | Male | Female |
| Production | 44 (80.0%) | 11 (20.0%) |
| Transportation | 27 (81.8%) | 6 (18.2%) |
| Material Moving | 16 (69.6%) | 7 (30.4%) |
| Total (Category) | 87 (78.4%) | 24 (21.6%) |
| Total (Overall) | 194 (37.9%) | 318 (62.1%) |
Employment Industries by Sex in San Augustine
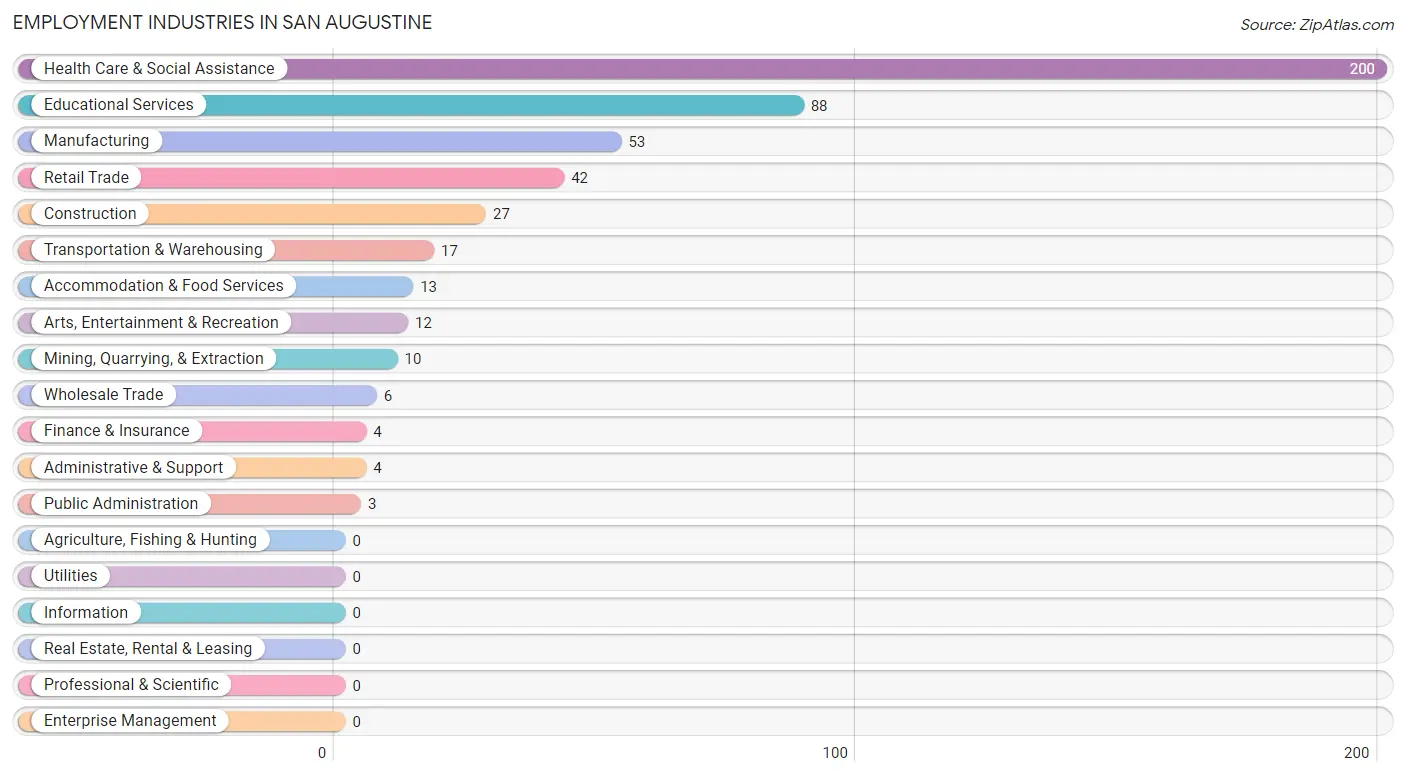
Employment Industries in San Augustine
The major employment industries in San Augustine include Health Care & Social Assistance (200 | 39.1%), Educational Services (88 | 17.2%), Manufacturing (53 | 10.3%), Retail Trade (42 | 8.2%), and Construction (27 | 5.3%).
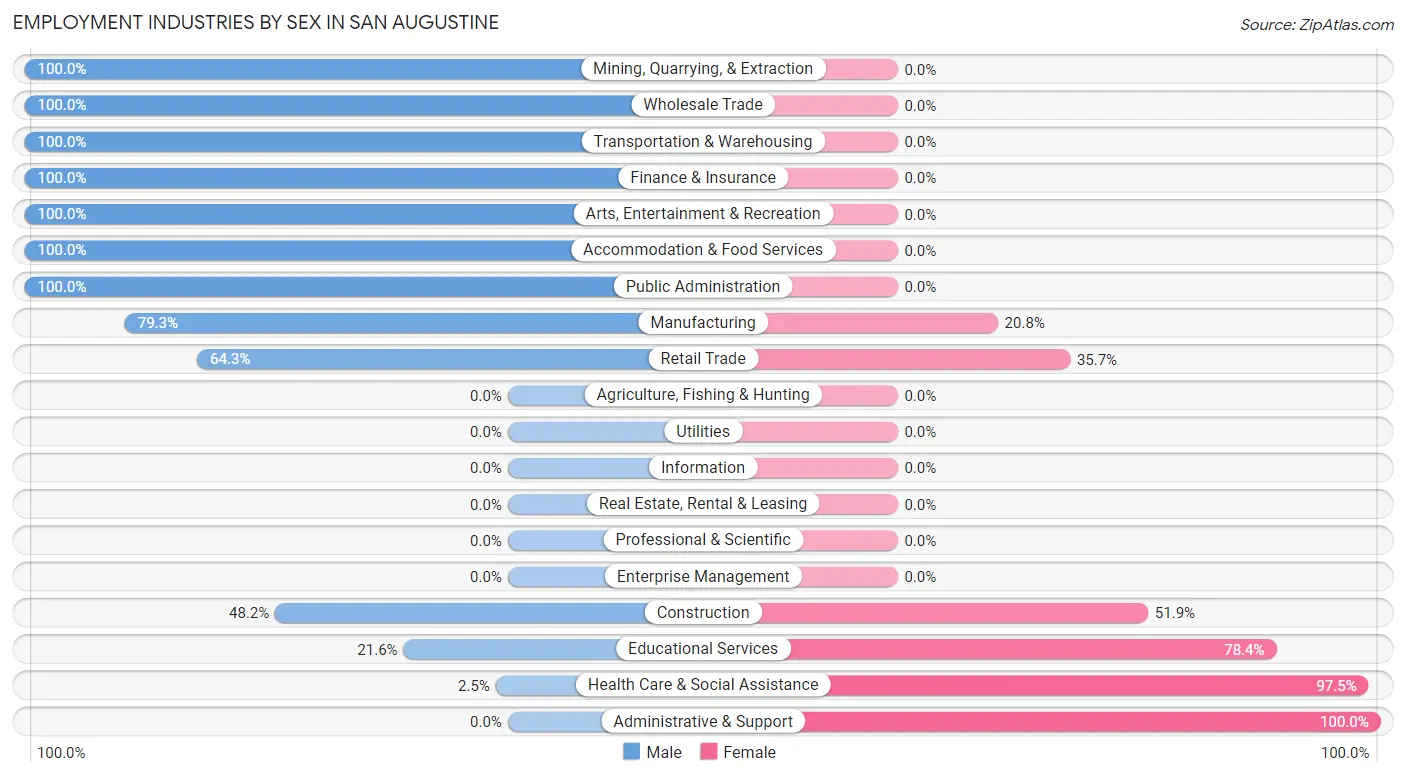
Employment Industries by Sex in San Augustine
The San Augustine industries that see more men than women are Mining, Quarrying, & Extraction (100.0%), Wholesale Trade (100.0%), and Transportation & Warehousing (100.0%), whereas the industries that tend to have a higher number of women are Administrative & Support (100.0%), Health Care & Social Assistance (97.5%), and Educational Services (78.4%).
| Industry | Male | Female |
| Agriculture, Fishing & Hunting | 0 (0.0%) | 0 (0.0%) |
| Mining, Quarrying, & Extraction | 10 (100.0%) | 0 (0.0%) |
| Construction | 13 (48.1%) | 14 (51.8%) |
| Manufacturing | 42 (79.2%) | 11 (20.7%) |
| Wholesale Trade | 6 (100.0%) | 0 (0.0%) |
| Retail Trade | 27 (64.3%) | 15 (35.7%) |
| Transportation & Warehousing | 17 (100.0%) | 0 (0.0%) |
| Utilities | 0 (0.0%) | 0 (0.0%) |
| Information | 0 (0.0%) | 0 (0.0%) |
| Finance & Insurance | 4 (100.0%) | 0 (0.0%) |
| Real Estate, Rental & Leasing | 0 (0.0%) | 0 (0.0%) |
| Professional & Scientific | 0 (0.0%) | 0 (0.0%) |
| Enterprise Management | 0 (0.0%) | 0 (0.0%) |
| Administrative & Support | 0 (0.0%) | 4 (100.0%) |
| Educational Services | 19 (21.6%) | 69 (78.4%) |
| Health Care & Social Assistance | 5 (2.5%) | 195 (97.5%) |
| Arts, Entertainment & Recreation | 12 (100.0%) | 0 (0.0%) |
| Accommodation & Food Services | 13 (100.0%) | 0 (0.0%) |
| Public Administration | 3 (100.0%) | 0 (0.0%) |
| Total | 194 (37.9%) | 318 (62.1%) |
Education in San Augustine
School Enrollment in San Augustine
The most common levels of schooling among the 375 students in San Augustine are elementary school (140 | 37.3%), middle school (95 | 25.3%), and high school (72 | 19.2%).
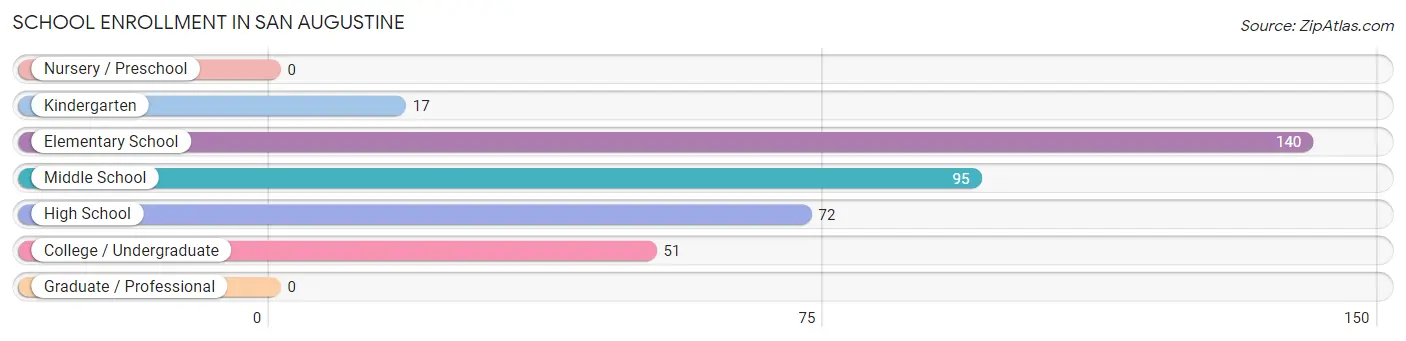
| School Level | # Students | % Students |
| Nursery / Preschool | 0 | 0.0% |
| Kindergarten | 17 | 4.5% |
| Elementary School | 140 | 37.3% |
| Middle School | 95 | 25.3% |
| High School | 72 | 19.2% |
| College / Undergraduate | 51 | 13.6% |
| Graduate / Professional | 0 | 0.0% |
| Total | 375 | 100.0% |
School Enrollment by Age by Funding Source in San Augustine
Out of a total of 375 students who are enrolled in schools in San Augustine, 47 (12.5%) attend a private institution, while the remaining 328 (87.5%) are enrolled in public schools. The age group of 5 to 9 year old has the highest likelihood of being enrolled in private schools, with 47 (38.8% in the age bracket) enrolled. Conversely, the age group of 10 to 14 year olds has the lowest likelihood of being enrolled in a private school, with 179 (100.0% in the age bracket) attending a public institution.
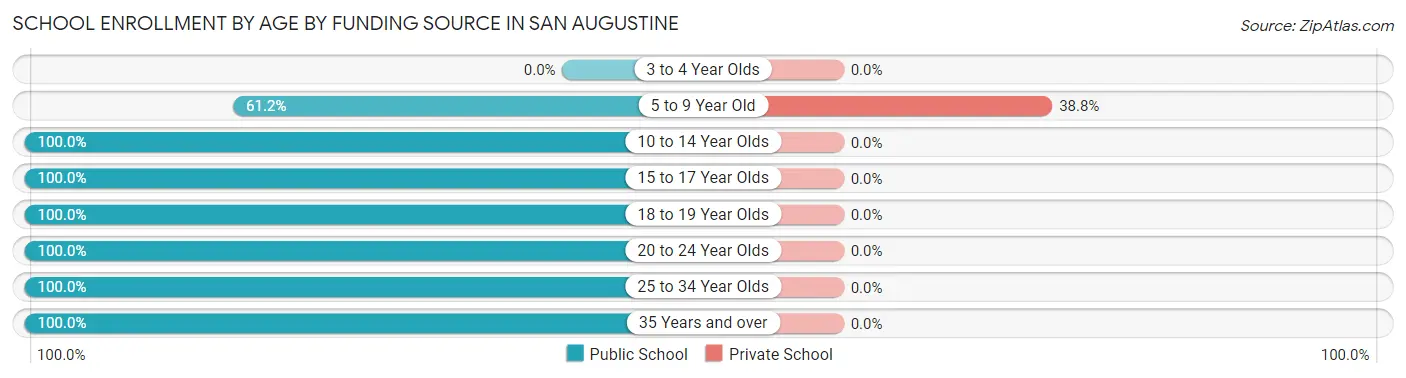
| Age Bracket | Public School | Private School |
| 3 to 4 Year Olds | 0 (0.0%) | 0 (0.0%) |
| 5 to 9 Year Old | 74 (61.2%) | 47 (38.8%) |
| 10 to 14 Year Olds | 179 (100.0%) | 0 (0.0%) |
| 15 to 17 Year Olds | 11 (100.0%) | 0 (0.0%) |
| 18 to 19 Year Olds | 23 (100.0%) | 0 (0.0%) |
| 20 to 24 Year Olds | 26 (100.0%) | 0 (0.0%) |
| 25 to 34 Year Olds | 7 (100.0%) | 0 (0.0%) |
| 35 Years and over | 8 (100.0%) | 0 (0.0%) |
| Total | 328 (87.5%) | 47 (12.5%) |
Educational Attainment by Field of Study in San Augustine
Education (116 | 44.4%), liberal arts & history (39 | 14.9%), science & technology (33 | 12.6%), bio, nature & agricultural (28 | 10.7%), and business (26 | 10.0%) are the most common fields of study among 261 individuals in San Augustine who have obtained a bachelor's degree or higher.
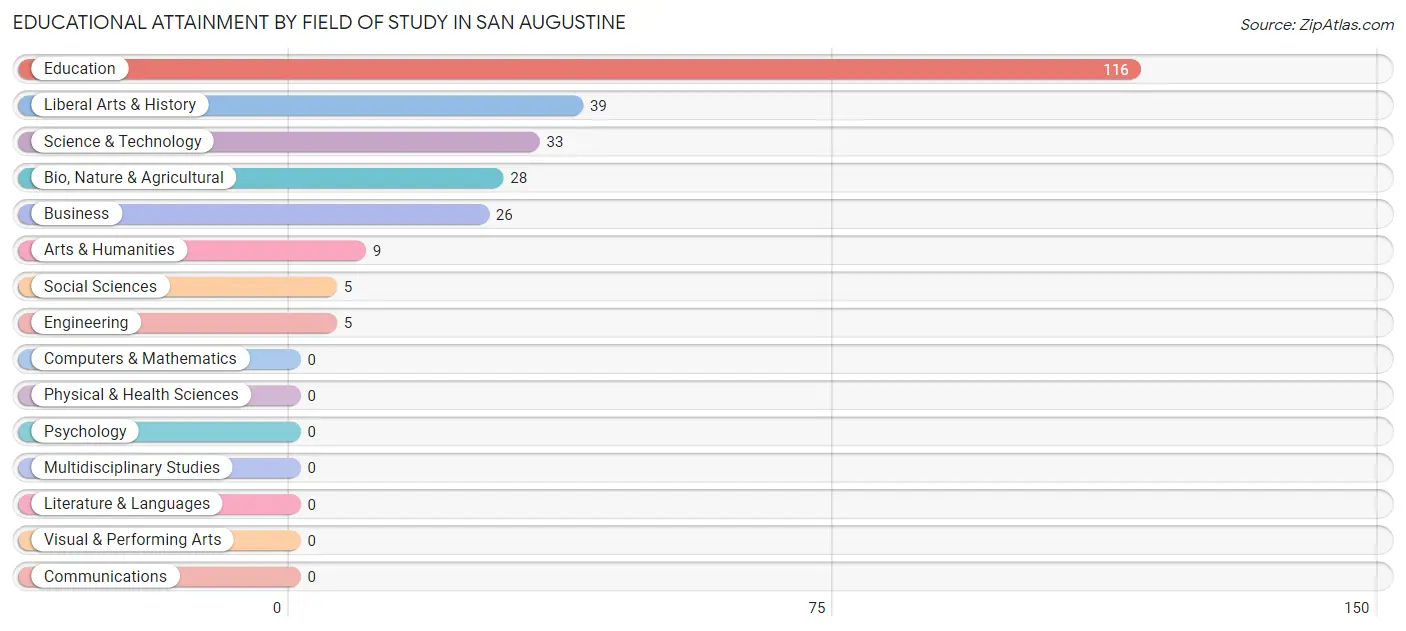
| Field of Study | # Graduates | % Graduates |
| Computers & Mathematics | 0 | 0.0% |
| Bio, Nature & Agricultural | 28 | 10.7% |
| Physical & Health Sciences | 0 | 0.0% |
| Psychology | 0 | 0.0% |
| Social Sciences | 5 | 1.9% |
| Engineering | 5 | 1.9% |
| Multidisciplinary Studies | 0 | 0.0% |
| Science & Technology | 33 | 12.6% |
| Business | 26 | 10.0% |
| Education | 116 | 44.4% |
| Literature & Languages | 0 | 0.0% |
| Liberal Arts & History | 39 | 14.9% |
| Visual & Performing Arts | 0 | 0.0% |
| Communications | 0 | 0.0% |
| Arts & Humanities | 9 | 3.5% |
| Total | 261 | 100.0% |
Transportation & Commute in San Augustine
Vehicle Availability by Sex in San Augustine
The most prevalent vehicle ownership categories in San Augustine are males with 1 vehicle (66, accounting for 34.0%) and females with 1 vehicle (116, making up 20.7%).
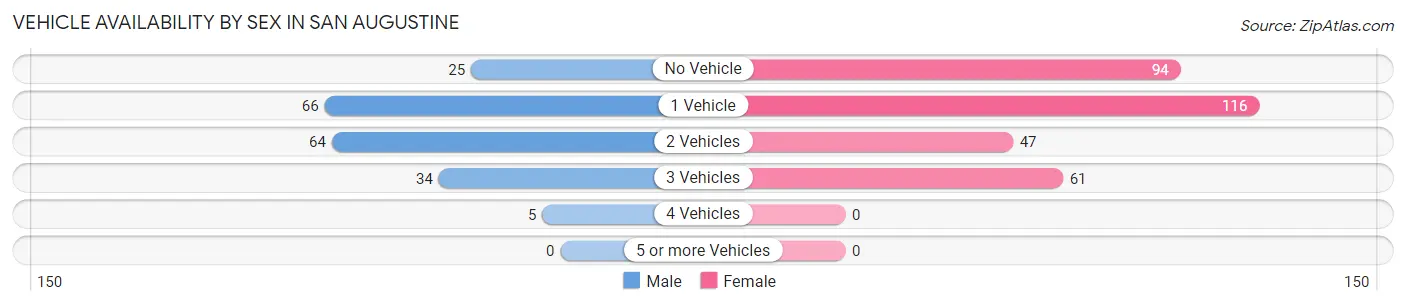
| Vehicles Available | Male | Female |
| No Vehicle | 25 (12.9%) | 94 (29.6%) |
| 1 Vehicle | 66 (34.0%) | 116 (36.5%) |
| 2 Vehicles | 64 (33.0%) | 47 (14.8%) |
| 3 Vehicles | 34 (17.5%) | 61 (19.2%) |
| 4 Vehicles | 5 (2.6%) | 0 (0.0%) |
| 5 or more Vehicles | 0 (0.0%) | 0 (0.0%) |
| Total | 194 (100.0%) | 318 (100.0%) |
Commute Time in San Augustine
The most frequently occuring commute durations in San Augustine are less than 5 minutes (128 commuters, 26.2%), 5 to 9 minutes (123 commuters, 25.2%), and 20 to 24 minutes (55 commuters, 11.3%).
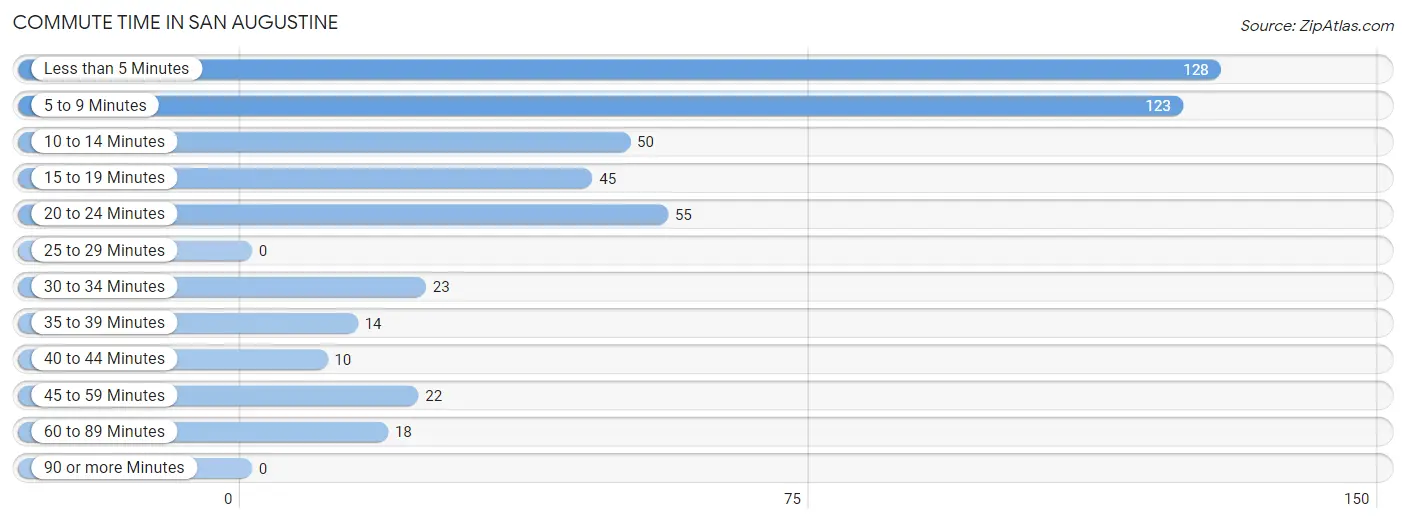
| Commute Time | # Commuters | % Commuters |
| Less than 5 Minutes | 128 | 26.2% |
| 5 to 9 Minutes | 123 | 25.2% |
| 10 to 14 Minutes | 50 | 10.2% |
| 15 to 19 Minutes | 45 | 9.2% |
| 20 to 24 Minutes | 55 | 11.3% |
| 25 to 29 Minutes | 0 | 0.0% |
| 30 to 34 Minutes | 23 | 4.7% |
| 35 to 39 Minutes | 14 | 2.9% |
| 40 to 44 Minutes | 10 | 2.1% |
| 45 to 59 Minutes | 22 | 4.5% |
| 60 to 89 Minutes | 18 | 3.7% |
| 90 or more Minutes | 0 | 0.0% |
Commute Time by Sex in San Augustine
The most common commute times in San Augustine are 5 to 9 minutes (40 commuters, 20.6%) for males and less than 5 minutes (96 commuters, 32.7%) for females.
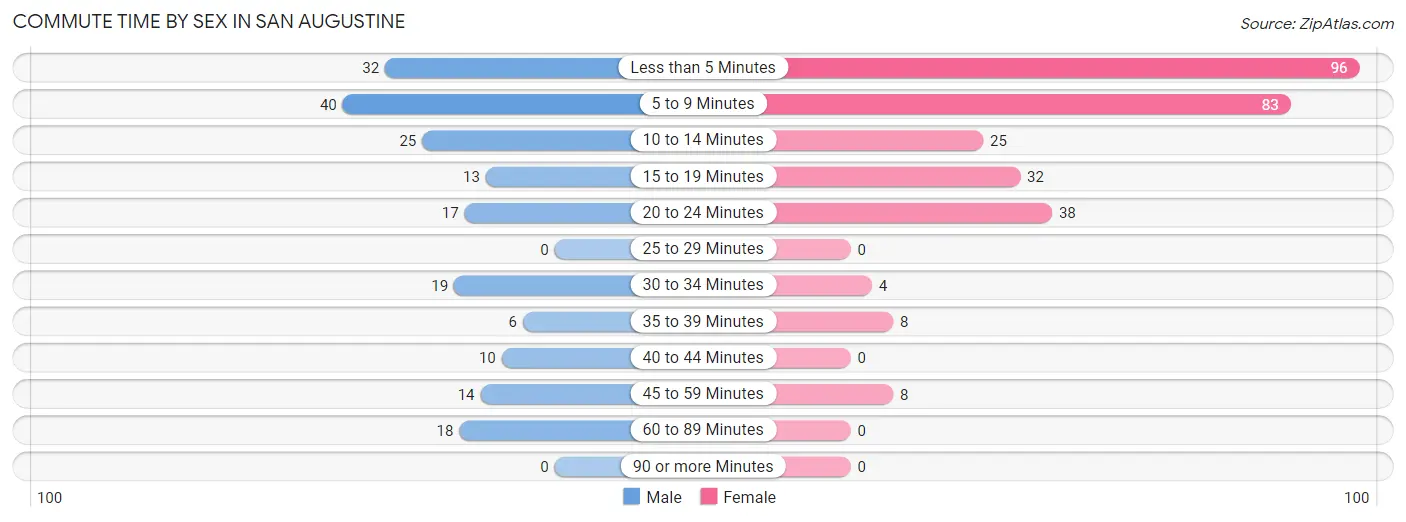
| Commute Time | Male | Female |
| Less than 5 Minutes | 32 (16.5%) | 96 (32.7%) |
| 5 to 9 Minutes | 40 (20.6%) | 83 (28.2%) |
| 10 to 14 Minutes | 25 (12.9%) | 25 (8.5%) |
| 15 to 19 Minutes | 13 (6.7%) | 32 (10.9%) |
| 20 to 24 Minutes | 17 (8.8%) | 38 (12.9%) |
| 25 to 29 Minutes | 0 (0.0%) | 0 (0.0%) |
| 30 to 34 Minutes | 19 (9.8%) | 4 (1.4%) |
| 35 to 39 Minutes | 6 (3.1%) | 8 (2.7%) |
| 40 to 44 Minutes | 10 (5.1%) | 0 (0.0%) |
| 45 to 59 Minutes | 14 (7.2%) | 8 (2.7%) |
| 60 to 89 Minutes | 18 (9.3%) | 0 (0.0%) |
| 90 or more Minutes | 0 (0.0%) | 0 (0.0%) |
Time of Departure to Work by Sex in San Augustine
The most frequent times of departure to work in San Augustine are 6:00 AM to 6:29 AM (41, 21.1%) for males and 7:30 AM to 7:59 AM (106, 36.0%) for females.
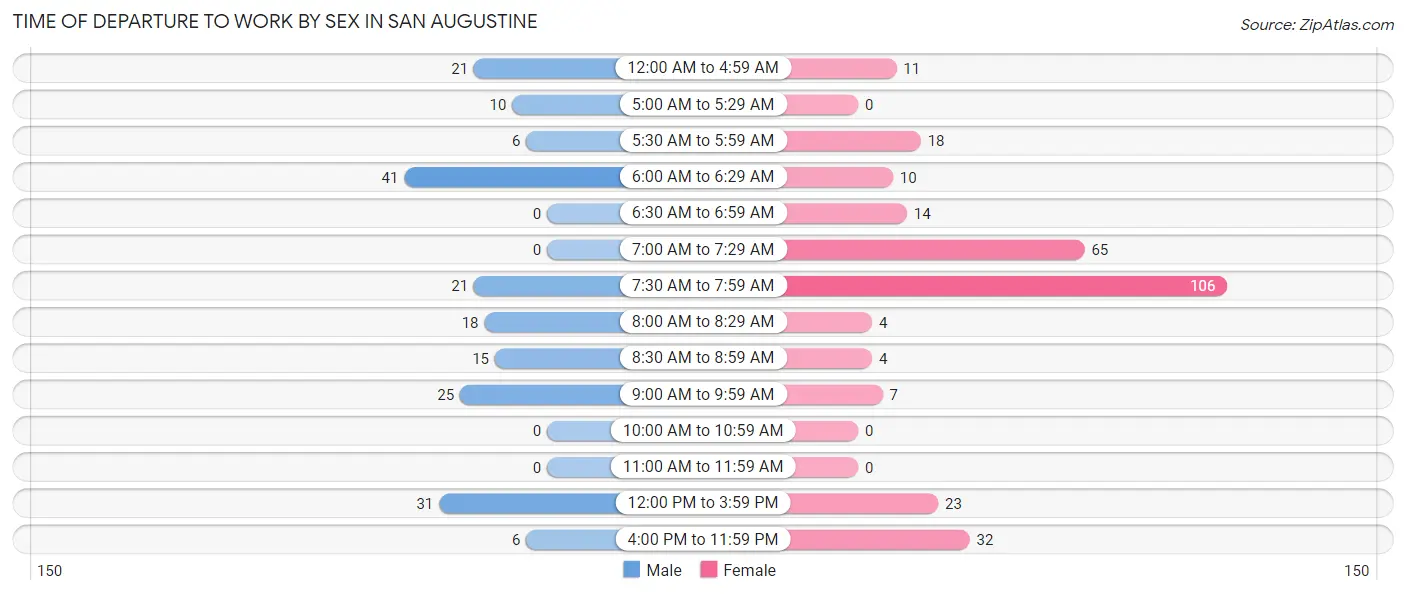
| Time of Departure | Male | Female |
| 12:00 AM to 4:59 AM | 21 (10.8%) | 11 (3.7%) |
| 5:00 AM to 5:29 AM | 10 (5.1%) | 0 (0.0%) |
| 5:30 AM to 5:59 AM | 6 (3.1%) | 18 (6.1%) |
| 6:00 AM to 6:29 AM | 41 (21.1%) | 10 (3.4%) |
| 6:30 AM to 6:59 AM | 0 (0.0%) | 14 (4.8%) |
| 7:00 AM to 7:29 AM | 0 (0.0%) | 65 (22.1%) |
| 7:30 AM to 7:59 AM | 21 (10.8%) | 106 (36.0%) |
| 8:00 AM to 8:29 AM | 18 (9.3%) | 4 (1.4%) |
| 8:30 AM to 8:59 AM | 15 (7.7%) | 4 (1.4%) |
| 9:00 AM to 9:59 AM | 25 (12.9%) | 7 (2.4%) |
| 10:00 AM to 10:59 AM | 0 (0.0%) | 0 (0.0%) |
| 11:00 AM to 11:59 AM | 0 (0.0%) | 0 (0.0%) |
| 12:00 PM to 3:59 PM | 31 (16.0%) | 23 (7.8%) |
| 4:00 PM to 11:59 PM | 6 (3.1%) | 32 (10.9%) |
| Total | 194 (100.0%) | 294 (100.0%) |
Housing Occupancy in San Augustine
Occupancy by Ownership in San Augustine
Of the total 798 dwellings in San Augustine, owner-occupied units account for 347 (43.5%), while renter-occupied units make up 451 (56.5%).
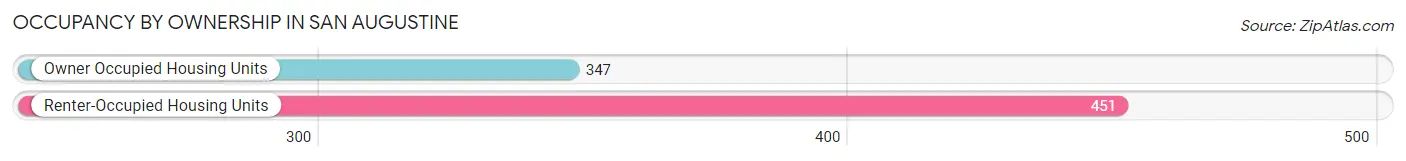
| Occupancy | # Housing Units | % Housing Units |
| Owner Occupied Housing Units | 347 | 43.5% |
| Renter-Occupied Housing Units | 451 | 56.5% |
| Total Occupied Housing Units | 798 | 100.0% |
Occupancy by Household Size in San Augustine
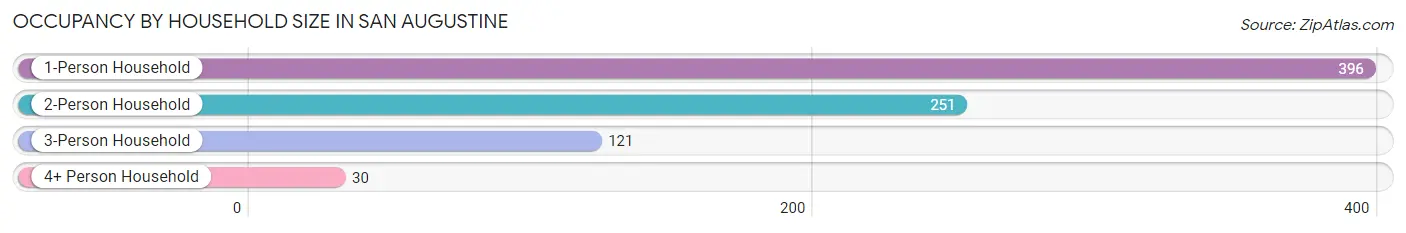
| Household Size | # Housing Units | % Housing Units |
| 1-Person Household | 396 | 49.6% |
| 2-Person Household | 251 | 31.5% |
| 3-Person Household | 121 | 15.2% |
| 4+ Person Household | 30 | 3.8% |
| Total Housing Units | 798 | 100.0% |
Occupancy by Ownership by Household Size in San Augustine
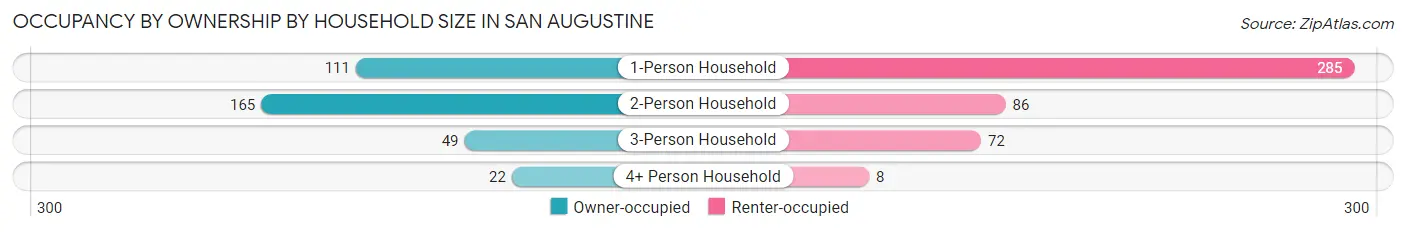
| Household Size | Owner-occupied | Renter-occupied |
| 1-Person Household | 111 (28.0%) | 285 (72.0%) |
| 2-Person Household | 165 (65.7%) | 86 (34.3%) |
| 3-Person Household | 49 (40.5%) | 72 (59.5%) |
| 4+ Person Household | 22 (73.3%) | 8 (26.7%) |
| Total Housing Units | 347 (43.5%) | 451 (56.5%) |
Occupancy by Educational Attainment in San Augustine
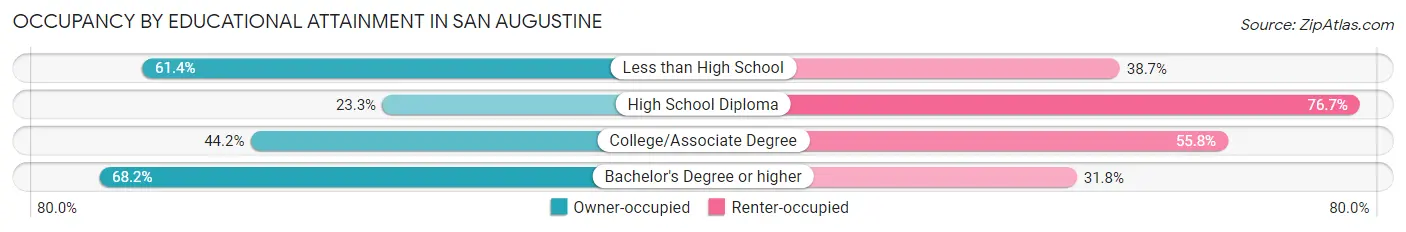
| Household Size | Owner-occupied | Renter-occupied |
| Less than High School | 100 (61.4%) | 63 (38.7%) |
| High School Diploma | 73 (23.3%) | 240 (76.7%) |
| College/Associate Degree | 84 (44.2%) | 106 (55.8%) |
| Bachelor's Degree or higher | 90 (68.2%) | 42 (31.8%) |
Occupancy by Age of Householder in San Augustine
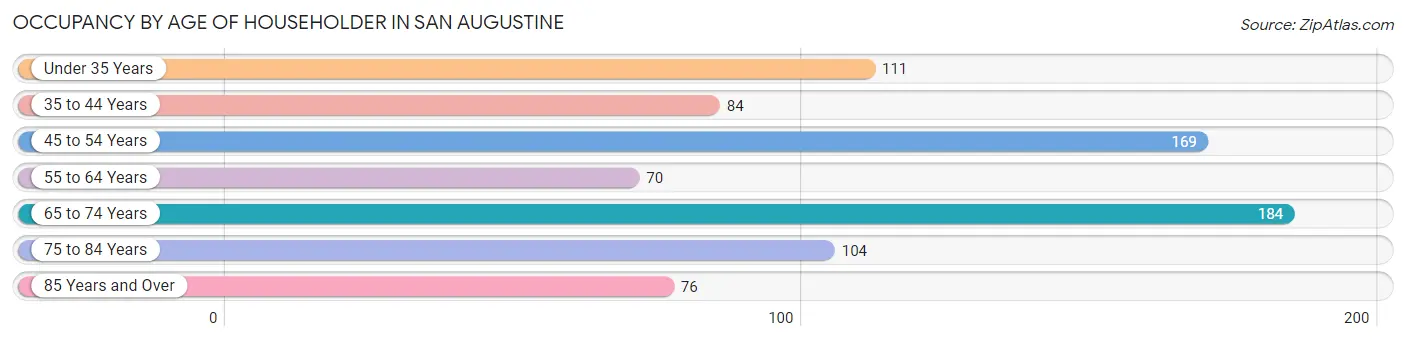
| Age Bracket | # Households | % Households |
| Under 35 Years | 111 | 13.9% |
| 35 to 44 Years | 84 | 10.5% |
| 45 to 54 Years | 169 | 21.2% |
| 55 to 64 Years | 70 | 8.8% |
| 65 to 74 Years | 184 | 23.1% |
| 75 to 84 Years | 104 | 13.0% |
| 85 Years and Over | 76 | 9.5% |
| Total | 798 | 100.0% |
Housing Finances in San Augustine
Median Income by Occupancy in San Augustine
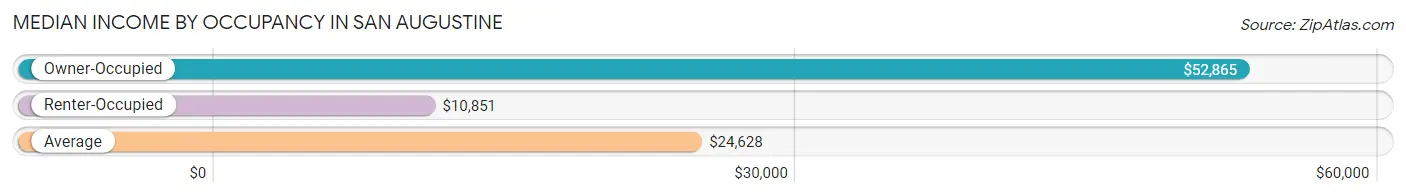
| Occupancy Type | # Households | Median Income |
| Owner-Occupied | 347 (43.5%) | $52,865 |
| Renter-Occupied | 451 (56.5%) | $10,851 |
| Average | 798 (100.0%) | $24,628 |
Occupancy by Householder Income Bracket in San Augustine
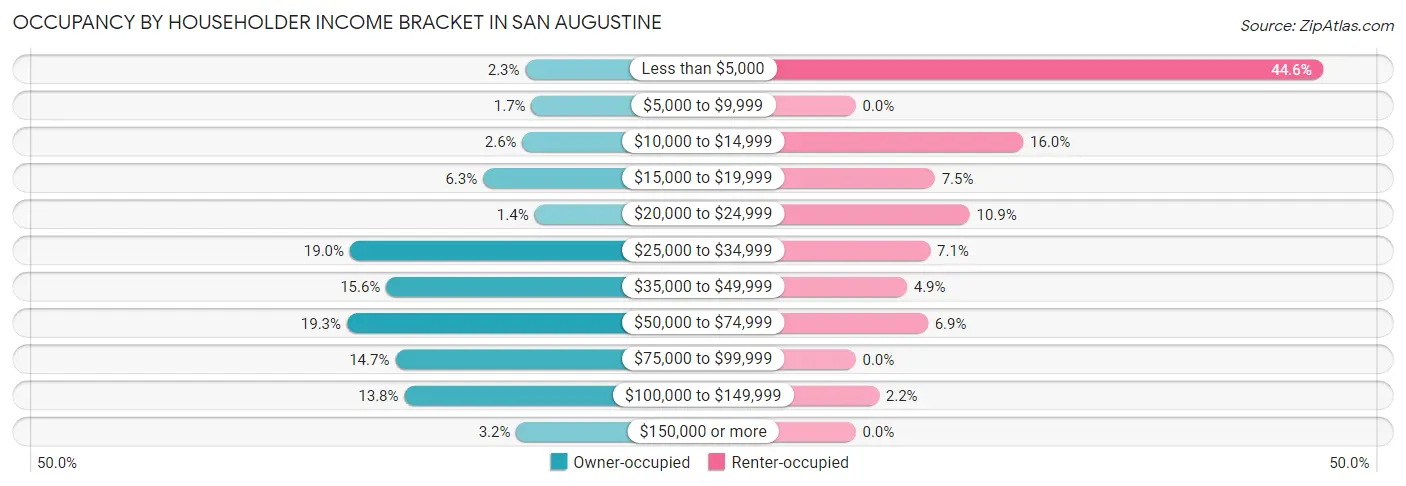
| Income Bracket | Owner-occupied | Renter-occupied |
| Less than $5,000 | 8 (2.3%) | 201 (44.6%) |
| $5,000 to $9,999 | 6 (1.7%) | 0 (0.0%) |
| $10,000 to $14,999 | 9 (2.6%) | 72 (16.0%) |
| $15,000 to $19,999 | 22 (6.3%) | 34 (7.5%) |
| $20,000 to $24,999 | 5 (1.4%) | 49 (10.9%) |
| $25,000 to $34,999 | 66 (19.0%) | 32 (7.1%) |
| $35,000 to $49,999 | 54 (15.6%) | 22 (4.9%) |
| $50,000 to $74,999 | 67 (19.3%) | 31 (6.9%) |
| $75,000 to $99,999 | 51 (14.7%) | 0 (0.0%) |
| $100,000 to $149,999 | 48 (13.8%) | 10 (2.2%) |
| $150,000 or more | 11 (3.2%) | 0 (0.0%) |
| Total | 347 (100.0%) | 451 (100.0%) |
Monthly Housing Cost Tiers in San Augustine
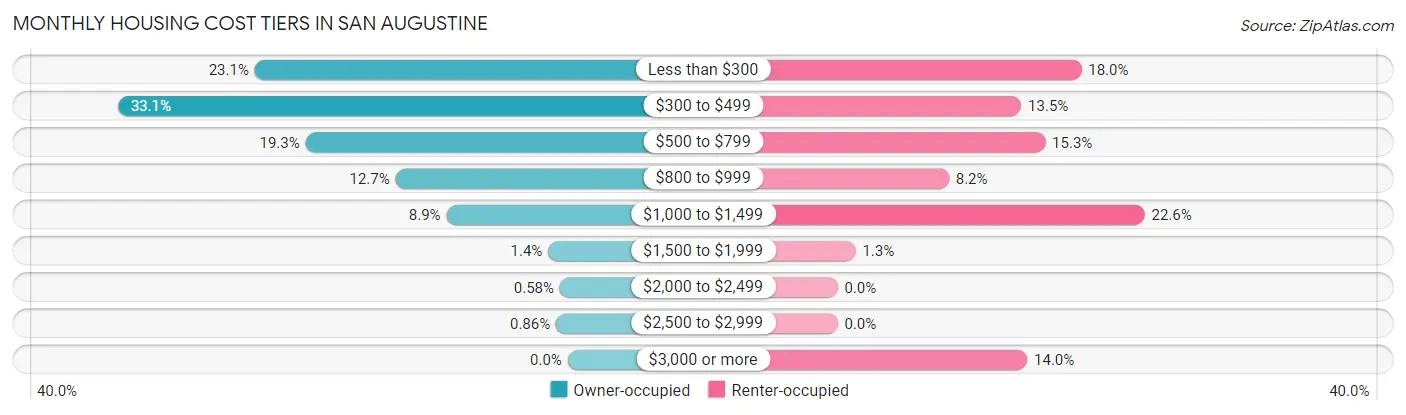
| Monthly Cost | Owner-occupied | Renter-occupied |
| Less than $300 | 80 (23.1%) | 81 (18.0%) |
| $300 to $499 | 115 (33.1%) | 61 (13.5%) |
| $500 to $799 | 67 (19.3%) | 69 (15.3%) |
| $800 to $999 | 44 (12.7%) | 37 (8.2%) |
| $1,000 to $1,499 | 31 (8.9%) | 102 (22.6%) |
| $1,500 to $1,999 | 5 (1.4%) | 6 (1.3%) |
| $2,000 to $2,499 | 2 (0.6%) | 0 (0.0%) |
| $2,500 to $2,999 | 3 (0.9%) | 0 (0.0%) |
| $3,000 or more | 0 (0.0%) | 63 (14.0%) |
| Total | 347 (100.0%) | 451 (100.0%) |
Physical Housing Characteristics in San Augustine
Housing Structures in San Augustine
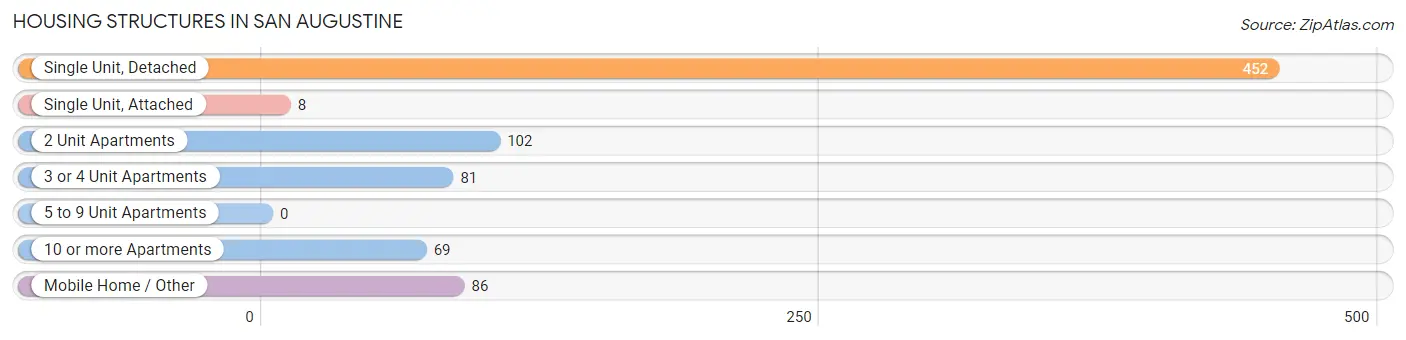
| Structure Type | # Housing Units | % Housing Units |
| Single Unit, Detached | 452 | 56.6% |
| Single Unit, Attached | 8 | 1.0% |
| 2 Unit Apartments | 102 | 12.8% |
| 3 or 4 Unit Apartments | 81 | 10.2% |
| 5 to 9 Unit Apartments | 0 | 0.0% |
| 10 or more Apartments | 69 | 8.6% |
| Mobile Home / Other | 86 | 10.8% |
| Total | 798 | 100.0% |
Housing Structures by Occupancy in San Augustine
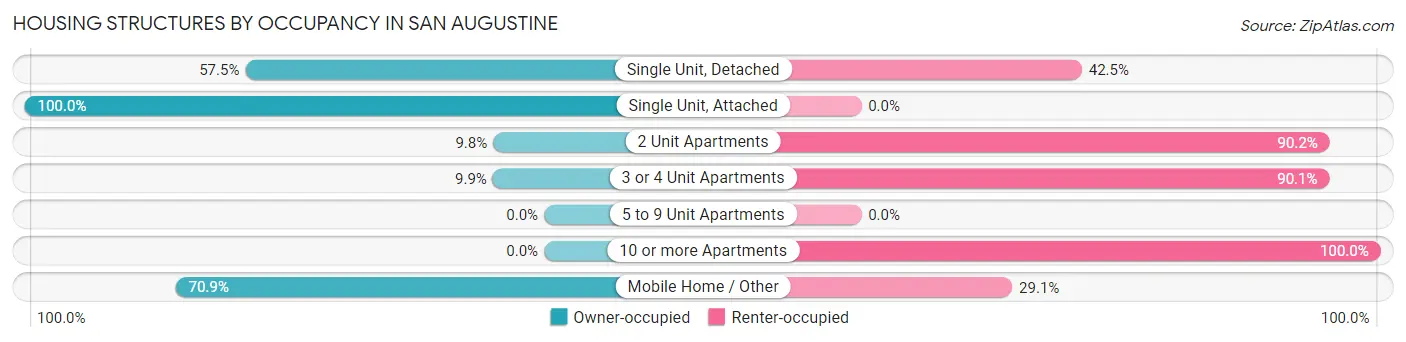
| Structure Type | Owner-occupied | Renter-occupied |
| Single Unit, Detached | 260 (57.5%) | 192 (42.5%) |
| Single Unit, Attached | 8 (100.0%) | 0 (0.0%) |
| 2 Unit Apartments | 10 (9.8%) | 92 (90.2%) |
| 3 or 4 Unit Apartments | 8 (9.9%) | 73 (90.1%) |
| 5 to 9 Unit Apartments | 0 (0.0%) | 0 (0.0%) |
| 10 or more Apartments | 0 (0.0%) | 69 (100.0%) |
| Mobile Home / Other | 61 (70.9%) | 25 (29.1%) |
| Total | 347 (43.5%) | 451 (56.5%) |
Housing Structures by Number of Rooms in San Augustine
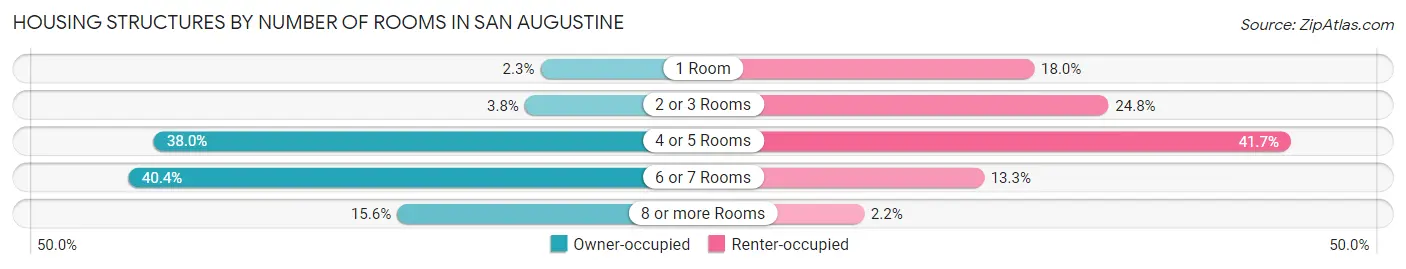
| Number of Rooms | Owner-occupied | Renter-occupied |
| 1 Room | 8 (2.3%) | 81 (18.0%) |
| 2 or 3 Rooms | 13 (3.7%) | 112 (24.8%) |
| 4 or 5 Rooms | 132 (38.0%) | 188 (41.7%) |
| 6 or 7 Rooms | 140 (40.4%) | 60 (13.3%) |
| 8 or more Rooms | 54 (15.6%) | 10 (2.2%) |
| Total | 347 (100.0%) | 451 (100.0%) |
Housing Structure by Heating Type in San Augustine
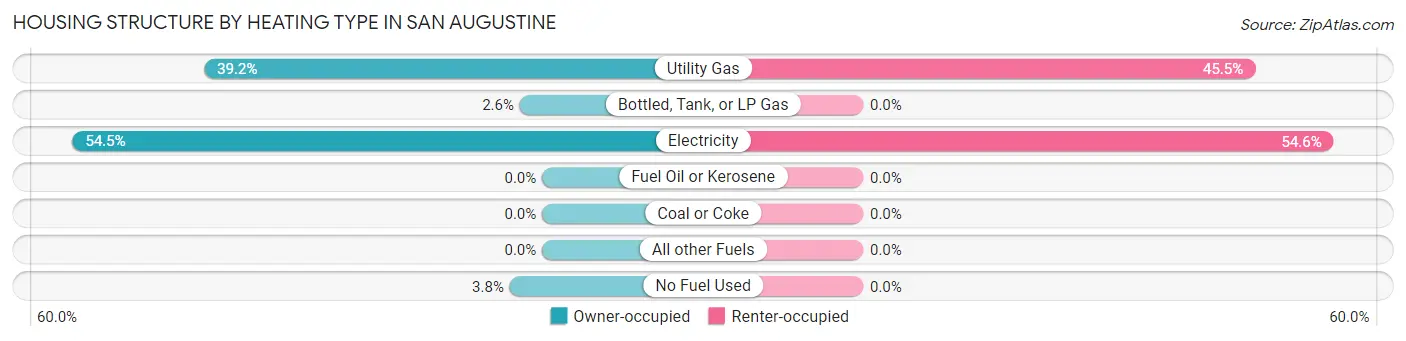
| Heating Type | Owner-occupied | Renter-occupied |
| Utility Gas | 136 (39.2%) | 205 (45.5%) |
| Bottled, Tank, or LP Gas | 9 (2.6%) | 0 (0.0%) |
| Electricity | 189 (54.5%) | 246 (54.5%) |
| Fuel Oil or Kerosene | 0 (0.0%) | 0 (0.0%) |
| Coal or Coke | 0 (0.0%) | 0 (0.0%) |
| All other Fuels | 0 (0.0%) | 0 (0.0%) |
| No Fuel Used | 13 (3.7%) | 0 (0.0%) |
| Total | 347 (100.0%) | 451 (100.0%) |
Household Vehicle Usage in San Augustine
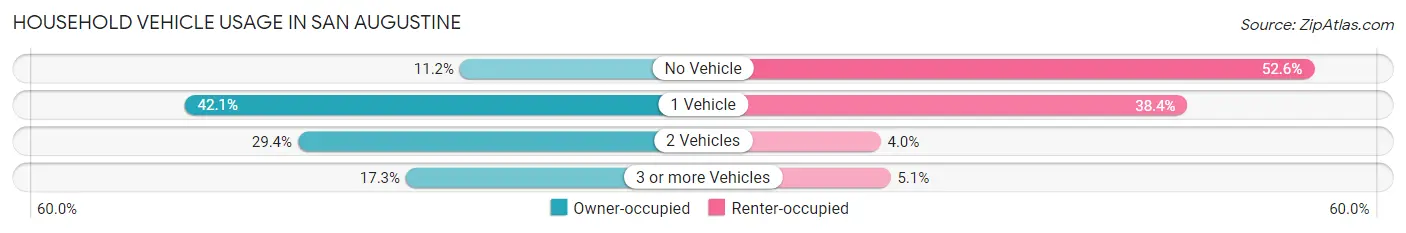
| Vehicles per Household | Owner-occupied | Renter-occupied |
| No Vehicle | 39 (11.2%) | 237 (52.5%) |
| 1 Vehicle | 146 (42.1%) | 173 (38.4%) |
| 2 Vehicles | 102 (29.4%) | 18 (4.0%) |
| 3 or more Vehicles | 60 (17.3%) | 23 (5.1%) |
| Total | 347 (100.0%) | 451 (100.0%) |
Real Estate & Mortgages in San Augustine
Real Estate and Mortgage Overview in San Augustine
| Characteristic | Without Mortgage | With Mortgage |
| Housing Units | 286 | 61 |
| Median Property Value | $69,200 | $0 |
| Median Household Income | $45,208 | $3 |
| Monthly Housing Costs | $449 | $0 |
| Real Estate Taxes | $741 | $6 |
Property Value by Mortgage Status in San Augustine
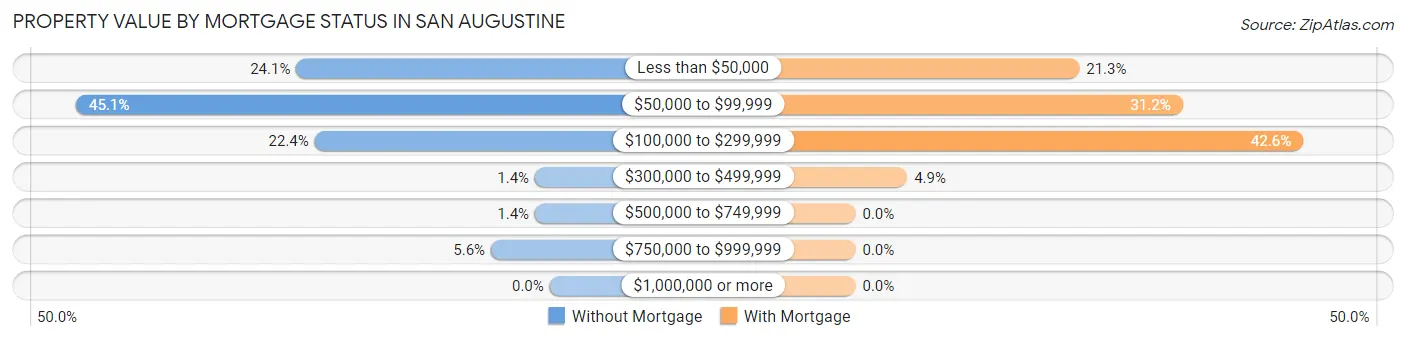
| Property Value | Without Mortgage | With Mortgage |
| Less than $50,000 | 69 (24.1%) | 13 (21.3%) |
| $50,000 to $99,999 | 129 (45.1%) | 19 (31.1%) |
| $100,000 to $299,999 | 64 (22.4%) | 26 (42.6%) |
| $300,000 to $499,999 | 4 (1.4%) | 3 (4.9%) |
| $500,000 to $749,999 | 4 (1.4%) | 0 (0.0%) |
| $750,000 to $999,999 | 16 (5.6%) | 0 (0.0%) |
| $1,000,000 or more | 0 (0.0%) | 0 (0.0%) |
| Total | 286 (100.0%) | 61 (100.0%) |
Household Income by Mortgage Status in San Augustine
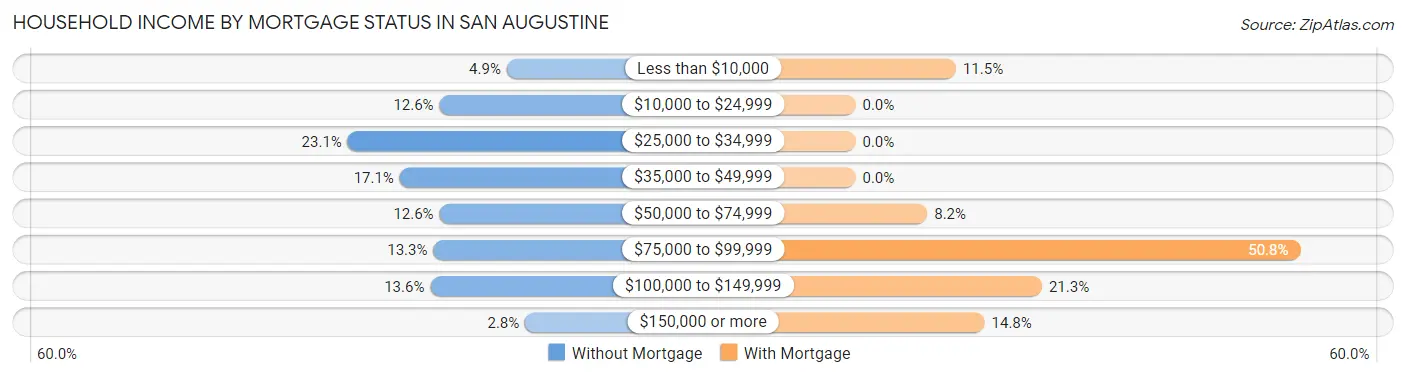
| Household Income | Without Mortgage | With Mortgage |
| Less than $10,000 | 14 (4.9%) | 7 (11.5%) |
| $10,000 to $24,999 | 36 (12.6%) | 0 (0.0%) |
| $25,000 to $34,999 | 66 (23.1%) | 0 (0.0%) |
| $35,000 to $49,999 | 49 (17.1%) | 0 (0.0%) |
| $50,000 to $74,999 | 36 (12.6%) | 5 (8.2%) |
| $75,000 to $99,999 | 38 (13.3%) | 31 (50.8%) |
| $100,000 to $149,999 | 39 (13.6%) | 13 (21.3%) |
| $150,000 or more | 8 (2.8%) | 9 (14.7%) |
| Total | 286 (100.0%) | 61 (100.0%) |
Property Value to Household Income Ratio in San Augustine
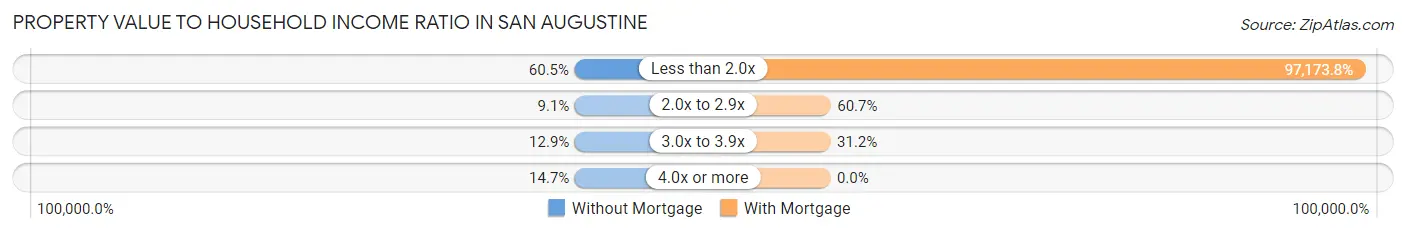
| Value-to-Income Ratio | Without Mortgage | With Mortgage |
| Less than 2.0x | 173 (60.5%) | 59,276 (97,173.8%) |
| 2.0x to 2.9x | 26 (9.1%) | 37 (60.7%) |
| 3.0x to 3.9x | 37 (12.9%) | 19 (31.1%) |
| 4.0x or more | 42 (14.7%) | 0 (0.0%) |
| Total | 286 (100.0%) | 61 (100.0%) |
Real Estate Taxes by Mortgage Status in San Augustine
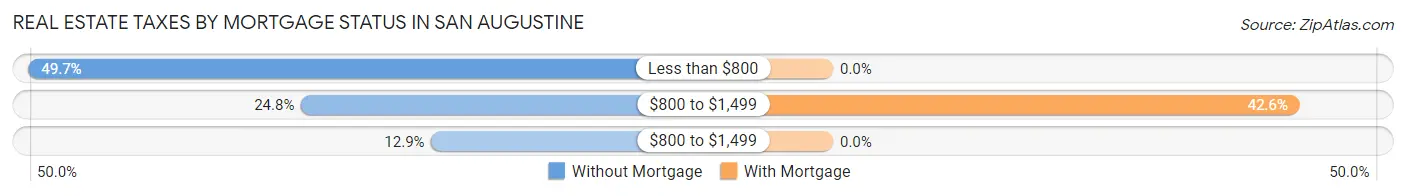
| Property Taxes | Without Mortgage | With Mortgage |
| Less than $800 | 142 (49.6%) | 0 (0.0%) |
| $800 to $1,499 | 71 (24.8%) | 26 (42.6%) |
| $800 to $1,499 | 37 (12.9%) | 0 (0.0%) |
| Total | 286 (100.0%) | 61 (100.0%) |
Health & Disability in San Augustine
Health Insurance Coverage by Age in San Augustine
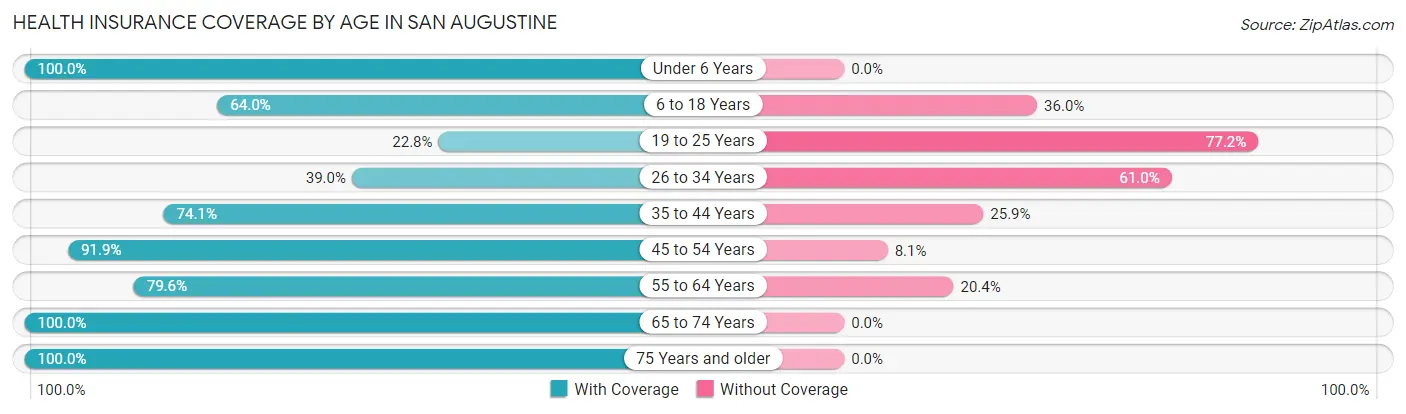
| Age Bracket | With Coverage | Without Coverage |
| Under 6 Years | 36 (100.0%) | 0 (0.0%) |
| 6 to 18 Years | 203 (64.0%) | 114 (36.0%) |
| 19 to 25 Years | 37 (22.8%) | 125 (77.2%) |
| 26 to 34 Years | 46 (39.0%) | 72 (61.0%) |
| 35 to 44 Years | 80 (74.1%) | 28 (25.9%) |
| 45 to 54 Years | 295 (91.9%) | 26 (8.1%) |
| 55 to 64 Years | 129 (79.6%) | 33 (20.4%) |
| 65 to 74 Years | 235 (100.0%) | 0 (0.0%) |
| 75 Years and older | 241 (100.0%) | 0 (0.0%) |
| Total | 1,302 (76.6%) | 398 (23.4%) |
Health Insurance Coverage by Citizenship Status in San Augustine
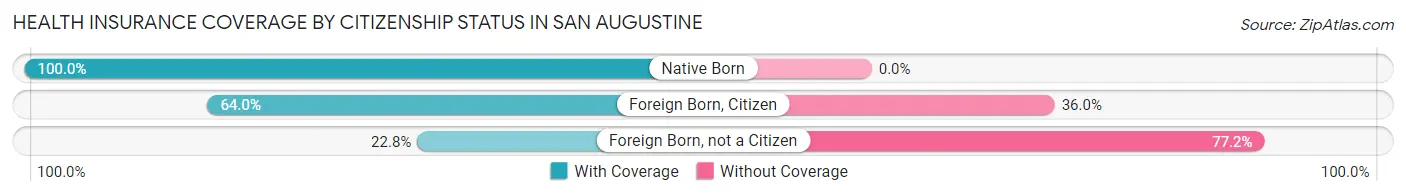
| Citizenship Status | With Coverage | Without Coverage |
| Native Born | 36 (100.0%) | 0 (0.0%) |
| Foreign Born, Citizen | 203 (64.0%) | 114 (36.0%) |
| Foreign Born, not a Citizen | 37 (22.8%) | 125 (77.2%) |
Health Insurance Coverage by Household Income in San Augustine
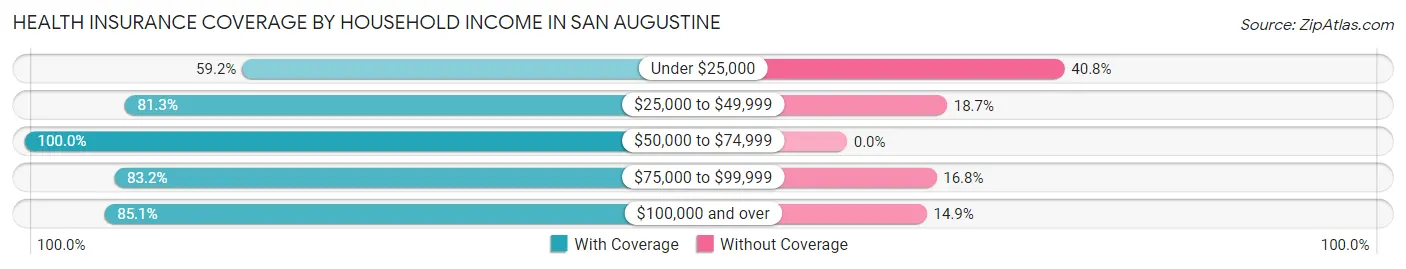
| Household Income | With Coverage | Without Coverage |
| Under $25,000 | 404 (59.2%) | 278 (40.8%) |
| $25,000 to $49,999 | 295 (81.3%) | 68 (18.7%) |
| $50,000 to $74,999 | 304 (100.0%) | 0 (0.0%) |
| $75,000 to $99,999 | 129 (83.2%) | 26 (16.8%) |
| $100,000 and over | 148 (85.1%) | 26 (14.9%) |
Public vs Private Health Insurance Coverage by Age in San Augustine
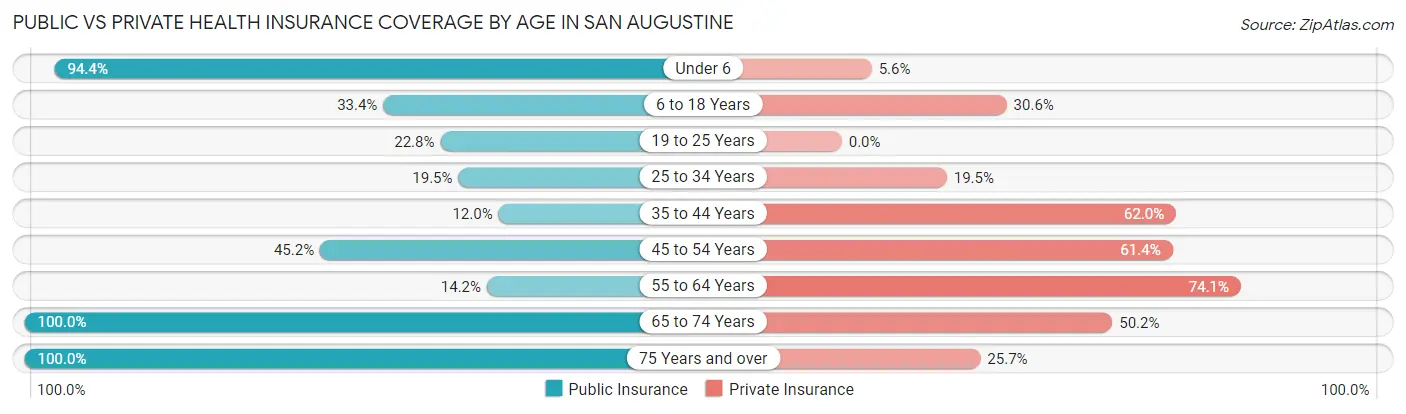
| Age Bracket | Public Insurance | Private Insurance |
| Under 6 | 34 (94.4%) | 2 (5.6%) |
| 6 to 18 Years | 106 (33.4%) | 97 (30.6%) |
| 19 to 25 Years | 37 (22.8%) | 0 (0.0%) |
| 25 to 34 Years | 23 (19.5%) | 23 (19.5%) |
| 35 to 44 Years | 13 (12.0%) | 67 (62.0%) |
| 45 to 54 Years | 145 (45.2%) | 197 (61.4%) |
| 55 to 64 Years | 23 (14.2%) | 120 (74.1%) |
| 65 to 74 Years | 235 (100.0%) | 118 (50.2%) |
| 75 Years and over | 241 (100.0%) | 62 (25.7%) |
| Total | 857 (50.4%) | 686 (40.4%) |
Disability Status by Sex by Age in San Augustine
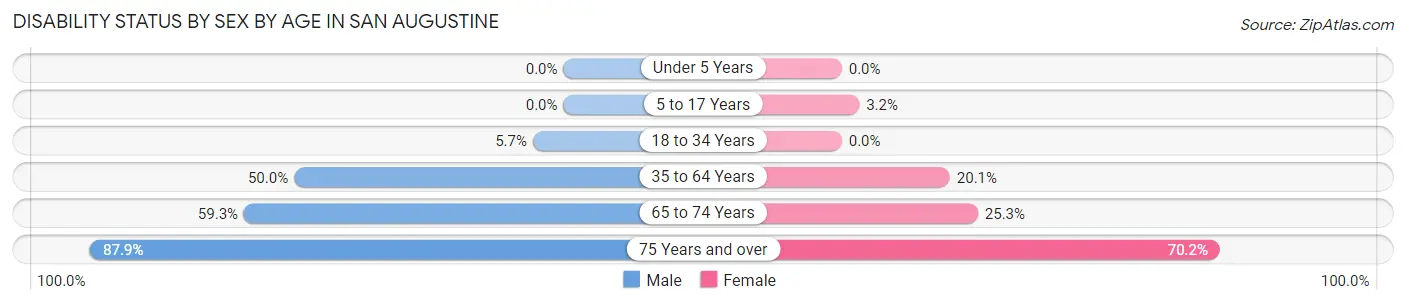
| Age Bracket | Male | Female |
| Under 5 Years | 0 (0.0%) | 0 (0.0%) |
| 5 to 17 Years | 0 (0.0%) | 5 (3.2%) |
| 18 to 34 Years | 11 (5.7%) | 0 (0.0%) |
| 35 to 64 Years | 116 (50.0%) | 72 (20.1%) |
| 65 to 74 Years | 83 (59.3%) | 24 (25.3%) |
| 75 Years and over | 94 (87.8%) | 94 (70.2%) |
Disability Class by Sex by Age in San Augustine
Disability Class: Hearing Difficulty
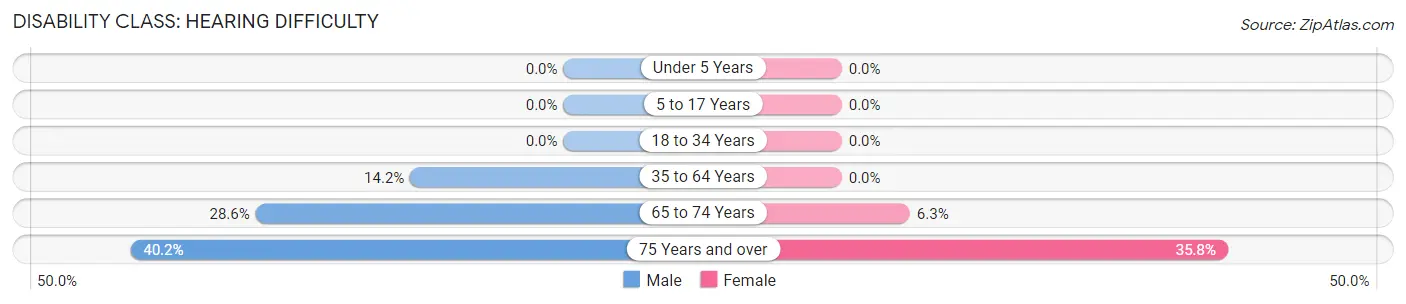
| Age Bracket | Male | Female |
| Under 5 Years | 0 (0.0%) | 0 (0.0%) |
| 5 to 17 Years | 0 (0.0%) | 0 (0.0%) |
| 18 to 34 Years | 0 (0.0%) | 0 (0.0%) |
| 35 to 64 Years | 33 (14.2%) | 0 (0.0%) |
| 65 to 74 Years | 40 (28.6%) | 6 (6.3%) |
| 75 Years and over | 43 (40.2%) | 48 (35.8%) |
Disability Class: Vision Difficulty
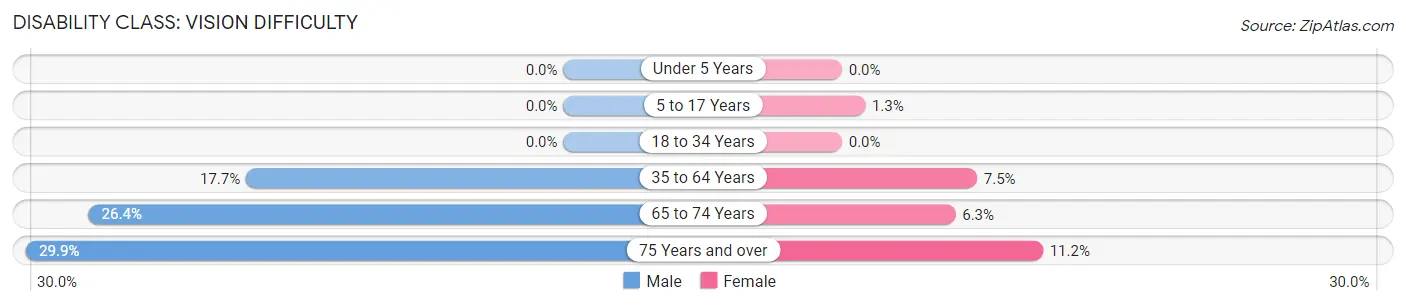
| Age Bracket | Male | Female |
| Under 5 Years | 0 (0.0%) | 0 (0.0%) |
| 5 to 17 Years | 0 (0.0%) | 2 (1.3%) |
| 18 to 34 Years | 0 (0.0%) | 0 (0.0%) |
| 35 to 64 Years | 41 (17.7%) | 27 (7.5%) |
| 65 to 74 Years | 37 (26.4%) | 6 (6.3%) |
| 75 Years and over | 32 (29.9%) | 15 (11.2%) |
Disability Class: Cognitive Difficulty
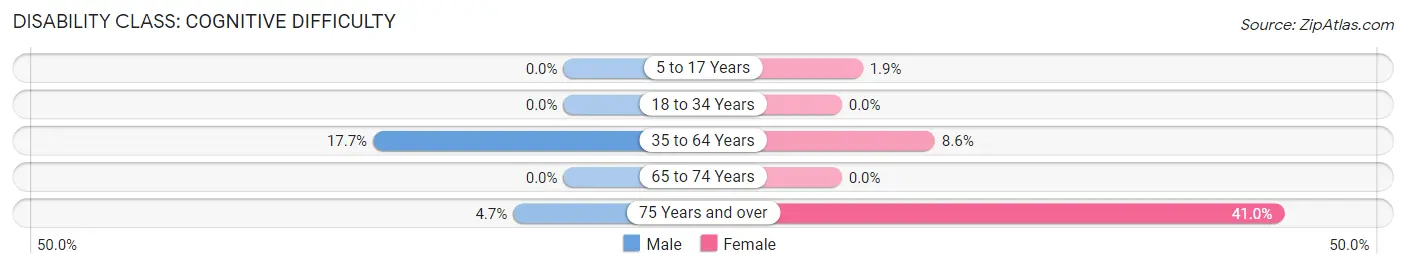
| Age Bracket | Male | Female |
| 5 to 17 Years | 0 (0.0%) | 3 (1.9%) |
| 18 to 34 Years | 0 (0.0%) | 0 (0.0%) |
| 35 to 64 Years | 41 (17.7%) | 31 (8.6%) |
| 65 to 74 Years | 0 (0.0%) | 0 (0.0%) |
| 75 Years and over | 5 (4.7%) | 55 (41.0%) |
Disability Class: Ambulatory Difficulty
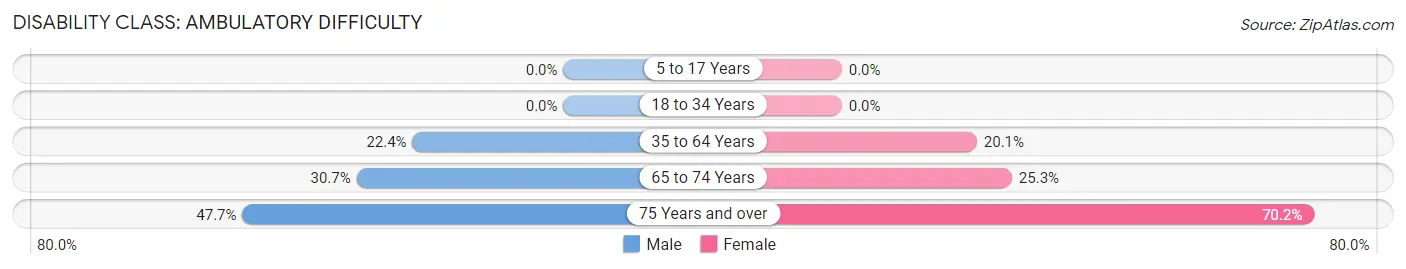
| Age Bracket | Male | Female |
| 5 to 17 Years | 0 (0.0%) | 0 (0.0%) |
| 18 to 34 Years | 0 (0.0%) | 0 (0.0%) |
| 35 to 64 Years | 52 (22.4%) | 72 (20.1%) |
| 65 to 74 Years | 43 (30.7%) | 24 (25.3%) |
| 75 Years and over | 51 (47.7%) | 94 (70.2%) |
Disability Class: Self-Care Difficulty
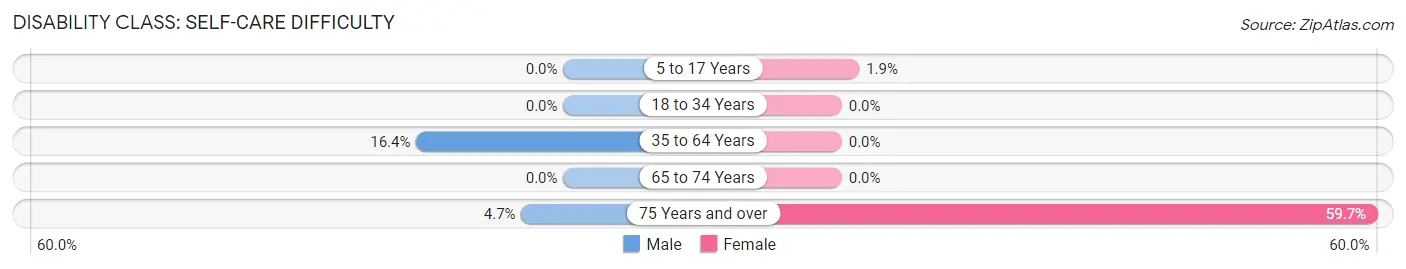
| Age Bracket | Male | Female |
| 5 to 17 Years | 0 (0.0%) | 3 (1.9%) |
| 18 to 34 Years | 0 (0.0%) | 0 (0.0%) |
| 35 to 64 Years | 38 (16.4%) | 0 (0.0%) |
| 65 to 74 Years | 0 (0.0%) | 0 (0.0%) |
| 75 Years and over | 5 (4.7%) | 80 (59.7%) |
Technology Access in San Augustine
Computing Device Access in San Augustine
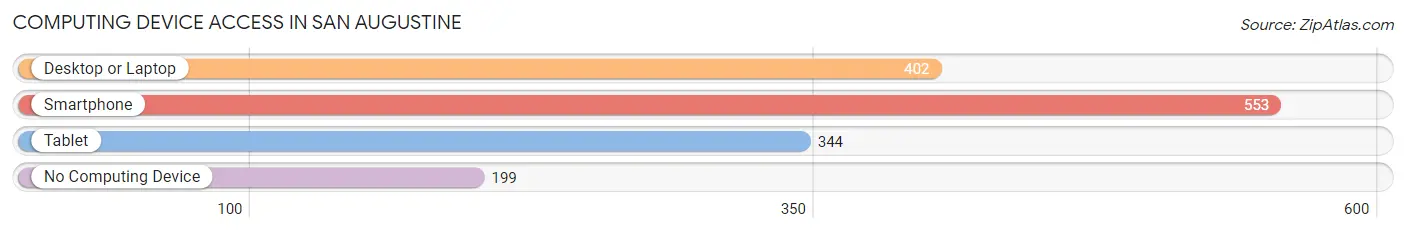
| Device Type | # Households | % Households |
| Desktop or Laptop | 402 | 50.4% |
| Smartphone | 553 | 69.3% |
| Tablet | 344 | 43.1% |
| No Computing Device | 199 | 24.9% |
| Total | 798 | 100.0% |
Internet Access in San Augustine
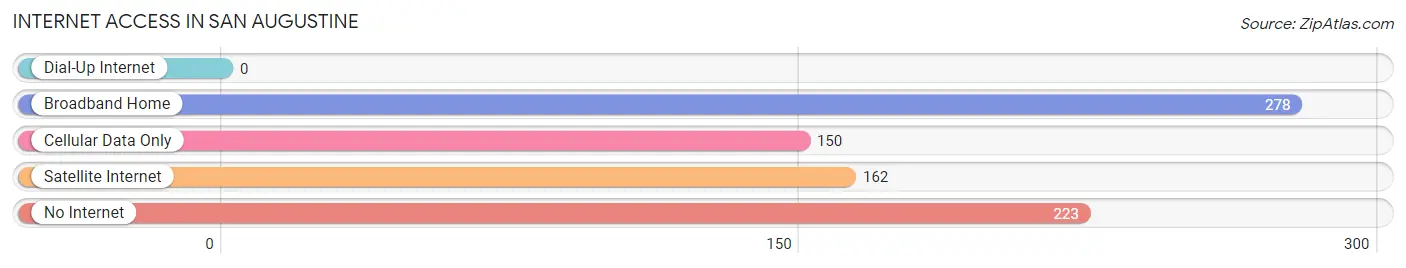
| Internet Type | # Households | % Households |
| Dial-Up Internet | 0 | 0.0% |
| Broadband Home | 278 | 34.8% |
| Cellular Data Only | 150 | 18.8% |
| Satellite Internet | 162 | 20.3% |
| No Internet | 223 | 27.9% |
| Total | 798 | 100.0% |
San Augustine Summary
History
San Augustine is a small town located in the east Texas Piney Woods region. It is the county seat of San Augustine County and is situated on the banks of the Angelina River. The town was founded in 1832 and was named after the Spanish mission of San Augustine de Ahumada, which was located nearby. The town was an important trading post for the area and was a major stop on the El Camino Real de los Tejas, a Spanish colonial road that connected the Spanish missions in East Texas.
The town was an important center of commerce and culture in the region. It was the site of the first newspaper in East Texas, the San Augustine Red-Lander, which was established in 1837. The town was also the site of the first public school in East Texas, the San Augustine Academy, which was established in 1845.
During the Civil War, San Augustine was the site of several battles between Confederate and Union forces. The town was occupied by Union forces in 1864 and was the site of the Battle of San Augustine in 1865. After the war, the town was rebuilt and continued to be an important center of commerce and culture in the region.
Geography
San Augustine is located in the east Texas Piney Woods region, about 100 miles north of Houston. The town is situated on the banks of the Angelina River and is surrounded by rolling hills and forests. The climate is humid subtropical, with hot summers and mild winters.
The town covers an area of 4.2 square miles and has a population of 2,072, as of the 2010 census. The town is served by US Highway 96 and State Highway 21.
Economy
The economy of San Augustine is largely based on agriculture and timber. The town is home to several timber companies, including Weyerhaeuser and International Paper. The town is also home to several small businesses, including restaurants, retail stores, and service providers.
The town is also home to several educational institutions, including San Augustine High School, San Augustine Junior College, and the San Augustine County Library.
Demographics
As of the 2010 census, the population of San Augustine was 2,072. The racial makeup of the town was 79.3% White, 17.2% African American, 0.7% Native American, 0.3% Asian, 0.1% Pacific Islander, and 2.4% from other races. Hispanic or Latino of any race were 4.2% of the population.
The median household income in San Augustine was $30,938, and the median family income was $37,813. The per capita income was $15,945. About 18.2% of the population was below the poverty line.
Common Questions
What is Per Capita Income in San Augustine?
Per Capita income in San Augustine is $20,119.
What is the Median Family Income in San Augustine?
Median Family Income in San Augustine is $42,935.
What is the Median Household income in San Augustine?
Median Household Income in San Augustine is $24,628.
What is Income or Wage Gap in San Augustine?
Income or Wage Gap in San Augustine is 55.1%.
Women in San Augustine earn 44.9 cents for every dollar earned by a man.
What is Inequality or Gini Index in San Augustine?
Inequality or Gini Index in San Augustine is 0.58.
What is the Total Population of San Augustine?
Total Population of San Augustine is 1,845.
What is the Total Male Population of San Augustine?
Total Male Population of San Augustine is 892.
What is the Total Female Population of San Augustine?
Total Female Population of San Augustine is 953.
What is the Ratio of Males per 100 Females in San Augustine?
There are 93.60 Males per 100 Females in San Augustine.
What is the Ratio of Females per 100 Males in San Augustine?
There are 106.84 Females per 100 Males in San Augustine.
What is the Median Population Age in San Augustine?
Median Population Age in San Augustine is 48.9 Years.
What is the Average Family Size in San Augustine
Average Family Size in San Augustine is 3.1 People.
What is the Average Household Size in San Augustine
Average Household Size in San Augustine is 2.1 People.
How Large is the Labor Force in San Augustine?
There are 638 People in the Labor Forcein in San Augustine.
What is the Percentage of People in the Labor Force in San Augustine?
41.8% of People are in the Labor Force in San Augustine.
What is the Unemployment Rate in San Augustine?
Unemployment Rate in San Augustine is 19.7%.