Zip Codes with the Highest Percentage of Households with Income Below $10,000 in Bedford, TX
RELATED REPORTS & OPTIONS
Household Income | $0-10k
Bedford
Compare Zip Codes
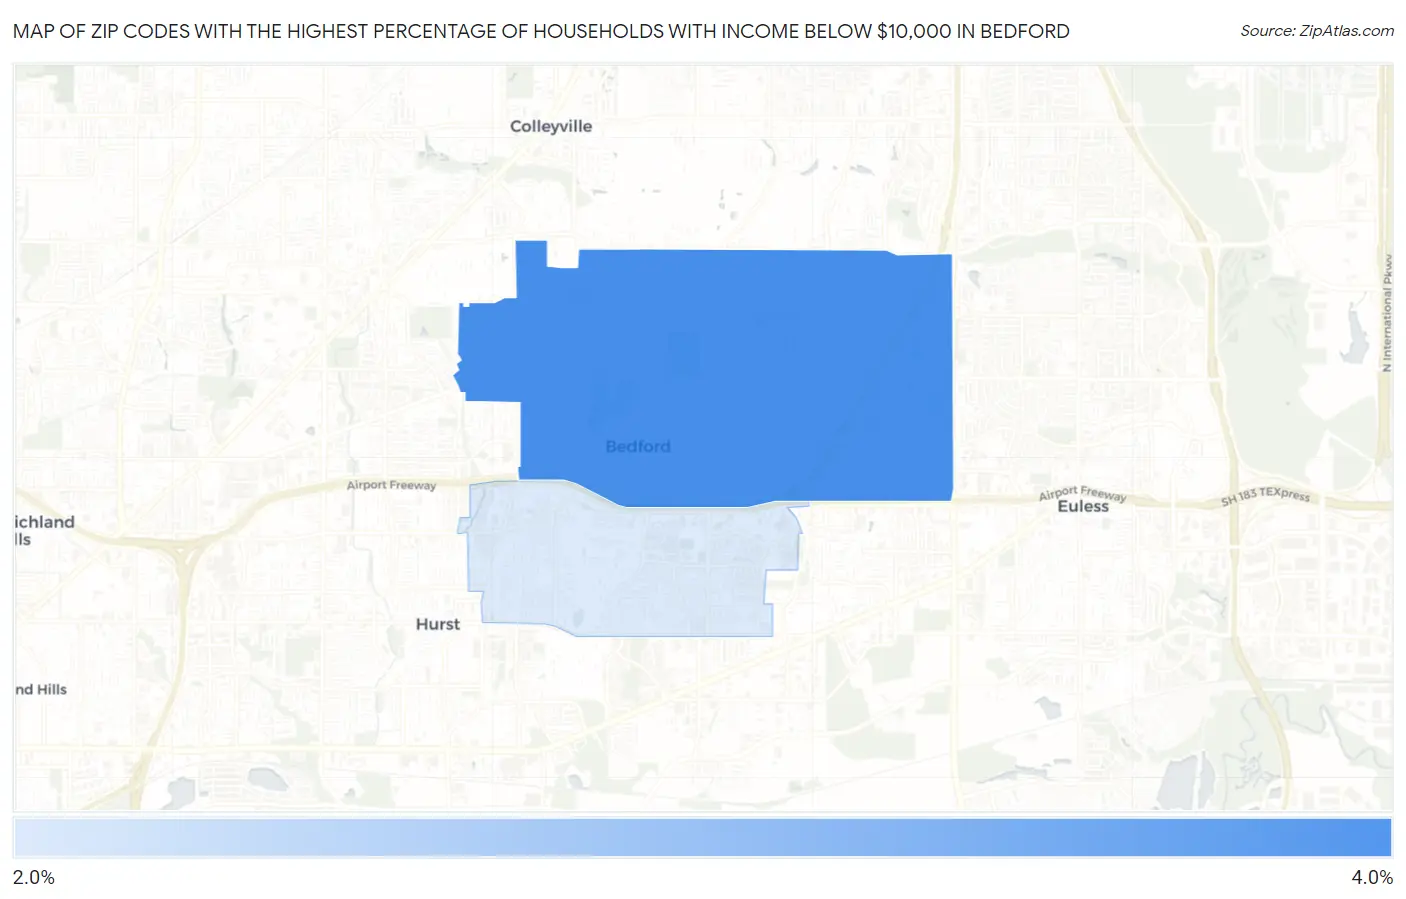
Map of Zip Codes with the Highest Percentage of Households with Income Below $10,000 in Bedford
2.7%
3.7%
Zip Codes with the Highest Percentage of Households with Income Below $10,000 in Bedford, TX
| Zip Code | Households with Income < $10k | vs State | vs National | |
| 1. | 76021 | 3.7% | 5.1%(-1.40)#1,050 | 4.9%(-1.20)#16,412 |
| 2. | 76022 | 2.7% | 5.1%(-2.40)#1,285 | 4.9%(-2.20)#20,775 |
1
Common Questions
What are the Top Zip Codes with the Highest Percentage of Households with Income Below $10,000 in Bedford, TX?
Top Zip Codes with the Highest Percentage of Households with Income Below $10,000 in Bedford, TX are:
What zip code has the Highest Percentage of Households with Income Below $10,000 in Bedford, TX?
76021 has the Highest Percentage of Households with Income Below $10,000 in Bedford, TX with 3.7%.
What is the Percentage of Households with Income Below $10,000 in Bedford, TX?
Percentage of Households with Income Below $10,000 in Bedford is 3.4%.
What is the Percentage of Households with Income Below $10,000 in Texas?
Percentage of Households with Income Below $10,000 in Texas is 5.1%.
What is the Percentage of Households with Income Below $10,000 in the United States?
Percentage of Households with Income Below $10,000 in the United States is 4.9%.