Zip Codes with the Highest Percentage of Households with Income Below $10,000 in Fort Worth, TX
RELATED REPORTS & OPTIONS
Household Income | $0-10k
Fort Worth
Compare Zip Codes
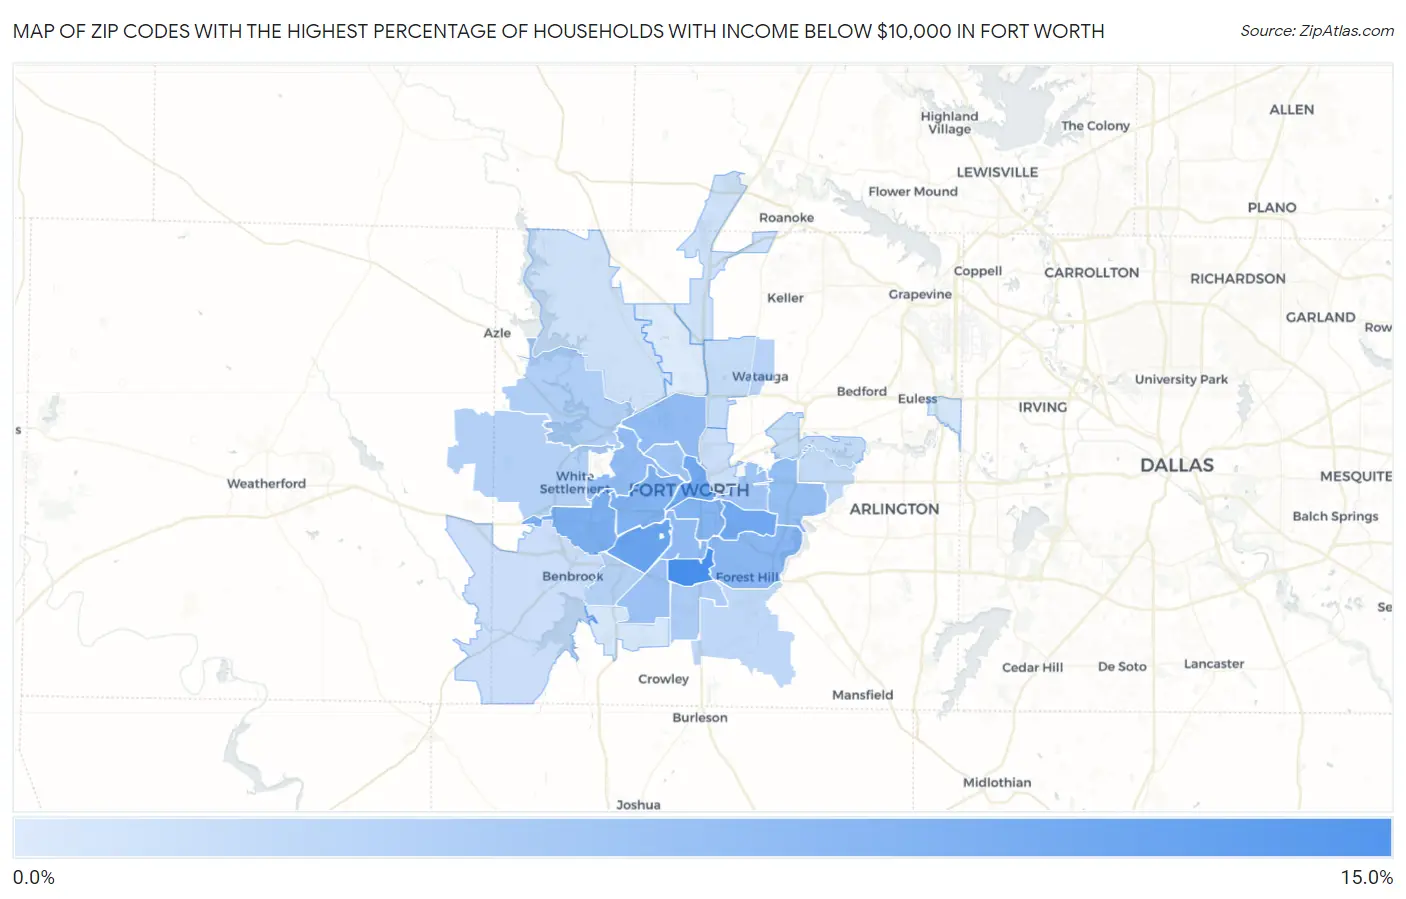
Map of Zip Codes with the Highest Percentage of Households with Income Below $10,000 in Fort Worth
1.0%
11.7%
Zip Codes with the Highest Percentage of Households with Income Below $10,000 in Fort Worth, TX
| Zip Code | Households with Income < $10k | vs State | vs National | |
| 1. | 76115 | 11.7% | 5.1%(+6.60)#139 | 4.9%(+6.80)#2,584 |
| 2. | 76109 | 9.1% | 5.1%(+4.00)#278 | 4.9%(+4.20)#4,305 |
| 3. | 76105 | 8.6% | 5.1%(+3.50)#311 | 4.9%(+3.70)#4,833 |
| 4. | 76102 | 8.6% | 5.1%(+3.50)#313 | 4.9%(+3.70)#4,845 |
| 5. | 76116 | 7.8% | 5.1%(+2.70)#389 | 4.9%(+2.90)#5,795 |
| 6. | 76107 | 7.4% | 5.1%(+2.30)#424 | 4.9%(+2.50)#6,348 |
| 7. | 76104 | 7.3% | 5.1%(+2.20)#442 | 4.9%(+2.40)#6,504 |
| 8. | 76119 | 6.8% | 5.1%(+1.70)#496 | 4.9%(+1.90)#7,292 |
| 9. | 76106 | 6.3% | 5.1%(+1.20)#572 | 4.9%(+1.40)#8,312 |
| 10. | 76110 | 6.3% | 5.1%(+1.20)#574 | 4.9%(+1.40)#8,323 |
| 11. | 76114 | 6.3% | 5.1%(+1.20)#576 | 4.9%(+1.40)#8,336 |
| 12. | 76112 | 6.0% | 5.1%(+0.900)#606 | 4.9%(+1.10)#8,967 |
| 13. | 76133 | 5.5% | 5.1%(+0.400)#685 | 4.9%(+0.600)#10,188 |
| 14. | 76103 | 5.2% | 5.1%(+0.100)#738 | 4.9%(+0.300)#11,116 |
| 15. | 76164 | 5.1% | 5.1%(=0.000)#762 | 4.9%(+0.200)#11,429 |
| 16. | 76134 | 4.4% | 5.1%(-0.700)#889 | 4.9%(-0.500)#13,706 |
| 17. | 76135 | 4.0% | 5.1%(-1.10)#985 | 4.9%(-0.900)#15,301 |
| 18. | 76108 | 3.9% | 5.1%(-1.20)#997 | 4.9%(-1.00)#15,597 |
| 19. | 76132 | 3.7% | 5.1%(-1.40)#1,054 | 4.9%(-1.20)#16,435 |
| 20. | 76148 | 3.6% | 5.1%(-1.50)#1,082 | 4.9%(-1.30)#16,873 |
| 21. | 76140 | 3.1% | 5.1%(-2.00)#1,181 | 4.9%(-1.80)#18,911 |
| 22. | 76120 | 2.8% | 5.1%(-2.30)#1,266 | 4.9%(-2.10)#20,331 |
| 23. | 76137 | 2.6% | 5.1%(-2.50)#1,302 | 4.9%(-2.30)#21,045 |
| 24. | 76118 | 2.5% | 5.1%(-2.60)#1,332 | 4.9%(-2.40)#21,636 |
| 25. | 76111 | 2.3% | 5.1%(-2.80)#1,371 | 4.9%(-2.60)#22,483 |
| 26. | 76126 | 2.2% | 5.1%(-2.90)#1,396 | 4.9%(-2.70)#22,881 |
| 27. | 76179 | 1.9% | 5.1%(-3.20)#1,441 | 4.9%(-3.00)#23,950 |
| 28. | 76177 | 1.9% | 5.1%(-3.20)#1,452 | 4.9%(-3.00)#24,029 |
| 29. | 76123 | 1.5% | 5.1%(-3.60)#1,520 | 4.9%(-3.40)#25,399 |
| 30. | 76155 | 1.4% | 5.1%(-3.70)#1,548 | 4.9%(-3.50)#25,790 |
| 31. | 76131 | 1.0% | 5.1%(-4.10)#1,597 | 4.9%(-3.90)#26,776 |
1
Common Questions
What are the Top 10 Zip Codes with the Highest Percentage of Households with Income Below $10,000 in Fort Worth, TX?
Top 10 Zip Codes with the Highest Percentage of Households with Income Below $10,000 in Fort Worth, TX are:
What zip code has the Highest Percentage of Households with Income Below $10,000 in Fort Worth, TX?
76115 has the Highest Percentage of Households with Income Below $10,000 in Fort Worth, TX with 11.7%.
What is the Percentage of Households with Income Below $10,000 in Fort Worth, TX?
Percentage of Households with Income Below $10,000 in Fort Worth is 4.5%.
What is the Percentage of Households with Income Below $10,000 in Texas?
Percentage of Households with Income Below $10,000 in Texas is 5.1%.
What is the Percentage of Households with Income Below $10,000 in the United States?
Percentage of Households with Income Below $10,000 in the United States is 4.9%.