Stonewall, TX Map & Demographics
Stonewall Map
Stonewall Overview
$30,455
PER CAPITA INCOME
$65,893
AVG FAMILY INCOME
0.47
INEQUALITY / GINI INDEX
559
TOTAL POPULATION
249
MALE POPULATION
310
FEMALE POPULATION
80.32
MALES / 100 FEMALES
124.50
FEMALES / 100 MALES
56.9
MEDIAN AGE
3.2
AVG FAMILY SIZE
3.1
AVG HOUSEHOLD SIZE
301
LABOR FORCE [ PEOPLE ]
57.2%
PERCENT IN LABOR FORCE
Stonewall Zip Codes
Stonewall Area Codes
Income in Stonewall
Income Overview in Stonewall
| Characteristic | Number | Measure |
| Per Capita Income | 559 | $30,455 |
| Median Family Income | 169 | $65,893 |
| Mean Family Income | 169 | $81,428 |
| Median Household Income | 181 | $0 |
| Mean Household Income | 181 | $78,768 |
| Income Deficit | 169 | $0 |
| Wage / Income Gap (%) | 559 | 0.00% |
| Wage / Income Gap ($) | 559 | 100.00¢ per $1 |
| Gini / Inequality Index | 559 | 0.47 |
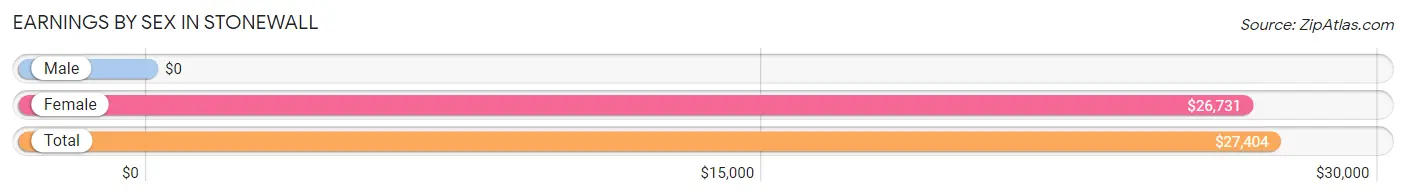
Earnings by Sex in Stonewall
| Sex | Number | Average Earnings |
| Male | 174 (57.6%) | $0 |
| Female | 128 (42.4%) | $26,731 |
| Total | 302 (100.0%) | $27,404 |
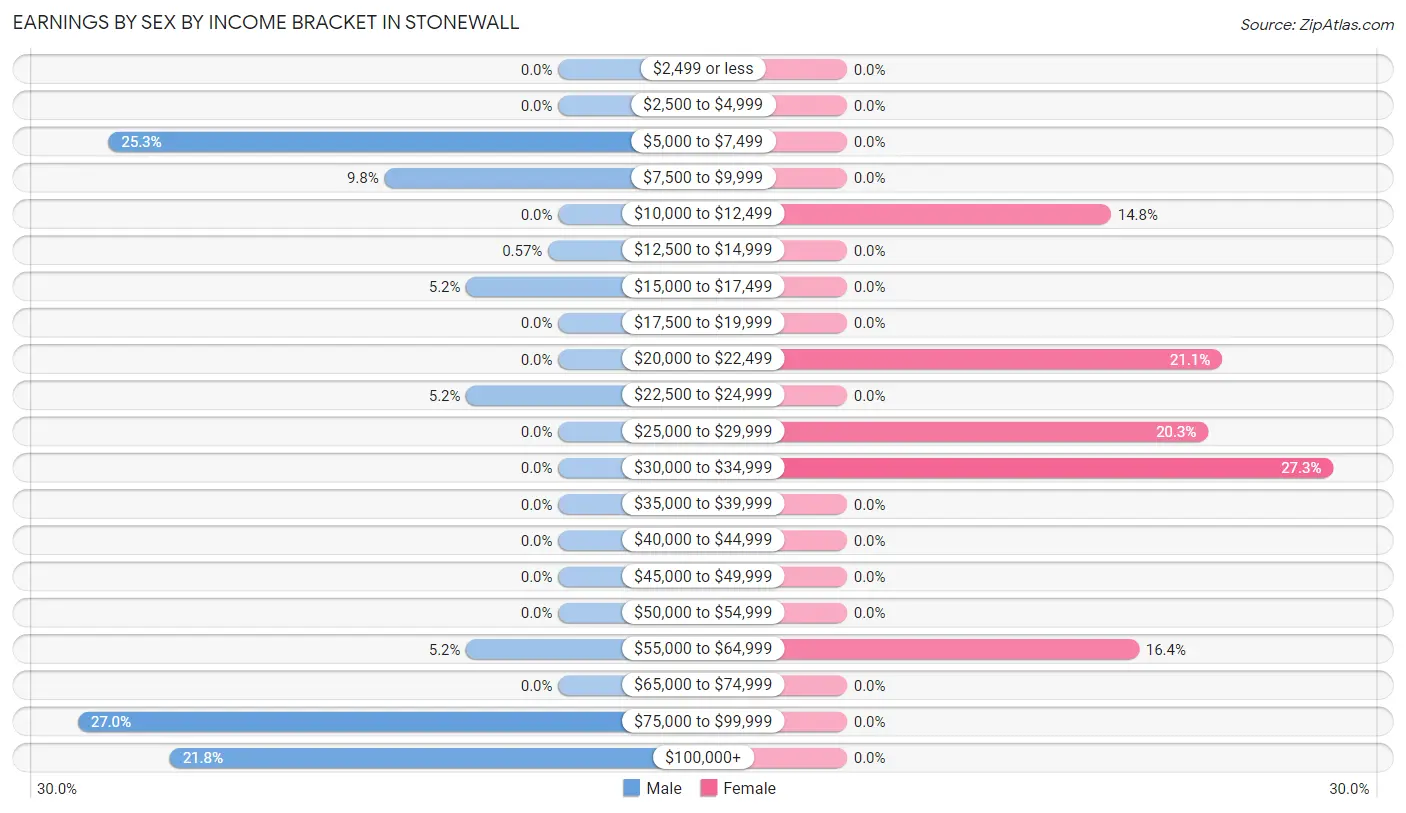
Earnings by Sex by Income Bracket in Stonewall
The most common earnings brackets in Stonewall are $75,000 to $99,999 for men (47 | 27.0%) and $30,000 to $34,999 for women (35 | 27.3%).
| Income | Male | Female |
| $2,499 or less | 0 (0.0%) | 0 (0.0%) |
| $2,500 to $4,999 | 0 (0.0%) | 0 (0.0%) |
| $5,000 to $7,499 | 44 (25.3%) | 0 (0.0%) |
| $7,500 to $9,999 | 17 (9.8%) | 0 (0.0%) |
| $10,000 to $12,499 | 0 (0.0%) | 19 (14.8%) |
| $12,500 to $14,999 | 1 (0.6%) | 0 (0.0%) |
| $15,000 to $17,499 | 9 (5.2%) | 0 (0.0%) |
| $17,500 to $19,999 | 0 (0.0%) | 0 (0.0%) |
| $20,000 to $22,499 | 0 (0.0%) | 27 (21.1%) |
| $22,500 to $24,999 | 9 (5.2%) | 0 (0.0%) |
| $25,000 to $29,999 | 0 (0.0%) | 26 (20.3%) |
| $30,000 to $34,999 | 0 (0.0%) | 35 (27.3%) |
| $35,000 to $39,999 | 0 (0.0%) | 0 (0.0%) |
| $40,000 to $44,999 | 0 (0.0%) | 0 (0.0%) |
| $45,000 to $49,999 | 0 (0.0%) | 0 (0.0%) |
| $50,000 to $54,999 | 0 (0.0%) | 0 (0.0%) |
| $55,000 to $64,999 | 9 (5.2%) | 21 (16.4%) |
| $65,000 to $74,999 | 0 (0.0%) | 0 (0.0%) |
| $75,000 to $99,999 | 47 (27.0%) | 0 (0.0%) |
| $100,000+ | 38 (21.8%) | 0 (0.0%) |
| Total | 174 (100.0%) | 128 (100.0%) |
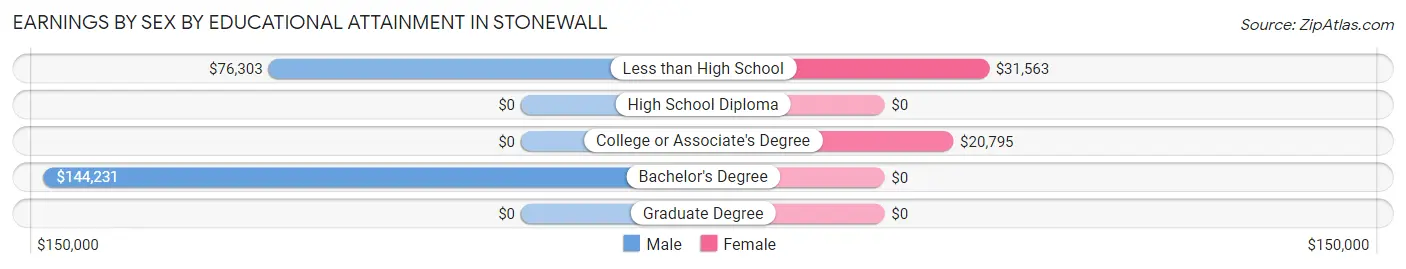
Earnings by Sex by Educational Attainment in Stonewall
Average earnings in Stonewall are $75,426 for men and $27,386 for women, a difference of 63.7%. Men with an educational attainment of bachelor's degree enjoy the highest average annual earnings of $144,231, while those with less than high school education earn the least with $76,303. Women with an educational attainment of less than high school earn the most with the average annual earnings of $31,563, while those with college or associate's degree education have the smallest earnings of $20,795.
| Educational Attainment | Male Income | Female Income |
| Less than High School | $76,303 | $31,563 |
| High School Diploma | - | - |
| College or Associate's Degree | - | - |
| Bachelor's Degree | $144,231 | $0 |
| Graduate Degree | - | - |
| Total | $75,426 | $27,386 |
Family Income in Stonewall
Family Income Brackets in Stonewall
According to the Stonewall family income data, there are 34 families falling into the $100,000 to $149,999 income range, which is the most common income bracket and makes up 20.1% of all families.
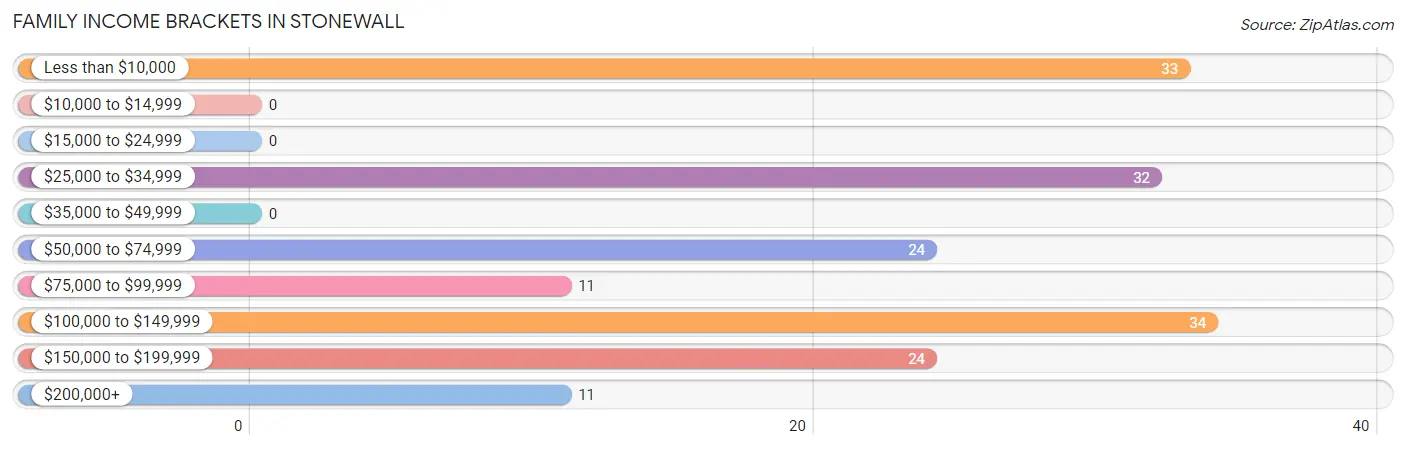
| Income Bracket | # Families | % Families |
| Less than $10,000 | 33 | 19.5% |
| $10,000 to $14,999 | 0 | 0.0% |
| $15,000 to $24,999 | 0 | 0.0% |
| $25,000 to $34,999 | 32 | 18.9% |
| $35,000 to $49,999 | 0 | 0.0% |
| $50,000 to $74,999 | 24 | 14.2% |
| $75,000 to $99,999 | 11 | 6.5% |
| $100,000 to $149,999 | 34 | 20.1% |
| $150,000 to $199,999 | 24 | 14.2% |
| $200,000+ | 11 | 6.5% |
Family Income by Famaliy Size in Stonewall
4-person families (45 | 26.6%) account for the highest median family income in Stonewall with $106,198 per family, while 4-person families (45 | 26.6%) have the highest median income of $26,550 per family member.
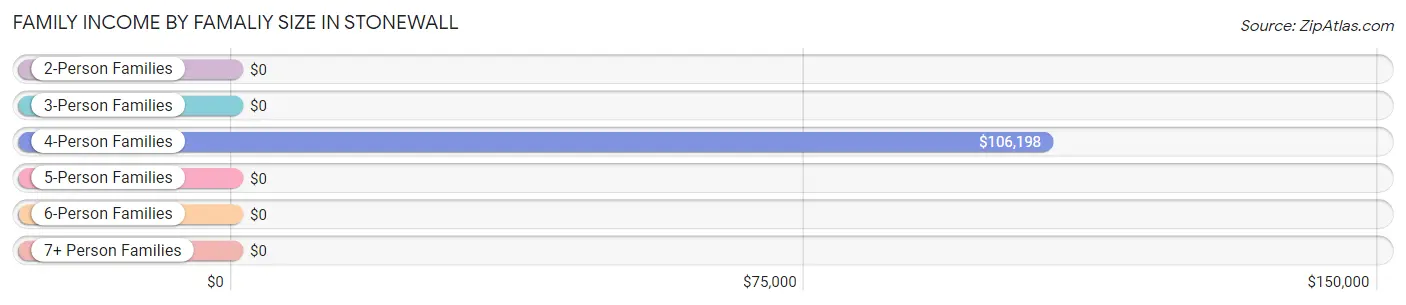
| Income Bracket | # Families | Median Income |
| 2-Person Families | 117 (69.2%) | $0 |
| 3-Person Families | 0 (0.0%) | $0 |
| 4-Person Families | 45 (26.6%) | $106,198 |
| 5-Person Families | 7 (4.1%) | $0 |
| 6-Person Families | 0 (0.0%) | $0 |
| 7+ Person Families | 0 (0.0%) | $0 |
| Total | 169 (100.0%) | $65,893 |
Family Income by Number of Earners in Stonewall
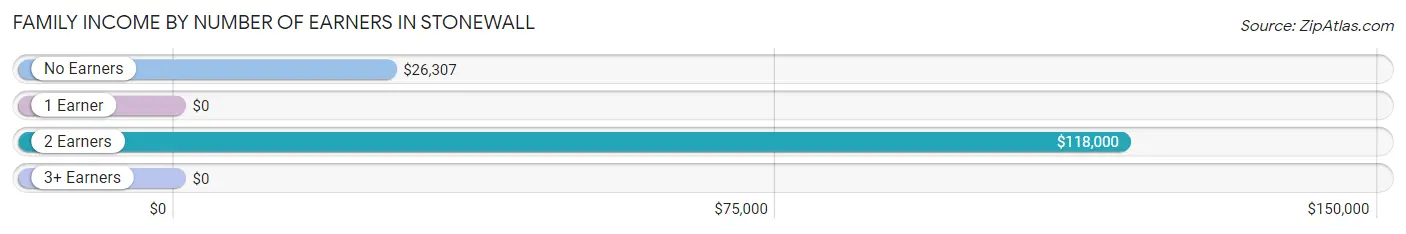
| Number of Earners | # Families | Median Income |
| No Earners | 41 (24.3%) | $26,307 |
| 1 Earner | 24 (14.2%) | $0 |
| 2 Earners | 86 (50.9%) | $118,000 |
| 3+ Earners | 18 (10.6%) | $0 |
| Total | 169 (100.0%) | $65,893 |
Household Income in Stonewall
Household Income Brackets in Stonewall
With 34 households falling in the category, the $100,000 to $149,999 income range is the most frequent in Stonewall, accounting for 18.8% of all households.
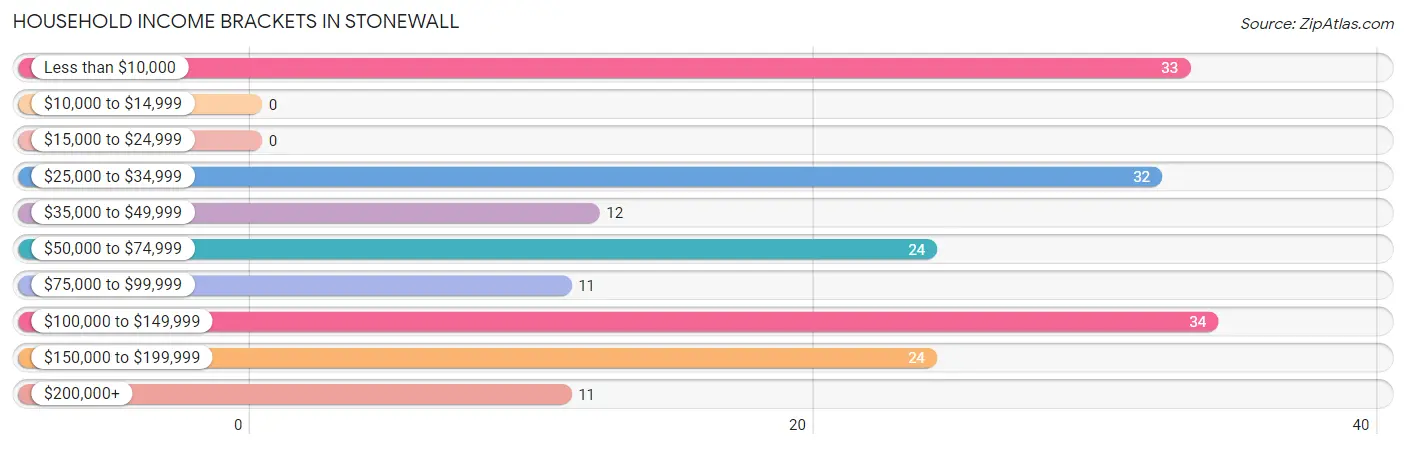
| Income Bracket | # Households | % Households |
| Less than $10,000 | 33 | 18.2% |
| $10,000 to $14,999 | 0 | 0.0% |
| $15,000 to $24,999 | 0 | 0.0% |
| $25,000 to $34,999 | 32 | 17.7% |
| $35,000 to $49,999 | 12 | 6.6% |
| $50,000 to $74,999 | 24 | 13.3% |
| $75,000 to $99,999 | 11 | 6.1% |
| $100,000 to $149,999 | 34 | 18.8% |
| $150,000 to $199,999 | 24 | 13.3% |
| $200,000+ | 11 | 6.1% |
Household Income by Householder Age in Stonewall
The median household income in Stonewall is $0, with the highest median household income of $105,990 found in the 45 to 64 years age bracket for the primary householder. A total of 99 households (54.7%) fall into this category.
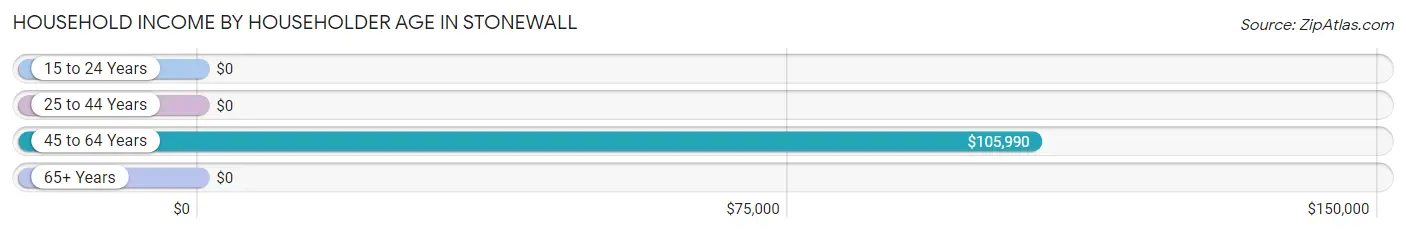
| Income Bracket | # Households | Median Income |
| 15 to 24 Years | 0 (0.0%) | $0 |
| 25 to 44 Years | 17 (9.4%) | $0 |
| 45 to 64 Years | 99 (54.7%) | $105,990 |
| 65+ Years | 65 (35.9%) | $0 |
| Total | 181 (100.0%) | $0 |
Poverty in Stonewall
Income Below Poverty by Sex and Age in Stonewall
With 13.4% poverty level for males and 10.3% for females among the residents of Stonewall, 75 year old and over males and 65 to 74 year old females are the most vulnerable to poverty, with 9 males (47.4%) and 24 females (52.2%) in their respective age groups living below the poverty level.
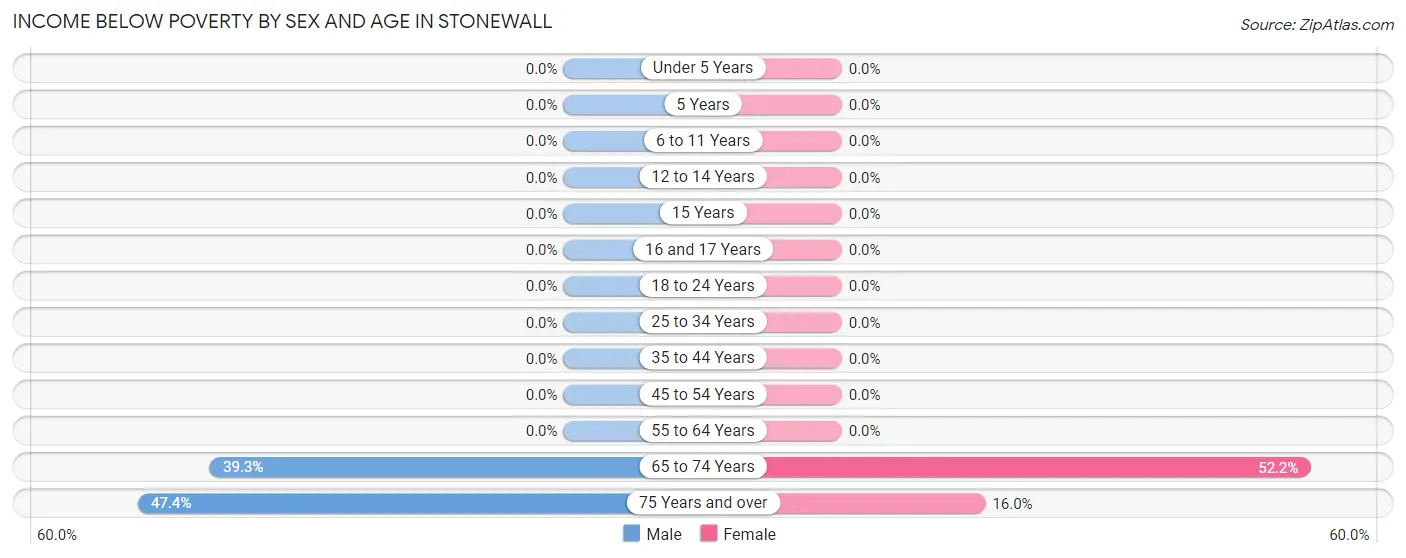
| Age Bracket | Male | Female |
| Under 5 Years | 0 (0.0%) | 0 (0.0%) |
| 5 Years | 0 (0.0%) | 0 (0.0%) |
| 6 to 11 Years | 0 (0.0%) | 0 (0.0%) |
| 12 to 14 Years | 0 (0.0%) | 0 (0.0%) |
| 15 Years | 0 (0.0%) | 0 (0.0%) |
| 16 and 17 Years | 0 (0.0%) | 0 (0.0%) |
| 18 to 24 Years | 0 (0.0%) | 0 (0.0%) |
| 25 to 34 Years | 0 (0.0%) | 0 (0.0%) |
| 35 to 44 Years | 0 (0.0%) | 0 (0.0%) |
| 45 to 54 Years | 0 (0.0%) | 0 (0.0%) |
| 55 to 64 Years | 0 (0.0%) | 0 (0.0%) |
| 65 to 74 Years | 24 (39.3%) | 24 (52.2%) |
| 75 Years and over | 9 (47.4%) | 8 (16.0%) |
| Total | 33 (13.4%) | 32 (10.3%) |
Income Above Poverty by Sex and Age in Stonewall
According to the poverty statistics in Stonewall, males aged under 5 years and females aged under 5 years are the age groups that are most secure financially, with 100.0% of males and 100.0% of females in these age groups living above the poverty line.
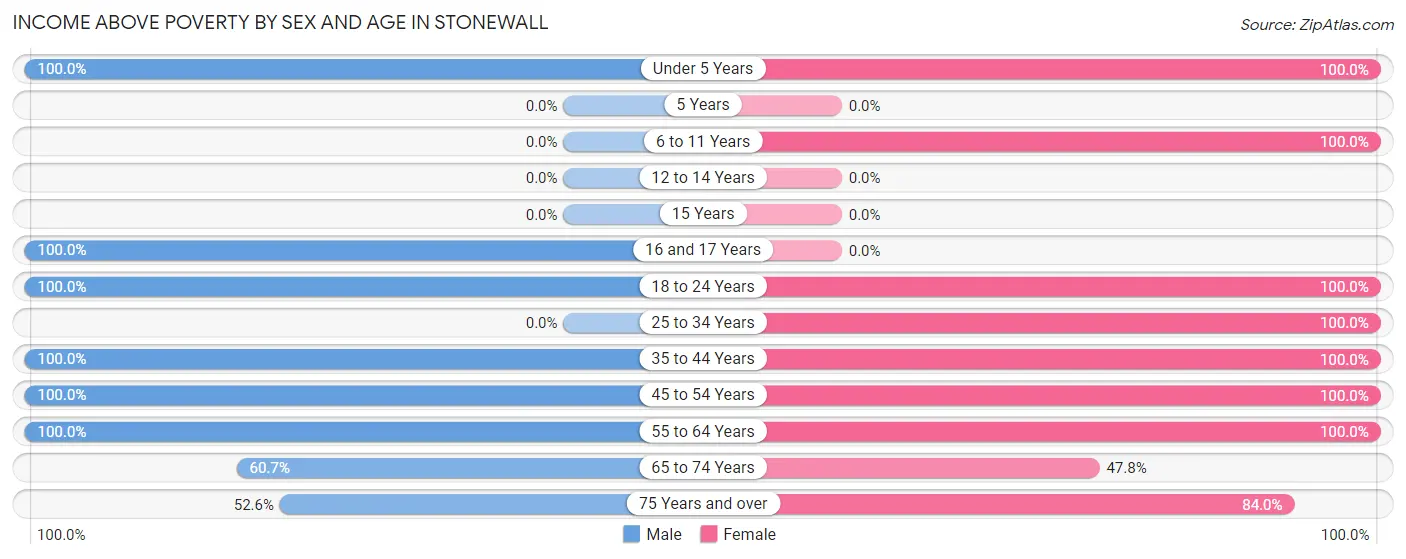
| Age Bracket | Male | Female |
| Under 5 Years | 8 (100.0%) | 14 (100.0%) |
| 5 Years | 0 (0.0%) | 0 (0.0%) |
| 6 to 11 Years | 0 (0.0%) | 11 (100.0%) |
| 12 to 14 Years | 0 (0.0%) | 0 (0.0%) |
| 15 Years | 0 (0.0%) | 0 (0.0%) |
| 16 and 17 Years | 10 (100.0%) | 0 (0.0%) |
| 18 to 24 Years | 20 (100.0%) | 15 (100.0%) |
| 25 to 34 Years | 0 (0.0%) | 15 (100.0%) |
| 35 to 44 Years | 18 (100.0%) | 56 (100.0%) |
| 45 to 54 Years | 23 (100.0%) | 46 (100.0%) |
| 55 to 64 Years | 88 (100.0%) | 57 (100.0%) |
| 65 to 74 Years | 37 (60.7%) | 22 (47.8%) |
| 75 Years and over | 10 (52.6%) | 42 (84.0%) |
| Total | 214 (86.6%) | 278 (89.7%) |
Income Below Poverty Among Married-Couple Families in Stonewall
The poverty statistics for married-couple families in Stonewall show that 20.4% or 33 of the total 162 families live below the poverty line. Families with no children have the highest poverty rate of 21.7%, comprising of 33 families. On the other hand, families with 1 or 2 children have the lowest poverty rate of 0.0%, which includes 0 families.
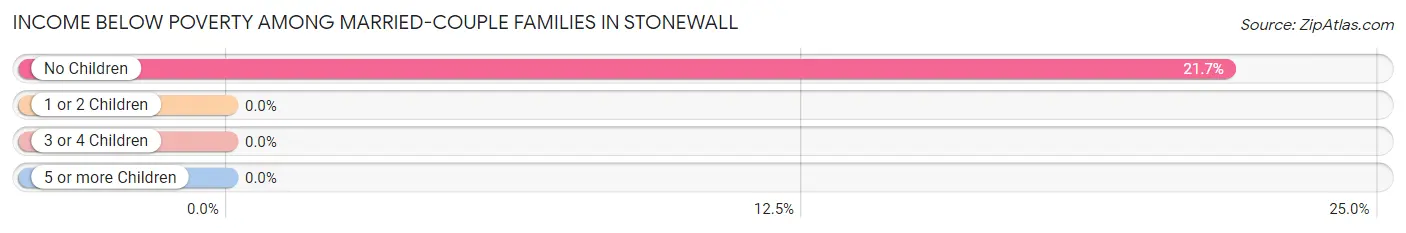
| Children | Above Poverty | Below Poverty |
| No Children | 119 (78.3%) | 33 (21.7%) |
| 1 or 2 Children | 10 (100.0%) | 0 (0.0%) |
| 3 or 4 Children | 0 (0.0%) | 0 (0.0%) |
| 5 or more Children | 0 (0.0%) | 0 (0.0%) |
| Total | 129 (79.6%) | 33 (20.4%) |
Income Below Poverty Among Single-Parent Households in Stonewall
| Children | Single Father | Single Mother |
| No Children | 0 (0.0%) | 0 (0.0%) |
| 1 or 2 Children | 0 (0.0%) | 0 (0.0%) |
| 3 or 4 Children | 0 (0.0%) | 0 (0.0%) |
| 5 or more Children | 0 (0.0%) | 0 (0.0%) |
| Total | 0 (0.0%) | 0 (0.0%) |
Income Below Poverty Among Married-Couple vs Single-Parent Households in Stonewall
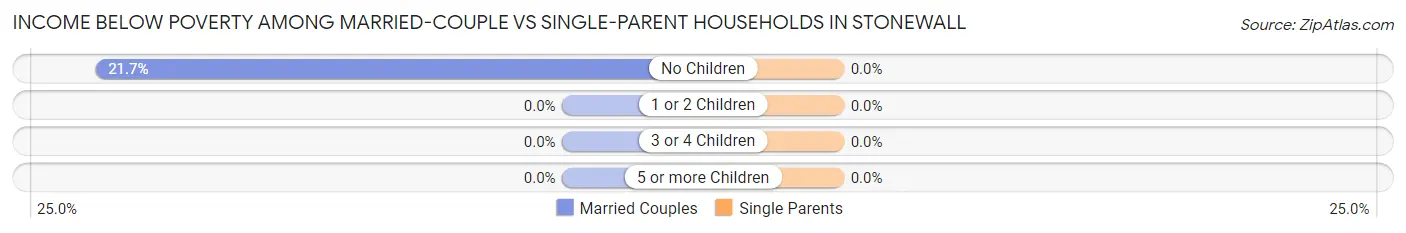
| Children | Married-Couple Families | Single-Parent Households |
| No Children | 33 (21.7%) | 0 (0.0%) |
| 1 or 2 Children | 0 (0.0%) | 0 (0.0%) |
| 3 or 4 Children | 0 (0.0%) | 0 (0.0%) |
| 5 or more Children | 0 (0.0%) | 0 (0.0%) |
| Total | 33 (20.4%) | 0 (0.0%) |
Race in Stonewall
The most populous races in Stonewall are White / Caucasian (535 | 95.7%), Hispanic or Latino (276 | 49.4%), and Some other Race (22 | 3.9%).
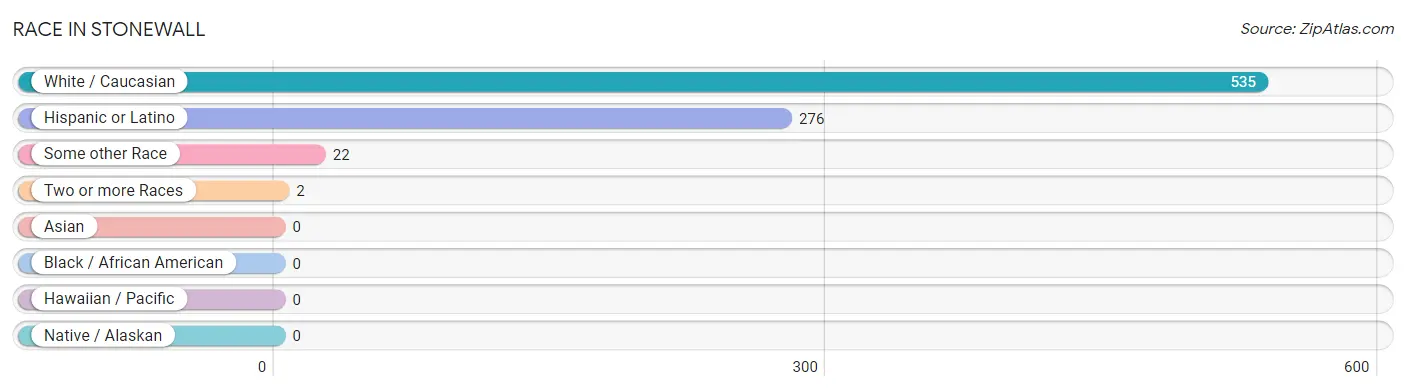
| Race | # Population | % Population |
| Asian | 0 | 0.0% |
| Black / African American | 0 | 0.0% |
| Hawaiian / Pacific | 0 | 0.0% |
| Hispanic or Latino | 276 | 49.4% |
| Native / Alaskan | 0 | 0.0% |
| White / Caucasian | 535 | 95.7% |
| Two or more Races | 2 | 0.4% |
| Some other Race | 22 | 3.9% |
| Total | 559 | 100.0% |
Ancestry in Stonewall
The most populous ancestries reported in Stonewall are Mexican (276 | 49.4%), German (96 | 17.2%), English (53 | 9.5%), French (23 | 4.1%), and Northern European (19 | 3.4%), together accounting for 83.5% of all Stonewall residents.
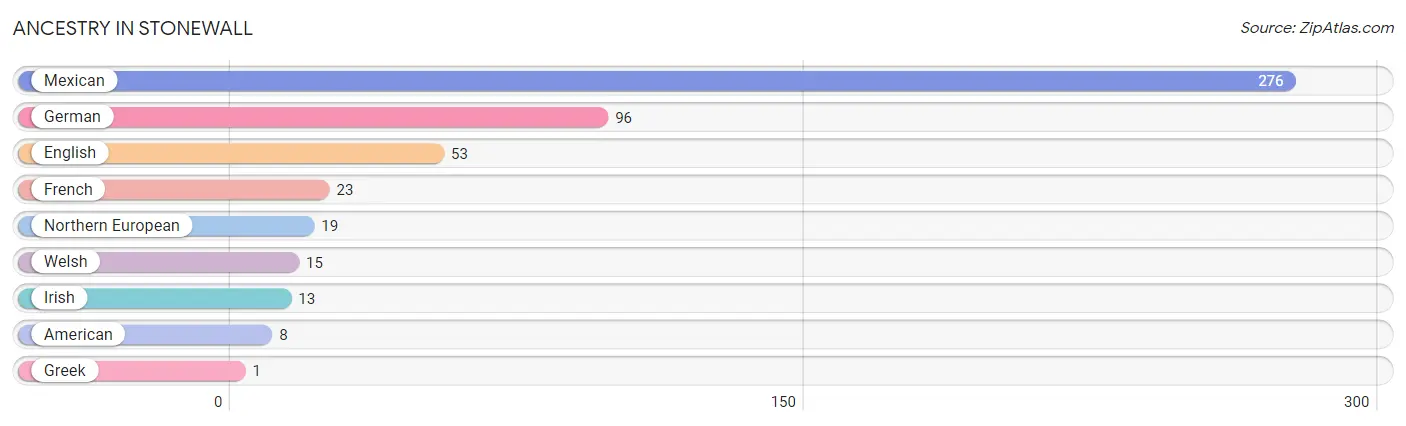
| Ancestry | # Population | % Population |
| American | 8 | 1.4% |
| English | 53 | 9.5% |
| French | 23 | 4.1% |
| German | 96 | 17.2% |
| Greek | 1 | 0.2% |
| Irish | 13 | 2.3% |
| Mexican | 276 | 49.4% |
| Northern European | 19 | 3.4% |
| Welsh | 15 | 2.7% | View All 9 Rows |
Immigrants in Stonewall
The most numerous immigrant groups reported in Stonewall came from Central America (213 | 38.1%), Latin America (213 | 38.1%), and Mexico (213 | 38.1%), together accounting for 114.3% of all Stonewall residents.
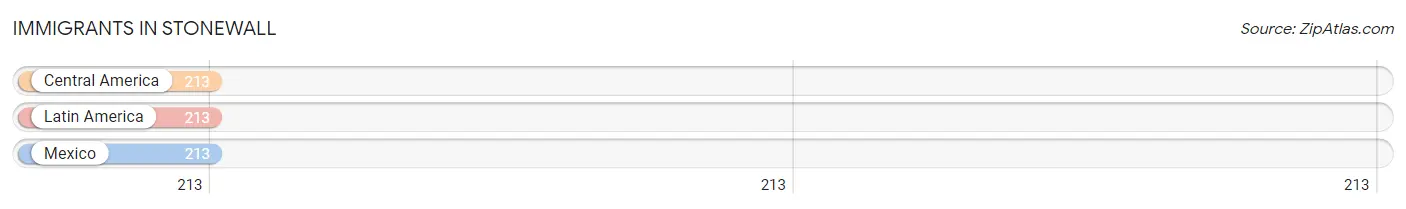
| Immigration Origin | # Population | % Population |
| Central America | 213 | 38.1% |
| Latin America | 213 | 38.1% |
| Mexico | 213 | 38.1% | View All 3 Rows |
Sex and Age in Stonewall
Sex and Age in Stonewall
The most populous age groups in Stonewall are 55 to 59 Years (76 | 30.5%) for men and 40 to 44 Years (56 | 18.1%) for women.
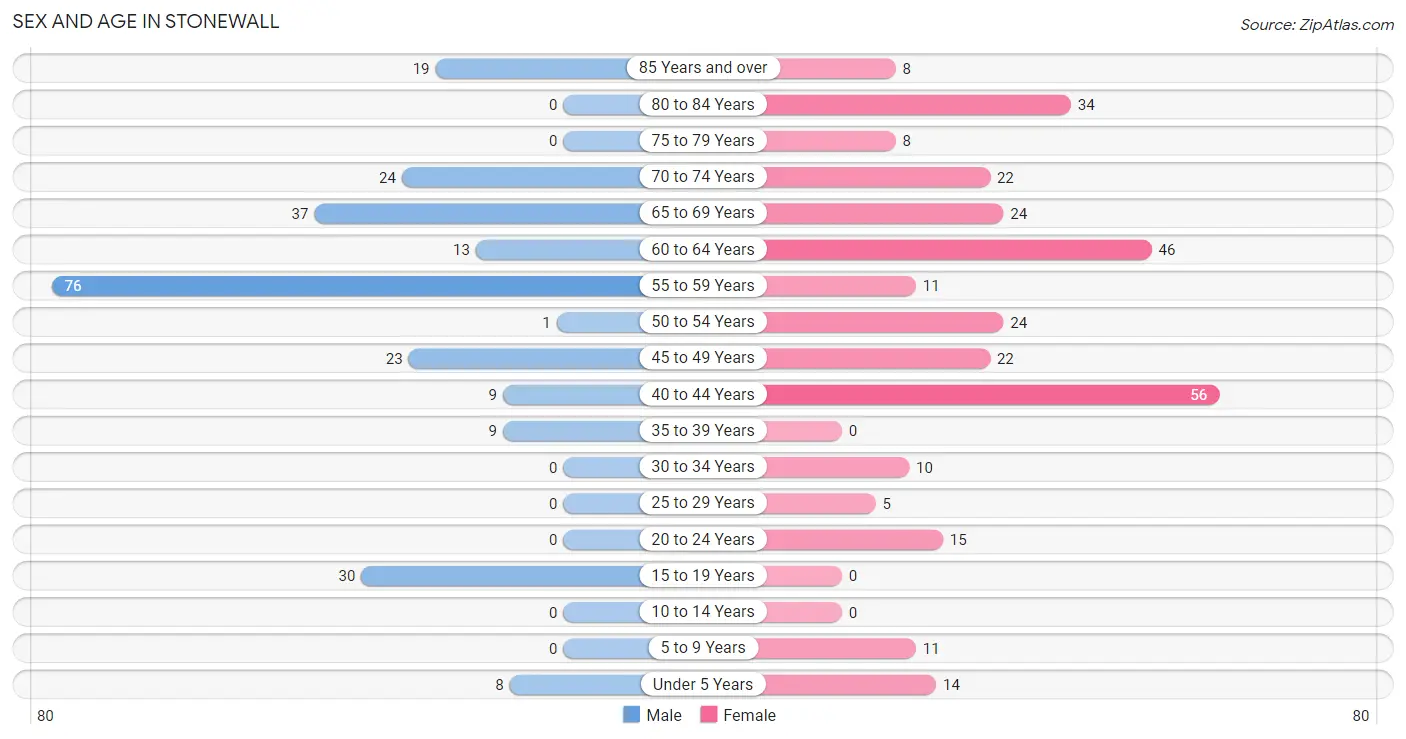
| Age Bracket | Male | Female |
| Under 5 Years | 8 (3.2%) | 14 (4.5%) |
| 5 to 9 Years | 0 (0.0%) | 11 (3.5%) |
| 10 to 14 Years | 0 (0.0%) | 0 (0.0%) |
| 15 to 19 Years | 30 (12.0%) | 0 (0.0%) |
| 20 to 24 Years | 0 (0.0%) | 15 (4.8%) |
| 25 to 29 Years | 0 (0.0%) | 5 (1.6%) |
| 30 to 34 Years | 0 (0.0%) | 10 (3.2%) |
| 35 to 39 Years | 9 (3.6%) | 0 (0.0%) |
| 40 to 44 Years | 9 (3.6%) | 56 (18.1%) |
| 45 to 49 Years | 23 (9.2%) | 22 (7.1%) |
| 50 to 54 Years | 1 (0.4%) | 24 (7.7%) |
| 55 to 59 Years | 76 (30.5%) | 11 (3.5%) |
| 60 to 64 Years | 13 (5.2%) | 46 (14.8%) |
| 65 to 69 Years | 37 (14.9%) | 24 (7.7%) |
| 70 to 74 Years | 24 (9.6%) | 22 (7.1%) |
| 75 to 79 Years | 0 (0.0%) | 8 (2.6%) |
| 80 to 84 Years | 0 (0.0%) | 34 (11.0%) |
| 85 Years and over | 19 (7.6%) | 8 (2.6%) |
| Total | 249 (100.0%) | 310 (100.0%) |
Families and Households in Stonewall
Median Family Size in Stonewall
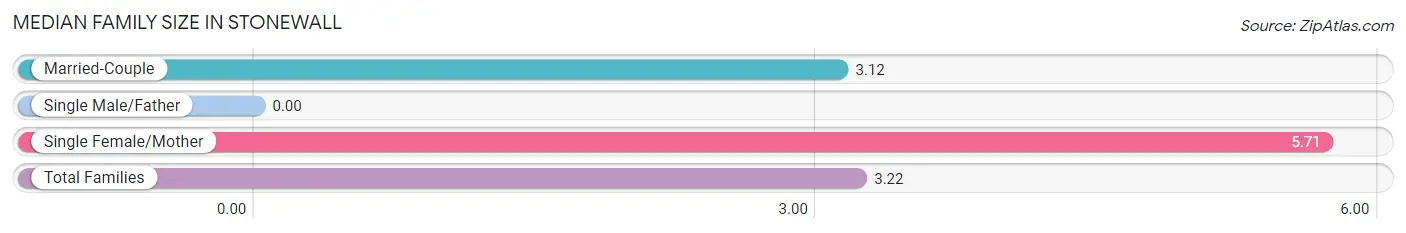
| Family Type | # Families | Family Size |
| Married-Couple | 162 (95.9%) | 3.12 |
| Single Male/Father | 0 (0.0%) | - |
| Single Female/Mother | 7 (4.1%) | 5.71 |
| Total Families | 169 (100.0%) | 3.22 |
Median Household Size in Stonewall
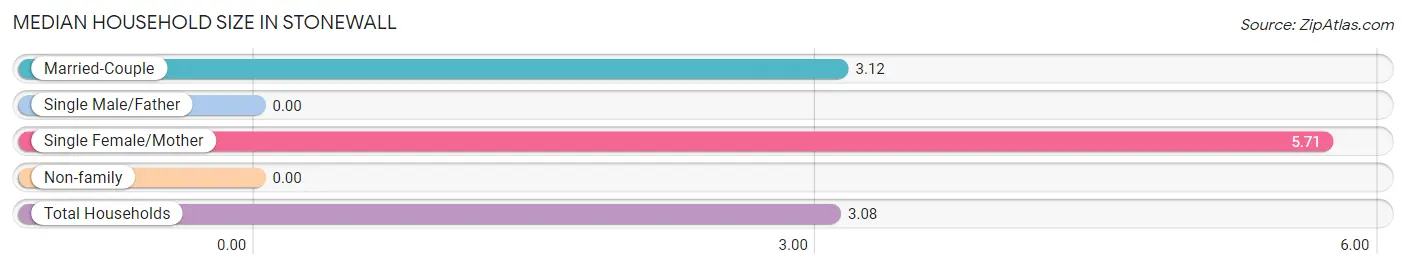
| Household Type | # Households | Household Size |
| Married-Couple | 162 (89.5%) | 3.12 |
| Single Male/Father | 0 (0.0%) | - |
| Single Female/Mother | 7 (3.9%) | 5.71 |
| Non-family | 12 (6.6%) | - |
| Total Households | 181 (100.0%) | 3.08 |
Household Size by Marriage Status in Stonewall
Out of a total of 181 households in Stonewall, 169 (93.4%) are family households, while 12 (6.6%) are nonfamily households. The most numerous type of family households are 2-person households, comprising 117, and the most common type of nonfamily households are 1-person households, comprising 12.
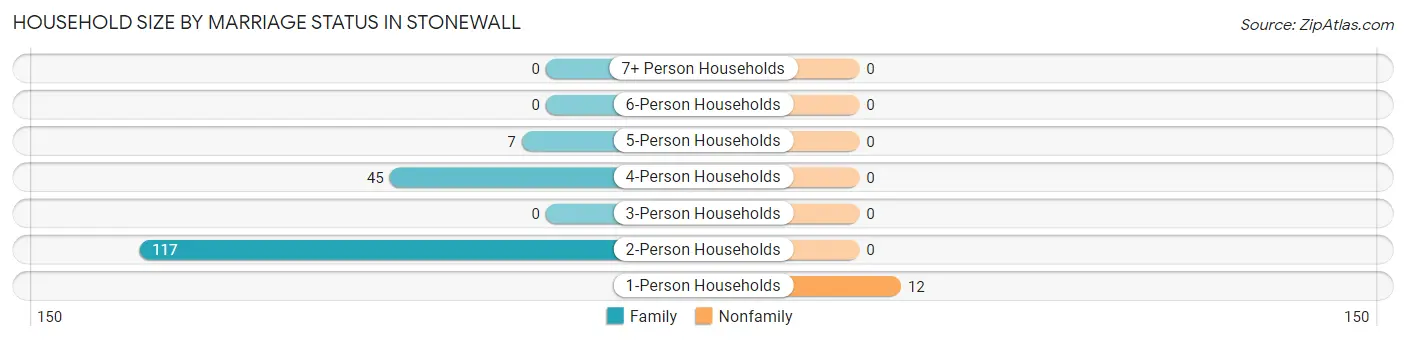
| Household Size | Family Households | Nonfamily Households |
| 1-Person Households | - | 12 (6.6%) |
| 2-Person Households | 117 (64.6%) | 0 (0.0%) |
| 3-Person Households | 0 (0.0%) | 0 (0.0%) |
| 4-Person Households | 45 (24.9%) | 0 (0.0%) |
| 5-Person Households | 7 (3.9%) | 0 (0.0%) |
| 6-Person Households | 0 (0.0%) | 0 (0.0%) |
| 7+ Person Households | 0 (0.0%) | 0 (0.0%) |
| Total | 169 (93.4%) | 12 (6.6%) |
Female Fertility in Stonewall
Fertility by Age in Stonewall
| Age Bracket | Women with Births | Births / 1,000 Women |
| 15 to 19 years | 0 (0.0%) | 0.0 |
| 20 to 34 years | 0 (0.0%) | 0.0 |
| 35 to 50 years | 0 (0.0%) | 0.0 |
| Total | 0 (0.0%) | 0.0 |
Fertility by Age by Marriage Status in Stonewall
| Age Bracket | Married | Unmarried |
| 15 to 19 years | 0 (0.0%) | 0 (0.0%) |
| 20 to 34 years | 0 (0.0%) | 0 (0.0%) |
| 35 to 50 years | 0 (0.0%) | 0 (0.0%) |
| Total | 0 (0.0%) | 0 (0.0%) |
Fertility by Education in Stonewall
| Educational Attainment | Women with Births | Births / 1,000 Women |
| Less than High School | 0 (0.0%) | 0.0 |
| High School Diploma | 0 (0.0%) | 0.0 |
| College or Associate's Degree | 0 (0.0%) | 0.0 |
| Bachelor's Degree | 0 (0.0%) | 0.0 |
| Graduate Degree | 0 (0.0%) | 0.0 |
| Total | 0 (0.0%) | 0.0 |
Fertility by Education by Marriage Status in Stonewall
| Educational Attainment | Married | Unmarried |
| Less than High School | 0 (0.0%) | 0 (0.0%) |
| High School Diploma | 0 (0.0%) | 0 (0.0%) |
| College or Associate's Degree | 0 (0.0%) | 0 (0.0%) |
| Bachelor's Degree | 0 (0.0%) | 0 (0.0%) |
| Graduate Degree | 0 (0.0%) | 0 (0.0%) |
| Total | 0 (0.0%) | 0 (0.0%) |
Employment Characteristics in Stonewall
Employment by Class of Employer in Stonewall
Among the 301 employed individuals in Stonewall, private company employees (152 | 50.5%), self-employed (not incorporated) (95 | 31.6%), and not-for-profit organizations (35 | 11.6%) make up the most common classes of employment.
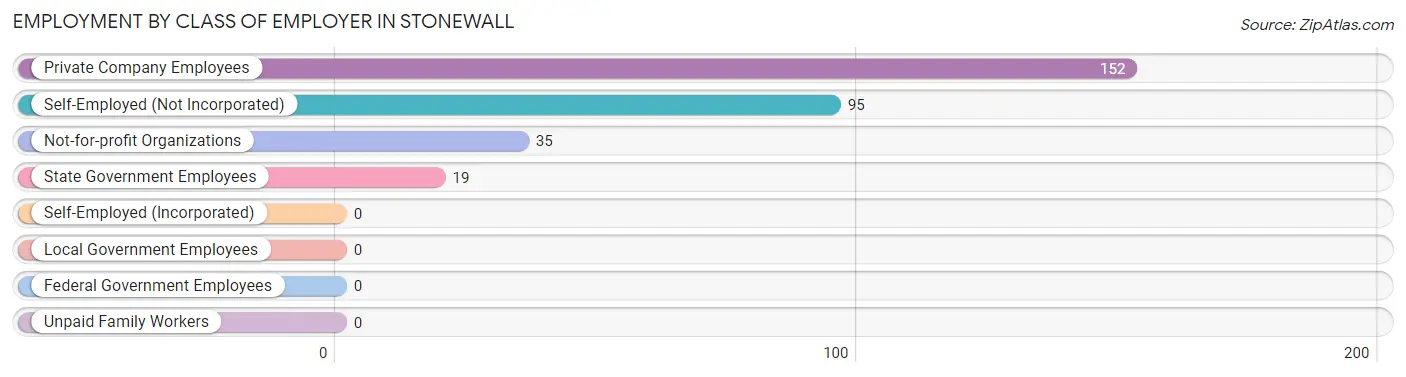
| Employer Class | # Employees | % Employees |
| Private Company Employees | 152 | 50.5% |
| Self-Employed (Incorporated) | 0 | 0.0% |
| Self-Employed (Not Incorporated) | 95 | 31.6% |
| Not-for-profit Organizations | 35 | 11.6% |
| Local Government Employees | 0 | 0.0% |
| State Government Employees | 19 | 6.3% |
| Federal Government Employees | 0 | 0.0% |
| Unpaid Family Workers | 0 | 0.0% |
| Total | 301 | 100.0% |
Employment Status by Age in Stonewall
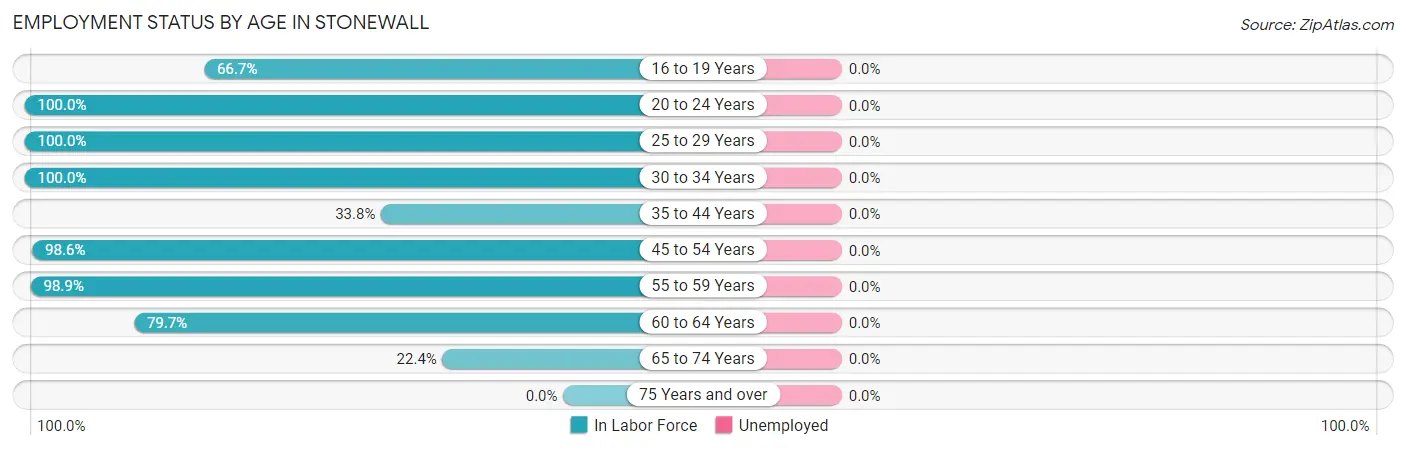
| Age Bracket | In Labor Force | Unemployed |
| 16 to 19 Years | 20 (66.7%) | 0 (0.0%) |
| 20 to 24 Years | 15 (100.0%) | 0 (0.0%) |
| 25 to 29 Years | 5 (100.0%) | 0 (0.0%) |
| 30 to 34 Years | 10 (100.0%) | 0 (0.0%) |
| 35 to 44 Years | 25 (33.8%) | 0 (0.0%) |
| 45 to 54 Years | 69 (98.6%) | 0 (0.0%) |
| 55 to 59 Years | 86 (98.9%) | 0 (0.0%) |
| 60 to 64 Years | 47 (79.7%) | 0 (0.0%) |
| 65 to 74 Years | 24 (22.4%) | 0 (0.0%) |
| 75 Years and over | 0 (0.0%) | 0 (0.0%) |
| Total | 301 (57.2%) | 0 (0.0%) |
Employment Status by Educational Attainment in Stonewall
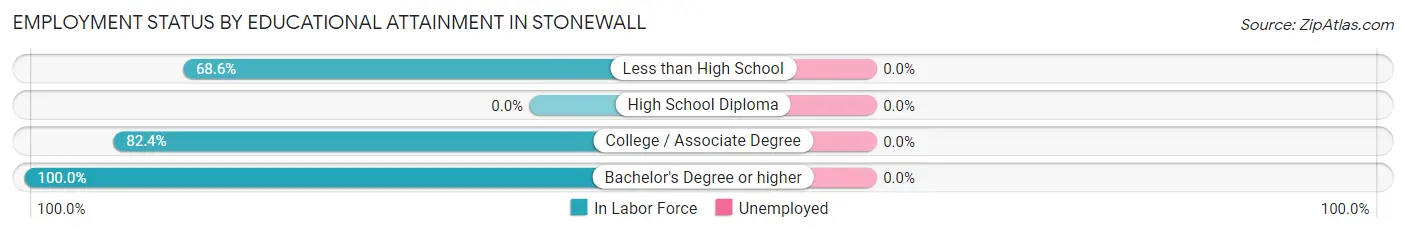
| Educational Attainment | In Labor Force | Unemployed |
| Less than High School | 107 (68.6%) | 0 (0.0%) |
| High School Diploma | 0 (0.0%) | 0 (0.0%) |
| College / Associate Degree | 61 (82.4%) | 0 (0.0%) |
| Bachelor's Degree or higher | 74 (100.0%) | 0 (0.0%) |
| Total | 242 (79.3%) | 0 (0.0%) |
Employment Occupations by Sex in Stonewall
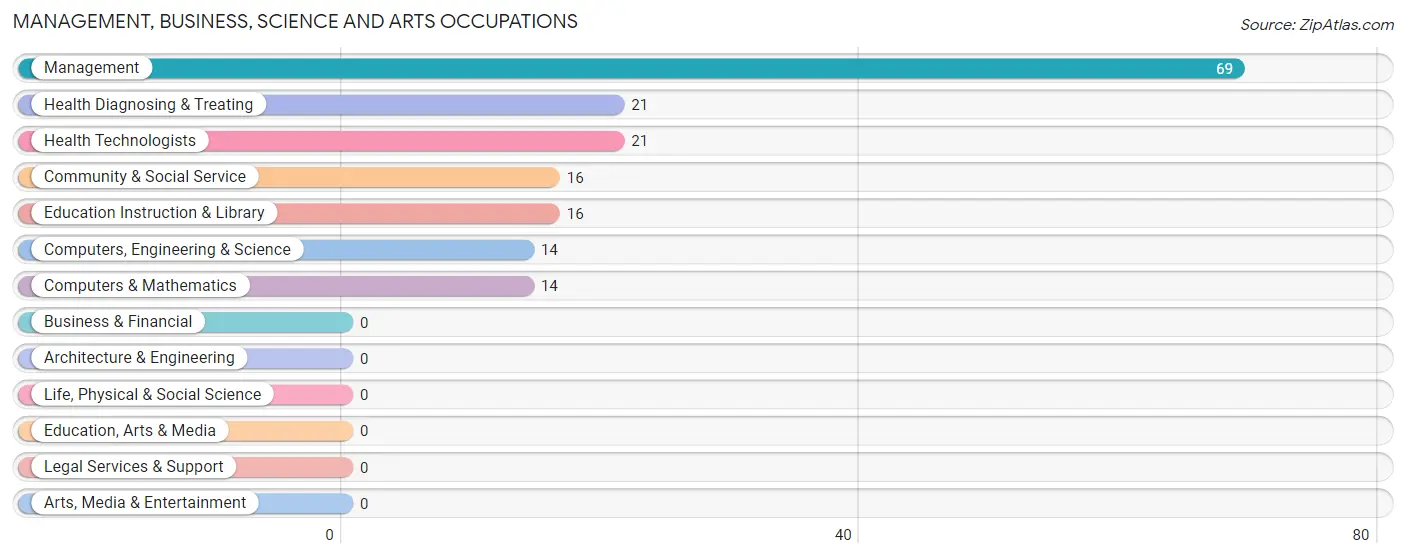
Management, Business, Science and Arts Occupations
The most common Management, Business, Science and Arts occupations in Stonewall are Management (69 | 22.9%), Health Diagnosing & Treating (21 | 7.0%), Health Technologists (21 | 7.0%), Community & Social Service (16 | 5.3%), and Education Instruction & Library (16 | 5.3%).
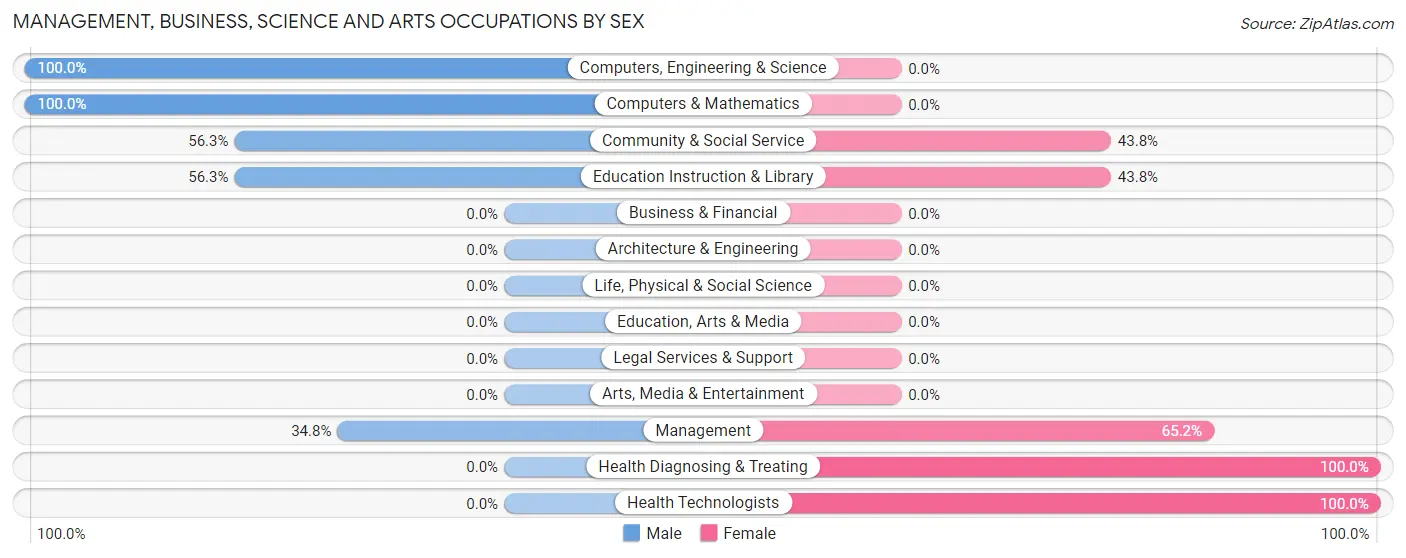
Management, Business, Science and Arts Occupations by Sex
Within the Management, Business, Science and Arts occupations in Stonewall, the most male-oriented occupations are Computers, Engineering & Science (100.0%), Computers & Mathematics (100.0%), and Community & Social Service (56.2%), while the most female-oriented occupations are Health Diagnosing & Treating (100.0%), Health Technologists (100.0%), and Management (65.2%).
| Occupation | Male | Female |
| Management | 24 (34.8%) | 45 (65.2%) |
| Business & Financial | 0 (0.0%) | 0 (0.0%) |
| Computers, Engineering & Science | 14 (100.0%) | 0 (0.0%) |
| Computers & Mathematics | 14 (100.0%) | 0 (0.0%) |
| Architecture & Engineering | 0 (0.0%) | 0 (0.0%) |
| Life, Physical & Social Science | 0 (0.0%) | 0 (0.0%) |
| Community & Social Service | 9 (56.2%) | 7 (43.8%) |
| Education, Arts & Media | 0 (0.0%) | 0 (0.0%) |
| Legal Services & Support | 0 (0.0%) | 0 (0.0%) |
| Education Instruction & Library | 9 (56.2%) | 7 (43.8%) |
| Arts, Media & Entertainment | 0 (0.0%) | 0 (0.0%) |
| Health Diagnosing & Treating | 0 (0.0%) | 21 (100.0%) |
| Health Technologists | 0 (0.0%) | 21 (100.0%) |
| Total (Category) | 47 (39.2%) | 73 (60.8%) |
| Total (Overall) | 173 (57.5%) | 128 (42.5%) |
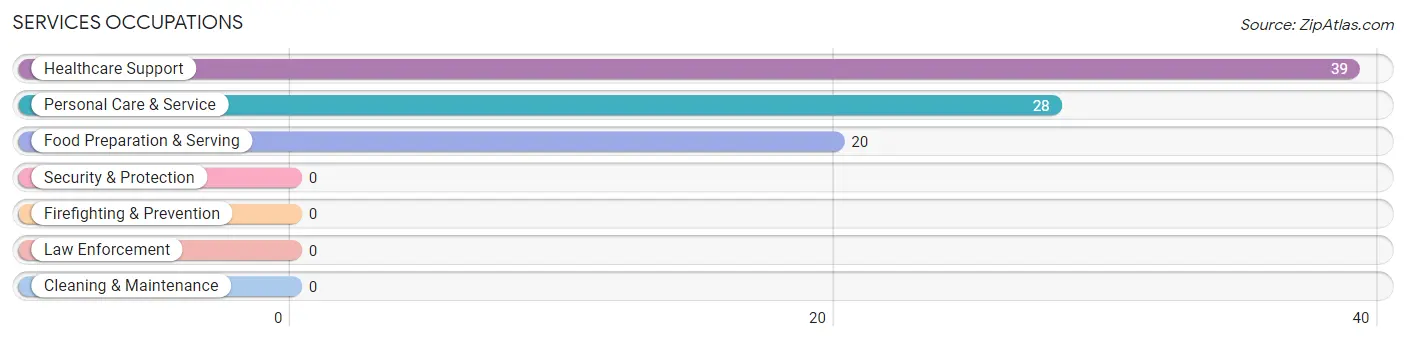
Services Occupations
The most common Services occupations in Stonewall are Healthcare Support (39 | 13.0%), Personal Care & Service (28 | 9.3%), and Food Preparation & Serving (20 | 6.6%).
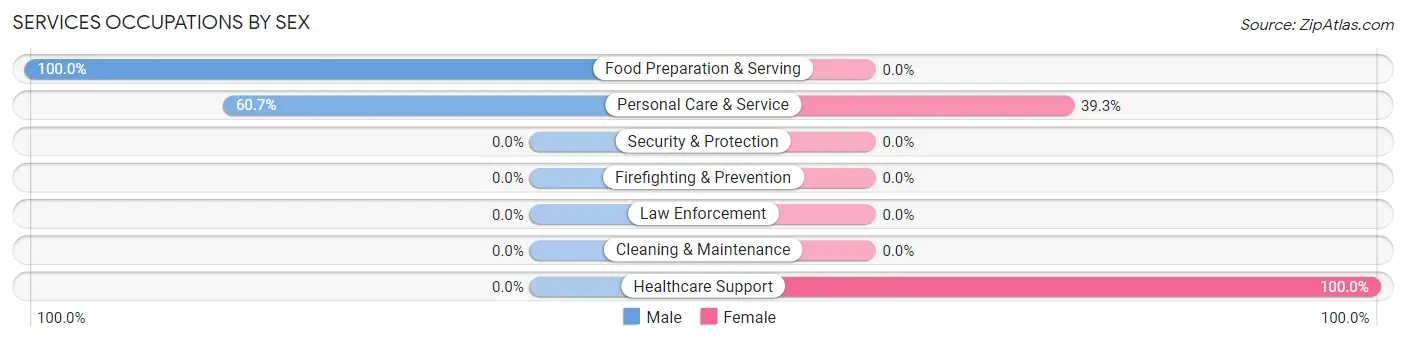
Services Occupations by Sex
Within the Services occupations in Stonewall, the most male-oriented occupations are Food Preparation & Serving (100.0%), and Personal Care & Service (60.7%), while the most female-oriented occupations are Healthcare Support (100.0%), and Personal Care & Service (39.3%).
| Occupation | Male | Female |
| Healthcare Support | 0 (0.0%) | 39 (100.0%) |
| Security & Protection | 0 (0.0%) | 0 (0.0%) |
| Firefighting & Prevention | 0 (0.0%) | 0 (0.0%) |
| Law Enforcement | 0 (0.0%) | 0 (0.0%) |
| Food Preparation & Serving | 20 (100.0%) | 0 (0.0%) |
| Cleaning & Maintenance | 0 (0.0%) | 0 (0.0%) |
| Personal Care & Service | 17 (60.7%) | 11 (39.3%) |
| Total (Category) | 37 (42.5%) | 50 (57.5%) |
| Total (Overall) | 173 (57.5%) | 128 (42.5%) |
Sales and Office Occupations
Sales and Office Occupations by Sex
| Occupation | Male | Female |
| Sales & Related | 0 (0.0%) | 0 (0.0%) |
| Office & Administration | 0 (0.0%) | 0 (0.0%) |
| Total (Category) | 0 (0.0%) | 0 (0.0%) |
| Total (Overall) | 173 (57.5%) | 128 (42.5%) |
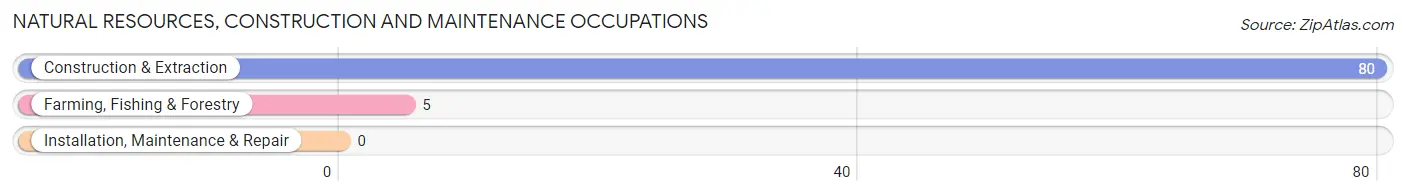
Natural Resources, Construction and Maintenance Occupations
The most common Natural Resources, Construction and Maintenance occupations in Stonewall are Construction & Extraction (80 | 26.6%), and Farming, Fishing & Forestry (5 | 1.7%).
Natural Resources, Construction and Maintenance Occupations by Sex
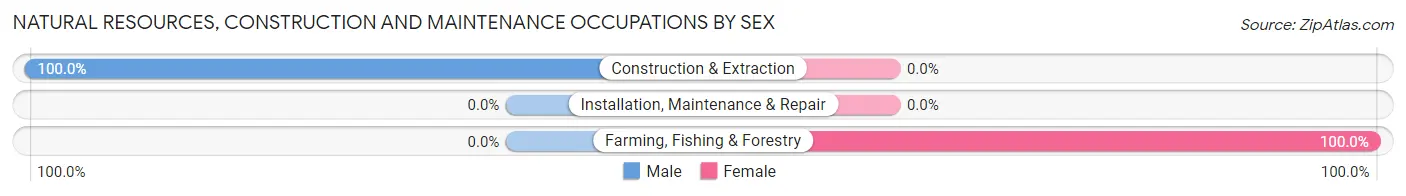
| Occupation | Male | Female |
| Farming, Fishing & Forestry | 0 (0.0%) | 5 (100.0%) |
| Construction & Extraction | 80 (100.0%) | 0 (0.0%) |
| Installation, Maintenance & Repair | 0 (0.0%) | 0 (0.0%) |
| Total (Category) | 80 (94.1%) | 5 (5.9%) |
| Total (Overall) | 173 (57.5%) | 128 (42.5%) |
Production, Transportation and Moving Occupations
The most common Production, Transportation and Moving occupations in Stonewall are , and Transportation (9 | 3.0%).
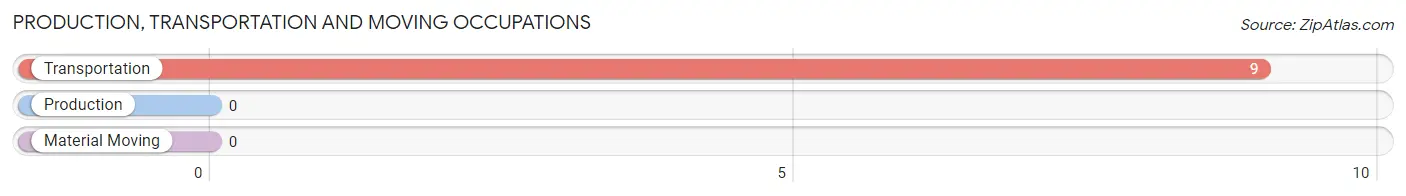
Production, Transportation and Moving Occupations by Sex
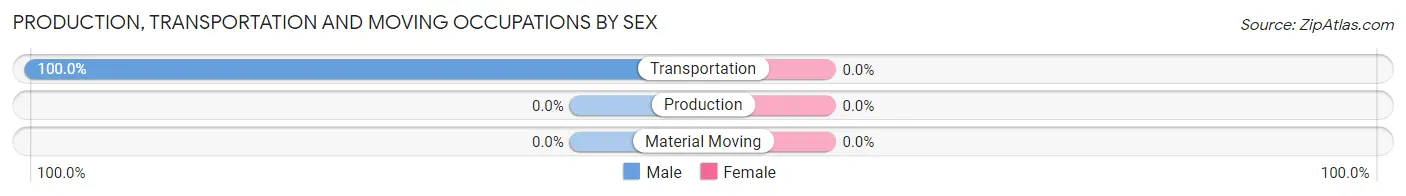
| Occupation | Male | Female |
| Production | 0 (0.0%) | 0 (0.0%) |
| Transportation | 9 (100.0%) | 0 (0.0%) |
| Material Moving | 0 (0.0%) | 0 (0.0%) |
| Total (Category) | 9 (100.0%) | 0 (0.0%) |
| Total (Overall) | 173 (57.5%) | 128 (42.5%) |
Employment Industries by Sex in Stonewall
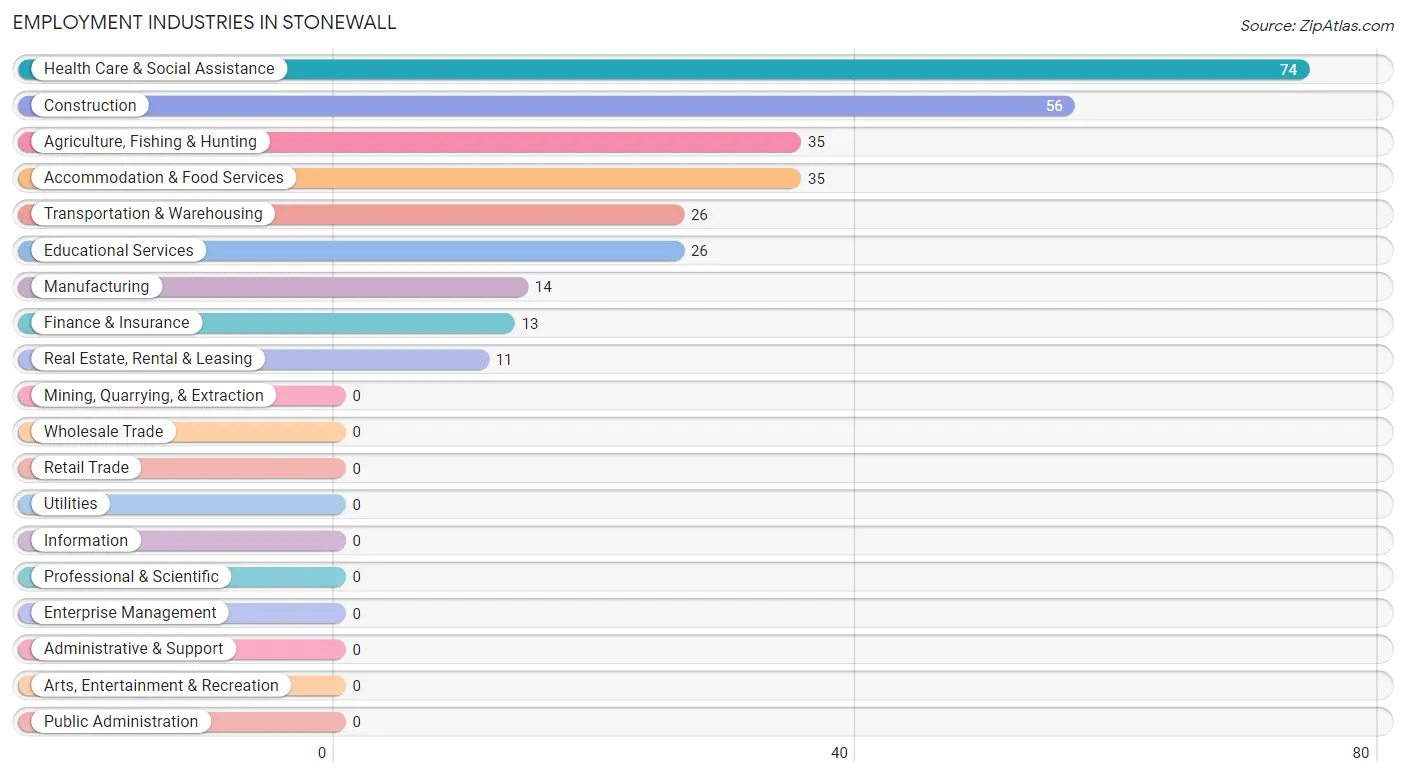
Employment Industries in Stonewall
The major employment industries in Stonewall include Health Care & Social Assistance (74 | 24.6%), Construction (56 | 18.6%), Agriculture, Fishing & Hunting (35 | 11.6%), Accommodation & Food Services (35 | 11.6%), and Transportation & Warehousing (26 | 8.6%).
Employment Industries by Sex in Stonewall
The Stonewall industries that see more men than women are Construction (100.0%), Manufacturing (100.0%), and Transportation & Warehousing (100.0%), whereas the industries that tend to have a higher number of women are Real Estate, Rental & Leasing (100.0%), Agriculture, Fishing & Hunting (68.6%), and Health Care & Social Assistance (67.6%).
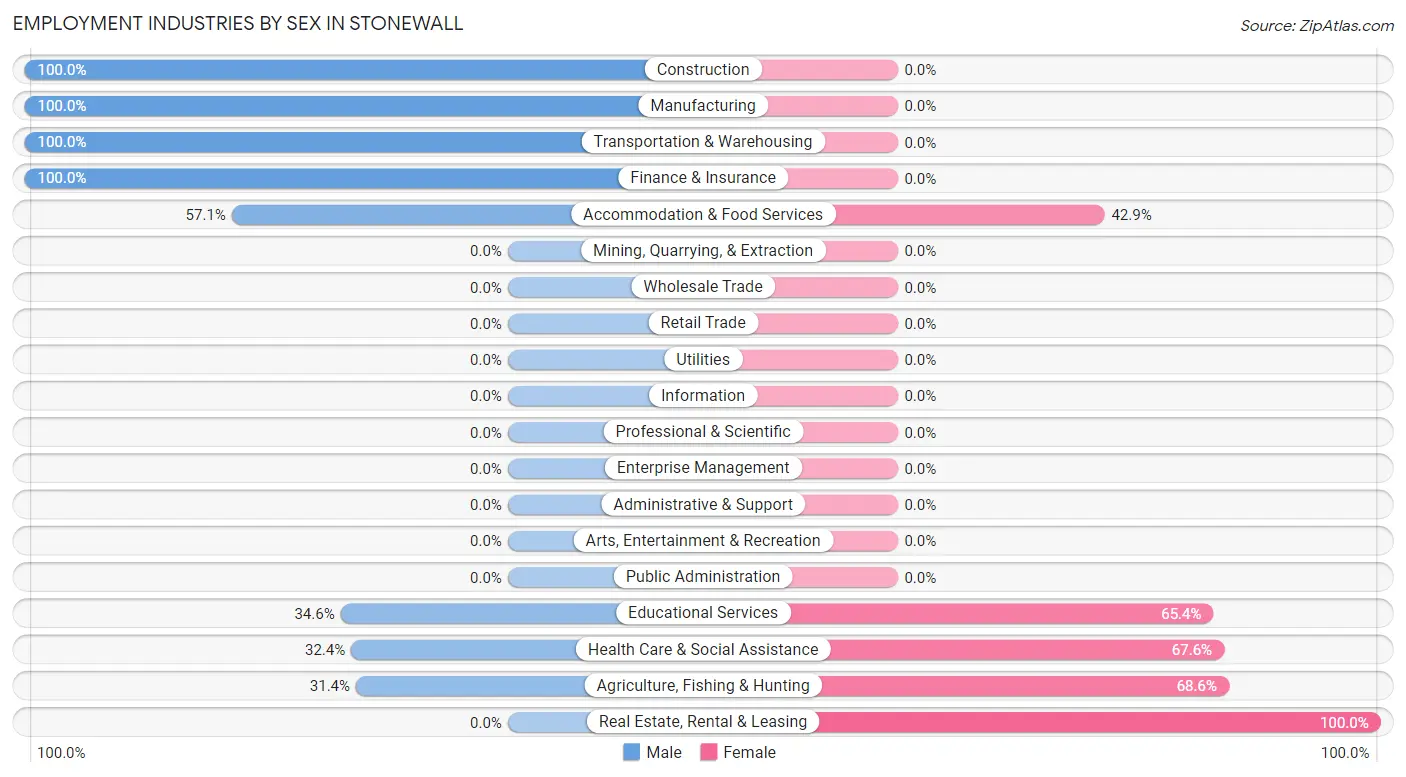
| Industry | Male | Female |
| Agriculture, Fishing & Hunting | 11 (31.4%) | 24 (68.6%) |
| Mining, Quarrying, & Extraction | 0 (0.0%) | 0 (0.0%) |
| Construction | 56 (100.0%) | 0 (0.0%) |
| Manufacturing | 14 (100.0%) | 0 (0.0%) |
| Wholesale Trade | 0 (0.0%) | 0 (0.0%) |
| Retail Trade | 0 (0.0%) | 0 (0.0%) |
| Transportation & Warehousing | 26 (100.0%) | 0 (0.0%) |
| Utilities | 0 (0.0%) | 0 (0.0%) |
| Information | 0 (0.0%) | 0 (0.0%) |
| Finance & Insurance | 13 (100.0%) | 0 (0.0%) |
| Real Estate, Rental & Leasing | 0 (0.0%) | 11 (100.0%) |
| Professional & Scientific | 0 (0.0%) | 0 (0.0%) |
| Enterprise Management | 0 (0.0%) | 0 (0.0%) |
| Administrative & Support | 0 (0.0%) | 0 (0.0%) |
| Educational Services | 9 (34.6%) | 17 (65.4%) |
| Health Care & Social Assistance | 24 (32.4%) | 50 (67.6%) |
| Arts, Entertainment & Recreation | 0 (0.0%) | 0 (0.0%) |
| Accommodation & Food Services | 20 (57.1%) | 15 (42.9%) |
| Public Administration | 0 (0.0%) | 0 (0.0%) |
| Total | 173 (57.5%) | 128 (42.5%) |
Education in Stonewall
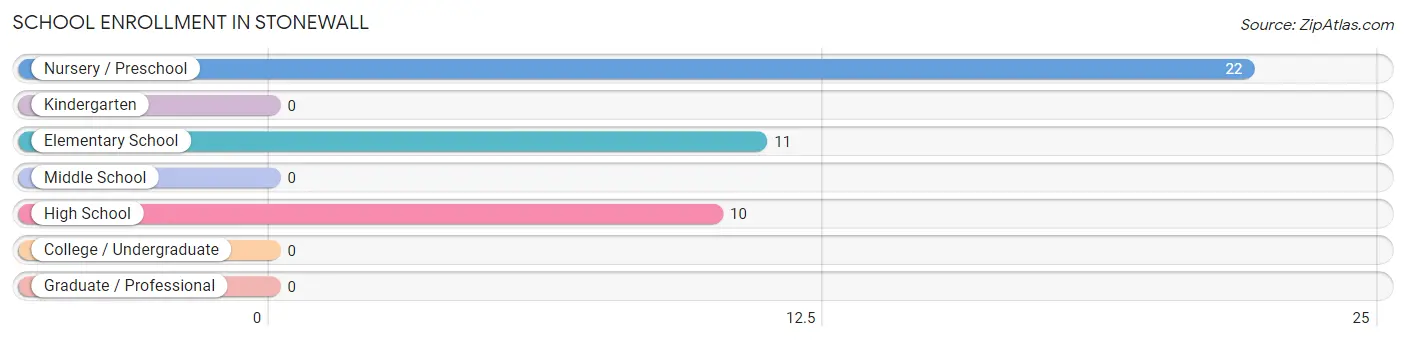
School Enrollment in Stonewall
The most common levels of schooling among the 43 students in Stonewall are nursery / preschool (22 | 51.2%), elementary school (11 | 25.6%), and high school (10 | 23.3%).
| School Level | # Students | % Students |
| Nursery / Preschool | 22 | 51.2% |
| Kindergarten | 0 | 0.0% |
| Elementary School | 11 | 25.6% |
| Middle School | 0 | 0.0% |
| High School | 10 | 23.3% |
| College / Undergraduate | 0 | 0.0% |
| Graduate / Professional | 0 | 0.0% |
| Total | 43 | 100.0% |
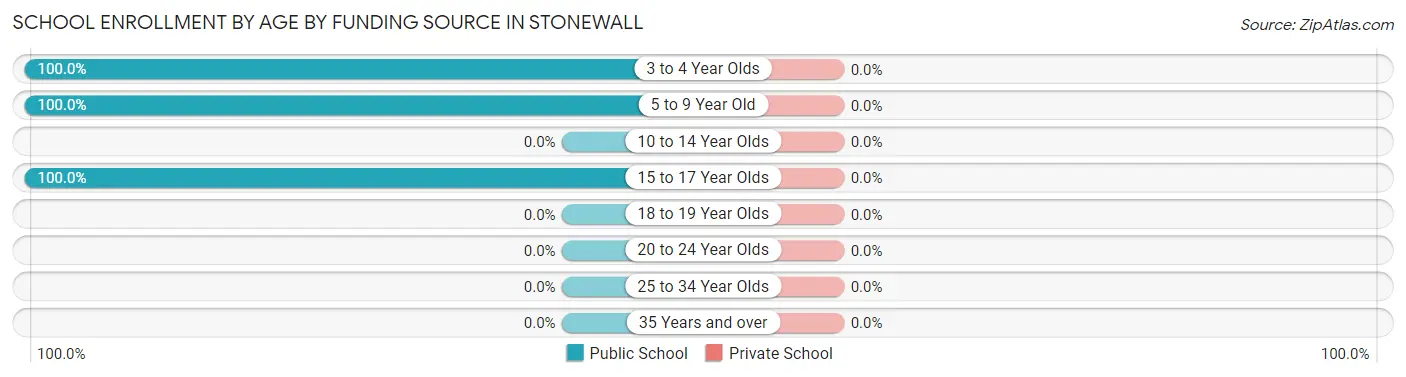
School Enrollment by Age by Funding Source in Stonewall
| Age Bracket | Public School | Private School |
| 3 to 4 Year Olds | 22 (100.0%) | 0 (0.0%) |
| 5 to 9 Year Old | 11 (100.0%) | 0 (0.0%) |
| 10 to 14 Year Olds | 0 (0.0%) | 0 (0.0%) |
| 15 to 17 Year Olds | 10 (100.0%) | 0 (0.0%) |
| 18 to 19 Year Olds | 0 (0.0%) | 0 (0.0%) |
| 20 to 24 Year Olds | 0 (0.0%) | 0 (0.0%) |
| 25 to 34 Year Olds | 0 (0.0%) | 0 (0.0%) |
| 35 Years and over | 0 (0.0%) | 0 (0.0%) |
| Total | 43 (100.0%) | 0 (0.0%) |
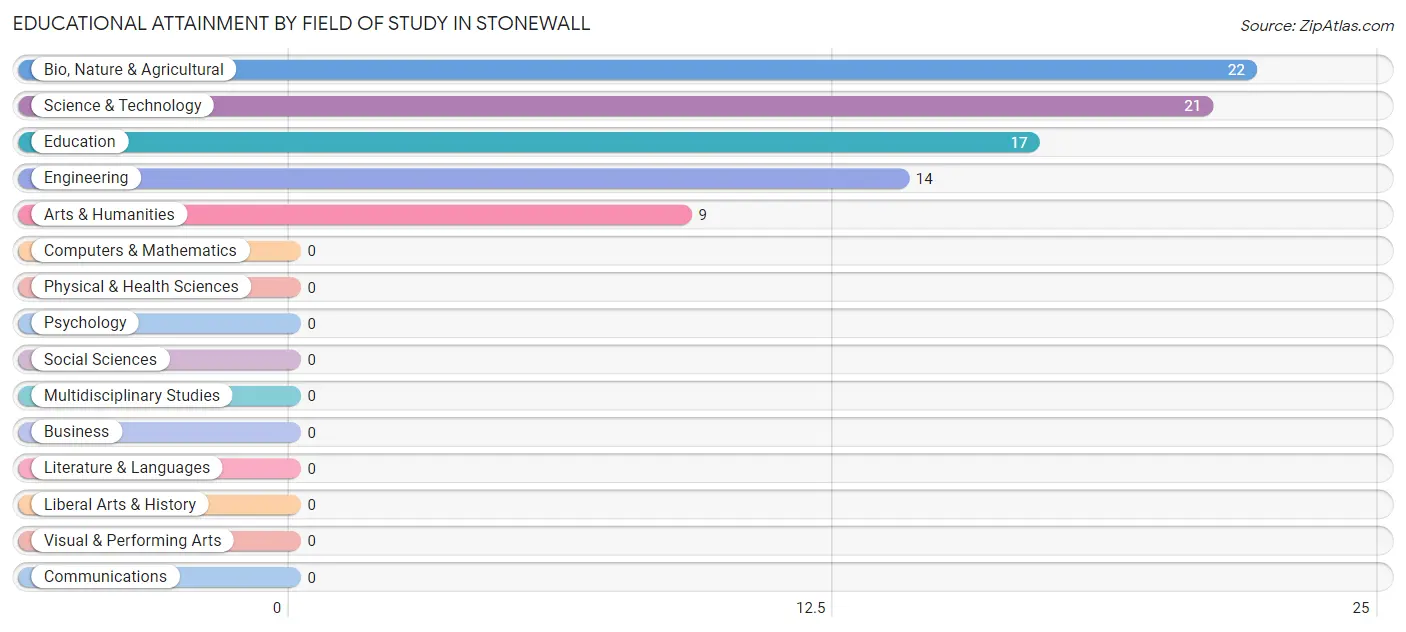
Educational Attainment by Field of Study in Stonewall
Bio, nature & agricultural (22 | 26.5%), science & technology (21 | 25.3%), education (17 | 20.5%), engineering (14 | 16.9%), and arts & humanities (9 | 10.8%) are the most common fields of study among 83 individuals in Stonewall who have obtained a bachelor's degree or higher.
| Field of Study | # Graduates | % Graduates |
| Computers & Mathematics | 0 | 0.0% |
| Bio, Nature & Agricultural | 22 | 26.5% |
| Physical & Health Sciences | 0 | 0.0% |
| Psychology | 0 | 0.0% |
| Social Sciences | 0 | 0.0% |
| Engineering | 14 | 16.9% |
| Multidisciplinary Studies | 0 | 0.0% |
| Science & Technology | 21 | 25.3% |
| Business | 0 | 0.0% |
| Education | 17 | 20.5% |
| Literature & Languages | 0 | 0.0% |
| Liberal Arts & History | 0 | 0.0% |
| Visual & Performing Arts | 0 | 0.0% |
| Communications | 0 | 0.0% |
| Arts & Humanities | 9 | 10.8% |
| Total | 83 | 100.0% |
Transportation & Commute in Stonewall
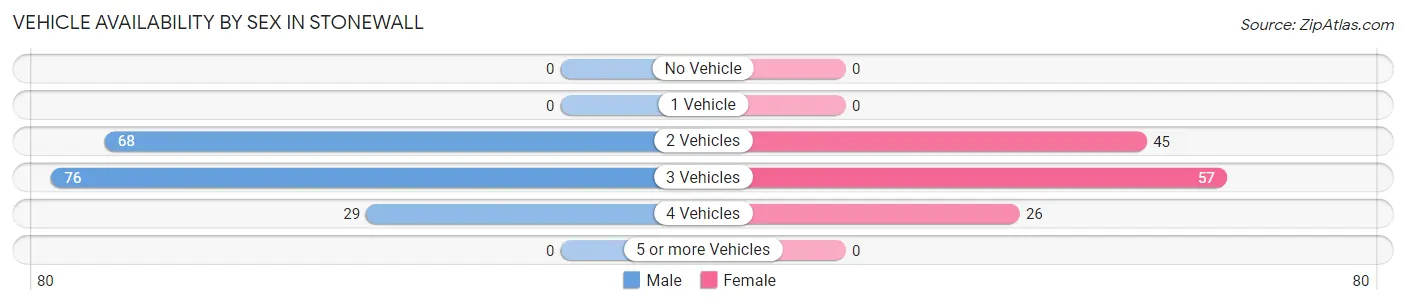
Vehicle Availability by Sex in Stonewall
The most prevalent vehicle ownership categories in Stonewall are males with 3 vehicles (76, accounting for 43.9%) and females with 3 vehicles (57, making up 59.4%).
| Vehicles Available | Male | Female |
| No Vehicle | 0 (0.0%) | 0 (0.0%) |
| 1 Vehicle | 0 (0.0%) | 0 (0.0%) |
| 2 Vehicles | 68 (39.3%) | 45 (35.2%) |
| 3 Vehicles | 76 (43.9%) | 57 (44.5%) |
| 4 Vehicles | 29 (16.8%) | 26 (20.3%) |
| 5 or more Vehicles | 0 (0.0%) | 0 (0.0%) |
| Total | 173 (100.0%) | 128 (100.0%) |
Commute Time in Stonewall
The most frequently occuring commute durations in Stonewall are 20 to 24 minutes (132 commuters, 47.6%), 5 to 9 minutes (36 commuters, 13.0%), and 15 to 19 minutes (35 commuters, 12.6%).
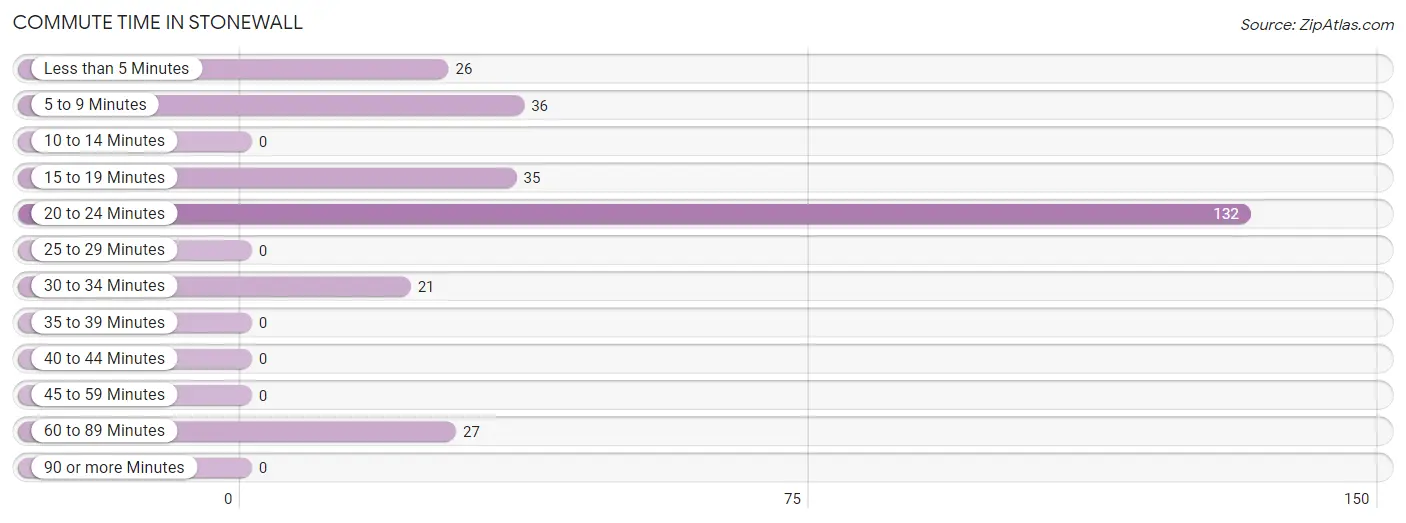
| Commute Time | # Commuters | % Commuters |
| Less than 5 Minutes | 26 | 9.4% |
| 5 to 9 Minutes | 36 | 13.0% |
| 10 to 14 Minutes | 0 | 0.0% |
| 15 to 19 Minutes | 35 | 12.6% |
| 20 to 24 Minutes | 132 | 47.6% |
| 25 to 29 Minutes | 0 | 0.0% |
| 30 to 34 Minutes | 21 | 7.6% |
| 35 to 39 Minutes | 0 | 0.0% |
| 40 to 44 Minutes | 0 | 0.0% |
| 45 to 59 Minutes | 0 | 0.0% |
| 60 to 89 Minutes | 27 | 9.8% |
| 90 or more Minutes | 0 | 0.0% |
Commute Time by Sex in Stonewall
The most common commute times in Stonewall are 20 to 24 minutes (96 commuters, 64.4%) for males and 20 to 24 minutes (36 commuters, 28.1%) for females.
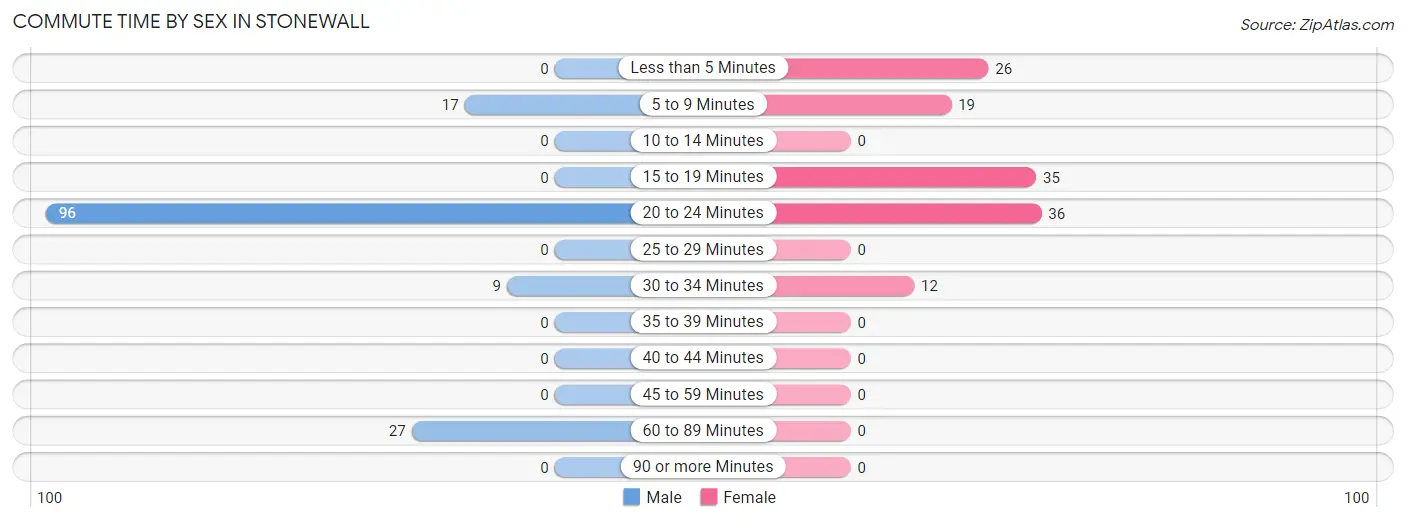
| Commute Time | Male | Female |
| Less than 5 Minutes | 0 (0.0%) | 26 (20.3%) |
| 5 to 9 Minutes | 17 (11.4%) | 19 (14.8%) |
| 10 to 14 Minutes | 0 (0.0%) | 0 (0.0%) |
| 15 to 19 Minutes | 0 (0.0%) | 35 (27.3%) |
| 20 to 24 Minutes | 96 (64.4%) | 36 (28.1%) |
| 25 to 29 Minutes | 0 (0.0%) | 0 (0.0%) |
| 30 to 34 Minutes | 9 (6.0%) | 12 (9.4%) |
| 35 to 39 Minutes | 0 (0.0%) | 0 (0.0%) |
| 40 to 44 Minutes | 0 (0.0%) | 0 (0.0%) |
| 45 to 59 Minutes | 0 (0.0%) | 0 (0.0%) |
| 60 to 89 Minutes | 27 (18.1%) | 0 (0.0%) |
| 90 or more Minutes | 0 (0.0%) | 0 (0.0%) |
Time of Departure to Work by Sex in Stonewall
The most frequent times of departure to work in Stonewall are 7:30 AM to 7:59 AM (47, 31.5%) for males and 10:00 AM to 10:59 AM (34, 26.6%) for females.
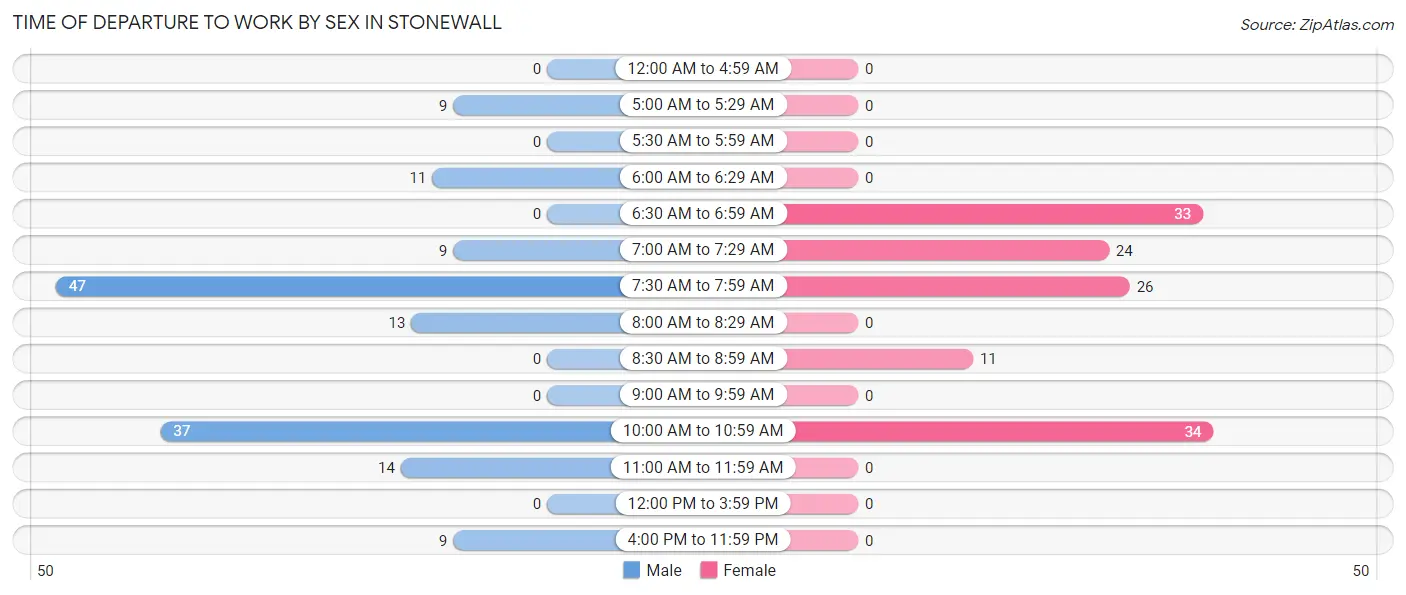
| Time of Departure | Male | Female |
| 12:00 AM to 4:59 AM | 0 (0.0%) | 0 (0.0%) |
| 5:00 AM to 5:29 AM | 9 (6.0%) | 0 (0.0%) |
| 5:30 AM to 5:59 AM | 0 (0.0%) | 0 (0.0%) |
| 6:00 AM to 6:29 AM | 11 (7.4%) | 0 (0.0%) |
| 6:30 AM to 6:59 AM | 0 (0.0%) | 33 (25.8%) |
| 7:00 AM to 7:29 AM | 9 (6.0%) | 24 (18.8%) |
| 7:30 AM to 7:59 AM | 47 (31.5%) | 26 (20.3%) |
| 8:00 AM to 8:29 AM | 13 (8.7%) | 0 (0.0%) |
| 8:30 AM to 8:59 AM | 0 (0.0%) | 11 (8.6%) |
| 9:00 AM to 9:59 AM | 0 (0.0%) | 0 (0.0%) |
| 10:00 AM to 10:59 AM | 37 (24.8%) | 34 (26.6%) |
| 11:00 AM to 11:59 AM | 14 (9.4%) | 0 (0.0%) |
| 12:00 PM to 3:59 PM | 0 (0.0%) | 0 (0.0%) |
| 4:00 PM to 11:59 PM | 9 (6.0%) | 0 (0.0%) |
| Total | 149 (100.0%) | 128 (100.0%) |
Housing Occupancy in Stonewall
Occupancy by Ownership in Stonewall
Of the total 181 dwellings in Stonewall, owner-occupied units account for 162 (89.5%), while renter-occupied units make up 19 (10.5%).
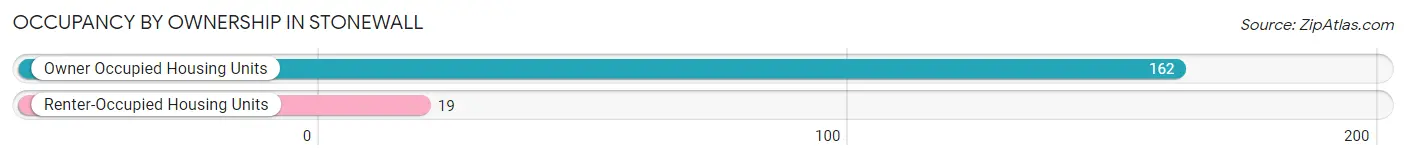
| Occupancy | # Housing Units | % Housing Units |
| Owner Occupied Housing Units | 162 | 89.5% |
| Renter-Occupied Housing Units | 19 | 10.5% |
| Total Occupied Housing Units | 181 | 100.0% |
Occupancy by Household Size in Stonewall
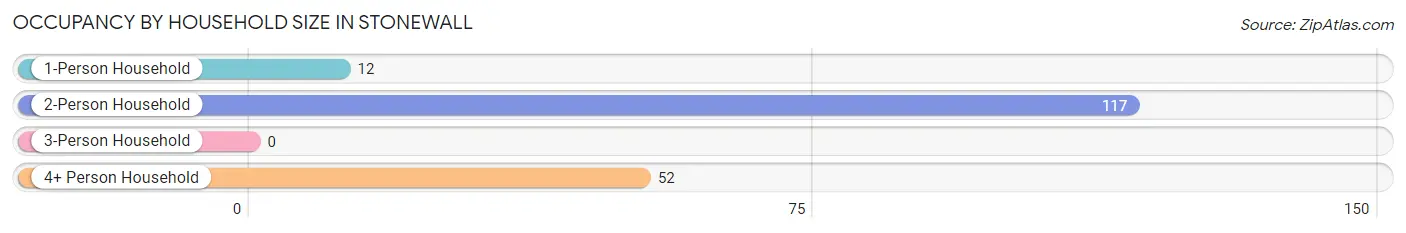
| Household Size | # Housing Units | % Housing Units |
| 1-Person Household | 12 | 6.6% |
| 2-Person Household | 117 | 64.6% |
| 3-Person Household | 0 | 0.0% |
| 4+ Person Household | 52 | 28.7% |
| Total Housing Units | 181 | 100.0% |
Occupancy by Ownership by Household Size in Stonewall
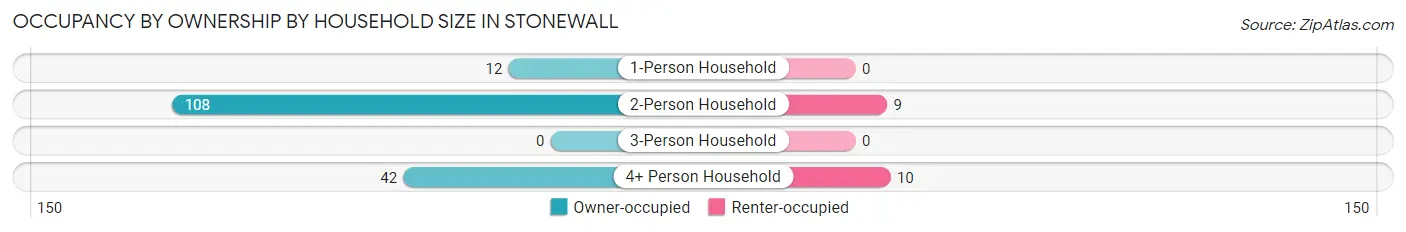
| Household Size | Owner-occupied | Renter-occupied |
| 1-Person Household | 12 (100.0%) | 0 (0.0%) |
| 2-Person Household | 108 (92.3%) | 9 (7.7%) |
| 3-Person Household | 0 (0.0%) | 0 (0.0%) |
| 4+ Person Household | 42 (80.8%) | 10 (19.2%) |
| Total Housing Units | 162 (89.5%) | 19 (10.5%) |
Occupancy by Educational Attainment in Stonewall
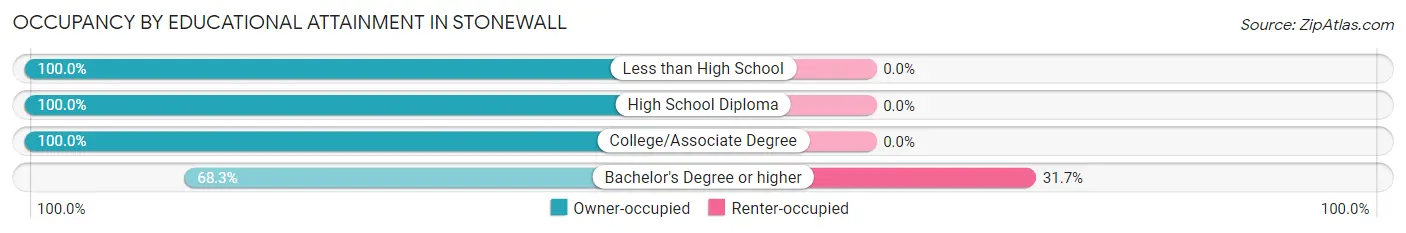
| Household Size | Owner-occupied | Renter-occupied |
| Less than High School | 35 (100.0%) | 0 (0.0%) |
| High School Diploma | 56 (100.0%) | 0 (0.0%) |
| College/Associate Degree | 30 (100.0%) | 0 (0.0%) |
| Bachelor's Degree or higher | 41 (68.3%) | 19 (31.7%) |
Occupancy by Age of Householder in Stonewall
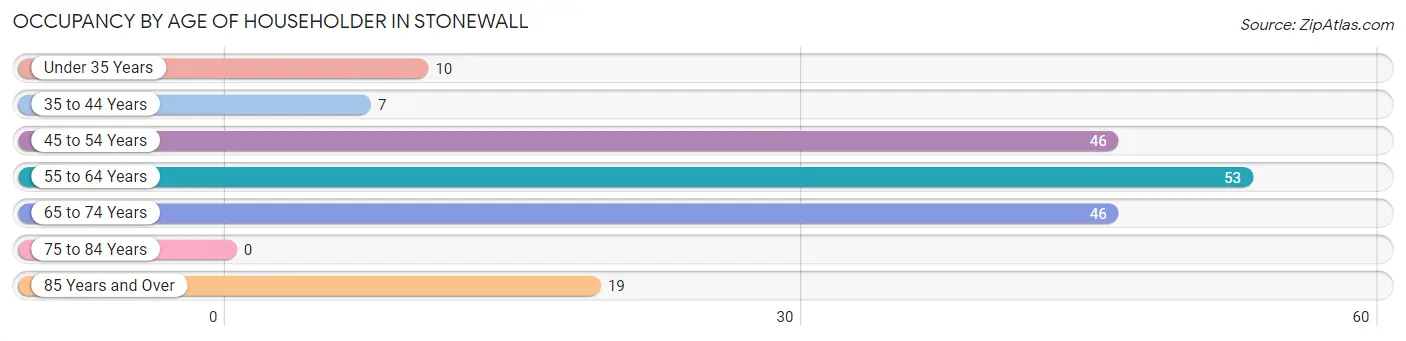
| Age Bracket | # Households | % Households |
| Under 35 Years | 10 | 5.5% |
| 35 to 44 Years | 7 | 3.9% |
| 45 to 54 Years | 46 | 25.4% |
| 55 to 64 Years | 53 | 29.3% |
| 65 to 74 Years | 46 | 25.4% |
| 75 to 84 Years | 0 | 0.0% |
| 85 Years and Over | 19 | 10.5% |
| Total | 181 | 100.0% |
Housing Finances in Stonewall
Median Income by Occupancy in Stonewall
| Occupancy Type | # Households | Median Income |
| Owner-Occupied | 162 (89.5%) | $0 |
| Renter-Occupied | 19 (10.5%) | $0 |
| Average | 181 (100.0%) | $0 |
Occupancy by Householder Income Bracket in Stonewall
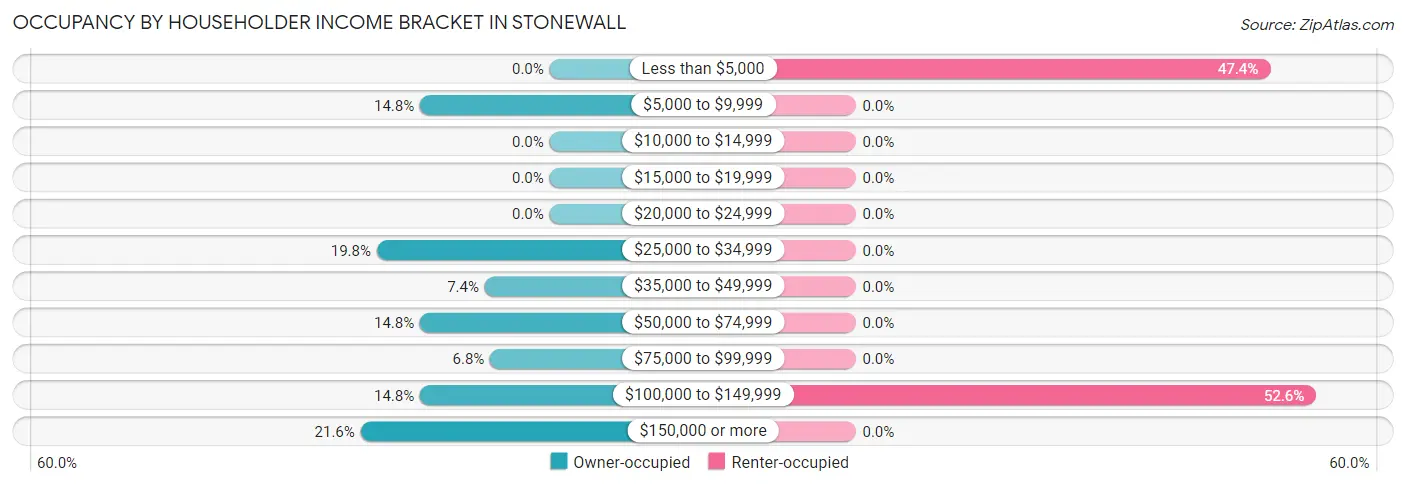
| Income Bracket | Owner-occupied | Renter-occupied |
| Less than $5,000 | 0 (0.0%) | 9 (47.4%) |
| $5,000 to $9,999 | 24 (14.8%) | 0 (0.0%) |
| $10,000 to $14,999 | 0 (0.0%) | 0 (0.0%) |
| $15,000 to $19,999 | 0 (0.0%) | 0 (0.0%) |
| $20,000 to $24,999 | 0 (0.0%) | 0 (0.0%) |
| $25,000 to $34,999 | 32 (19.8%) | 0 (0.0%) |
| $35,000 to $49,999 | 12 (7.4%) | 0 (0.0%) |
| $50,000 to $74,999 | 24 (14.8%) | 0 (0.0%) |
| $75,000 to $99,999 | 11 (6.8%) | 0 (0.0%) |
| $100,000 to $149,999 | 24 (14.8%) | 10 (52.6%) |
| $150,000 or more | 35 (21.6%) | 0 (0.0%) |
| Total | 162 (100.0%) | 19 (100.0%) |
Monthly Housing Cost Tiers in Stonewall
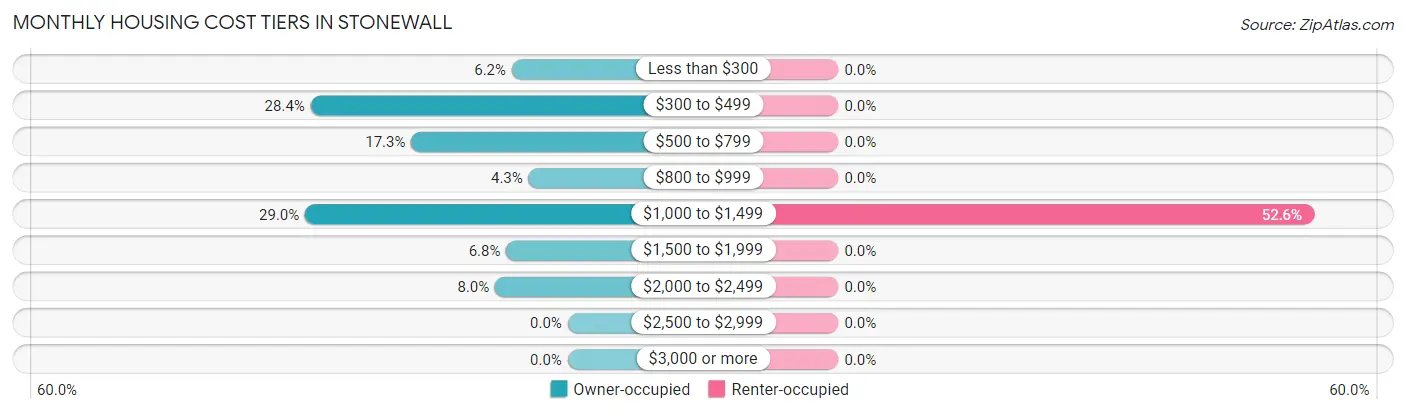
| Monthly Cost | Owner-occupied | Renter-occupied |
| Less than $300 | 10 (6.2%) | 0 (0.0%) |
| $300 to $499 | 46 (28.4%) | 0 (0.0%) |
| $500 to $799 | 28 (17.3%) | 0 (0.0%) |
| $800 to $999 | 7 (4.3%) | 0 (0.0%) |
| $1,000 to $1,499 | 47 (29.0%) | 10 (52.6%) |
| $1,500 to $1,999 | 11 (6.8%) | 0 (0.0%) |
| $2,000 to $2,499 | 13 (8.0%) | 0 (0.0%) |
| $2,500 to $2,999 | 0 (0.0%) | 0 (0.0%) |
| $3,000 or more | 0 (0.0%) | 0 (0.0%) |
| Total | 162 (100.0%) | 19 (100.0%) |
Physical Housing Characteristics in Stonewall
Housing Structures in Stonewall
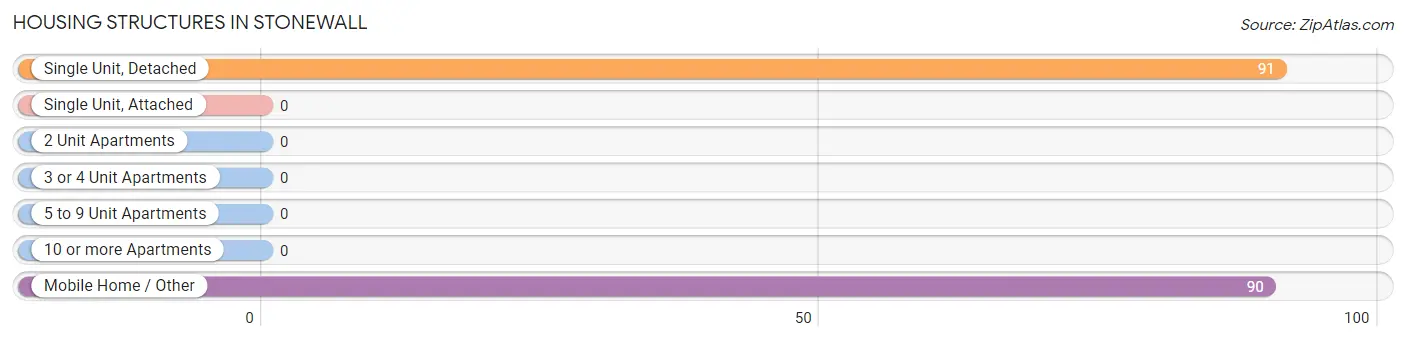
| Structure Type | # Housing Units | % Housing Units |
| Single Unit, Detached | 91 | 50.3% |
| Single Unit, Attached | 0 | 0.0% |
| 2 Unit Apartments | 0 | 0.0% |
| 3 or 4 Unit Apartments | 0 | 0.0% |
| 5 to 9 Unit Apartments | 0 | 0.0% |
| 10 or more Apartments | 0 | 0.0% |
| Mobile Home / Other | 90 | 49.7% |
| Total | 181 | 100.0% |
Housing Structures by Occupancy in Stonewall
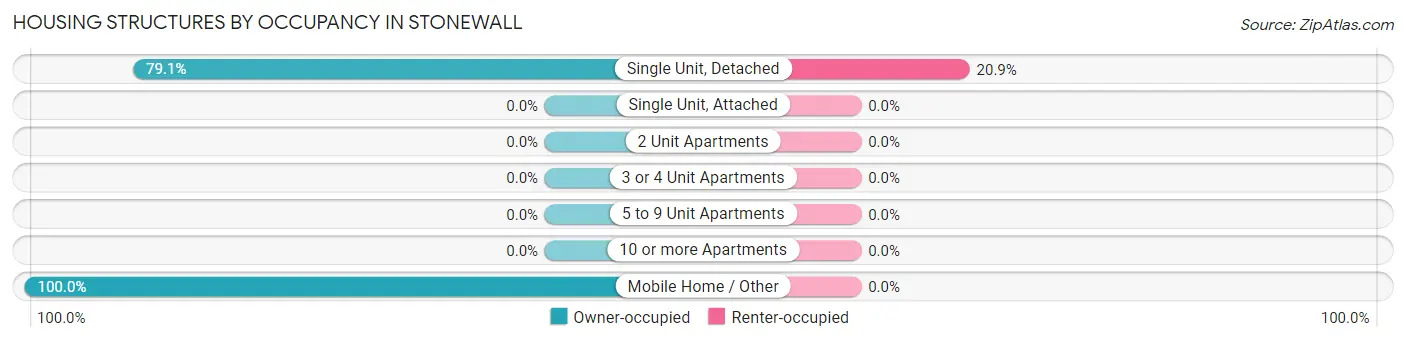
| Structure Type | Owner-occupied | Renter-occupied |
| Single Unit, Detached | 72 (79.1%) | 19 (20.9%) |
| Single Unit, Attached | 0 (0.0%) | 0 (0.0%) |
| 2 Unit Apartments | 0 (0.0%) | 0 (0.0%) |
| 3 or 4 Unit Apartments | 0 (0.0%) | 0 (0.0%) |
| 5 to 9 Unit Apartments | 0 (0.0%) | 0 (0.0%) |
| 10 or more Apartments | 0 (0.0%) | 0 (0.0%) |
| Mobile Home / Other | 90 (100.0%) | 0 (0.0%) |
| Total | 162 (89.5%) | 19 (10.5%) |
Housing Structures by Number of Rooms in Stonewall
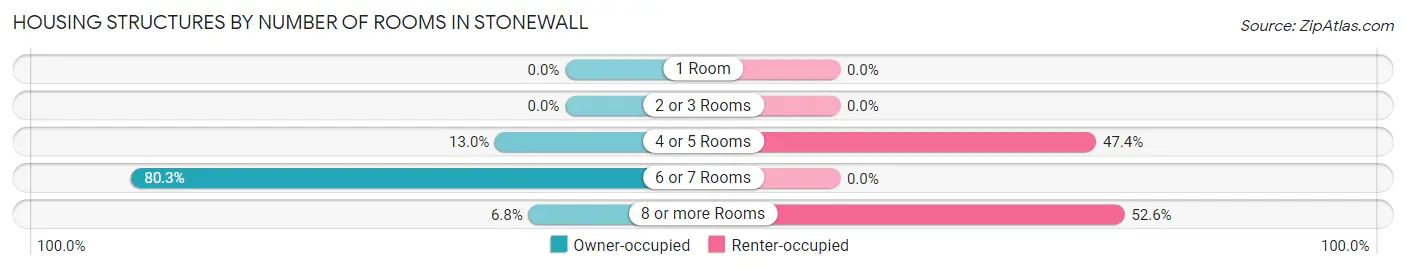
| Number of Rooms | Owner-occupied | Renter-occupied |
| 1 Room | 0 (0.0%) | 0 (0.0%) |
| 2 or 3 Rooms | 0 (0.0%) | 0 (0.0%) |
| 4 or 5 Rooms | 21 (13.0%) | 9 (47.4%) |
| 6 or 7 Rooms | 130 (80.2%) | 0 (0.0%) |
| 8 or more Rooms | 11 (6.8%) | 10 (52.6%) |
| Total | 162 (100.0%) | 19 (100.0%) |
Housing Structure by Heating Type in Stonewall
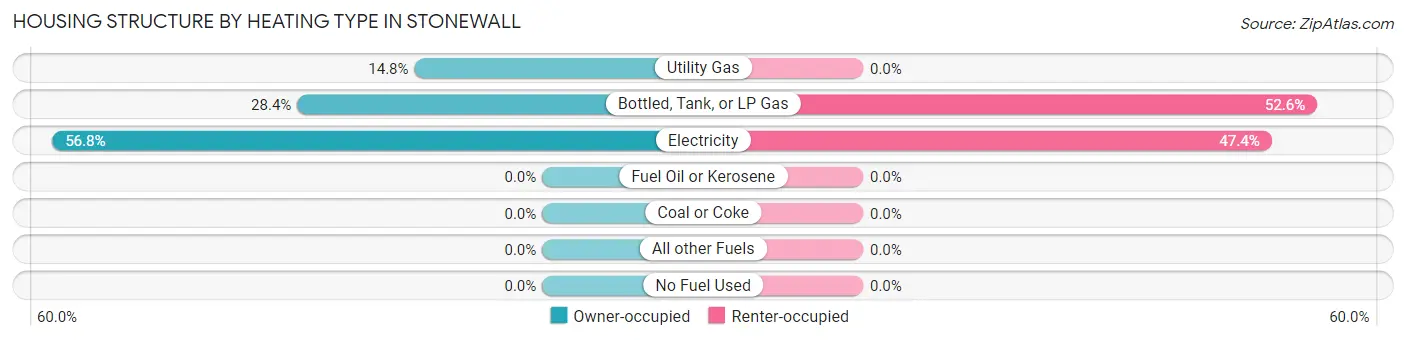
| Heating Type | Owner-occupied | Renter-occupied |
| Utility Gas | 24 (14.8%) | 0 (0.0%) |
| Bottled, Tank, or LP Gas | 46 (28.4%) | 10 (52.6%) |
| Electricity | 92 (56.8%) | 9 (47.4%) |
| Fuel Oil or Kerosene | 0 (0.0%) | 0 (0.0%) |
| Coal or Coke | 0 (0.0%) | 0 (0.0%) |
| All other Fuels | 0 (0.0%) | 0 (0.0%) |
| No Fuel Used | 0 (0.0%) | 0 (0.0%) |
| Total | 162 (100.0%) | 19 (100.0%) |
Household Vehicle Usage in Stonewall
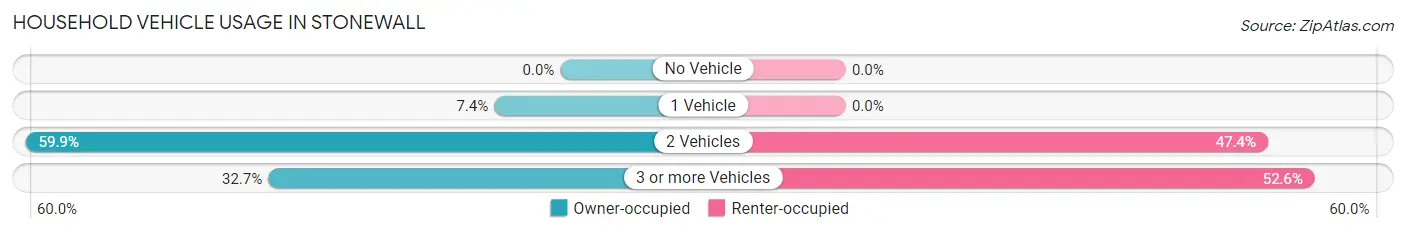
| Vehicles per Household | Owner-occupied | Renter-occupied |
| No Vehicle | 0 (0.0%) | 0 (0.0%) |
| 1 Vehicle | 12 (7.4%) | 0 (0.0%) |
| 2 Vehicles | 97 (59.9%) | 9 (47.4%) |
| 3 or more Vehicles | 53 (32.7%) | 10 (52.6%) |
| Total | 162 (100.0%) | 19 (100.0%) |
Real Estate & Mortgages in Stonewall
Real Estate and Mortgage Overview in Stonewall
| Characteristic | Without Mortgage | With Mortgage |
| Housing Units | 91 | 71 |
| Median Property Value | - | - |
| Median Household Income | - | - |
| Monthly Housing Costs | $477 | $0 |
| Real Estate Taxes | $2,880 | $0 |
Property Value by Mortgage Status in Stonewall
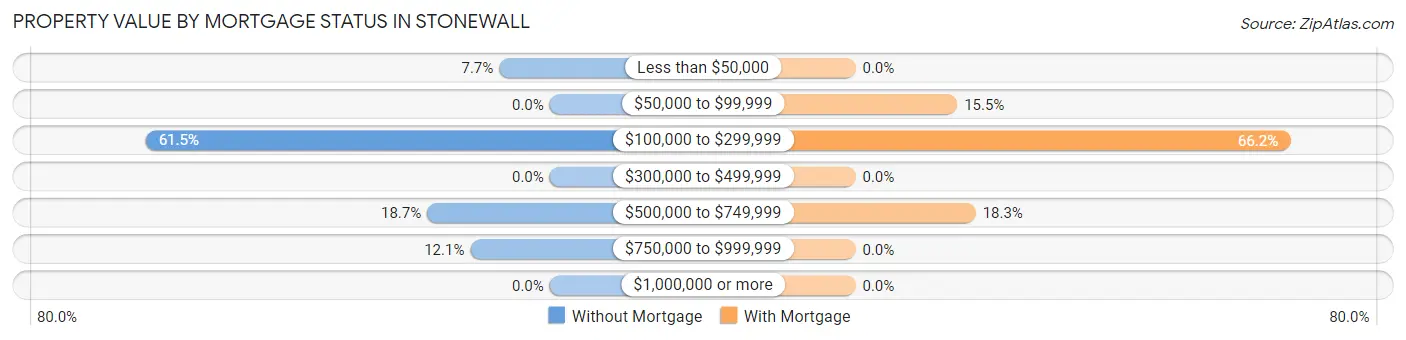
| Property Value | Without Mortgage | With Mortgage |
| Less than $50,000 | 7 (7.7%) | 0 (0.0%) |
| $50,000 to $99,999 | 0 (0.0%) | 11 (15.5%) |
| $100,000 to $299,999 | 56 (61.5%) | 47 (66.2%) |
| $300,000 to $499,999 | 0 (0.0%) | 0 (0.0%) |
| $500,000 to $749,999 | 17 (18.7%) | 13 (18.3%) |
| $750,000 to $999,999 | 11 (12.1%) | 0 (0.0%) |
| $1,000,000 or more | 0 (0.0%) | 0 (0.0%) |
| Total | 91 (100.0%) | 71 (100.0%) |
Household Income by Mortgage Status in Stonewall
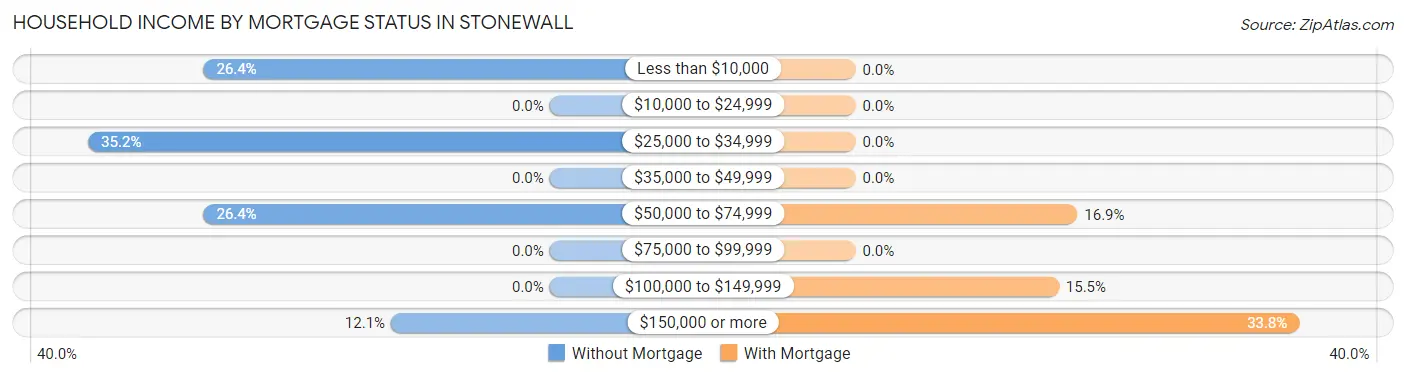
| Household Income | Without Mortgage | With Mortgage |
| Less than $10,000 | 24 (26.4%) | 0 (0.0%) |
| $10,000 to $24,999 | 0 (0.0%) | 0 (0.0%) |
| $25,000 to $34,999 | 32 (35.2%) | 0 (0.0%) |
| $35,000 to $49,999 | 0 (0.0%) | 0 (0.0%) |
| $50,000 to $74,999 | 24 (26.4%) | 12 (16.9%) |
| $75,000 to $99,999 | 0 (0.0%) | 0 (0.0%) |
| $100,000 to $149,999 | 0 (0.0%) | 11 (15.5%) |
| $150,000 or more | 11 (12.1%) | 24 (33.8%) |
| Total | 91 (100.0%) | 71 (100.0%) |
Property Value to Household Income Ratio in Stonewall
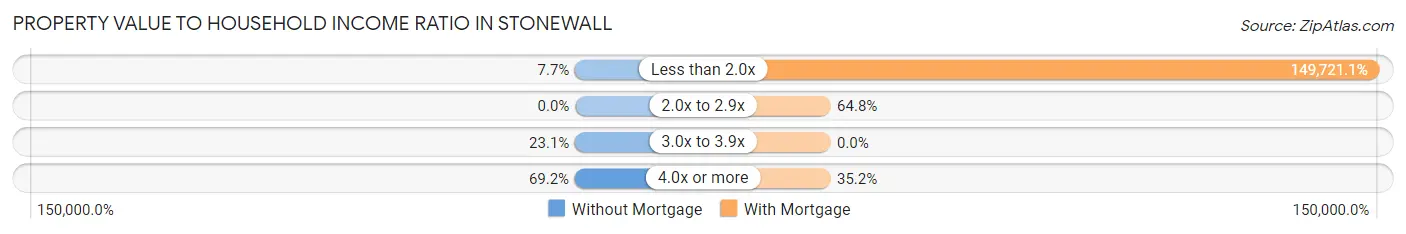
| Value-to-Income Ratio | Without Mortgage | With Mortgage |
| Less than 2.0x | 7 (7.7%) | 106,302 (149,721.1%) |
| 2.0x to 2.9x | 0 (0.0%) | 46 (64.8%) |
| 3.0x to 3.9x | 21 (23.1%) | 0 (0.0%) |
| 4.0x or more | 63 (69.2%) | 25 (35.2%) |
| Total | 91 (100.0%) | 71 (100.0%) |
Real Estate Taxes by Mortgage Status in Stonewall
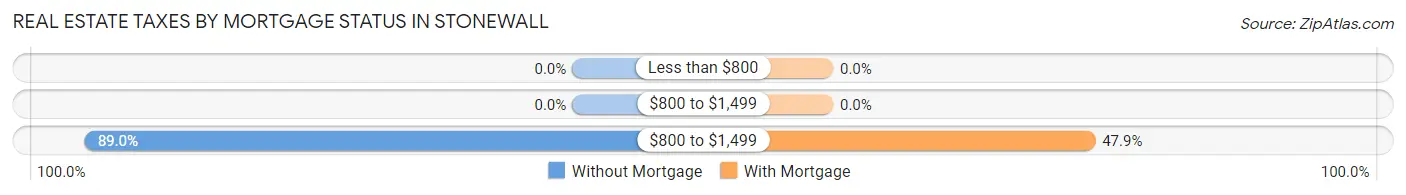
| Property Taxes | Without Mortgage | With Mortgage |
| Less than $800 | 0 (0.0%) | 0 (0.0%) |
| $800 to $1,499 | 0 (0.0%) | 0 (0.0%) |
| $800 to $1,499 | 81 (89.0%) | 34 (47.9%) |
| Total | 91 (100.0%) | 71 (100.0%) |
Health & Disability in Stonewall
Health Insurance Coverage by Age in Stonewall
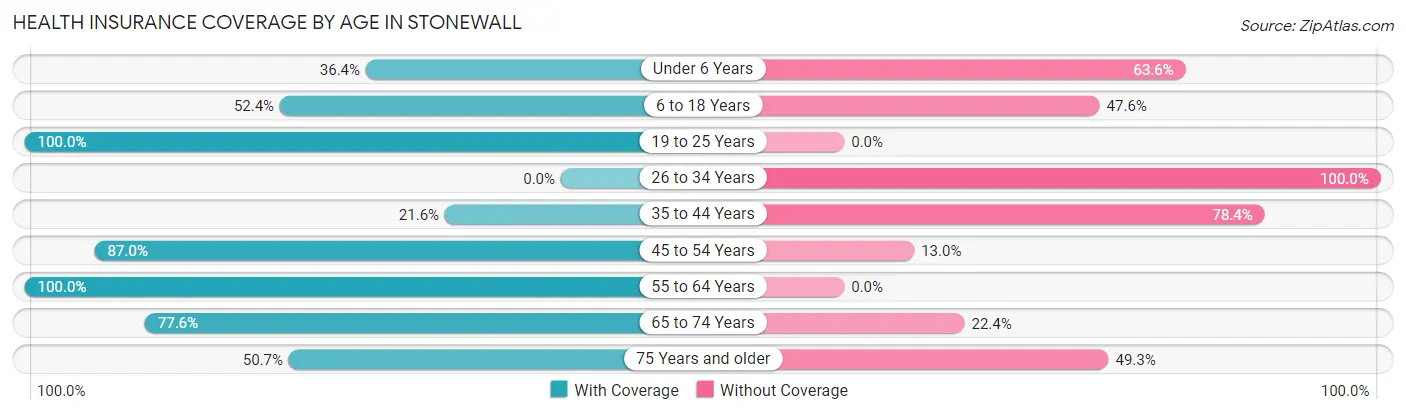
| Age Bracket | With Coverage | Without Coverage |
| Under 6 Years | 8 (36.4%) | 14 (63.6%) |
| 6 to 18 Years | 11 (52.4%) | 10 (47.6%) |
| 19 to 25 Years | 40 (100.0%) | 0 (0.0%) |
| 26 to 34 Years | 0 (0.0%) | 10 (100.0%) |
| 35 to 44 Years | 16 (21.6%) | 58 (78.4%) |
| 45 to 54 Years | 60 (87.0%) | 9 (13.0%) |
| 55 to 64 Years | 145 (100.0%) | 0 (0.0%) |
| 65 to 74 Years | 83 (77.6%) | 24 (22.4%) |
| 75 Years and older | 35 (50.7%) | 34 (49.3%) |
| Total | 398 (71.5%) | 159 (28.5%) |
Health Insurance Coverage by Citizenship Status in Stonewall
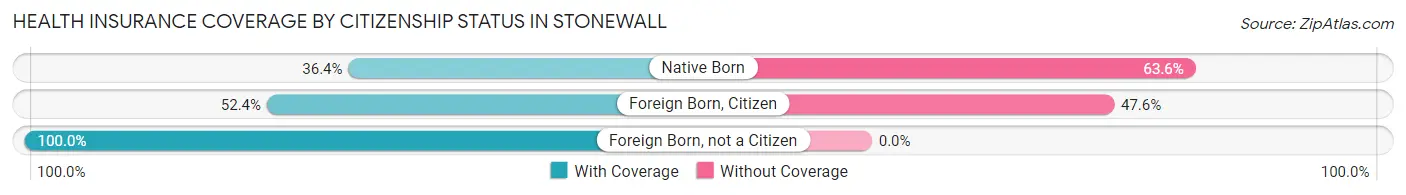
| Citizenship Status | With Coverage | Without Coverage |
| Native Born | 8 (36.4%) | 14 (63.6%) |
| Foreign Born, Citizen | 11 (52.4%) | 10 (47.6%) |
| Foreign Born, not a Citizen | 40 (100.0%) | 0 (0.0%) |
Health Insurance Coverage by Household Income in Stonewall
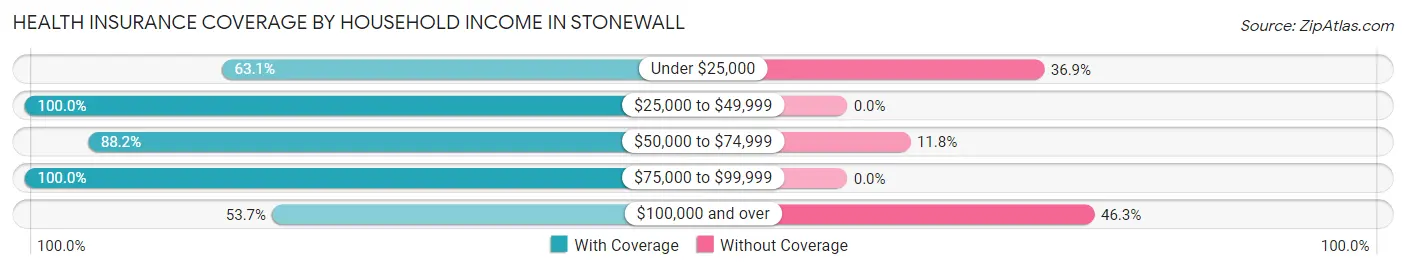
| Household Income | With Coverage | Without Coverage |
| Under $25,000 | 41 (63.1%) | 24 (36.9%) |
| $25,000 to $49,999 | 89 (100.0%) | 0 (0.0%) |
| $50,000 to $74,999 | 67 (88.2%) | 9 (11.8%) |
| $75,000 to $99,999 | 55 (100.0%) | 0 (0.0%) |
| $100,000 and over | 146 (53.7%) | 126 (46.3%) |
Public vs Private Health Insurance Coverage by Age in Stonewall
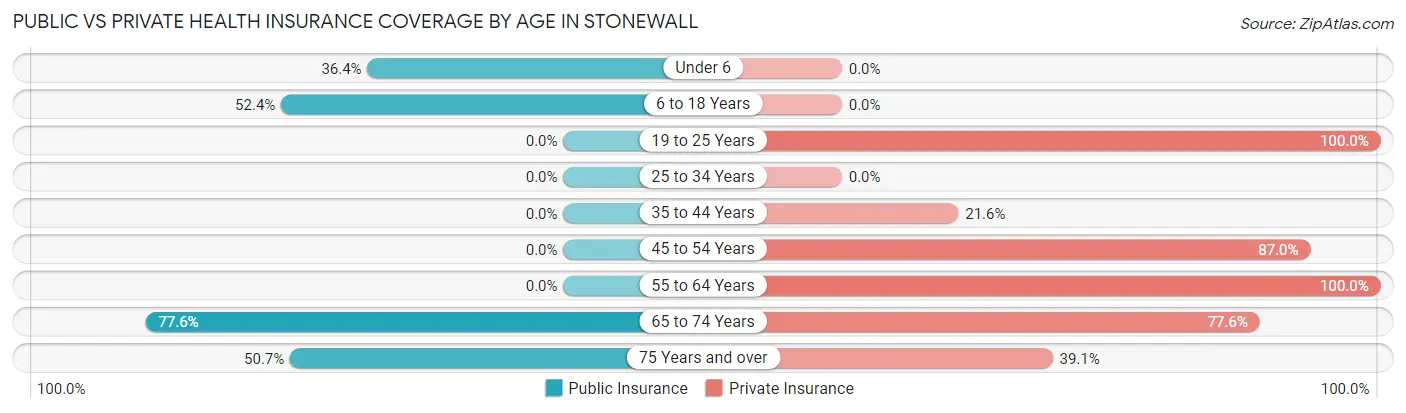
| Age Bracket | Public Insurance | Private Insurance |
| Under 6 | 8 (36.4%) | 0 (0.0%) |
| 6 to 18 Years | 11 (52.4%) | 0 (0.0%) |
| 19 to 25 Years | 0 (0.0%) | 40 (100.0%) |
| 25 to 34 Years | 0 (0.0%) | 0 (0.0%) |
| 35 to 44 Years | 0 (0.0%) | 16 (21.6%) |
| 45 to 54 Years | 0 (0.0%) | 60 (87.0%) |
| 55 to 64 Years | 0 (0.0%) | 145 (100.0%) |
| 65 to 74 Years | 83 (77.6%) | 83 (77.6%) |
| 75 Years and over | 35 (50.7%) | 27 (39.1%) |
| Total | 137 (24.6%) | 371 (66.6%) |
Disability Status by Sex by Age in Stonewall
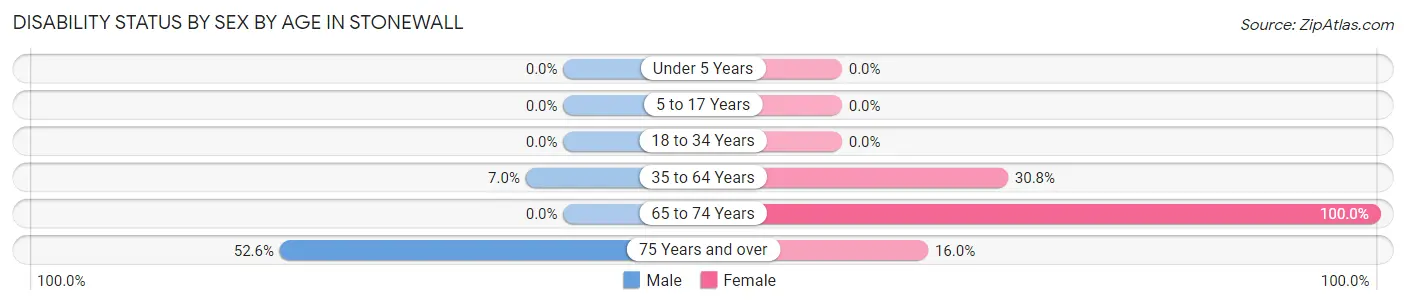
| Age Bracket | Male | Female |
| Under 5 Years | 0 (0.0%) | 0 (0.0%) |
| 5 to 17 Years | 0 (0.0%) | 0 (0.0%) |
| 18 to 34 Years | 0 (0.0%) | 0 (0.0%) |
| 35 to 64 Years | 9 (7.0%) | 49 (30.8%) |
| 65 to 74 Years | 0 (0.0%) | 46 (100.0%) |
| 75 Years and over | 10 (52.6%) | 8 (16.0%) |
Disability Class by Sex by Age in Stonewall
Disability Class: Hearing Difficulty
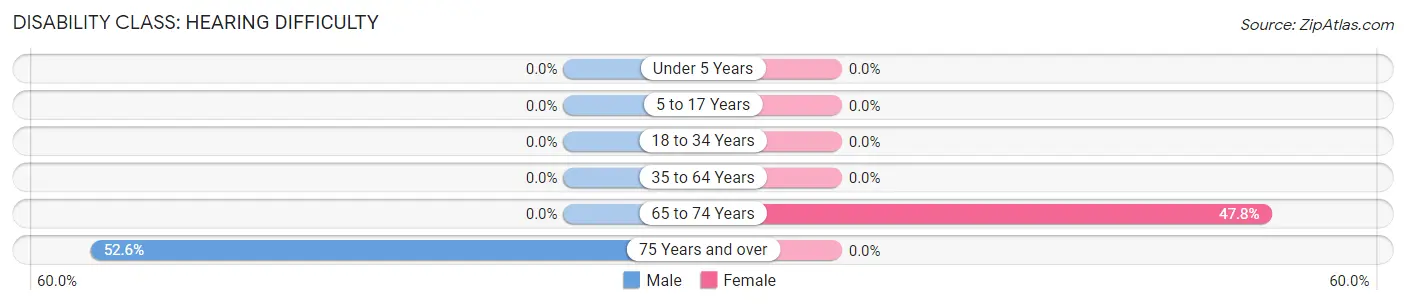
| Age Bracket | Male | Female |
| Under 5 Years | 0 (0.0%) | 0 (0.0%) |
| 5 to 17 Years | 0 (0.0%) | 0 (0.0%) |
| 18 to 34 Years | 0 (0.0%) | 0 (0.0%) |
| 35 to 64 Years | 0 (0.0%) | 0 (0.0%) |
| 65 to 74 Years | 0 (0.0%) | 22 (47.8%) |
| 75 Years and over | 10 (52.6%) | 0 (0.0%) |
Disability Class: Vision Difficulty
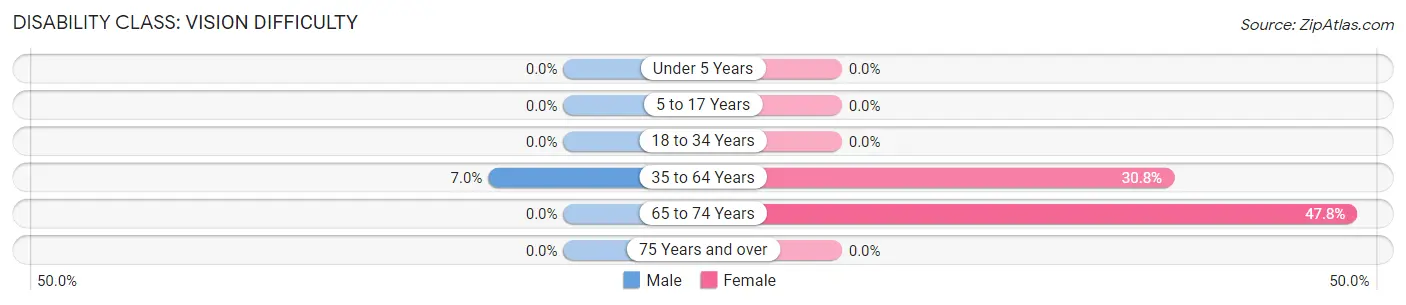
| Age Bracket | Male | Female |
| Under 5 Years | 0 (0.0%) | 0 (0.0%) |
| 5 to 17 Years | 0 (0.0%) | 0 (0.0%) |
| 18 to 34 Years | 0 (0.0%) | 0 (0.0%) |
| 35 to 64 Years | 9 (7.0%) | 49 (30.8%) |
| 65 to 74 Years | 0 (0.0%) | 22 (47.8%) |
| 75 Years and over | 0 (0.0%) | 0 (0.0%) |
Disability Class: Cognitive Difficulty
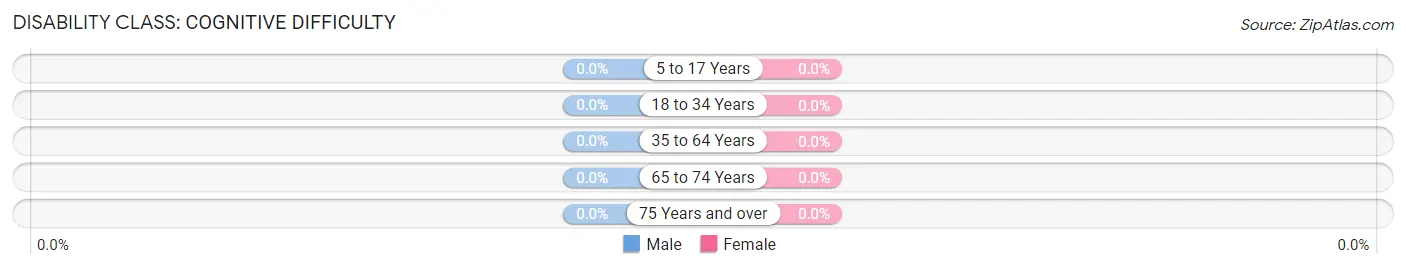
| Age Bracket | Male | Female |
| 5 to 17 Years | 0 (0.0%) | 0 (0.0%) |
| 18 to 34 Years | 0 (0.0%) | 0 (0.0%) |
| 35 to 64 Years | 0 (0.0%) | 0 (0.0%) |
| 65 to 74 Years | 0 (0.0%) | 0 (0.0%) |
| 75 Years and over | 0 (0.0%) | 0 (0.0%) |
Disability Class: Ambulatory Difficulty
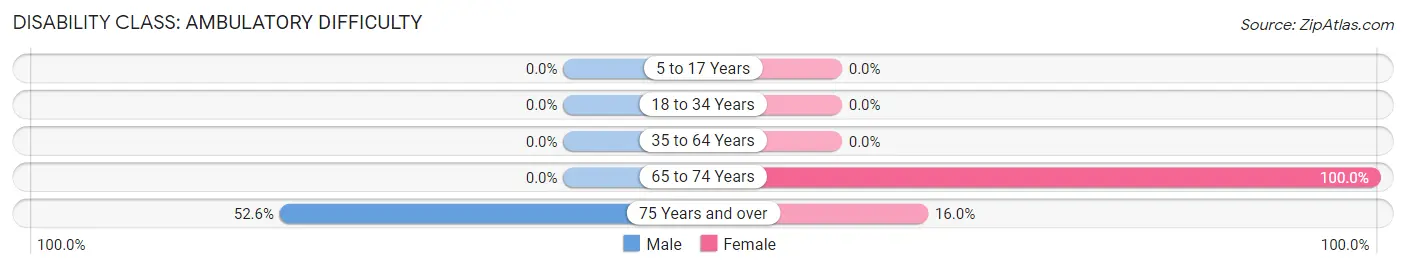
| Age Bracket | Male | Female |
| 5 to 17 Years | 0 (0.0%) | 0 (0.0%) |
| 18 to 34 Years | 0 (0.0%) | 0 (0.0%) |
| 35 to 64 Years | 0 (0.0%) | 0 (0.0%) |
| 65 to 74 Years | 0 (0.0%) | 46 (100.0%) |
| 75 Years and over | 10 (52.6%) | 8 (16.0%) |
Disability Class: Self-Care Difficulty
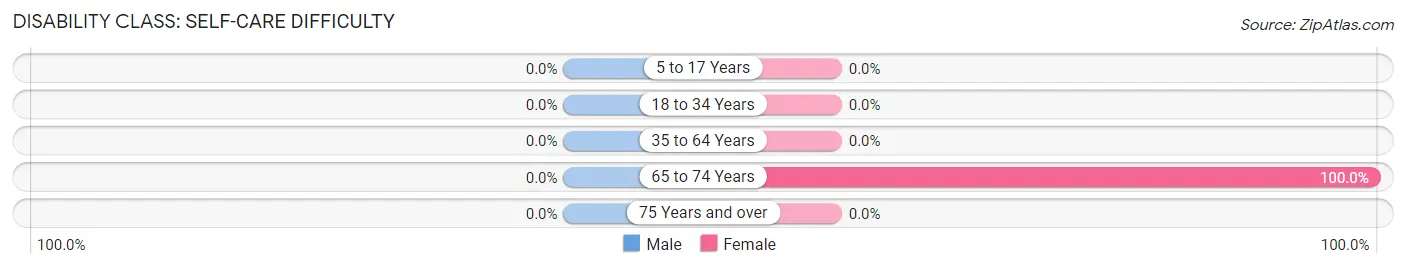
| Age Bracket | Male | Female |
| 5 to 17 Years | 0 (0.0%) | 0 (0.0%) |
| 18 to 34 Years | 0 (0.0%) | 0 (0.0%) |
| 35 to 64 Years | 0 (0.0%) | 0 (0.0%) |
| 65 to 74 Years | 0 (0.0%) | 46 (100.0%) |
| 75 Years and over | 0 (0.0%) | 0 (0.0%) |
Technology Access in Stonewall
Computing Device Access in Stonewall
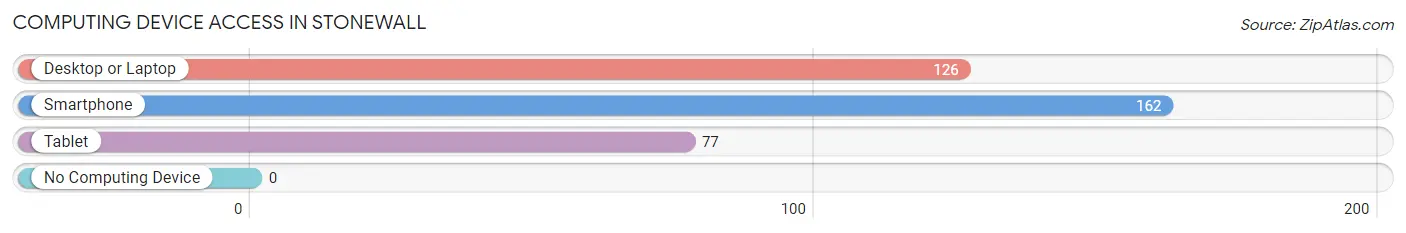
| Device Type | # Households | % Households |
| Desktop or Laptop | 126 | 69.6% |
| Smartphone | 162 | 89.5% |
| Tablet | 77 | 42.5% |
| No Computing Device | 0 | 0.0% |
| Total | 181 | 100.0% |
Internet Access in Stonewall
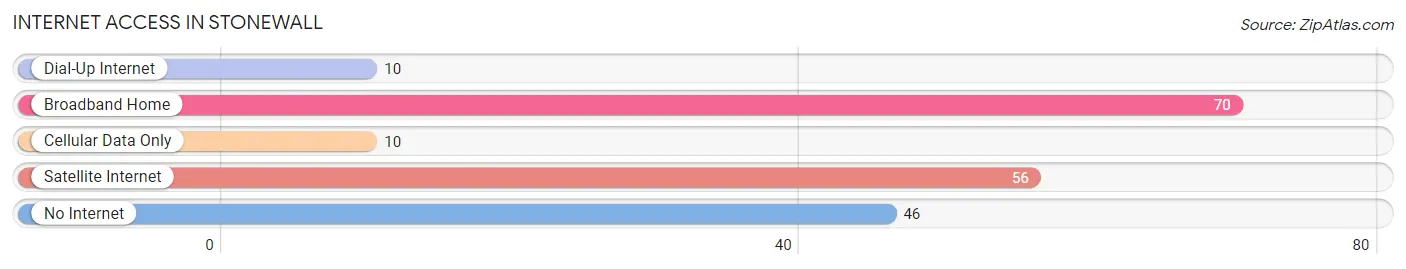
| Internet Type | # Households | % Households |
| Dial-Up Internet | 10 | 5.5% |
| Broadband Home | 70 | 38.7% |
| Cellular Data Only | 10 | 5.5% |
| Satellite Internet | 56 | 30.9% |
| No Internet | 46 | 25.4% |
| Total | 181 | 100.0% |
Stonewall Summary
Stonewall, Texas is a small town located in the Hill Country region of Central Texas. It is situated in the northern part of Gillespie County, approximately 30 miles west of Fredericksburg and 70 miles northwest of Austin. The town was named after Thomas J. “Stonewall” Jackson, a Confederate general during the Civil War. Stonewall is known for its picturesque landscape, rolling hills, and abundant wildlife.
Geography
Stonewall is located in the Hill Country region of Central Texas. It is situated in the northern part of Gillespie County, approximately 30 miles west of Fredericksburg and 70 miles northwest of Austin. The town is situated on the banks of the Pedernales River, which flows through the area. The terrain is mostly hilly, with some flat areas. The climate is generally mild, with hot summers and cool winters.
Demographics
As of the 2010 census, the population of Stonewall was 1,248. The racial makeup of the town was 94.3% White, 0.2% African American, 0.3% Native American, 0.2% Asian, 0.1% Pacific Islander, 3.3% from other races, and 1.7% from two or more races. Hispanic or Latino of any race were 8.2% of the population.
Economy
Stonewall’s economy is largely based on agriculture and tourism. The town is home to several wineries, as well as a number of small businesses. The town is also home to a number of bed and breakfasts, as well as a few restaurants. The town is also home to a number of antique stores, which attract visitors from all over the state.
History
Stonewall was founded in 1847 by German immigrants. The town was named after Thomas J. “Stonewall” Jackson, a Confederate general during the Civil War. The town was originally a farming community, but it soon became a popular tourist destination due to its picturesque landscape and abundant wildlife.
In the late 19th century, Stonewall became a popular destination for hunters and fishermen. The town was also home to a number of wineries, which attracted visitors from all over the state.
In the early 20th century, Stonewall became a popular destination for artists and writers. The town was home to a number of writers, including J. Frank Dobie, who wrote about the area in his book, The Longhorns.
In the late 20th century, Stonewall became a popular destination for tourists. The town is home to a number of wineries, as well as a number of bed and breakfasts. The town is also home to a number of antique stores, which attract visitors from all over the state.
Conclusion
Stonewall, Texas is a small town located in the Hill Country region of Central Texas. It is situated in the northern part of Gillespie County, approximately 30 miles west of Fredericksburg and 70 miles northwest of Austin. The town was named after Thomas J. “Stonewall” Jackson, a Confederate general during the Civil War. Stonewall is known for its picturesque landscape, rolling hills, and abundant wildlife. The town’s economy is largely based on agriculture and tourism. The town is home to several wineries, as well as a number of small businesses. The town is also home to a number of bed and breakfasts, as well as a few restaurants. The town is also home to a number of antique stores, which attract visitors from all over the state.
Common Questions
What is Per Capita Income in Stonewall?
Per Capita income in Stonewall is $30,455.
What is the Median Family Income in Stonewall?
Median Family Income in Stonewall is $65,893.
What is Inequality or Gini Index in Stonewall?
Inequality or Gini Index in Stonewall is 0.47.
What is the Total Population of Stonewall?
Total Population of Stonewall is 559.
What is the Total Male Population of Stonewall?
Total Male Population of Stonewall is 249.
What is the Total Female Population of Stonewall?
Total Female Population of Stonewall is 310.
What is the Ratio of Males per 100 Females in Stonewall?
There are 80.32 Males per 100 Females in Stonewall.
What is the Ratio of Females per 100 Males in Stonewall?
There are 124.50 Females per 100 Males in Stonewall.
What is the Median Population Age in Stonewall?
Median Population Age in Stonewall is 56.9 Years.
What is the Average Family Size in Stonewall
Average Family Size in Stonewall is 3.2 People.
What is the Average Household Size in Stonewall
Average Household Size in Stonewall is 3.1 People.
How Large is the Labor Force in Stonewall?
There are 301 People in the Labor Forcein in Stonewall.
What is the Percentage of People in the Labor Force in Stonewall?
57.2% of People are in the Labor Force in Stonewall.