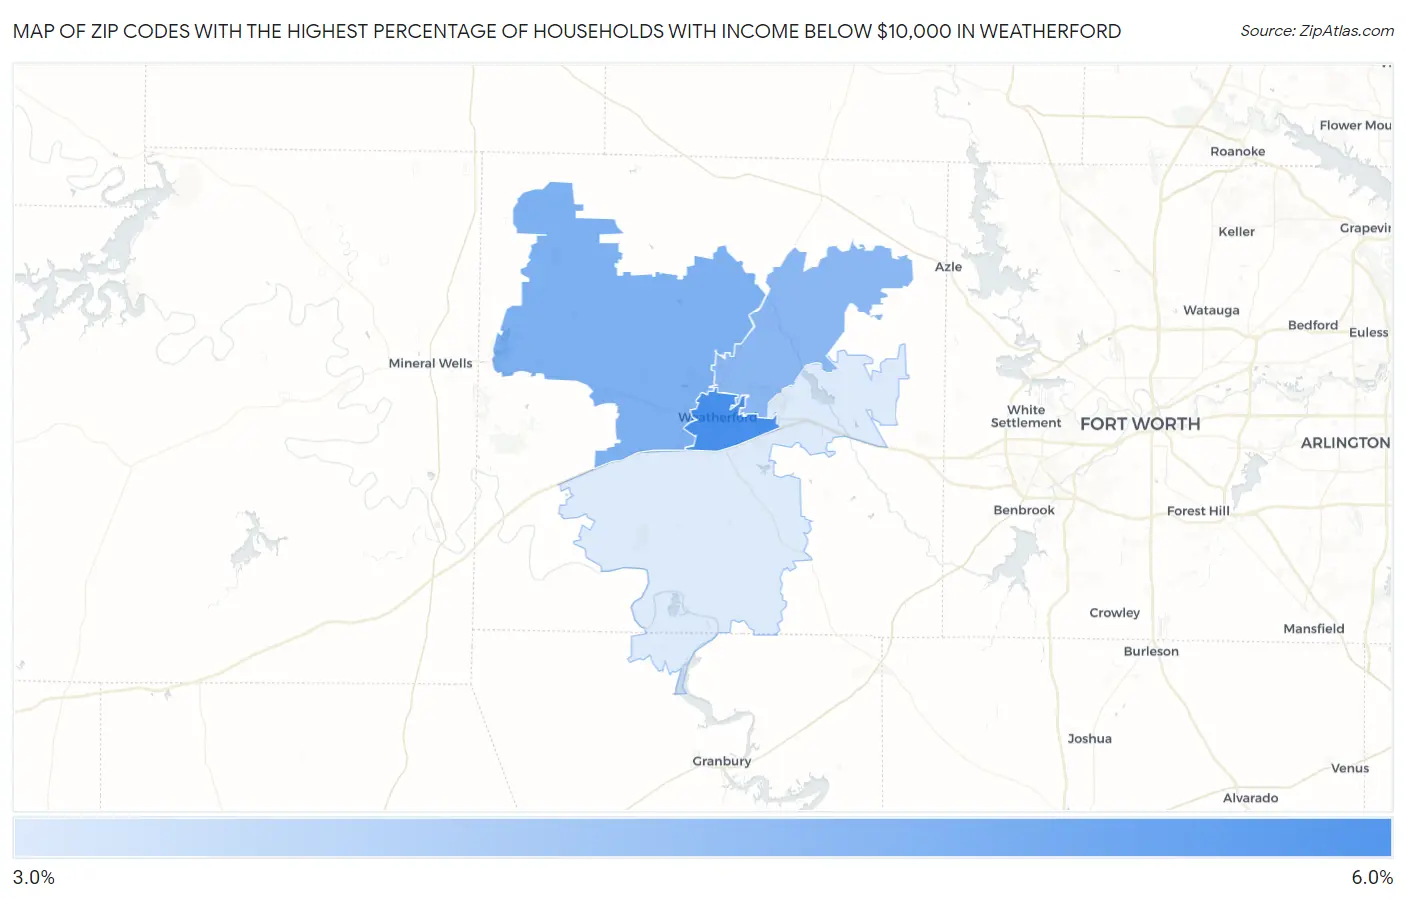
Zip Codes with the Highest Percentage of Households with Income Below $10,000 in Weatherford, TX
RELATED REPORTS & OPTIONS
Household Income | $0-10k
Weatherford
Compare Zip Codes
Map of Zip Codes with the Highest Percentage of Households with Income Below $10,000 in Weatherford
3.0%
5.2%
Zip Codes with the Highest Percentage of Households with Income Below $10,000 in Weatherford, TX
| Zip Code | Households with Income < $10k | vs State | vs National | |
| 1. | 76086 | 5.2% | 5.1%(+0.100)#735 | 4.9%(+0.300)#11,098 |
| 2. | 76088 | 4.4% | 5.1%(-0.700)#892 | 4.9%(-0.500)#13,772 |
| 3. | 76085 | 4.2% | 5.1%(-0.900)#933 | 4.9%(-0.700)#14,570 |
| 4. | 76087 | 3.0% | 5.1%(-2.10)#1,200 | 4.9%(-1.90)#19,346 |
1
Common Questions
What are the Top 3 Zip Codes with the Highest Percentage of Households with Income Below $10,000 in Weatherford, TX?
Top 3 Zip Codes with the Highest Percentage of Households with Income Below $10,000 in Weatherford, TX are:
What zip code has the Highest Percentage of Households with Income Below $10,000 in Weatherford, TX?
76086 has the Highest Percentage of Households with Income Below $10,000 in Weatherford, TX with 5.2%.
What is the Percentage of Households with Income Below $10,000 in Weatherford, TX?
Percentage of Households with Income Below $10,000 in Weatherford is 4.2%.
What is the Percentage of Households with Income Below $10,000 in Texas?
Percentage of Households with Income Below $10,000 in Texas is 5.1%.
What is the Percentage of Households with Income Below $10,000 in the United States?
Percentage of Households with Income Below $10,000 in the United States is 4.9%.