Zip Codes with the Highest Percentage of Households with Income Below $10,000 in Henderson, TX
RELATED REPORTS & OPTIONS
Household Income | $0-10k
Henderson
Compare Zip Codes
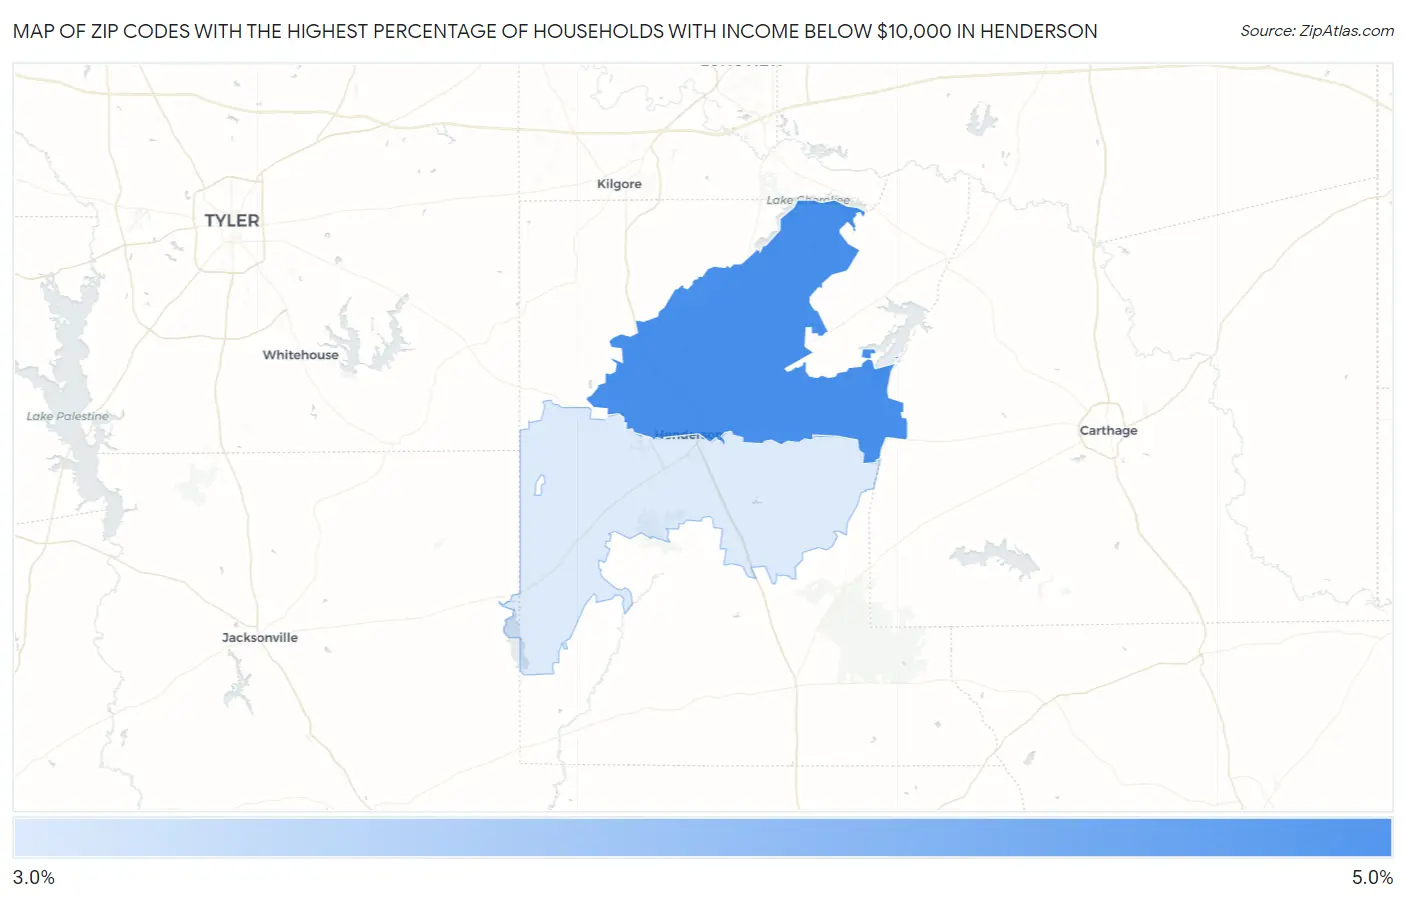
Map of Zip Codes with the Highest Percentage of Households with Income Below $10,000 in Henderson
3.2%
4.9%
Zip Codes with the Highest Percentage of Households with Income Below $10,000 in Henderson, TX
| Zip Code | Households with Income < $10k | vs State | vs National | |
| 1. | 75652 | 4.9% | 5.1%(-0.200)#806 | 4.9%(=0.000)#12,076 |
| 2. | 75654 | 3.2% | 5.1%(-1.90)#1,166 | 4.9%(-1.70)#18,596 |
1
Common Questions
What are the Top Zip Codes with the Highest Percentage of Households with Income Below $10,000 in Henderson, TX?
Top Zip Codes with the Highest Percentage of Households with Income Below $10,000 in Henderson, TX are:
What zip code has the Highest Percentage of Households with Income Below $10,000 in Henderson, TX?
75652 has the Highest Percentage of Households with Income Below $10,000 in Henderson, TX with 4.9%.
What is the Percentage of Households with Income Below $10,000 in Henderson, TX?
Percentage of Households with Income Below $10,000 in Henderson is 3.4%.
What is the Percentage of Households with Income Below $10,000 in Texas?
Percentage of Households with Income Below $10,000 in Texas is 5.1%.
What is the Percentage of Households with Income Below $10,000 in the United States?
Percentage of Households with Income Below $10,000 in the United States is 4.9%.