Godley, TX Map & Demographics
Godley Map
Godley Overview
$28,106
PER CAPITA INCOME
$86,591
AVG FAMILY INCOME
$56,792
AVG HOUSEHOLD INCOME
55.8%
WAGE / INCOME GAP [ % ]
44.2¢/ $1
WAGE / INCOME GAP [ $ ]
0.48
INEQUALITY / GINI INDEX
1,789
TOTAL POPULATION
800
MALE POPULATION
989
FEMALE POPULATION
80.89
MALES / 100 FEMALES
123.62
FEMALES / 100 MALES
33.7
MEDIAN AGE
3.1
AVG FAMILY SIZE
2.5
AVG HOUSEHOLD SIZE
902
LABOR FORCE [ PEOPLE ]
68.1%
PERCENT IN LABOR FORCE
6.2%
UNEMPLOYMENT RATE
Godley Zip Codes
Godley Area Codes
Income in Godley
Income Overview in Godley
Per Capita Income in Godley is $28,106, while median incomes of families and households are $86,591 and $56,792 respectively.
| Characteristic | Number | Measure |
| Per Capita Income | 1,789 | $28,106 |
| Median Family Income | 502 | $86,591 |
| Mean Family Income | 502 | $87,652 |
| Median Household Income | 705 | $56,792 |
| Mean Household Income | 705 | $69,645 |
| Income Deficit | 502 | $0 |
| Wage / Income Gap (%) | 1,789 | 55.81% |
| Wage / Income Gap ($) | 1,789 | 44.19¢ per $1 |
| Gini / Inequality Index | 1,789 | 0.48 |
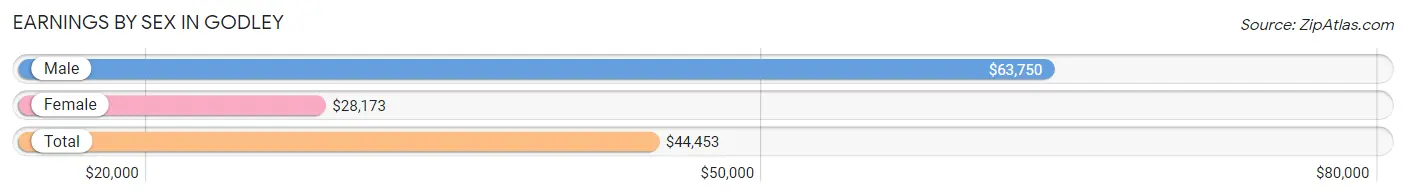
Earnings by Sex in Godley
Average Earnings in Godley are $44,453, $63,750 for men and $28,173 for women, a difference of 55.8%.
| Sex | Number | Average Earnings |
| Male | 409 (45.7%) | $63,750 |
| Female | 486 (54.3%) | $28,173 |
| Total | 895 (100.0%) | $44,453 |
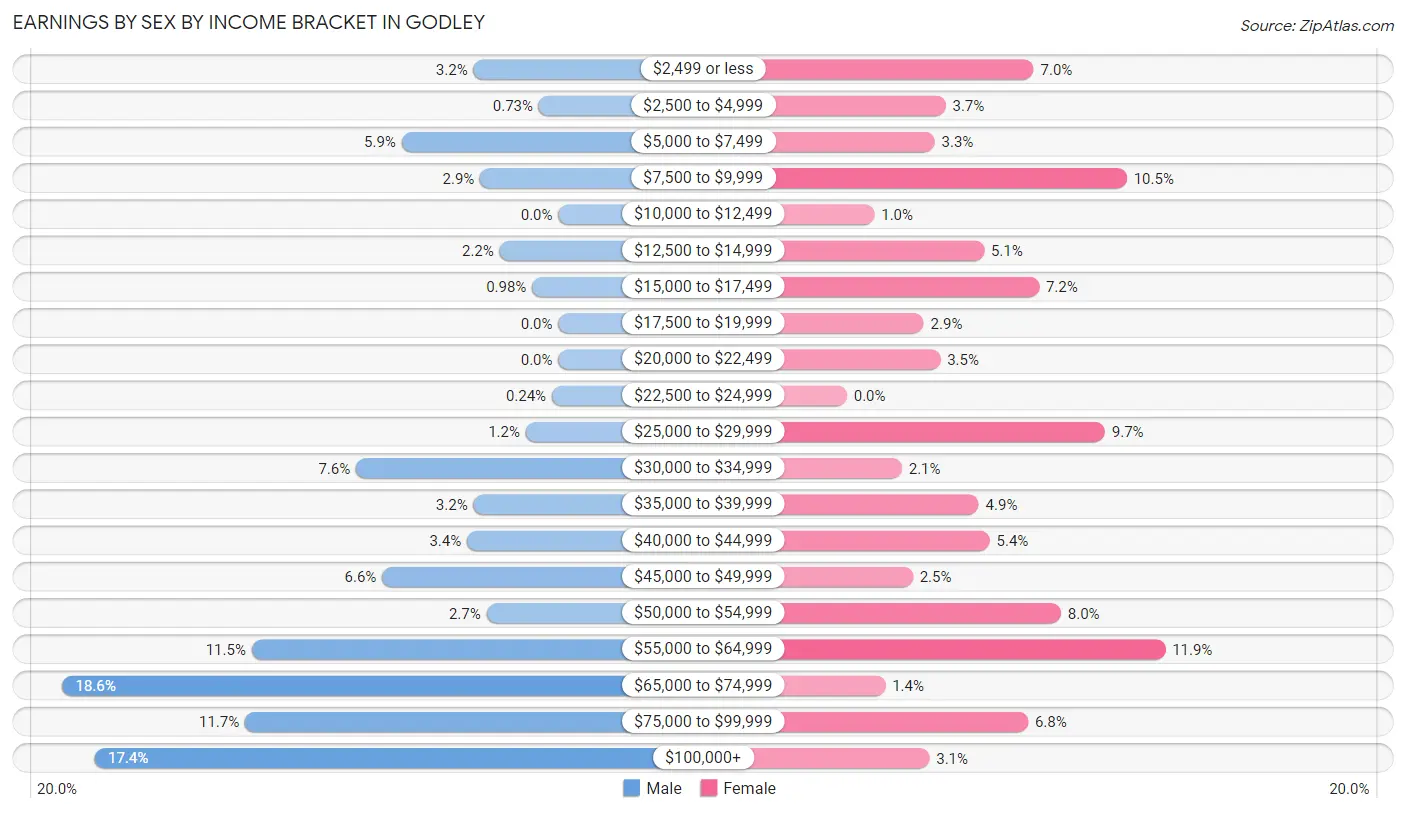
Earnings by Sex by Income Bracket in Godley
The most common earnings brackets in Godley are $65,000 to $74,999 for men (76 | 18.6%) and $55,000 to $64,999 for women (58 | 11.9%).
| Income | Male | Female |
| $2,499 or less | 13 (3.2%) | 34 (7.0%) |
| $2,500 to $4,999 | 3 (0.7%) | 18 (3.7%) |
| $5,000 to $7,499 | 24 (5.9%) | 16 (3.3%) |
| $7,500 to $9,999 | 12 (2.9%) | 51 (10.5%) |
| $10,000 to $12,499 | 0 (0.0%) | 5 (1.0%) |
| $12,500 to $14,999 | 9 (2.2%) | 25 (5.1%) |
| $15,000 to $17,499 | 4 (1.0%) | 35 (7.2%) |
| $17,500 to $19,999 | 0 (0.0%) | 14 (2.9%) |
| $20,000 to $22,499 | 0 (0.0%) | 17 (3.5%) |
| $22,500 to $24,999 | 1 (0.2%) | 0 (0.0%) |
| $25,000 to $29,999 | 5 (1.2%) | 47 (9.7%) |
| $30,000 to $34,999 | 31 (7.6%) | 10 (2.1%) |
| $35,000 to $39,999 | 13 (3.2%) | 24 (4.9%) |
| $40,000 to $44,999 | 14 (3.4%) | 26 (5.3%) |
| $45,000 to $49,999 | 27 (6.6%) | 12 (2.5%) |
| $50,000 to $54,999 | 11 (2.7%) | 39 (8.0%) |
| $55,000 to $64,999 | 47 (11.5%) | 58 (11.9%) |
| $65,000 to $74,999 | 76 (18.6%) | 7 (1.4%) |
| $75,000 to $99,999 | 48 (11.7%) | 33 (6.8%) |
| $100,000+ | 71 (17.4%) | 15 (3.1%) |
| Total | 409 (100.0%) | 486 (100.0%) |
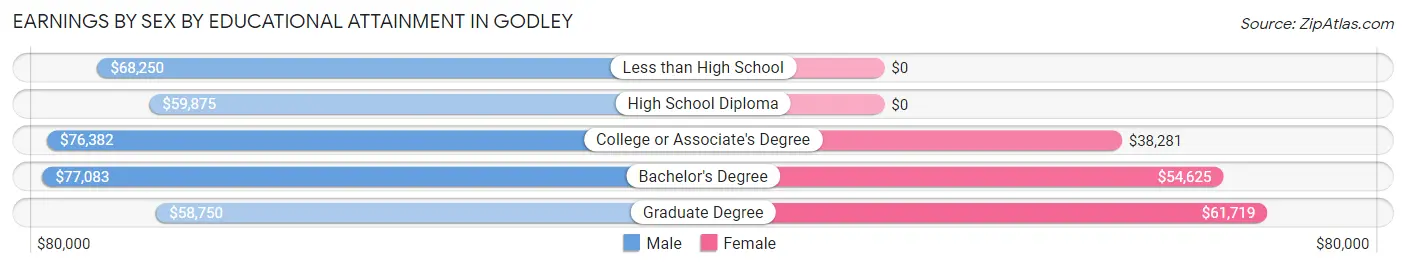
Earnings by Sex by Educational Attainment in Godley
Average earnings in Godley are $68,800 for men and $39,297 for women, a difference of 42.9%. Men with an educational attainment of bachelor's degree enjoy the highest average annual earnings of $77,083, while those with graduate degree education earn the least with $58,750. Women with an educational attainment of graduate degree earn the most with the average annual earnings of $61,719, while those with college or associate's degree education have the smallest earnings of $38,281.
| Educational Attainment | Male Income | Female Income |
| Less than High School | $68,250 | $0 |
| High School Diploma | $59,875 | $0 |
| College or Associate's Degree | $76,382 | $38,281 |
| Bachelor's Degree | $77,083 | $54,625 |
| Graduate Degree | $58,750 | $61,719 |
| Total | $68,800 | $39,297 |
Family Income in Godley
Family Income Brackets in Godley
According to the Godley family income data, there are 133 families falling into the $100,000 to $149,999 income range, which is the most common income bracket and makes up 26.5% of all families.
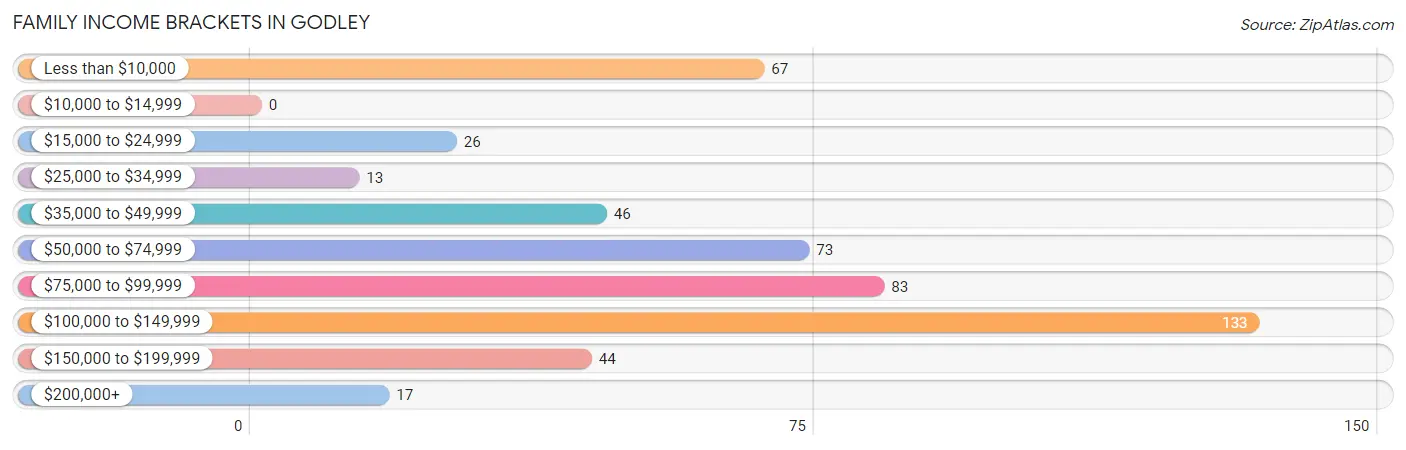
| Income Bracket | # Families | % Families |
| Less than $10,000 | 67 | 13.3% |
| $10,000 to $14,999 | 0 | 0.0% |
| $15,000 to $24,999 | 26 | 5.2% |
| $25,000 to $34,999 | 13 | 2.6% |
| $35,000 to $49,999 | 46 | 9.2% |
| $50,000 to $74,999 | 73 | 14.5% |
| $75,000 to $99,999 | 83 | 16.5% |
| $100,000 to $149,999 | 133 | 26.5% |
| $150,000 to $199,999 | 44 | 8.8% |
| $200,000+ | 17 | 3.4% |
Family Income by Famaliy Size in Godley
5-person families (22 | 4.4%) account for the highest median family income in Godley with $176,250 per family, while 3-person families (78 | 15.5%) have the highest median income of $49,667 per family member.
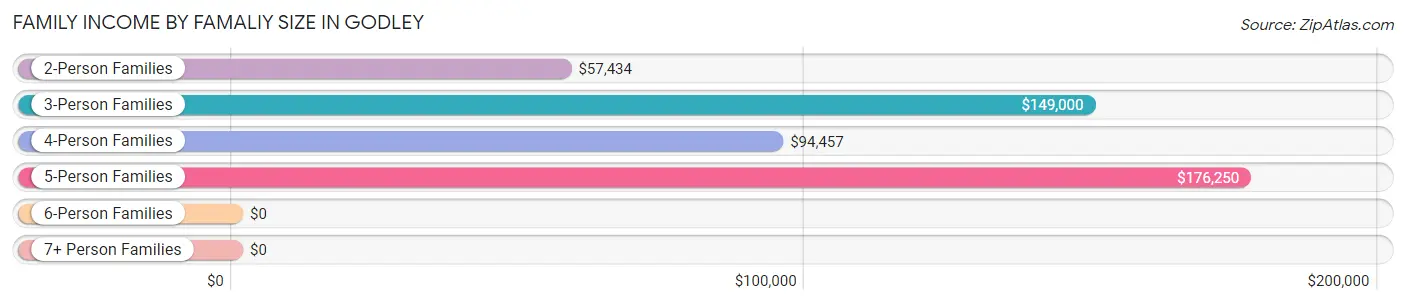
| Income Bracket | # Families | Median Income |
| 2-Person Families | 225 (44.8%) | $57,434 |
| 3-Person Families | 78 (15.5%) | $149,000 |
| 4-Person Families | 162 (32.3%) | $94,457 |
| 5-Person Families | 22 (4.4%) | $176,250 |
| 6-Person Families | 15 (3.0%) | $0 |
| 7+ Person Families | 0 (0.0%) | $0 |
| Total | 502 (100.0%) | $86,591 |
Family Income by Number of Earners in Godley
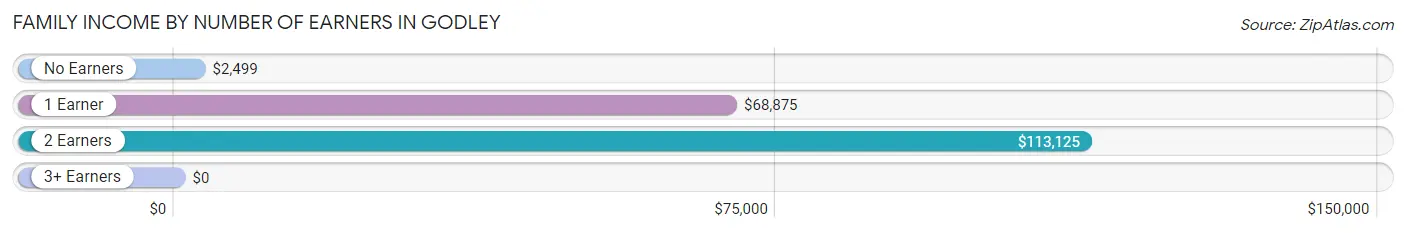
| Number of Earners | # Families | Median Income |
| No Earners | 41 (8.2%) | $2,499 |
| 1 Earner | 203 (40.4%) | $68,875 |
| 2 Earners | 215 (42.8%) | $113,125 |
| 3+ Earners | 43 (8.6%) | $0 |
| Total | 502 (100.0%) | $86,591 |
Household Income in Godley
Household Income Brackets in Godley
With 159 households falling in the category, the less than $10,000 income range is the most frequent in Godley, accounting for 22.6% of all households. In contrast, only 11 households (1.6%) fall into the $10,000 to $14,999 income bracket, making it the least populous group.
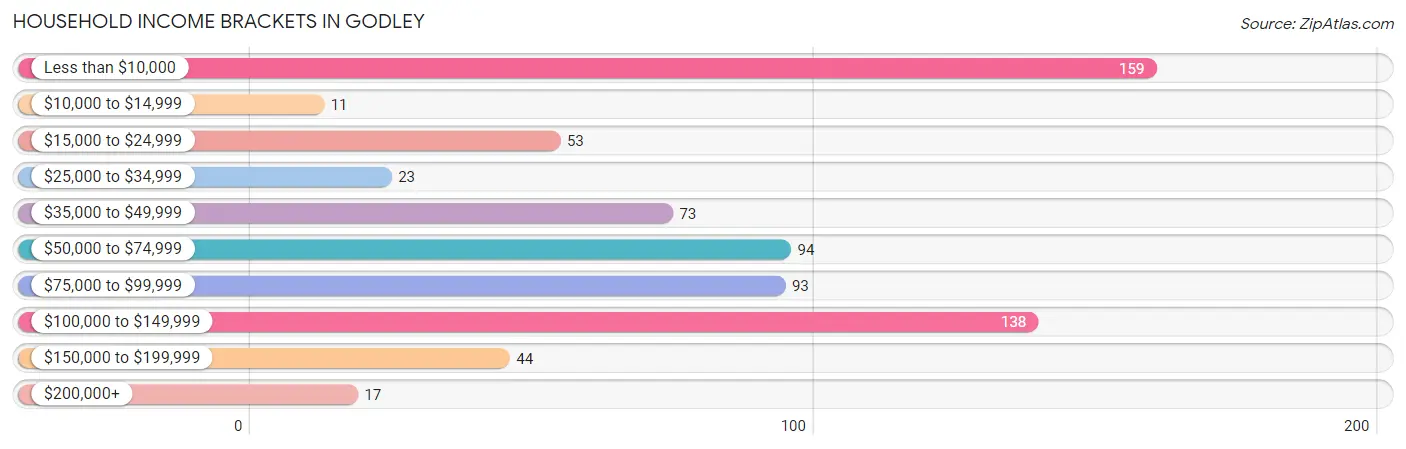
| Income Bracket | # Households | % Households |
| Less than $10,000 | 159 | 22.6% |
| $10,000 to $14,999 | 11 | 1.6% |
| $15,000 to $24,999 | 53 | 7.5% |
| $25,000 to $34,999 | 23 | 3.3% |
| $35,000 to $49,999 | 73 | 10.4% |
| $50,000 to $74,999 | 94 | 13.3% |
| $75,000 to $99,999 | 93 | 13.2% |
| $100,000 to $149,999 | 138 | 19.6% |
| $150,000 to $199,999 | 44 | 6.2% |
| $200,000+ | 17 | 2.4% |
Household Income by Householder Age in Godley
The median household income in Godley is $56,792, with the highest median household income of $93,533 found in the 25 to 44 years age bracket for the primary householder. A total of 267 households (37.9%) fall into this category. Meanwhile, the 15 to 24 years age bracket for the primary householder has the lowest median household income of $0, with 41 households (5.8%) in this group.
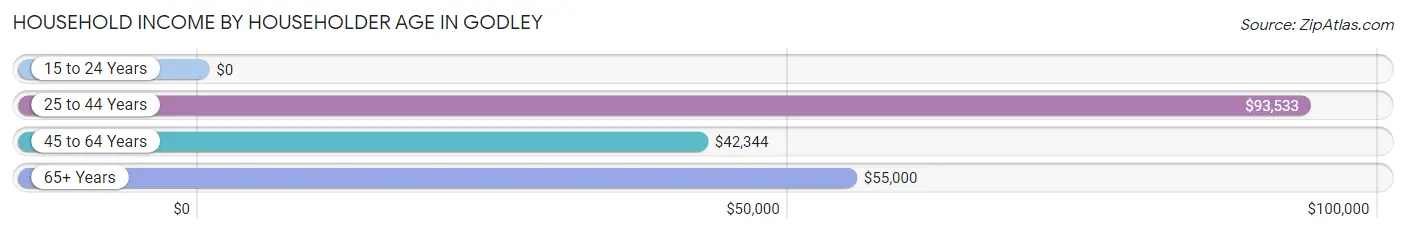
| Income Bracket | # Households | Median Income |
| 15 to 24 Years | 41 (5.8%) | $0 |
| 25 to 44 Years | 267 (37.9%) | $93,533 |
| 45 to 64 Years | 283 (40.1%) | $42,344 |
| 65+ Years | 114 (16.2%) | $55,000 |
| Total | 705 (100.0%) | $56,792 |
Poverty in Godley
Income Below Poverty by Sex and Age in Godley
With 20.1% poverty level for males and 16.7% for females among the residents of Godley, under 5 year old males and 55 to 64 year old females are the most vulnerable to poverty, with 51 males (48.6%) and 78 females (51.7%) in their respective age groups living below the poverty level.
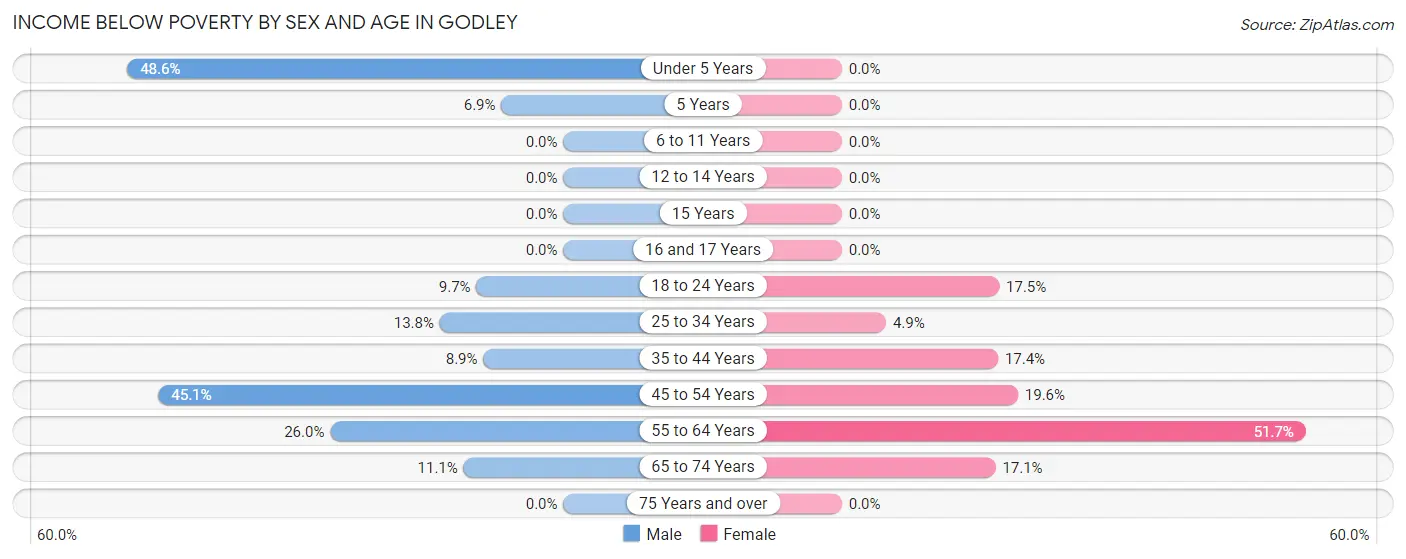
| Age Bracket | Male | Female |
| Under 5 Years | 51 (48.6%) | 0 (0.0%) |
| 5 Years | 2 (6.9%) | 0 (0.0%) |
| 6 to 11 Years | 0 (0.0%) | 0 (0.0%) |
| 12 to 14 Years | 0 (0.0%) | 0 (0.0%) |
| 15 Years | 0 (0.0%) | 0 (0.0%) |
| 16 and 17 Years | 0 (0.0%) | 0 (0.0%) |
| 18 to 24 Years | 6 (9.7%) | 24 (17.5%) |
| 25 to 34 Years | 15 (13.8%) | 6 (4.9%) |
| 35 to 44 Years | 9 (8.9%) | 24 (17.4%) |
| 45 to 54 Years | 46 (45.1%) | 20 (19.6%) |
| 55 to 64 Years | 27 (26.0%) | 78 (51.7%) |
| 65 to 74 Years | 4 (11.1%) | 13 (17.1%) |
| 75 Years and over | 0 (0.0%) | 0 (0.0%) |
| Total | 160 (20.1%) | 165 (16.7%) |
Income Above Poverty by Sex and Age in Godley
According to the poverty statistics in Godley, males aged 6 to 11 years and females aged under 5 years are the age groups that are most secure financially, with 100.0% of males and 100.0% of females in these age groups living above the poverty line.
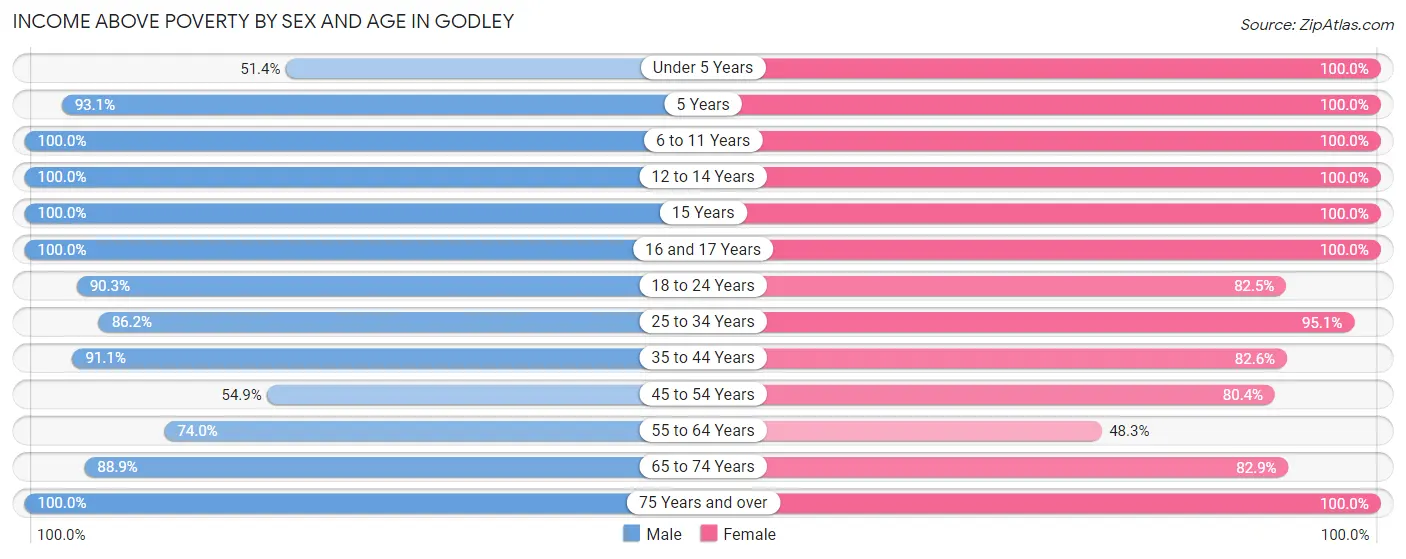
| Age Bracket | Male | Female |
| Under 5 Years | 54 (51.4%) | 79 (100.0%) |
| 5 Years | 27 (93.1%) | 13 (100.0%) |
| 6 to 11 Years | 87 (100.0%) | 57 (100.0%) |
| 12 to 14 Years | 18 (100.0%) | 28 (100.0%) |
| 15 Years | 9 (100.0%) | 35 (100.0%) |
| 16 and 17 Years | 14 (100.0%) | 19 (100.0%) |
| 18 to 24 Years | 56 (90.3%) | 113 (82.5%) |
| 25 to 34 Years | 94 (86.2%) | 116 (95.1%) |
| 35 to 44 Years | 92 (91.1%) | 114 (82.6%) |
| 45 to 54 Years | 56 (54.9%) | 82 (80.4%) |
| 55 to 64 Years | 77 (74.0%) | 73 (48.3%) |
| 65 to 74 Years | 32 (88.9%) | 63 (82.9%) |
| 75 Years and over | 22 (100.0%) | 30 (100.0%) |
| Total | 638 (79.9%) | 822 (83.3%) |
Income Below Poverty Among Married-Couple Families in Godley
The poverty statistics for married-couple families in Godley show that 20.8% or 85 of the total 409 families live below the poverty line. Families with no children have the highest poverty rate of 31.3%, comprising of 61 families. On the other hand, families with 3 or 4 children have the lowest poverty rate of 0.0%, which includes 0 families.
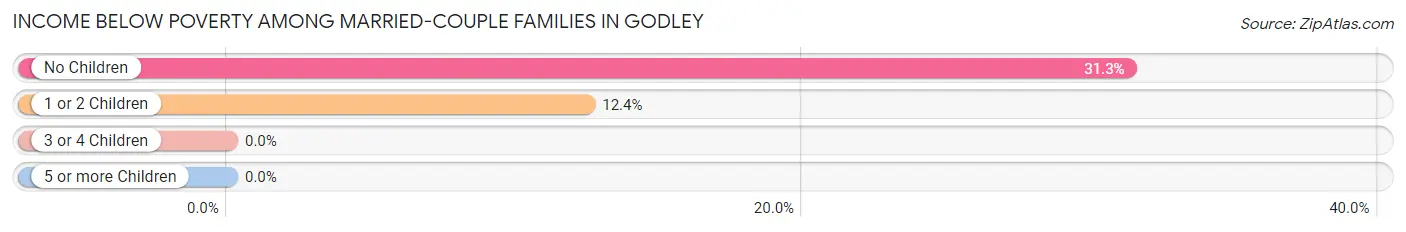
| Children | Above Poverty | Below Poverty |
| No Children | 134 (68.7%) | 61 (31.3%) |
| 1 or 2 Children | 169 (87.6%) | 24 (12.4%) |
| 3 or 4 Children | 21 (100.0%) | 0 (0.0%) |
| 5 or more Children | 0 (0.0%) | 0 (0.0%) |
| Total | 324 (79.2%) | 85 (20.8%) |
Income Below Poverty Among Single-Parent Households in Godley
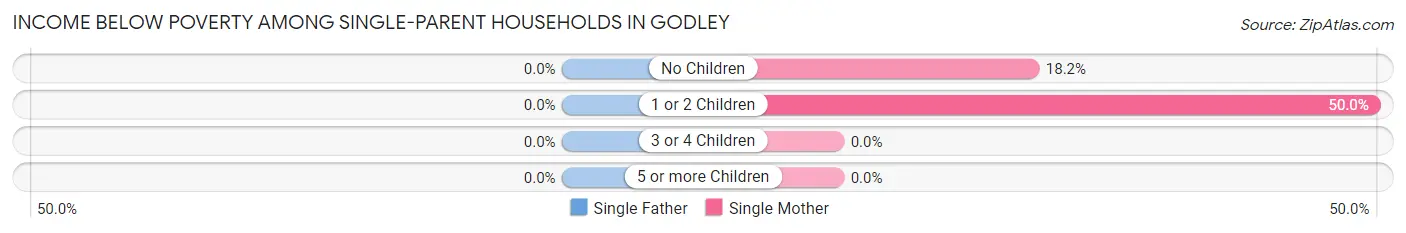
| Children | Single Father | Single Mother |
| No Children | 0 (0.0%) | 6 (18.2%) |
| 1 or 2 Children | 0 (0.0%) | 2 (50.0%) |
| 3 or 4 Children | 0 (0.0%) | 0 (0.0%) |
| 5 or more Children | 0 (0.0%) | 0 (0.0%) |
| Total | 0 (0.0%) | 8 (12.9%) |
Income Below Poverty Among Married-Couple vs Single-Parent Households in Godley
The poverty data for Godley shows that 85 of the married-couple family households (20.8%) and 8 of the single-parent households (8.6%) are living below the poverty level. Within the married-couple family households, those with no children have the highest poverty rate, with 61 households (31.3%) falling below the poverty line. Among the single-parent households, those with no children have the highest poverty rate, with 6 household (11.8%) living below poverty.
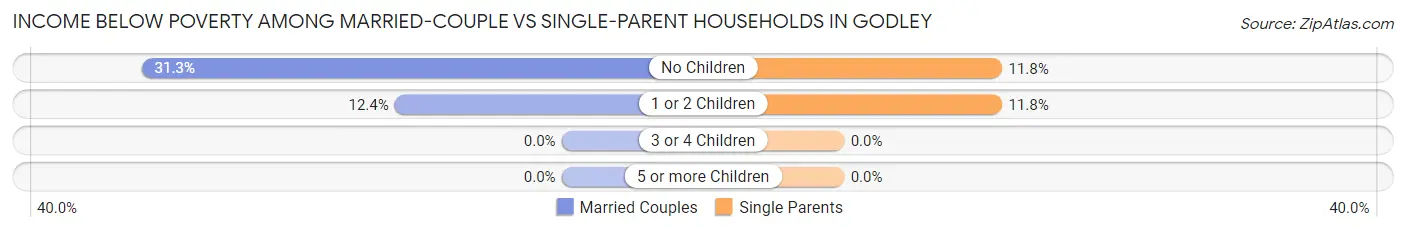
| Children | Married-Couple Families | Single-Parent Households |
| No Children | 61 (31.3%) | 6 (11.8%) |
| 1 or 2 Children | 24 (12.4%) | 2 (11.8%) |
| 3 or 4 Children | 0 (0.0%) | 0 (0.0%) |
| 5 or more Children | 0 (0.0%) | 0 (0.0%) |
| Total | 85 (20.8%) | 8 (8.6%) |
Race in Godley
The most populous races in Godley are White / Caucasian (1,619 | 90.5%), Hispanic or Latino (407 | 22.8%), and Two or more Races (79 | 4.4%).
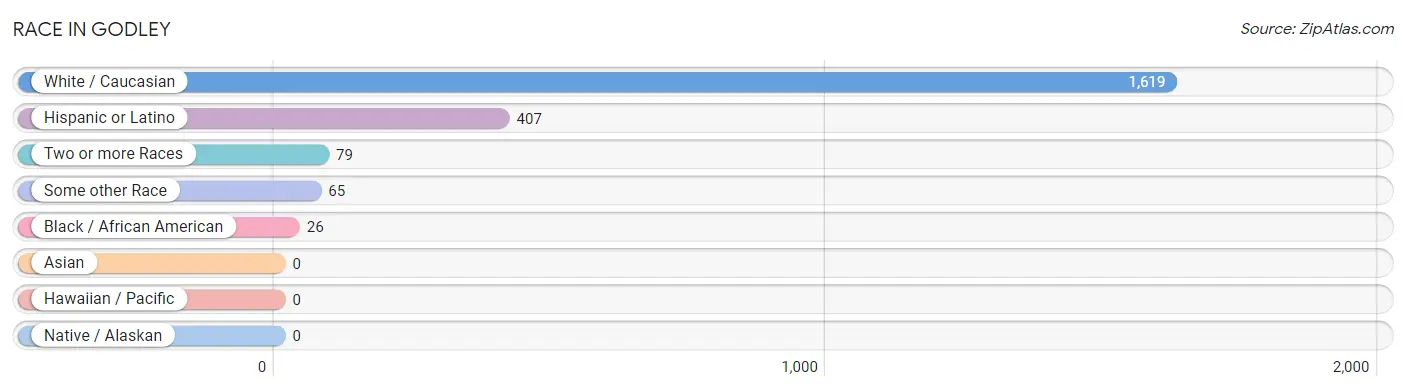
| Race | # Population | % Population |
| Asian | 0 | 0.0% |
| Black / African American | 26 | 1.5% |
| Hawaiian / Pacific | 0 | 0.0% |
| Hispanic or Latino | 407 | 22.8% |
| Native / Alaskan | 0 | 0.0% |
| White / Caucasian | 1,619 | 90.5% |
| Two or more Races | 79 | 4.4% |
| Some other Race | 65 | 3.6% |
| Total | 1,789 | 100.0% |
Ancestry in Godley
The most populous ancestries reported in Godley are American (712 | 39.8%), Mexican (364 | 20.3%), Irish (120 | 6.7%), English (106 | 5.9%), and German (75 | 4.2%), together accounting for 77.0% of all Godley residents.
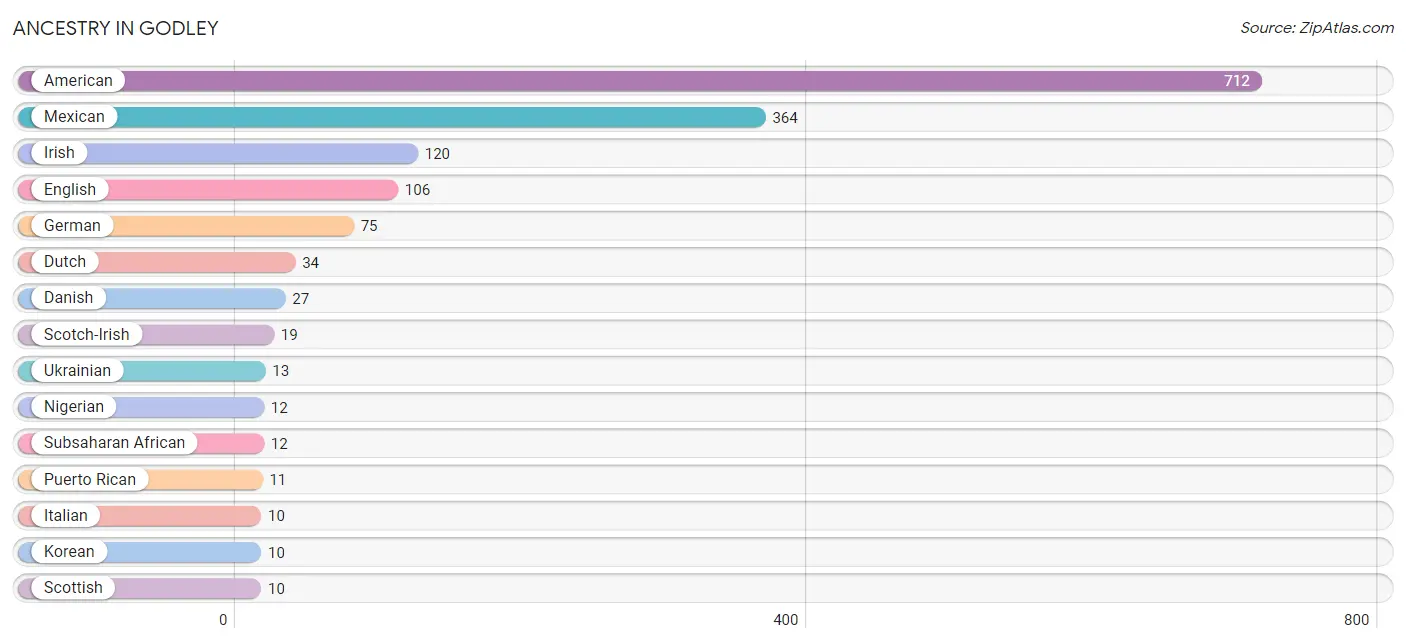
| Ancestry | # Population | % Population |
| American | 712 | 39.8% |
| Austrian | 9 | 0.5% |
| Cherokee | 8 | 0.4% |
| Czech | 9 | 0.5% |
| Danish | 27 | 1.5% |
| Dutch | 34 | 1.9% |
| English | 106 | 5.9% |
| French Canadian | 8 | 0.4% |
| German | 75 | 4.2% |
| Irish | 120 | 6.7% |
| Italian | 10 | 0.6% |
| Korean | 10 | 0.6% |
| Mexican | 364 | 20.3% |
| Nigerian | 12 | 0.7% |
| Norwegian | 5 | 0.3% |
| Polish | 4 | 0.2% |
| Puerto Rican | 11 | 0.6% |
| Scotch-Irish | 19 | 1.1% |
| Scottish | 10 | 0.6% |
| Spaniard | 5 | 0.3% |
| Spanish | 8 | 0.4% |
| Subsaharan African | 12 | 0.7% |
| Swedish | 9 | 0.5% |
| Swiss | 5 | 0.3% |
| Ukrainian | 13 | 0.7% |
| Welsh | 4 | 0.2% | View All 26 Rows |
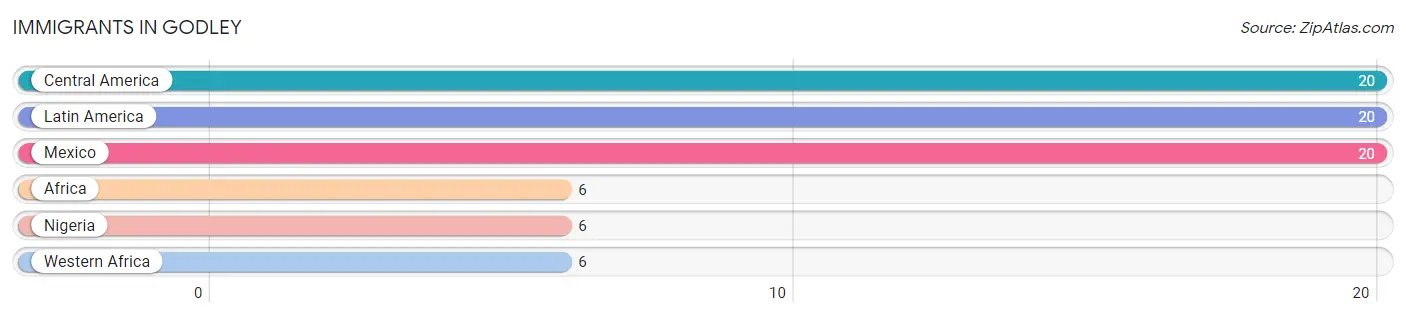
Immigrants in Godley
The most numerous immigrant groups reported in Godley came from Central America (20 | 1.1%), Latin America (20 | 1.1%), Mexico (20 | 1.1%), Africa (6 | 0.3%), and Nigeria (6 | 0.3%), together accounting for 4.0% of all Godley residents.
| Immigration Origin | # Population | % Population |
| Africa | 6 | 0.3% |
| Central America | 20 | 1.1% |
| Latin America | 20 | 1.1% |
| Mexico | 20 | 1.1% |
| Nigeria | 6 | 0.3% |
| Western Africa | 6 | 0.3% | View All 6 Rows |
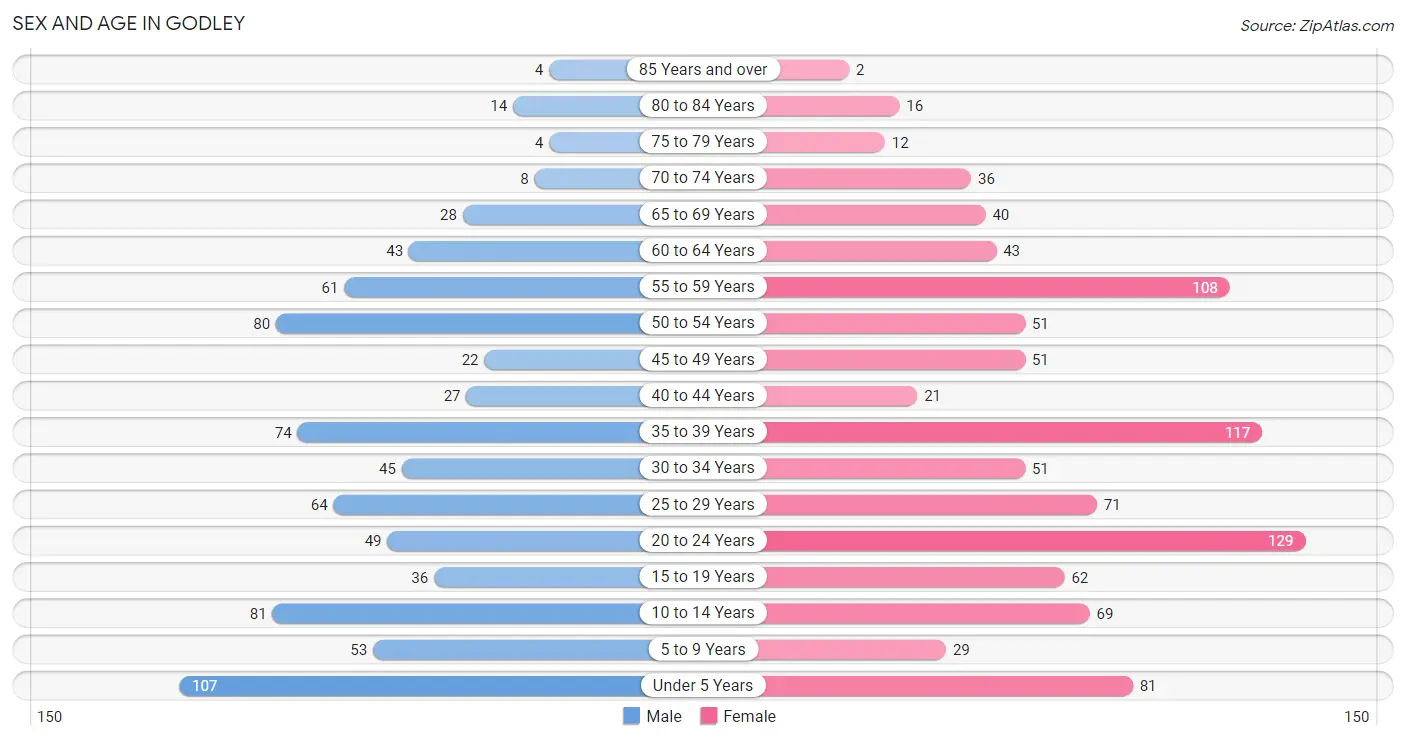
Sex and Age in Godley
Sex and Age in Godley
The most populous age groups in Godley are Under 5 Years (107 | 13.4%) for men and 20 to 24 Years (129 | 13.0%) for women.
| Age Bracket | Male | Female |
| Under 5 Years | 107 (13.4%) | 81 (8.2%) |
| 5 to 9 Years | 53 (6.6%) | 29 (2.9%) |
| 10 to 14 Years | 81 (10.1%) | 69 (7.0%) |
| 15 to 19 Years | 36 (4.5%) | 62 (6.3%) |
| 20 to 24 Years | 49 (6.1%) | 129 (13.0%) |
| 25 to 29 Years | 64 (8.0%) | 71 (7.2%) |
| 30 to 34 Years | 45 (5.6%) | 51 (5.2%) |
| 35 to 39 Years | 74 (9.2%) | 117 (11.8%) |
| 40 to 44 Years | 27 (3.4%) | 21 (2.1%) |
| 45 to 49 Years | 22 (2.8%) | 51 (5.2%) |
| 50 to 54 Years | 80 (10.0%) | 51 (5.2%) |
| 55 to 59 Years | 61 (7.6%) | 108 (10.9%) |
| 60 to 64 Years | 43 (5.4%) | 43 (4.3%) |
| 65 to 69 Years | 28 (3.5%) | 40 (4.0%) |
| 70 to 74 Years | 8 (1.0%) | 36 (3.6%) |
| 75 to 79 Years | 4 (0.5%) | 12 (1.2%) |
| 80 to 84 Years | 14 (1.8%) | 16 (1.6%) |
| 85 Years and over | 4 (0.5%) | 2 (0.2%) |
| Total | 800 (100.0%) | 989 (100.0%) |
Families and Households in Godley
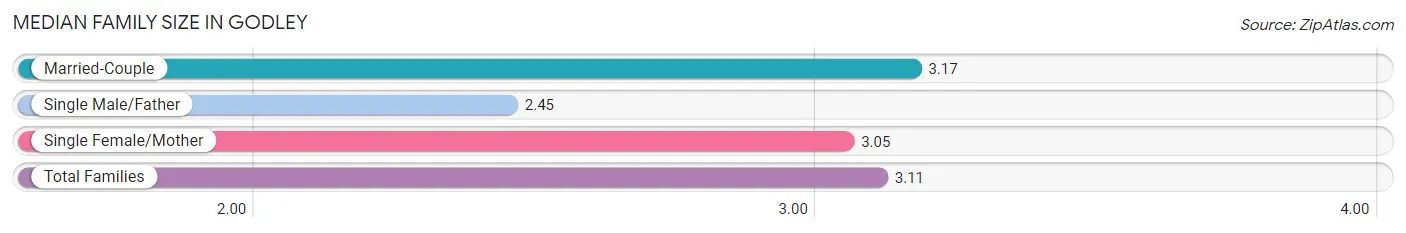
Median Family Size in Godley
The median family size in Godley is 3.11 persons per family, with married-couple families (409 | 81.5%) accounting for the largest median family size of 3.17 persons per family. On the other hand, single male/father families (31 | 6.2%) represent the smallest median family size with 2.45 persons per family.
| Family Type | # Families | Family Size |
| Married-Couple | 409 (81.5%) | 3.17 |
| Single Male/Father | 31 (6.2%) | 2.45 |
| Single Female/Mother | 62 (12.3%) | 3.05 |
| Total Families | 502 (100.0%) | 3.11 |
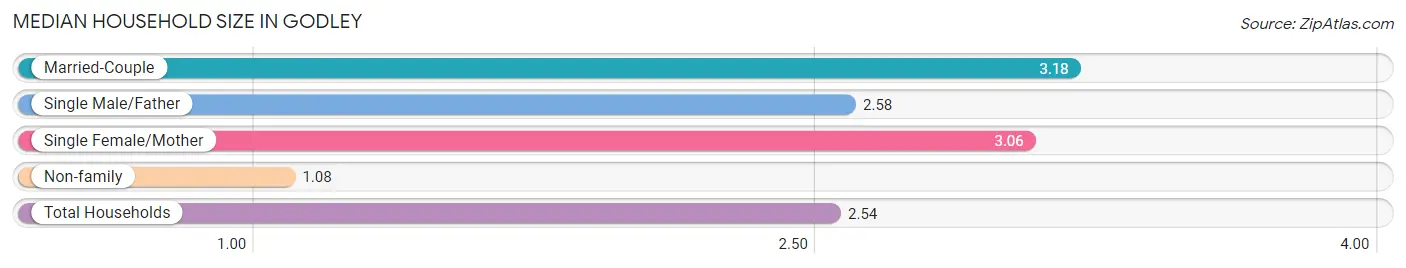
Median Household Size in Godley
The median household size in Godley is 2.54 persons per household, with married-couple households (409 | 58.0%) accounting for the largest median household size of 3.18 persons per household. non-family households (203 | 28.8%) represent the smallest median household size with 1.08 persons per household.
| Household Type | # Households | Household Size |
| Married-Couple | 409 (58.0%) | 3.18 |
| Single Male/Father | 31 (4.4%) | 2.58 |
| Single Female/Mother | 62 (8.8%) | 3.06 |
| Non-family | 203 (28.8%) | 1.08 |
| Total Households | 705 (100.0%) | 2.54 |
Household Size by Marriage Status in Godley
Out of a total of 705 households in Godley, 502 (71.2%) are family households, while 203 (28.8%) are nonfamily households. The most numerous type of family households are 2-person households, comprising 219, and the most common type of nonfamily households are 1-person households, comprising 183.
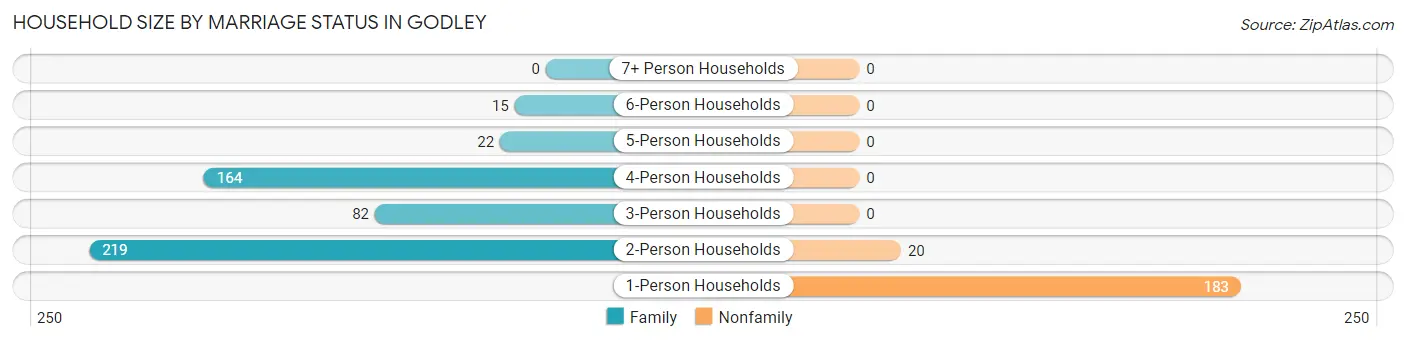
| Household Size | Family Households | Nonfamily Households |
| 1-Person Households | - | 183 (26.0%) |
| 2-Person Households | 219 (31.1%) | 20 (2.8%) |
| 3-Person Households | 82 (11.6%) | 0 (0.0%) |
| 4-Person Households | 164 (23.3%) | 0 (0.0%) |
| 5-Person Households | 22 (3.1%) | 0 (0.0%) |
| 6-Person Households | 15 (2.1%) | 0 (0.0%) |
| 7+ Person Households | 0 (0.0%) | 0 (0.0%) |
| Total | 502 (71.2%) | 203 (28.8%) |
Female Fertility in Godley
Fertility by Age in Godley
Average fertility rate in Godley is 107.0 births per 1,000 women. Women in the age bracket of 20 to 34 years have the highest fertility rate with 199.0 births per 1,000 women. Women in the age bracket of 20 to 34 years acount for 89.3% of all women with births.
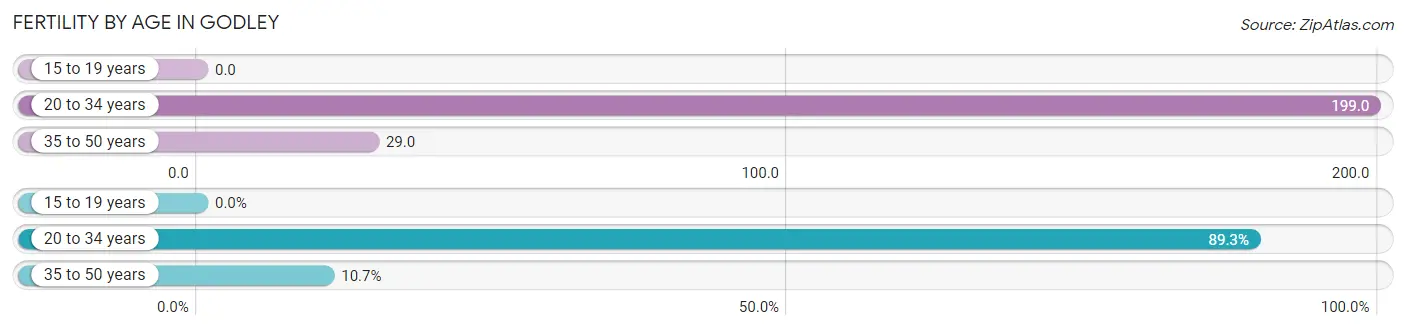
| Age Bracket | Women with Births | Births / 1,000 Women |
| 15 to 19 years | 0 (0.0%) | 0.0 |
| 20 to 34 years | 50 (89.3%) | 199.0 |
| 35 to 50 years | 6 (10.7%) | 29.0 |
| Total | 56 (100.0%) | 107.0 |
Fertility by Age by Marriage Status in Godley
89.3% of women with births (56) in Godley are married. The highest percentage of unmarried women with births falls into 35 to 50 years age bracket with 33.3% of them unmarried at the time of birth, while the lowest percentage of unmarried women with births belong to 20 to 34 years age bracket with 8.0% of them unmarried.
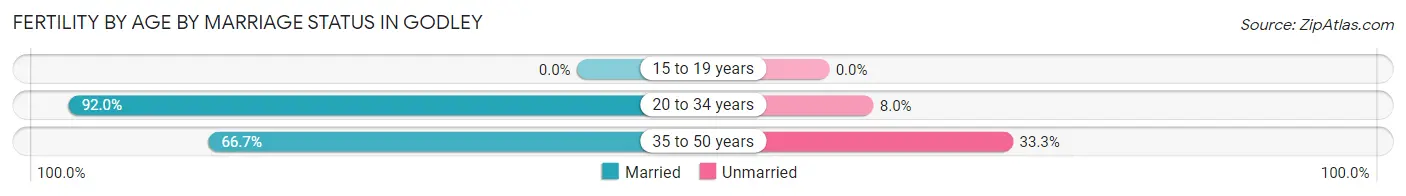
| Age Bracket | Married | Unmarried |
| 15 to 19 years | 0 (0.0%) | 0 (0.0%) |
| 20 to 34 years | 46 (92.0%) | 4 (8.0%) |
| 35 to 50 years | 4 (66.7%) | 2 (33.3%) |
| Total | 50 (89.3%) | 6 (10.7%) |
Fertility by Education in Godley
Average fertility rate in Godley is 107.0 births per 1,000 women. Women with the education attainment of graduate degree have the highest fertility rate of 400.0 births per 1,000 women, while women with the education attainment of college or associate's degree have the lowest fertility at 28.0 births per 1,000 women. Women with the education attainment of high school diploma represent 64.3% of all women with births.
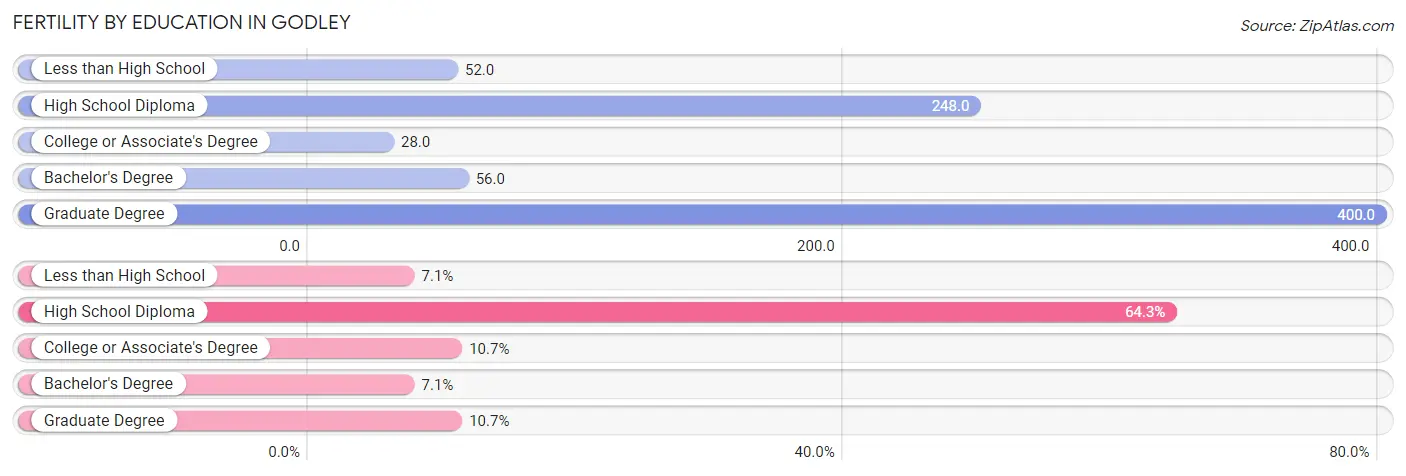
| Educational Attainment | Women with Births | Births / 1,000 Women |
| Less than High School | 4 (7.1%) | 52.0 |
| High School Diploma | 36 (64.3%) | 248.0 |
| College or Associate's Degree | 6 (10.7%) | 28.0 |
| Bachelor's Degree | 4 (7.1%) | 56.0 |
| Graduate Degree | 6 (10.7%) | 400.0 |
| Total | 56 (100.0%) | 107.0 |
Fertility by Education by Marriage Status in Godley
10.7% of women with births in Godley are unmarried. Women with the educational attainment of high school diploma are most likely to be married with 100.0% of them married at childbirth, while women with the educational attainment of less than high school are least likely to be married with 100.0% of them unmarried at childbirth.
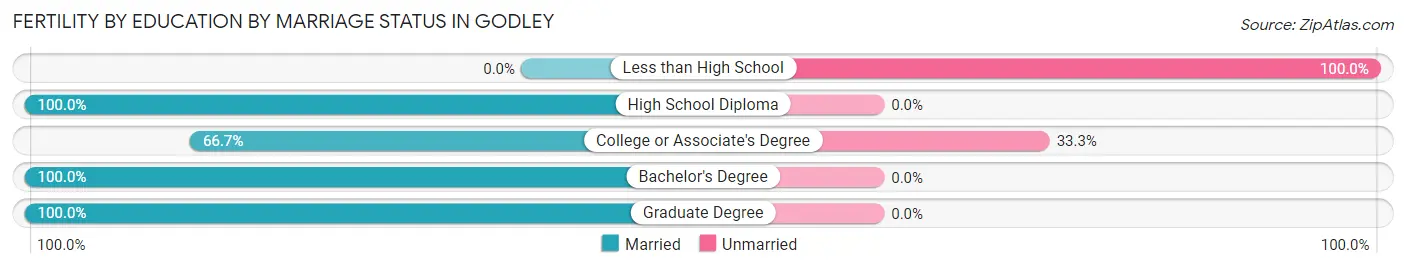
| Educational Attainment | Married | Unmarried |
| Less than High School | 0 (0.0%) | 4 (100.0%) |
| High School Diploma | 36 (100.0%) | 0 (0.0%) |
| College or Associate's Degree | 4 (66.7%) | 2 (33.3%) |
| Bachelor's Degree | 4 (100.0%) | 0 (0.0%) |
| Graduate Degree | 6 (100.0%) | 0 (0.0%) |
| Total | 50 (89.3%) | 6 (10.7%) |
Employment Characteristics in Godley
Employment by Class of Employer in Godley
Among the 846 employed individuals in Godley, private company employees (526 | 62.2%), self-employed (not incorporated) (118 | 14.0%), and not-for-profit organizations (96 | 11.4%) make up the most common classes of employment.
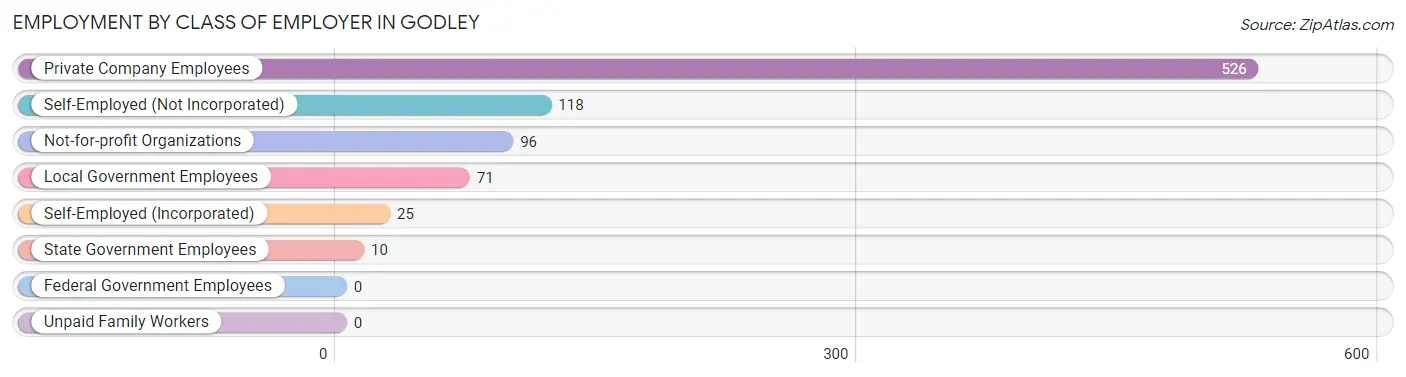
| Employer Class | # Employees | % Employees |
| Private Company Employees | 526 | 62.2% |
| Self-Employed (Incorporated) | 25 | 3.0% |
| Self-Employed (Not Incorporated) | 118 | 14.0% |
| Not-for-profit Organizations | 96 | 11.4% |
| Local Government Employees | 71 | 8.4% |
| State Government Employees | 10 | 1.2% |
| Federal Government Employees | 0 | 0.0% |
| Unpaid Family Workers | 0 | 0.0% |
| Total | 846 | 100.0% |
Employment Status by Age in Godley
According to the labor force statistics for Godley, out of the total population over 16 years of age (1,325), 68.1% or 902 individuals are in the labor force, with 6.2% or 56 of them unemployed. The age group with the highest labor force participation rate is 30 to 34 years, with 97.9% or 94 individuals in the labor force. Within the labor force, the 55 to 59 years age range has the highest percentage of unemployed individuals, with 21.6% or 27 of them being unemployed.
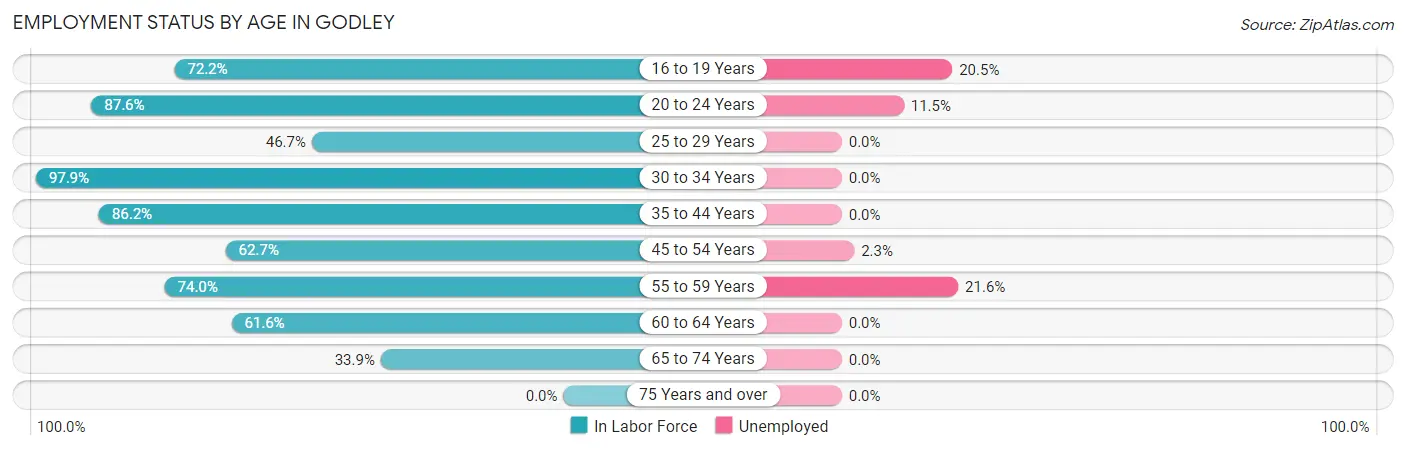
| Age Bracket | In Labor Force | Unemployed |
| 16 to 19 Years | 39 (72.2%) | 8 (20.5%) |
| 20 to 24 Years | 156 (87.6%) | 18 (11.5%) |
| 25 to 29 Years | 63 (46.7%) | 0 (0.0%) |
| 30 to 34 Years | 94 (97.9%) | 0 (0.0%) |
| 35 to 44 Years | 206 (86.2%) | 0 (0.0%) |
| 45 to 54 Years | 128 (62.7%) | 3 (2.3%) |
| 55 to 59 Years | 125 (74.0%) | 27 (21.6%) |
| 60 to 64 Years | 53 (61.6%) | 0 (0.0%) |
| 65 to 74 Years | 38 (33.9%) | 0 (0.0%) |
| 75 Years and over | 0 (0.0%) | 0 (0.0%) |
| Total | 902 (68.1%) | 56 (6.2%) |
Employment Status by Educational Attainment in Godley
According to labor force statistics for Godley, 72.0% of individuals (669) out of the total population between 25 and 64 years of age (929) are in the labor force, with 4.5% or 30 of them being unemployed. The group with the highest labor force participation rate are those with the educational attainment of bachelor's degree or higher, with 96.6% or 143 individuals in the labor force. Within the labor force, individuals with college / associate degree education have the highest percentage of unemployment, with 9.1% or 27 of them being unemployed.
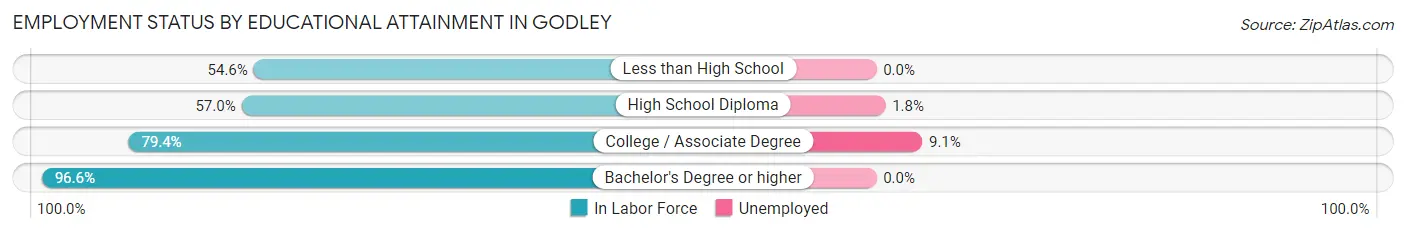
| Educational Attainment | In Labor Force | Unemployed |
| Less than High School | 59 (54.6%) | 0 (0.0%) |
| High School Diploma | 171 (57.0%) | 5 (1.8%) |
| College / Associate Degree | 296 (79.4%) | 34 (9.1%) |
| Bachelor's Degree or higher | 143 (96.6%) | 0 (0.0%) |
| Total | 669 (72.0%) | 42 (4.5%) |
Employment Occupations by Sex in Godley
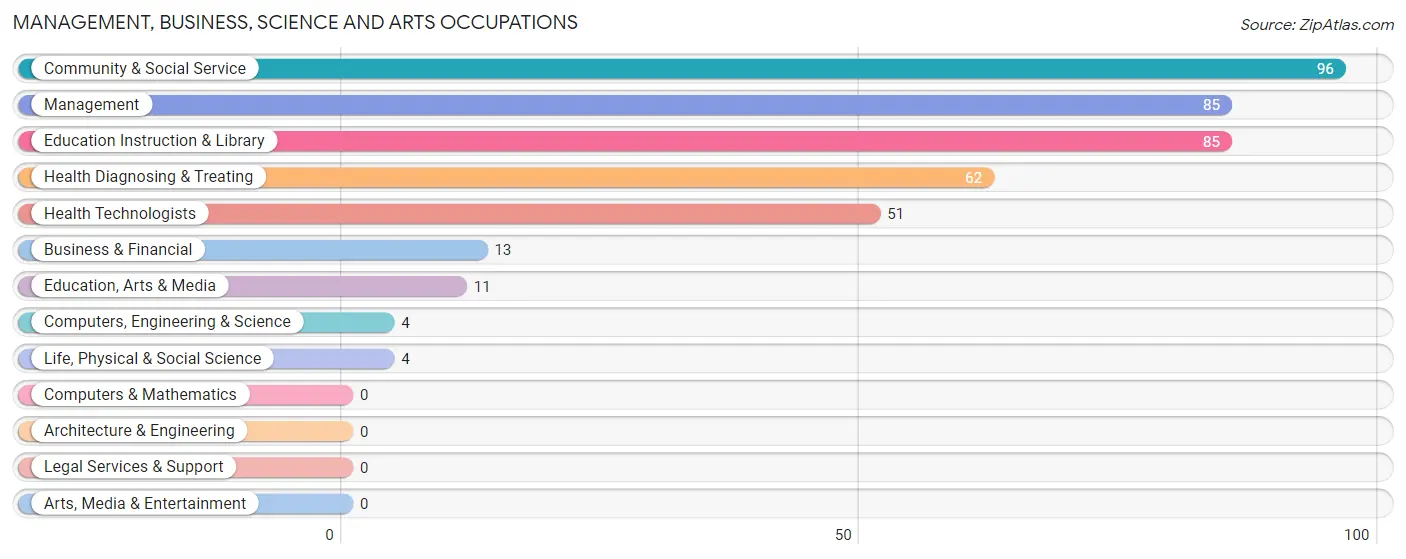
Management, Business, Science and Arts Occupations
The most common Management, Business, Science and Arts occupations in Godley are Community & Social Service (96 | 11.4%), Management (85 | 10.1%), Education Instruction & Library (85 | 10.1%), Health Diagnosing & Treating (62 | 7.3%), and Health Technologists (51 | 6.0%).
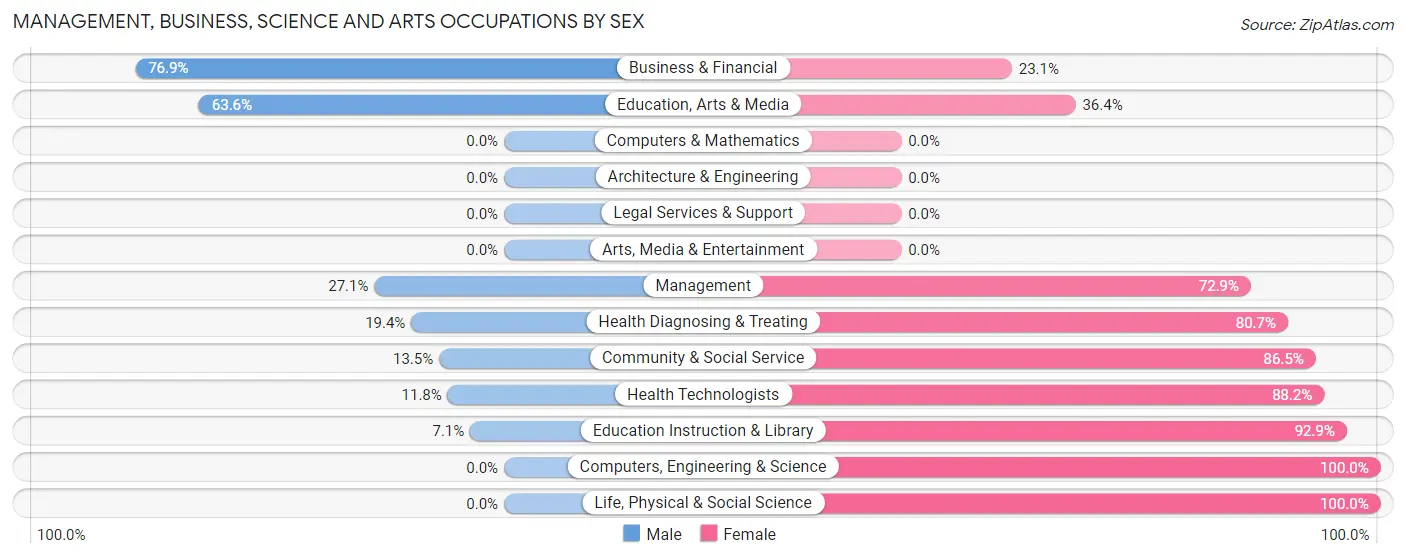
Management, Business, Science and Arts Occupations by Sex
Within the Management, Business, Science and Arts occupations in Godley, the most male-oriented occupations are Business & Financial (76.9%), Education, Arts & Media (63.6%), and Management (27.1%), while the most female-oriented occupations are Computers, Engineering & Science (100.0%), Life, Physical & Social Science (100.0%), and Education Instruction & Library (92.9%).
| Occupation | Male | Female |
| Management | 23 (27.1%) | 62 (72.9%) |
| Business & Financial | 10 (76.9%) | 3 (23.1%) |
| Computers, Engineering & Science | 0 (0.0%) | 4 (100.0%) |
| Computers & Mathematics | 0 (0.0%) | 0 (0.0%) |
| Architecture & Engineering | 0 (0.0%) | 0 (0.0%) |
| Life, Physical & Social Science | 0 (0.0%) | 4 (100.0%) |
| Community & Social Service | 13 (13.5%) | 83 (86.5%) |
| Education, Arts & Media | 7 (63.6%) | 4 (36.4%) |
| Legal Services & Support | 0 (0.0%) | 0 (0.0%) |
| Education Instruction & Library | 6 (7.1%) | 79 (92.9%) |
| Arts, Media & Entertainment | 0 (0.0%) | 0 (0.0%) |
| Health Diagnosing & Treating | 12 (19.4%) | 50 (80.6%) |
| Health Technologists | 6 (11.8%) | 45 (88.2%) |
| Total (Category) | 58 (22.3%) | 202 (77.7%) |
| Total (Overall) | 403 (47.6%) | 443 (52.4%) |
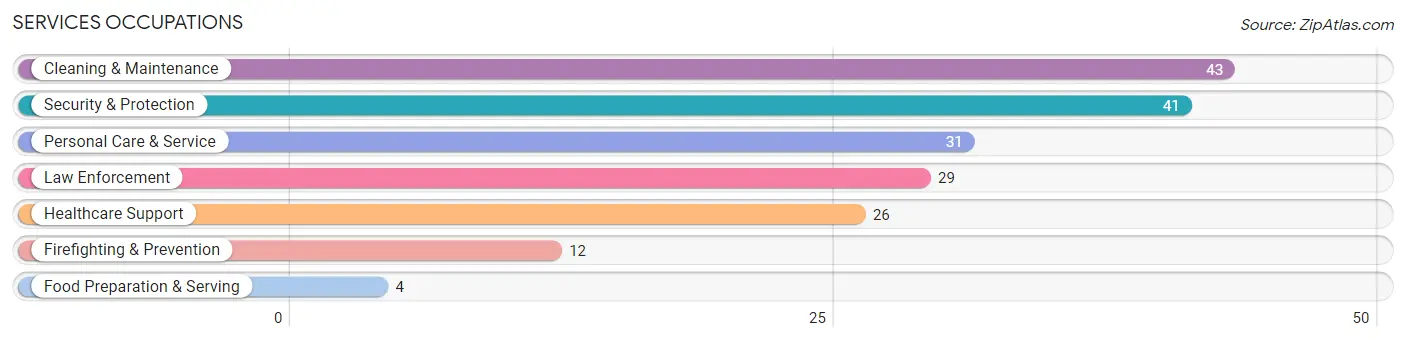
Services Occupations
The most common Services occupations in Godley are Cleaning & Maintenance (43 | 5.1%), Security & Protection (41 | 4.9%), Personal Care & Service (31 | 3.7%), Law Enforcement (29 | 3.4%), and Healthcare Support (26 | 3.1%).
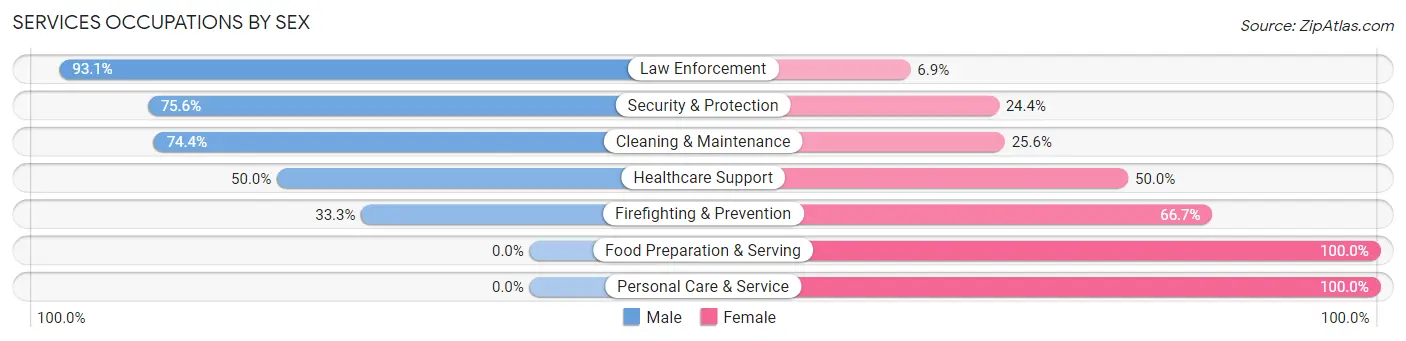
Services Occupations by Sex
Within the Services occupations in Godley, the most male-oriented occupations are Law Enforcement (93.1%), Security & Protection (75.6%), and Cleaning & Maintenance (74.4%), while the most female-oriented occupations are Food Preparation & Serving (100.0%), Personal Care & Service (100.0%), and Firefighting & Prevention (66.7%).
| Occupation | Male | Female |
| Healthcare Support | 13 (50.0%) | 13 (50.0%) |
| Security & Protection | 31 (75.6%) | 10 (24.4%) |
| Firefighting & Prevention | 4 (33.3%) | 8 (66.7%) |
| Law Enforcement | 27 (93.1%) | 2 (6.9%) |
| Food Preparation & Serving | 0 (0.0%) | 4 (100.0%) |
| Cleaning & Maintenance | 32 (74.4%) | 11 (25.6%) |
| Personal Care & Service | 0 (0.0%) | 31 (100.0%) |
| Total (Category) | 76 (52.4%) | 69 (47.6%) |
| Total (Overall) | 403 (47.6%) | 443 (52.4%) |
Sales and Office Occupations
The most common Sales and Office occupations in Godley are Sales & Related (110 | 13.0%), and Office & Administration (50 | 5.9%).
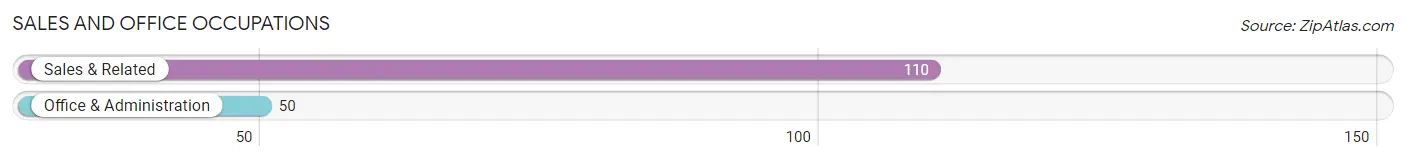
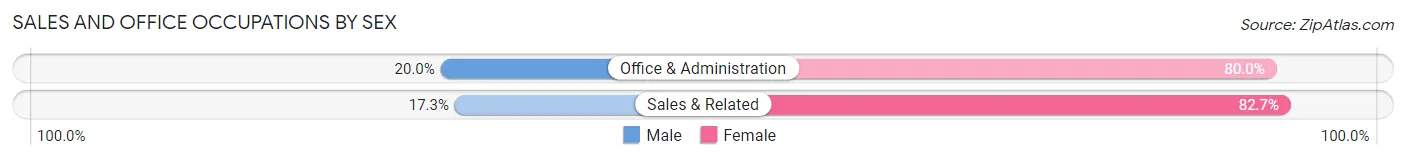
Sales and Office Occupations by Sex
| Occupation | Male | Female |
| Sales & Related | 19 (17.3%) | 91 (82.7%) |
| Office & Administration | 10 (20.0%) | 40 (80.0%) |
| Total (Category) | 29 (18.1%) | 131 (81.9%) |
| Total (Overall) | 403 (47.6%) | 443 (52.4%) |
Natural Resources, Construction and Maintenance Occupations
The most common Natural Resources, Construction and Maintenance occupations in Godley are Construction & Extraction (52 | 6.1%), and Installation, Maintenance & Repair (52 | 6.1%).
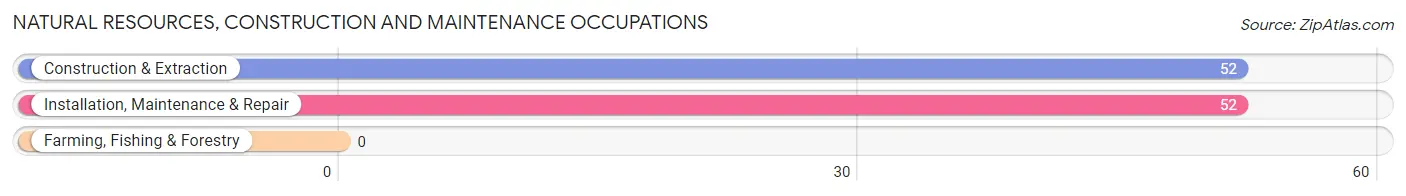
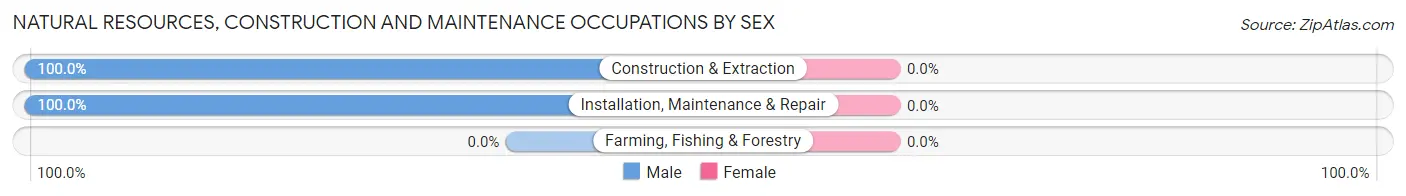
Natural Resources, Construction and Maintenance Occupations by Sex
| Occupation | Male | Female |
| Farming, Fishing & Forestry | 0 (0.0%) | 0 (0.0%) |
| Construction & Extraction | 52 (100.0%) | 0 (0.0%) |
| Installation, Maintenance & Repair | 52 (100.0%) | 0 (0.0%) |
| Total (Category) | 104 (100.0%) | 0 (0.0%) |
| Total (Overall) | 403 (47.6%) | 443 (52.4%) |
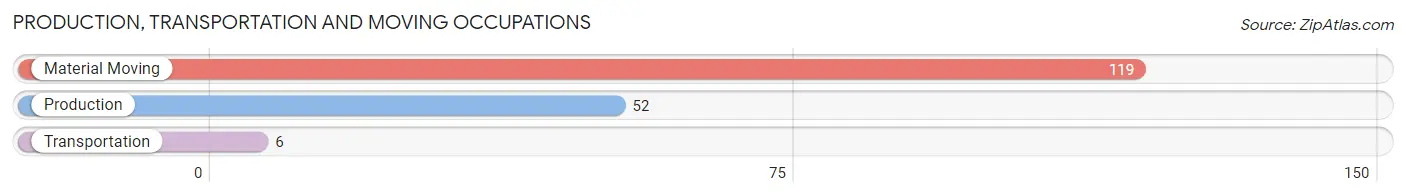
Production, Transportation and Moving Occupations
The most common Production, Transportation and Moving occupations in Godley are Material Moving (119 | 14.1%), Production (52 | 6.1%), and Transportation (6 | 0.7%).
Production, Transportation and Moving Occupations by Sex
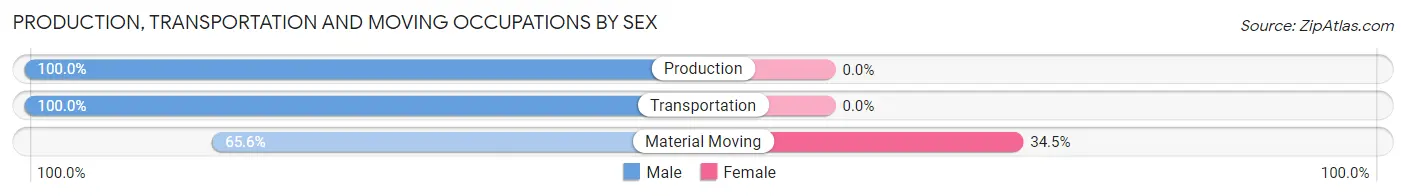
| Occupation | Male | Female |
| Production | 52 (100.0%) | 0 (0.0%) |
| Transportation | 6 (100.0%) | 0 (0.0%) |
| Material Moving | 78 (65.5%) | 41 (34.4%) |
| Total (Category) | 136 (76.8%) | 41 (23.2%) |
| Total (Overall) | 403 (47.6%) | 443 (52.4%) |
Employment Industries by Sex in Godley
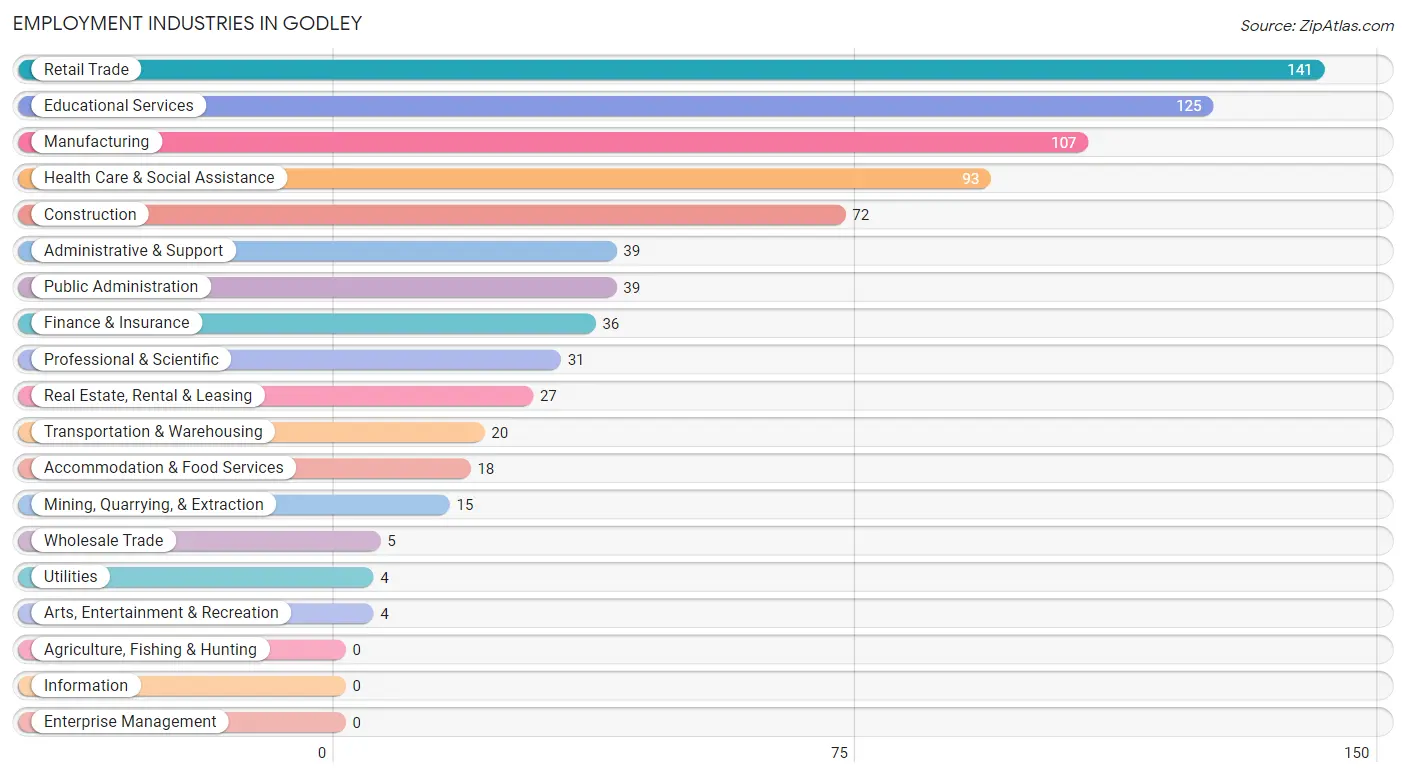
Employment Industries in Godley
The major employment industries in Godley include Retail Trade (141 | 16.7%), Educational Services (125 | 14.8%), Manufacturing (107 | 12.7%), Health Care & Social Assistance (93 | 11.0%), and Construction (72 | 8.5%).
Employment Industries by Sex in Godley
The Godley industries that see more men than women are Mining, Quarrying, & Extraction (100.0%), Construction (100.0%), and Transportation & Warehousing (100.0%), whereas the industries that tend to have a higher number of women are Wholesale Trade (100.0%), Real Estate, Rental & Leasing (100.0%), and Professional & Scientific (100.0%).
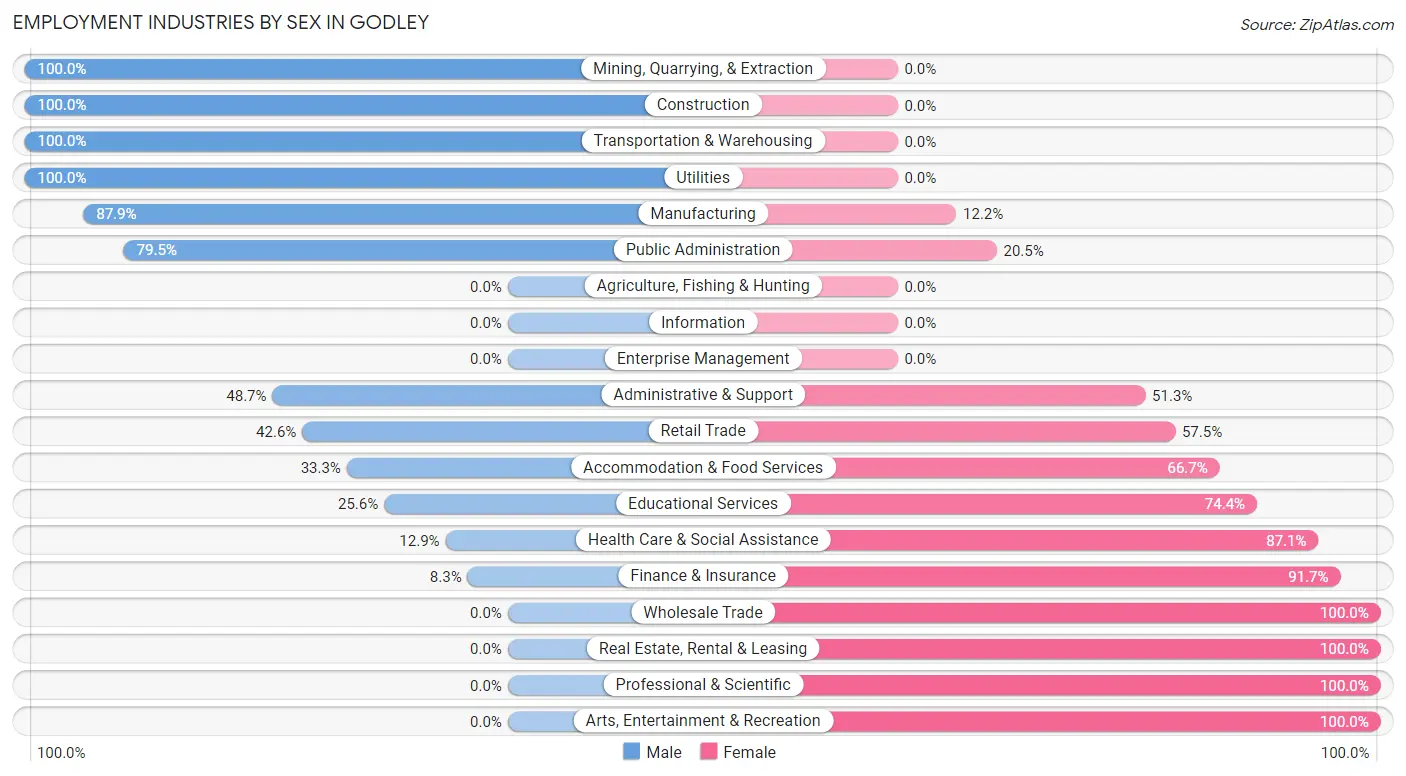
| Industry | Male | Female |
| Agriculture, Fishing & Hunting | 0 (0.0%) | 0 (0.0%) |
| Mining, Quarrying, & Extraction | 15 (100.0%) | 0 (0.0%) |
| Construction | 72 (100.0%) | 0 (0.0%) |
| Manufacturing | 94 (87.8%) | 13 (12.1%) |
| Wholesale Trade | 0 (0.0%) | 5 (100.0%) |
| Retail Trade | 60 (42.5%) | 81 (57.5%) |
| Transportation & Warehousing | 20 (100.0%) | 0 (0.0%) |
| Utilities | 4 (100.0%) | 0 (0.0%) |
| Information | 0 (0.0%) | 0 (0.0%) |
| Finance & Insurance | 3 (8.3%) | 33 (91.7%) |
| Real Estate, Rental & Leasing | 0 (0.0%) | 27 (100.0%) |
| Professional & Scientific | 0 (0.0%) | 31 (100.0%) |
| Enterprise Management | 0 (0.0%) | 0 (0.0%) |
| Administrative & Support | 19 (48.7%) | 20 (51.3%) |
| Educational Services | 32 (25.6%) | 93 (74.4%) |
| Health Care & Social Assistance | 12 (12.9%) | 81 (87.1%) |
| Arts, Entertainment & Recreation | 0 (0.0%) | 4 (100.0%) |
| Accommodation & Food Services | 6 (33.3%) | 12 (66.7%) |
| Public Administration | 31 (79.5%) | 8 (20.5%) |
| Total | 403 (47.6%) | 443 (52.4%) |
Education in Godley
School Enrollment in Godley
The most common levels of schooling among the 419 students in Godley are middle school (116 | 27.7%), high school (106 | 25.3%), and college / undergraduate (84 | 20.1%).
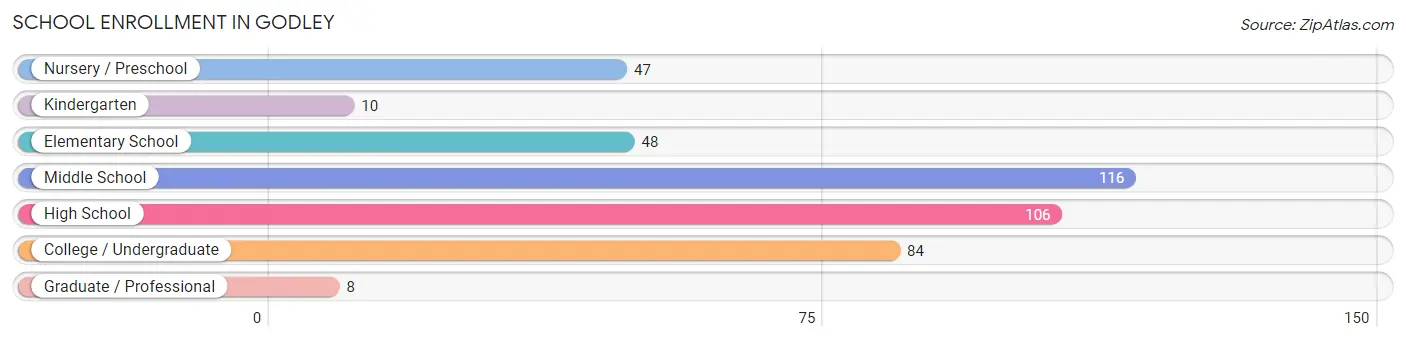
| School Level | # Students | % Students |
| Nursery / Preschool | 47 | 11.2% |
| Kindergarten | 10 | 2.4% |
| Elementary School | 48 | 11.5% |
| Middle School | 116 | 27.7% |
| High School | 106 | 25.3% |
| College / Undergraduate | 84 | 20.1% |
| Graduate / Professional | 8 | 1.9% |
| Total | 419 | 100.0% |
School Enrollment by Age by Funding Source in Godley
Out of a total of 419 students who are enrolled in schools in Godley, 64 (15.3%) attend a private institution, while the remaining 355 (84.7%) are enrolled in public schools. The age group of 3 to 4 year olds has the highest likelihood of being enrolled in private schools, with 9 (60.0% in the age bracket) enrolled. Conversely, the age group of 25 to 34 year olds has the lowest likelihood of being enrolled in a private school, with 4 (100.0% in the age bracket) attending a public institution.
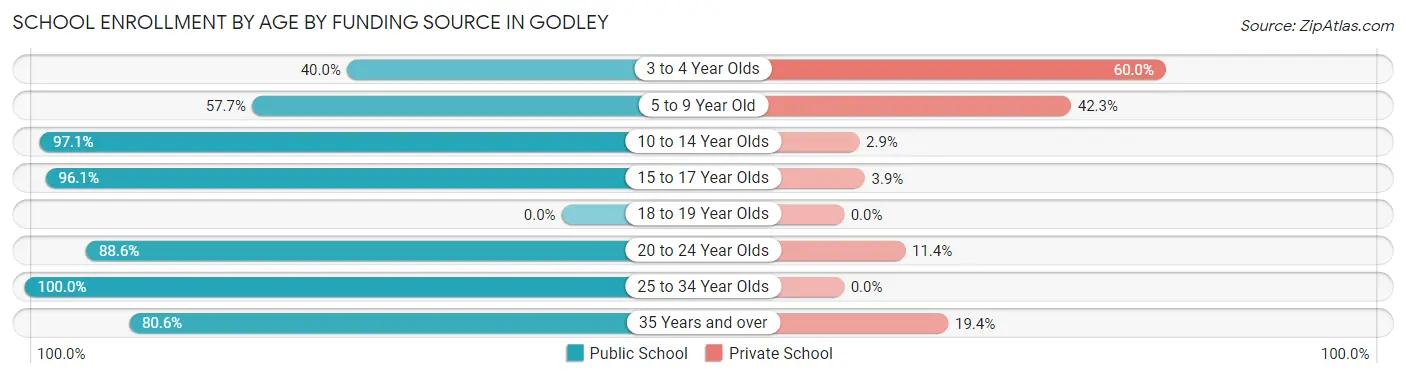
| Age Bracket | Public School | Private School |
| 3 to 4 Year Olds | 6 (40.0%) | 9 (60.0%) |
| 5 to 9 Year Old | 45 (57.7%) | 33 (42.3%) |
| 10 to 14 Year Olds | 135 (97.1%) | 4 (2.9%) |
| 15 to 17 Year Olds | 74 (96.1%) | 3 (3.9%) |
| 18 to 19 Year Olds | 0 (0.0%) | 0 (0.0%) |
| 20 to 24 Year Olds | 62 (88.6%) | 8 (11.4%) |
| 25 to 34 Year Olds | 4 (100.0%) | 0 (0.0%) |
| 35 Years and over | 29 (80.6%) | 7 (19.4%) |
| Total | 355 (84.7%) | 64 (15.3%) |
Educational Attainment by Field of Study in Godley
Education (52 | 28.9%), science & technology (27 | 15.0%), multidisciplinary studies (20 | 11.1%), arts & humanities (19 | 10.6%), and business (16 | 8.9%) are the most common fields of study among 180 individuals in Godley who have obtained a bachelor's degree or higher.
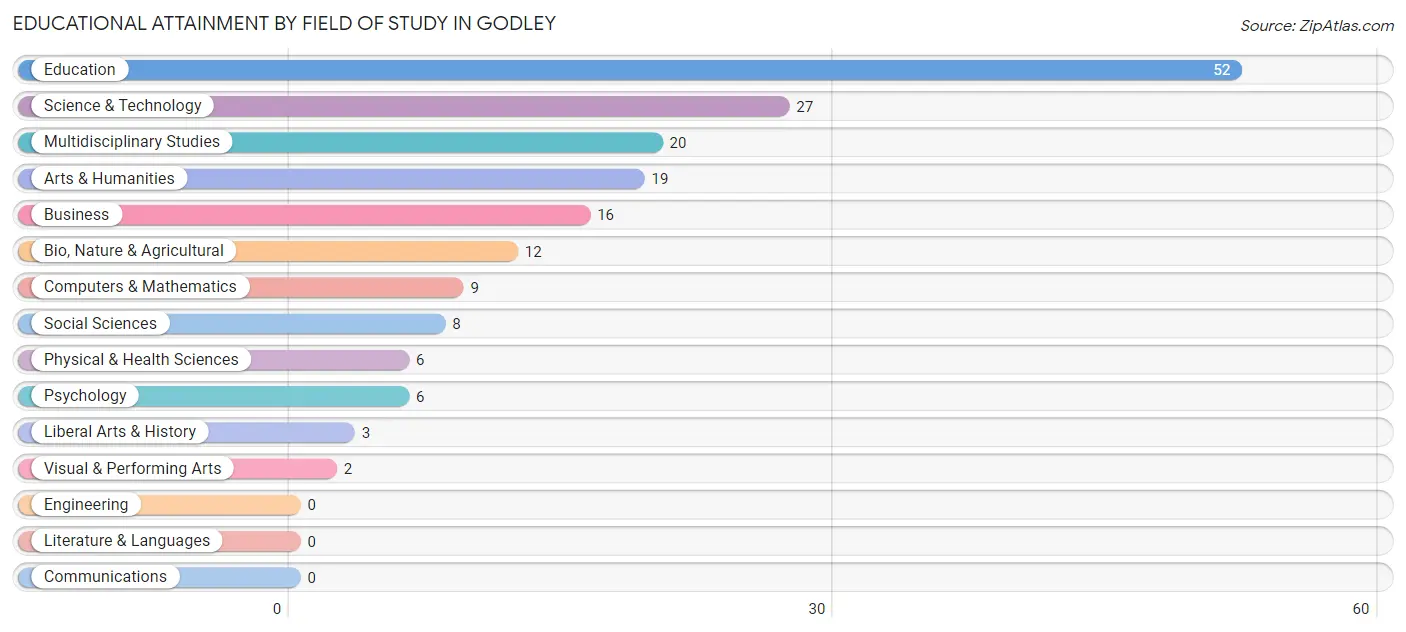
| Field of Study | # Graduates | % Graduates |
| Computers & Mathematics | 9 | 5.0% |
| Bio, Nature & Agricultural | 12 | 6.7% |
| Physical & Health Sciences | 6 | 3.3% |
| Psychology | 6 | 3.3% |
| Social Sciences | 8 | 4.4% |
| Engineering | 0 | 0.0% |
| Multidisciplinary Studies | 20 | 11.1% |
| Science & Technology | 27 | 15.0% |
| Business | 16 | 8.9% |
| Education | 52 | 28.9% |
| Literature & Languages | 0 | 0.0% |
| Liberal Arts & History | 3 | 1.7% |
| Visual & Performing Arts | 2 | 1.1% |
| Communications | 0 | 0.0% |
| Arts & Humanities | 19 | 10.6% |
| Total | 180 | 100.0% |
Transportation & Commute in Godley
Vehicle Availability by Sex in Godley
The most prevalent vehicle ownership categories in Godley are males with 2 vehicles (264, accounting for 65.5%) and females with 2 vehicles (247, making up 59.6%).
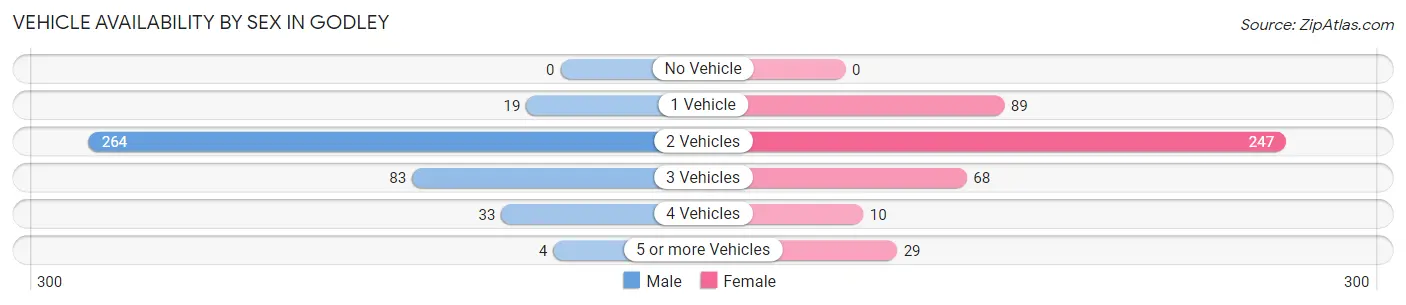
| Vehicles Available | Male | Female |
| No Vehicle | 0 (0.0%) | 0 (0.0%) |
| 1 Vehicle | 19 (4.7%) | 89 (20.1%) |
| 2 Vehicles | 264 (65.5%) | 247 (55.8%) |
| 3 Vehicles | 83 (20.6%) | 68 (15.3%) |
| 4 Vehicles | 33 (8.2%) | 10 (2.3%) |
| 5 or more Vehicles | 4 (1.0%) | 29 (6.6%) |
| Total | 403 (100.0%) | 443 (100.0%) |
Commute Time in Godley
The most frequently occuring commute durations in Godley are 30 to 34 minutes (210 commuters, 26.6%), 45 to 59 minutes (90 commuters, 11.4%), and 10 to 14 minutes (89 commuters, 11.3%).
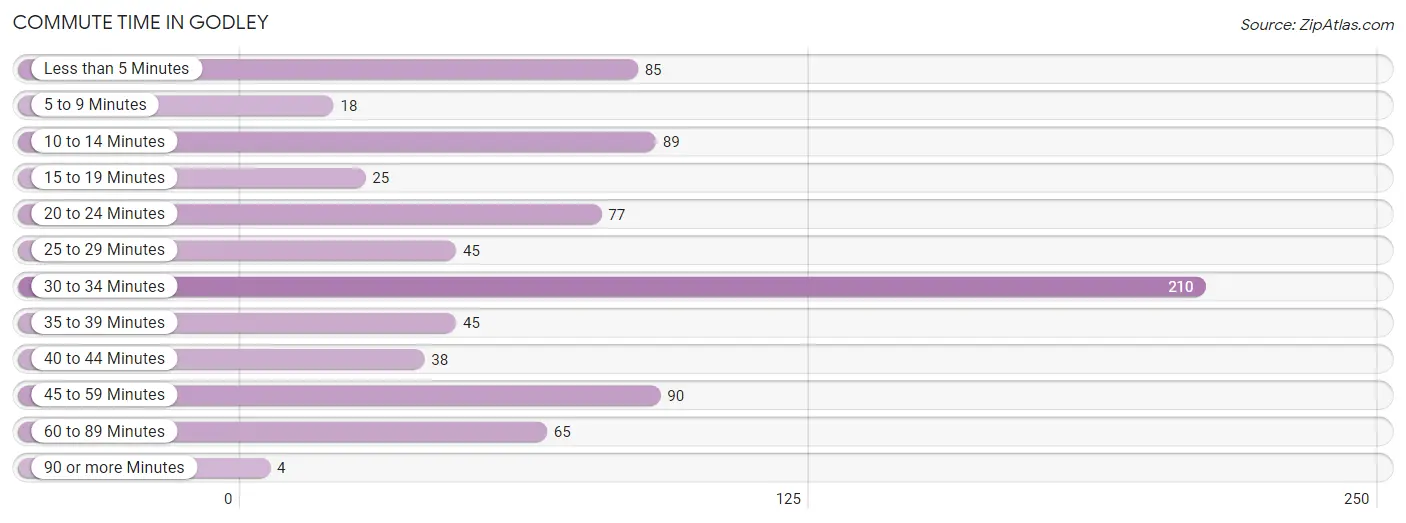
| Commute Time | # Commuters | % Commuters |
| Less than 5 Minutes | 85 | 10.7% |
| 5 to 9 Minutes | 18 | 2.3% |
| 10 to 14 Minutes | 89 | 11.3% |
| 15 to 19 Minutes | 25 | 3.2% |
| 20 to 24 Minutes | 77 | 9.7% |
| 25 to 29 Minutes | 45 | 5.7% |
| 30 to 34 Minutes | 210 | 26.6% |
| 35 to 39 Minutes | 45 | 5.7% |
| 40 to 44 Minutes | 38 | 4.8% |
| 45 to 59 Minutes | 90 | 11.4% |
| 60 to 89 Minutes | 65 | 8.2% |
| 90 or more Minutes | 4 | 0.5% |
Commute Time by Sex in Godley
The most common commute times in Godley are 30 to 34 minutes (97 commuters, 24.8%) for males and 30 to 34 minutes (113 commuters, 28.2%) for females.
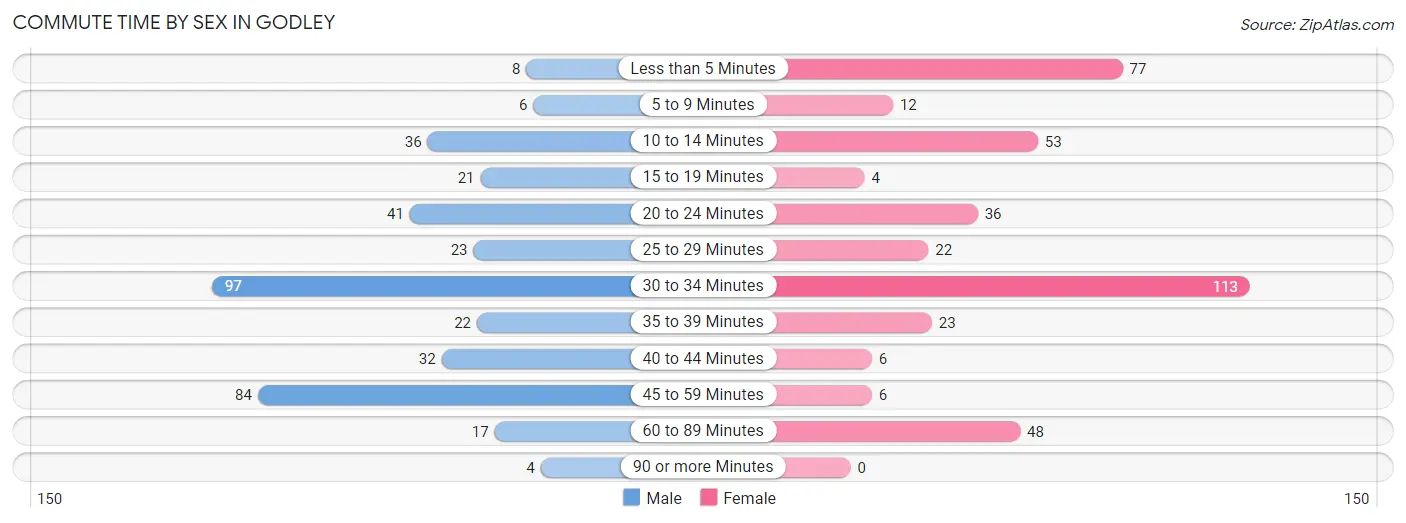
| Commute Time | Male | Female |
| Less than 5 Minutes | 8 (2.1%) | 77 (19.3%) |
| 5 to 9 Minutes | 6 (1.5%) | 12 (3.0%) |
| 10 to 14 Minutes | 36 (9.2%) | 53 (13.3%) |
| 15 to 19 Minutes | 21 (5.4%) | 4 (1.0%) |
| 20 to 24 Minutes | 41 (10.5%) | 36 (9.0%) |
| 25 to 29 Minutes | 23 (5.9%) | 22 (5.5%) |
| 30 to 34 Minutes | 97 (24.8%) | 113 (28.2%) |
| 35 to 39 Minutes | 22 (5.6%) | 23 (5.8%) |
| 40 to 44 Minutes | 32 (8.2%) | 6 (1.5%) |
| 45 to 59 Minutes | 84 (21.5%) | 6 (1.5%) |
| 60 to 89 Minutes | 17 (4.3%) | 48 (12.0%) |
| 90 or more Minutes | 4 (1.0%) | 0 (0.0%) |
Time of Departure to Work by Sex in Godley
The most frequent times of departure to work in Godley are 7:00 AM to 7:29 AM (103, 26.3%) for males and 7:00 AM to 7:29 AM (118, 29.5%) for females.
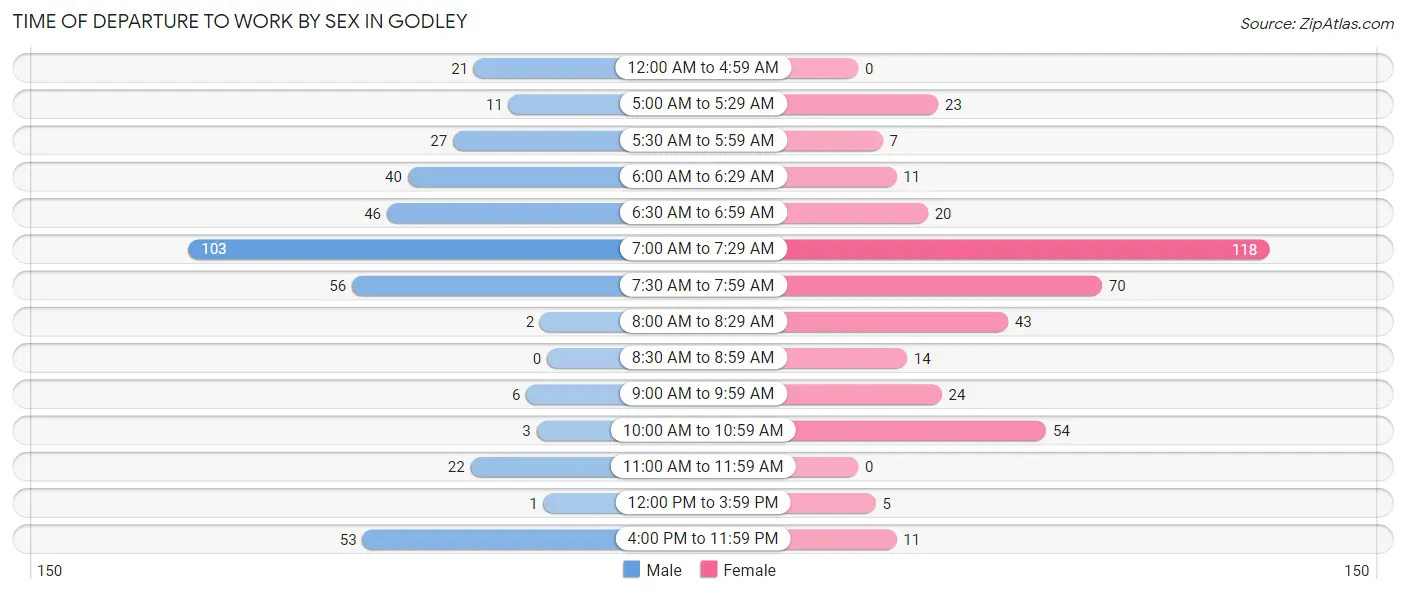
| Time of Departure | Male | Female |
| 12:00 AM to 4:59 AM | 21 (5.4%) | 0 (0.0%) |
| 5:00 AM to 5:29 AM | 11 (2.8%) | 23 (5.8%) |
| 5:30 AM to 5:59 AM | 27 (6.9%) | 7 (1.8%) |
| 6:00 AM to 6:29 AM | 40 (10.2%) | 11 (2.8%) |
| 6:30 AM to 6:59 AM | 46 (11.8%) | 20 (5.0%) |
| 7:00 AM to 7:29 AM | 103 (26.3%) | 118 (29.5%) |
| 7:30 AM to 7:59 AM | 56 (14.3%) | 70 (17.5%) |
| 8:00 AM to 8:29 AM | 2 (0.5%) | 43 (10.7%) |
| 8:30 AM to 8:59 AM | 0 (0.0%) | 14 (3.5%) |
| 9:00 AM to 9:59 AM | 6 (1.5%) | 24 (6.0%) |
| 10:00 AM to 10:59 AM | 3 (0.8%) | 54 (13.5%) |
| 11:00 AM to 11:59 AM | 22 (5.6%) | 0 (0.0%) |
| 12:00 PM to 3:59 PM | 1 (0.3%) | 5 (1.3%) |
| 4:00 PM to 11:59 PM | 53 (13.6%) | 11 (2.8%) |
| Total | 391 (100.0%) | 400 (100.0%) |
Housing Occupancy in Godley
Occupancy by Ownership in Godley
Of the total 705 dwellings in Godley, owner-occupied units account for 572 (81.1%), while renter-occupied units make up 133 (18.9%).
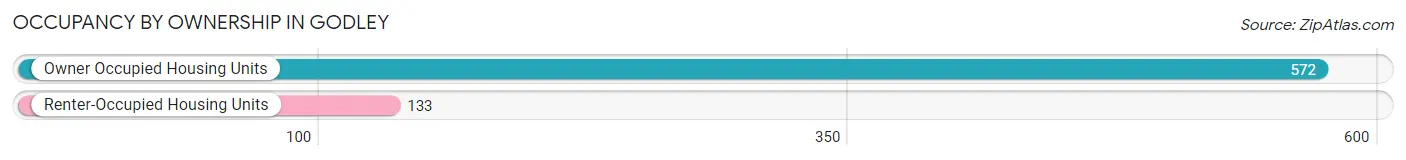
| Occupancy | # Housing Units | % Housing Units |
| Owner Occupied Housing Units | 572 | 81.1% |
| Renter-Occupied Housing Units | 133 | 18.9% |
| Total Occupied Housing Units | 705 | 100.0% |
Occupancy by Household Size in Godley
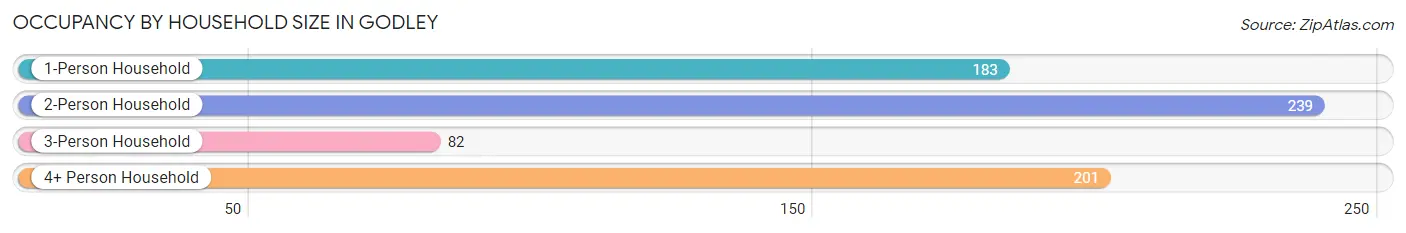
| Household Size | # Housing Units | % Housing Units |
| 1-Person Household | 183 | 26.0% |
| 2-Person Household | 239 | 33.9% |
| 3-Person Household | 82 | 11.6% |
| 4+ Person Household | 201 | 28.5% |
| Total Housing Units | 705 | 100.0% |
Occupancy by Ownership by Household Size in Godley
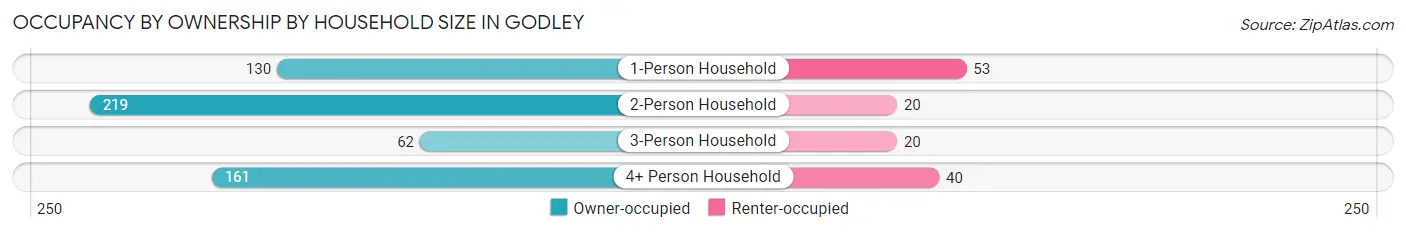
| Household Size | Owner-occupied | Renter-occupied |
| 1-Person Household | 130 (71.0%) | 53 (29.0%) |
| 2-Person Household | 219 (91.6%) | 20 (8.4%) |
| 3-Person Household | 62 (75.6%) | 20 (24.4%) |
| 4+ Person Household | 161 (80.1%) | 40 (19.9%) |
| Total Housing Units | 572 (81.1%) | 133 (18.9%) |
Occupancy by Educational Attainment in Godley
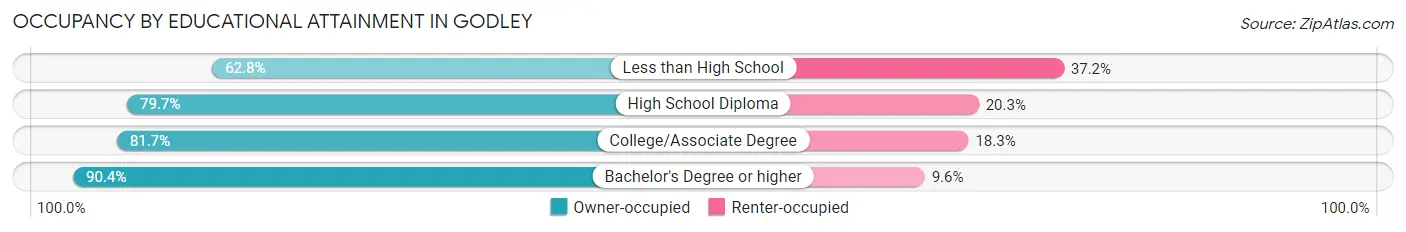
| Household Size | Owner-occupied | Renter-occupied |
| Less than High School | 27 (62.8%) | 16 (37.2%) |
| High School Diploma | 192 (79.7%) | 49 (20.3%) |
| College/Associate Degree | 259 (81.7%) | 58 (18.3%) |
| Bachelor's Degree or higher | 94 (90.4%) | 10 (9.6%) |
Occupancy by Age of Householder in Godley
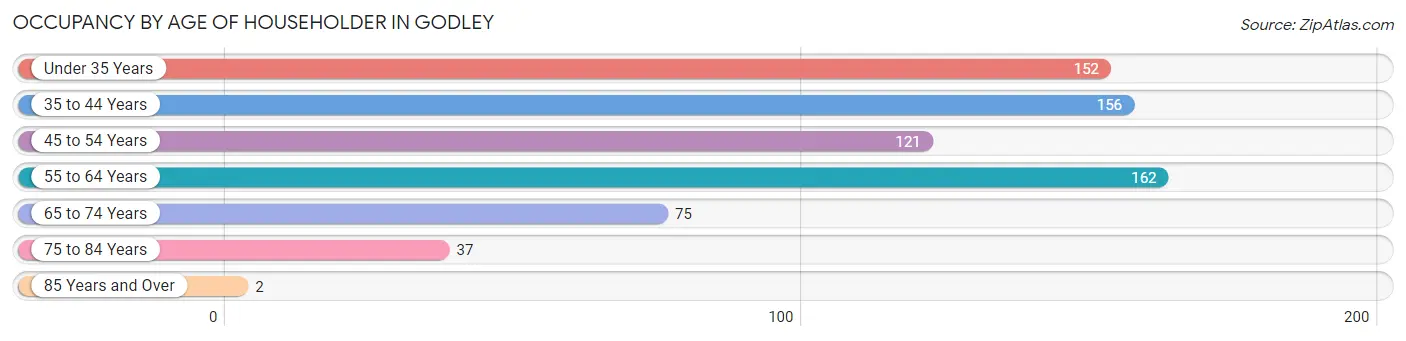
| Age Bracket | # Households | % Households |
| Under 35 Years | 152 | 21.6% |
| 35 to 44 Years | 156 | 22.1% |
| 45 to 54 Years | 121 | 17.2% |
| 55 to 64 Years | 162 | 23.0% |
| 65 to 74 Years | 75 | 10.6% |
| 75 to 84 Years | 37 | 5.2% |
| 85 Years and Over | 2 | 0.3% |
| Total | 705 | 100.0% |
Housing Finances in Godley
Median Income by Occupancy in Godley
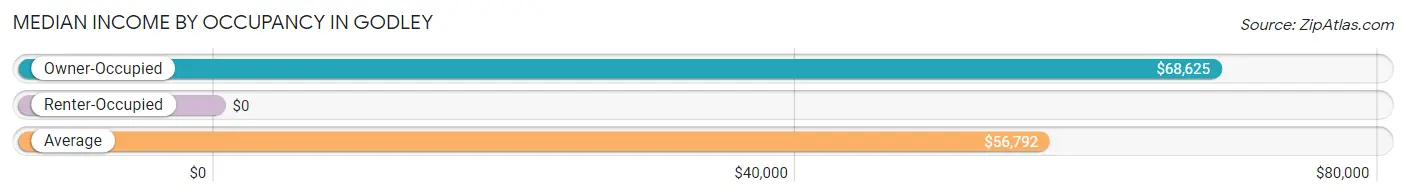
| Occupancy Type | # Households | Median Income |
| Owner-Occupied | 572 (81.1%) | $68,625 |
| Renter-Occupied | 133 (18.9%) | $0 |
| Average | 705 (100.0%) | $56,792 |
Occupancy by Householder Income Bracket in Godley
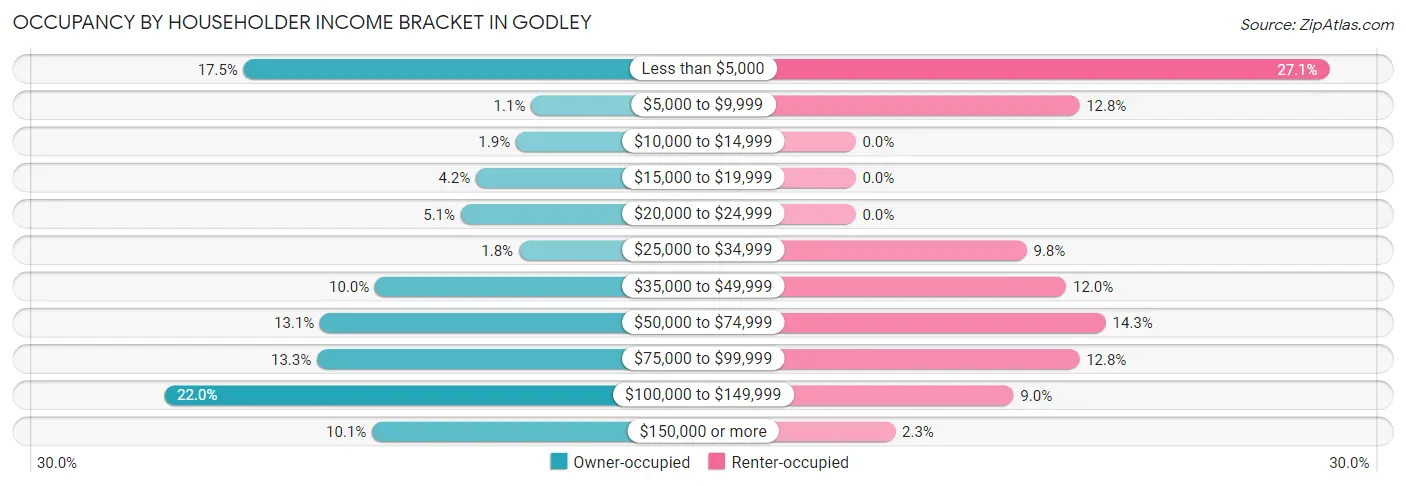
| Income Bracket | Owner-occupied | Renter-occupied |
| Less than $5,000 | 100 (17.5%) | 36 (27.1%) |
| $5,000 to $9,999 | 6 (1.1%) | 17 (12.8%) |
| $10,000 to $14,999 | 11 (1.9%) | 0 (0.0%) |
| $15,000 to $19,999 | 24 (4.2%) | 0 (0.0%) |
| $20,000 to $24,999 | 29 (5.1%) | 0 (0.0%) |
| $25,000 to $34,999 | 10 (1.8%) | 13 (9.8%) |
| $35,000 to $49,999 | 57 (10.0%) | 16 (12.0%) |
| $50,000 to $74,999 | 75 (13.1%) | 19 (14.3%) |
| $75,000 to $99,999 | 76 (13.3%) | 17 (12.8%) |
| $100,000 to $149,999 | 126 (22.0%) | 12 (9.0%) |
| $150,000 or more | 58 (10.1%) | 3 (2.3%) |
| Total | 572 (100.0%) | 133 (100.0%) |
Monthly Housing Cost Tiers in Godley
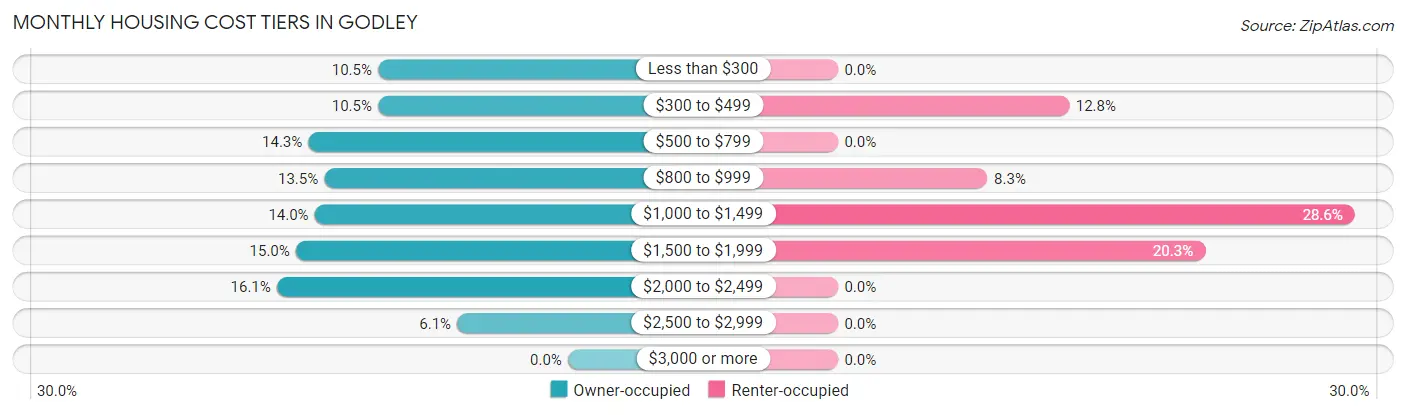
| Monthly Cost | Owner-occupied | Renter-occupied |
| Less than $300 | 60 (10.5%) | 0 (0.0%) |
| $300 to $499 | 60 (10.5%) | 17 (12.8%) |
| $500 to $799 | 82 (14.3%) | 0 (0.0%) |
| $800 to $999 | 77 (13.5%) | 11 (8.3%) |
| $1,000 to $1,499 | 80 (14.0%) | 38 (28.6%) |
| $1,500 to $1,999 | 86 (15.0%) | 27 (20.3%) |
| $2,000 to $2,499 | 92 (16.1%) | 0 (0.0%) |
| $2,500 to $2,999 | 35 (6.1%) | 0 (0.0%) |
| $3,000 or more | 0 (0.0%) | 0 (0.0%) |
| Total | 572 (100.0%) | 133 (100.0%) |
Physical Housing Characteristics in Godley
Housing Structures in Godley
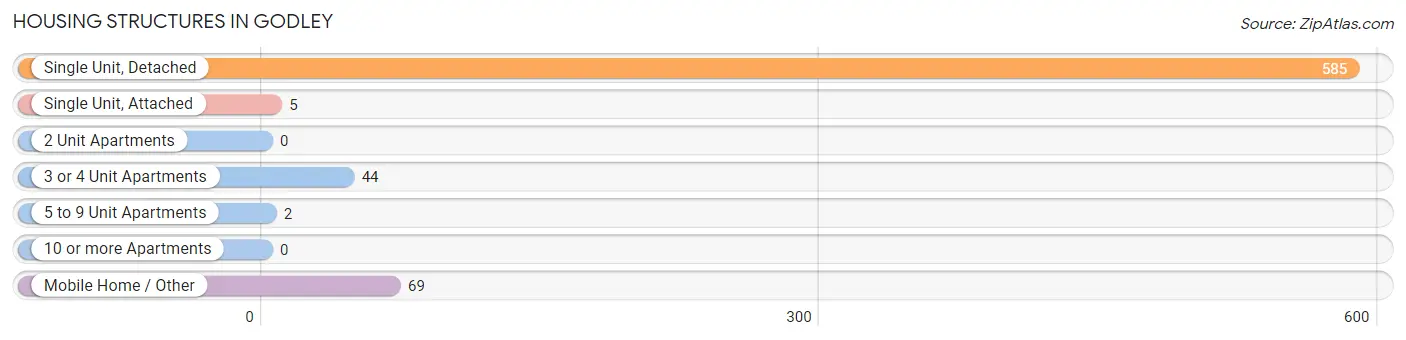
| Structure Type | # Housing Units | % Housing Units |
| Single Unit, Detached | 585 | 83.0% |
| Single Unit, Attached | 5 | 0.7% |
| 2 Unit Apartments | 0 | 0.0% |
| 3 or 4 Unit Apartments | 44 | 6.2% |
| 5 to 9 Unit Apartments | 2 | 0.3% |
| 10 or more Apartments | 0 | 0.0% |
| Mobile Home / Other | 69 | 9.8% |
| Total | 705 | 100.0% |
Housing Structures by Occupancy in Godley
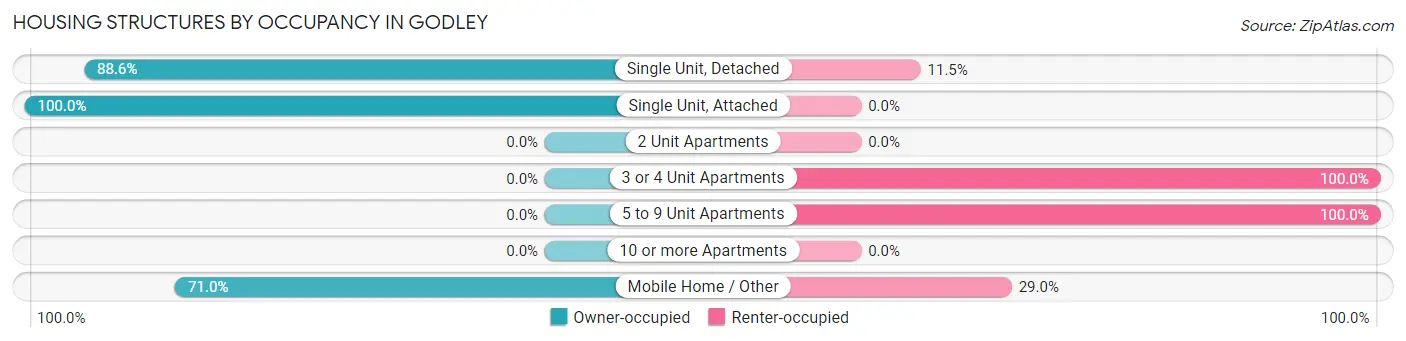
| Structure Type | Owner-occupied | Renter-occupied |
| Single Unit, Detached | 518 (88.5%) | 67 (11.5%) |
| Single Unit, Attached | 5 (100.0%) | 0 (0.0%) |
| 2 Unit Apartments | 0 (0.0%) | 0 (0.0%) |
| 3 or 4 Unit Apartments | 0 (0.0%) | 44 (100.0%) |
| 5 to 9 Unit Apartments | 0 (0.0%) | 2 (100.0%) |
| 10 or more Apartments | 0 (0.0%) | 0 (0.0%) |
| Mobile Home / Other | 49 (71.0%) | 20 (29.0%) |
| Total | 572 (81.1%) | 133 (18.9%) |
Housing Structures by Number of Rooms in Godley
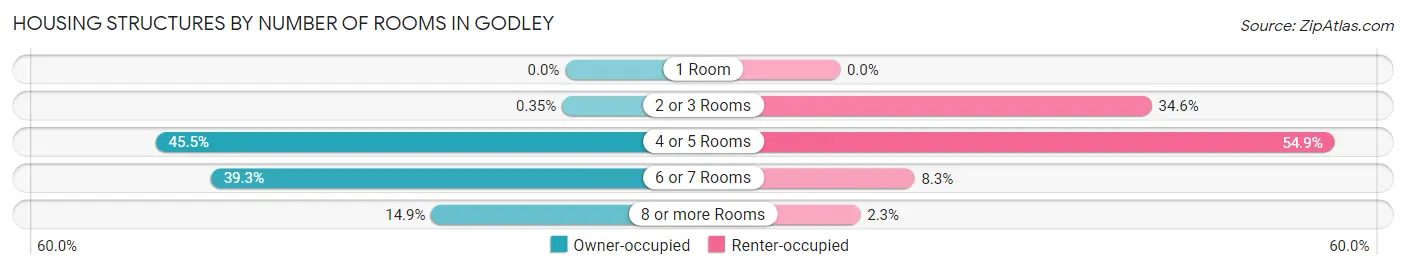
| Number of Rooms | Owner-occupied | Renter-occupied |
| 1 Room | 0 (0.0%) | 0 (0.0%) |
| 2 or 3 Rooms | 2 (0.4%) | 46 (34.6%) |
| 4 or 5 Rooms | 260 (45.5%) | 73 (54.9%) |
| 6 or 7 Rooms | 225 (39.3%) | 11 (8.3%) |
| 8 or more Rooms | 85 (14.9%) | 3 (2.3%) |
| Total | 572 (100.0%) | 133 (100.0%) |
Housing Structure by Heating Type in Godley
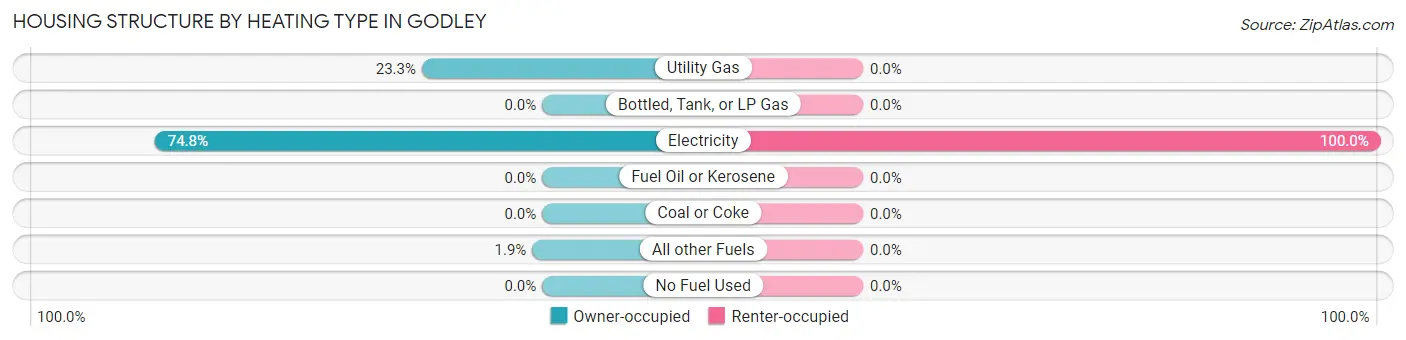
| Heating Type | Owner-occupied | Renter-occupied |
| Utility Gas | 133 (23.3%) | 0 (0.0%) |
| Bottled, Tank, or LP Gas | 0 (0.0%) | 0 (0.0%) |
| Electricity | 428 (74.8%) | 133 (100.0%) |
| Fuel Oil or Kerosene | 0 (0.0%) | 0 (0.0%) |
| Coal or Coke | 0 (0.0%) | 0 (0.0%) |
| All other Fuels | 11 (1.9%) | 0 (0.0%) |
| No Fuel Used | 0 (0.0%) | 0 (0.0%) |
| Total | 572 (100.0%) | 133 (100.0%) |
Household Vehicle Usage in Godley
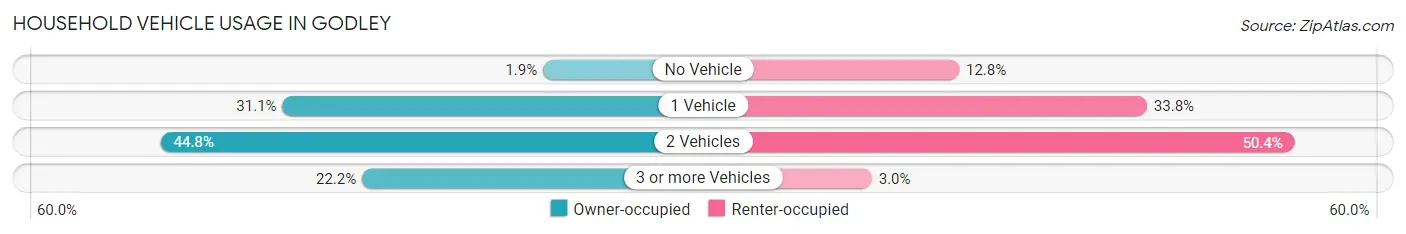
| Vehicles per Household | Owner-occupied | Renter-occupied |
| No Vehicle | 11 (1.9%) | 17 (12.8%) |
| 1 Vehicle | 178 (31.1%) | 45 (33.8%) |
| 2 Vehicles | 256 (44.8%) | 67 (50.4%) |
| 3 or more Vehicles | 127 (22.2%) | 4 (3.0%) |
| Total | 572 (100.0%) | 133 (100.0%) |
Real Estate & Mortgages in Godley
Real Estate and Mortgage Overview in Godley
| Characteristic | Without Mortgage | With Mortgage |
| Housing Units | 231 | 341 |
| Median Property Value | - | - |
| Median Household Income | $55,956 | $51 |
| Monthly Housing Costs | $501 | $0 |
| Real Estate Taxes | $2,116 | $16 |
Property Value by Mortgage Status in Godley
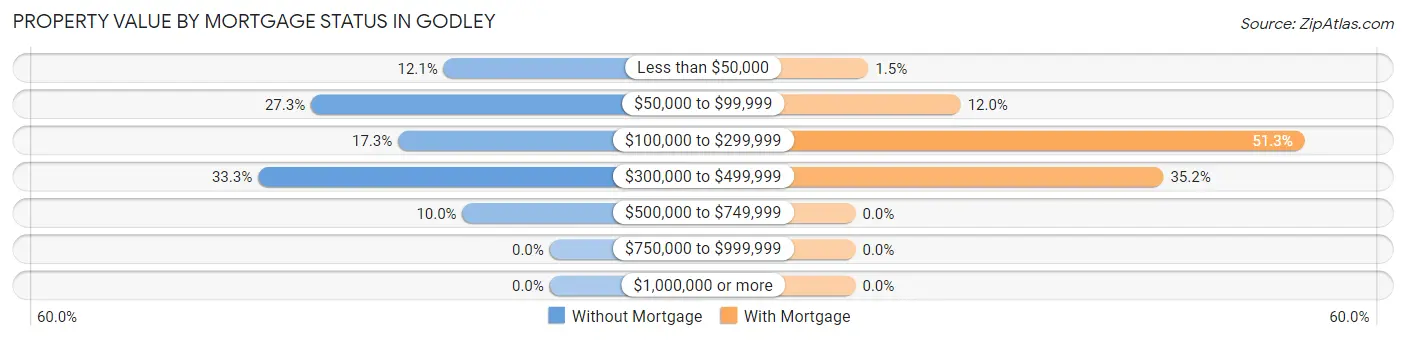
| Property Value | Without Mortgage | With Mortgage |
| Less than $50,000 | 28 (12.1%) | 5 (1.5%) |
| $50,000 to $99,999 | 63 (27.3%) | 41 (12.0%) |
| $100,000 to $299,999 | 40 (17.3%) | 175 (51.3%) |
| $300,000 to $499,999 | 77 (33.3%) | 120 (35.2%) |
| $500,000 to $749,999 | 23 (10.0%) | 0 (0.0%) |
| $750,000 to $999,999 | 0 (0.0%) | 0 (0.0%) |
| $1,000,000 or more | 0 (0.0%) | 0 (0.0%) |
| Total | 231 (100.0%) | 341 (100.0%) |
Household Income by Mortgage Status in Godley
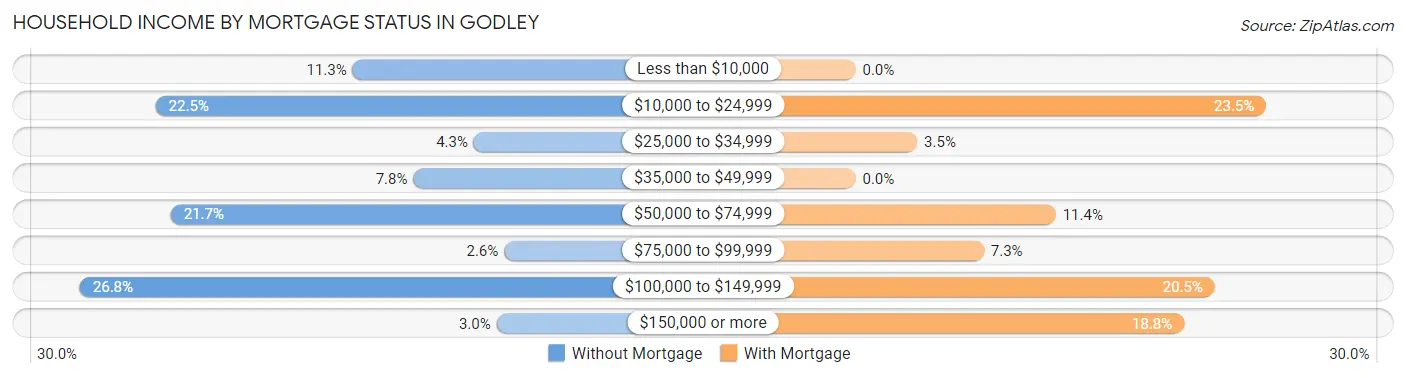
| Household Income | Without Mortgage | With Mortgage |
| Less than $10,000 | 26 (11.3%) | 0 (0.0%) |
| $10,000 to $24,999 | 52 (22.5%) | 80 (23.5%) |
| $25,000 to $34,999 | 10 (4.3%) | 12 (3.5%) |
| $35,000 to $49,999 | 18 (7.8%) | 0 (0.0%) |
| $50,000 to $74,999 | 50 (21.6%) | 39 (11.4%) |
| $75,000 to $99,999 | 6 (2.6%) | 25 (7.3%) |
| $100,000 to $149,999 | 62 (26.8%) | 70 (20.5%) |
| $150,000 or more | 7 (3.0%) | 64 (18.8%) |
| Total | 231 (100.0%) | 341 (100.0%) |
Property Value to Household Income Ratio in Godley
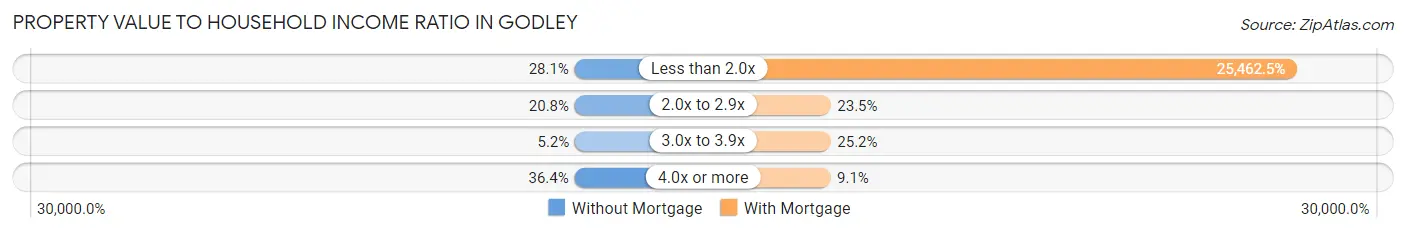
| Value-to-Income Ratio | Without Mortgage | With Mortgage |
| Less than 2.0x | 65 (28.1%) | 86,827 (25,462.5%) |
| 2.0x to 2.9x | 48 (20.8%) | 80 (23.5%) |
| 3.0x to 3.9x | 12 (5.2%) | 86 (25.2%) |
| 4.0x or more | 84 (36.4%) | 31 (9.1%) |
| Total | 231 (100.0%) | 341 (100.0%) |
Real Estate Taxes by Mortgage Status in Godley
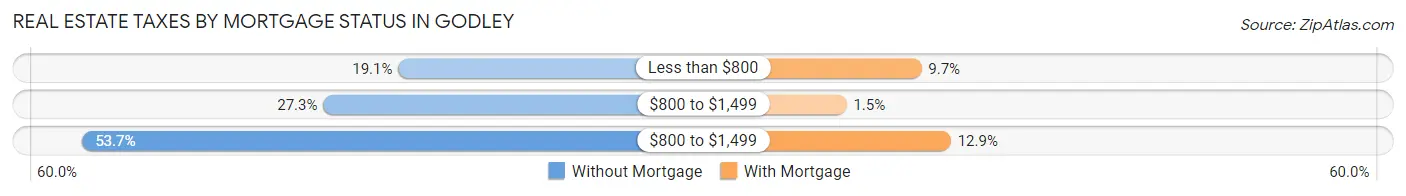
| Property Taxes | Without Mortgage | With Mortgage |
| Less than $800 | 44 (19.1%) | 33 (9.7%) |
| $800 to $1,499 | 63 (27.3%) | 5 (1.5%) |
| $800 to $1,499 | 124 (53.7%) | 44 (12.9%) |
| Total | 231 (100.0%) | 341 (100.0%) |
Health & Disability in Godley
Health Insurance Coverage by Age in Godley
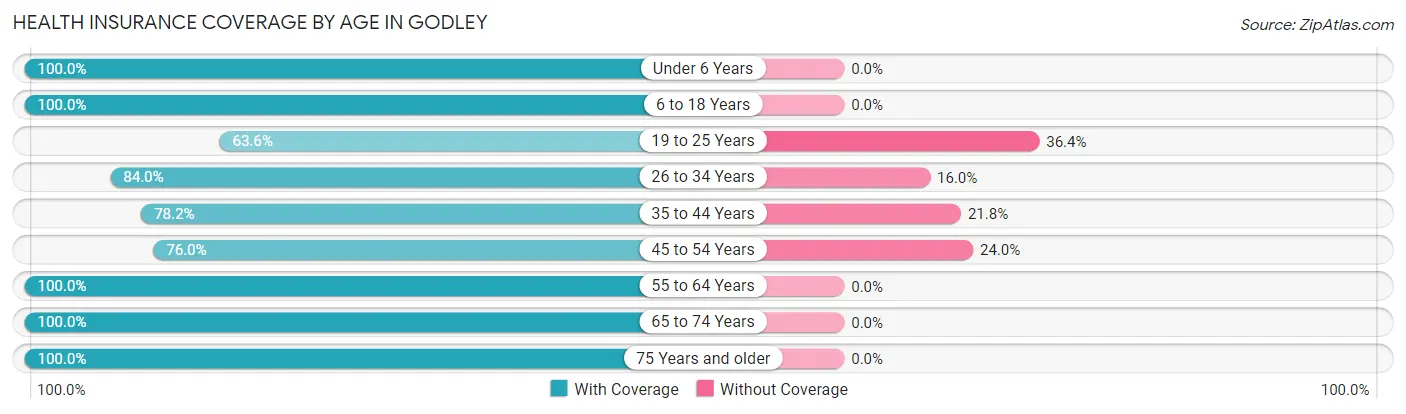
| Age Bracket | With Coverage | Without Coverage |
| Under 6 Years | 230 (100.0%) | 0 (0.0%) |
| 6 to 18 Years | 274 (100.0%) | 0 (0.0%) |
| 19 to 25 Years | 126 (63.6%) | 72 (36.4%) |
| 26 to 34 Years | 189 (84.0%) | 36 (16.0%) |
| 35 to 44 Years | 187 (78.2%) | 52 (21.8%) |
| 45 to 54 Years | 155 (76.0%) | 49 (24.0%) |
| 55 to 64 Years | 255 (100.0%) | 0 (0.0%) |
| 65 to 74 Years | 112 (100.0%) | 0 (0.0%) |
| 75 Years and older | 52 (100.0%) | 0 (0.0%) |
| Total | 1,580 (88.3%) | 209 (11.7%) |
Health Insurance Coverage by Citizenship Status in Godley
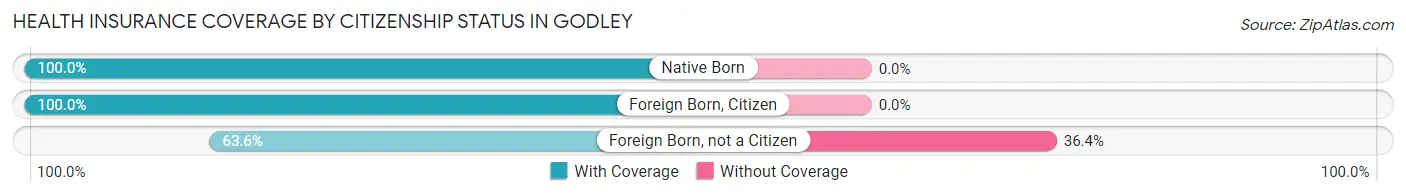
| Citizenship Status | With Coverage | Without Coverage |
| Native Born | 230 (100.0%) | 0 (0.0%) |
| Foreign Born, Citizen | 274 (100.0%) | 0 (0.0%) |
| Foreign Born, not a Citizen | 126 (63.6%) | 72 (36.4%) |
Health Insurance Coverage by Household Income in Godley
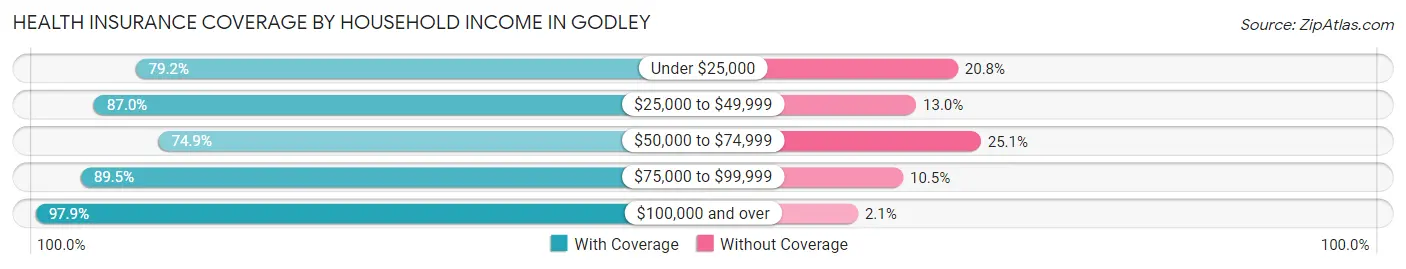
| Household Income | With Coverage | Without Coverage |
| Under $25,000 | 274 (79.2%) | 72 (20.8%) |
| $25,000 to $49,999 | 201 (87.0%) | 30 (13.0%) |
| $50,000 to $74,999 | 185 (74.9%) | 62 (25.1%) |
| $75,000 to $99,999 | 263 (89.5%) | 31 (10.5%) |
| $100,000 and over | 657 (97.9%) | 14 (2.1%) |
Public vs Private Health Insurance Coverage by Age in Godley
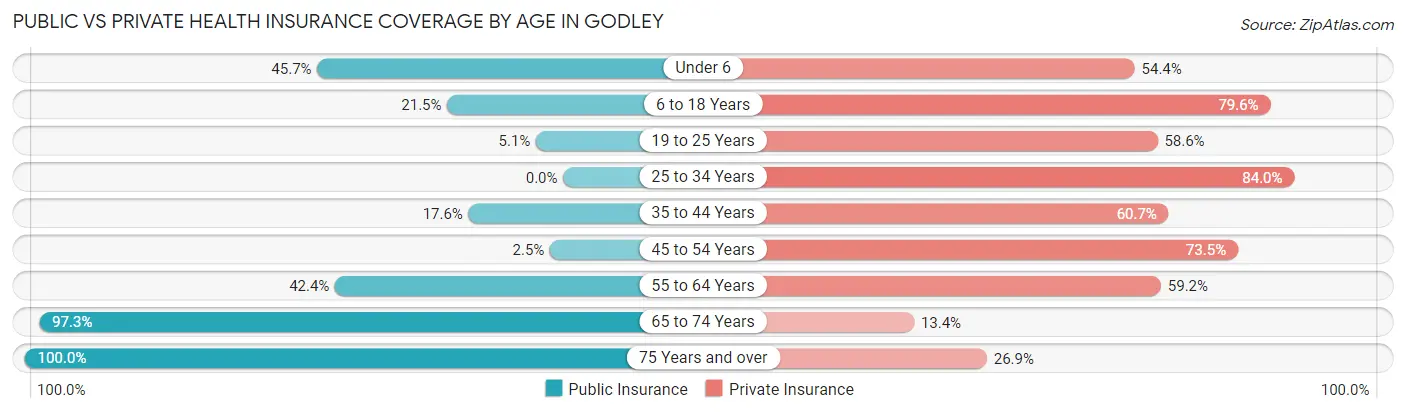
| Age Bracket | Public Insurance | Private Insurance |
| Under 6 | 105 (45.7%) | 125 (54.3%) |
| 6 to 18 Years | 59 (21.5%) | 218 (79.6%) |
| 19 to 25 Years | 10 (5.1%) | 116 (58.6%) |
| 25 to 34 Years | 0 (0.0%) | 189 (84.0%) |
| 35 to 44 Years | 42 (17.6%) | 145 (60.7%) |
| 45 to 54 Years | 5 (2.5%) | 150 (73.5%) |
| 55 to 64 Years | 108 (42.3%) | 151 (59.2%) |
| 65 to 74 Years | 109 (97.3%) | 15 (13.4%) |
| 75 Years and over | 52 (100.0%) | 14 (26.9%) |
| Total | 490 (27.4%) | 1,123 (62.8%) |
Disability Status by Sex by Age in Godley
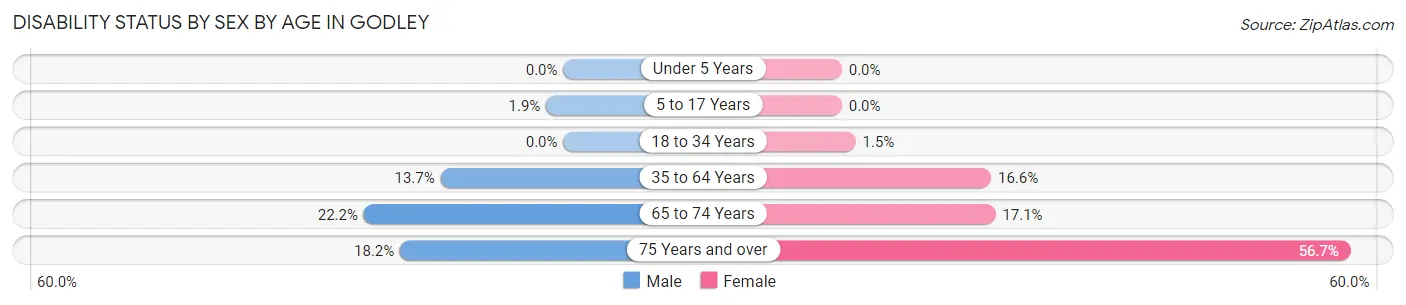
| Age Bracket | Male | Female |
| Under 5 Years | 0 (0.0%) | 0 (0.0%) |
| 5 to 17 Years | 3 (1.9%) | 0 (0.0%) |
| 18 to 34 Years | 0 (0.0%) | 4 (1.5%) |
| 35 to 64 Years | 42 (13.7%) | 65 (16.6%) |
| 65 to 74 Years | 8 (22.2%) | 13 (17.1%) |
| 75 Years and over | 4 (18.2%) | 17 (56.7%) |
Disability Class by Sex by Age in Godley
Disability Class: Hearing Difficulty
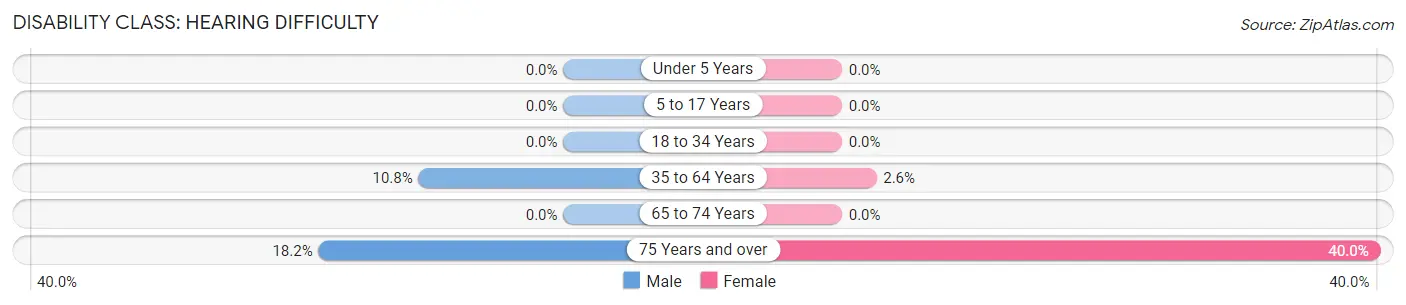
| Age Bracket | Male | Female |
| Under 5 Years | 0 (0.0%) | 0 (0.0%) |
| 5 to 17 Years | 0 (0.0%) | 0 (0.0%) |
| 18 to 34 Years | 0 (0.0%) | 0 (0.0%) |
| 35 to 64 Years | 33 (10.7%) | 10 (2.6%) |
| 65 to 74 Years | 0 (0.0%) | 0 (0.0%) |
| 75 Years and over | 4 (18.2%) | 12 (40.0%) |
Disability Class: Vision Difficulty
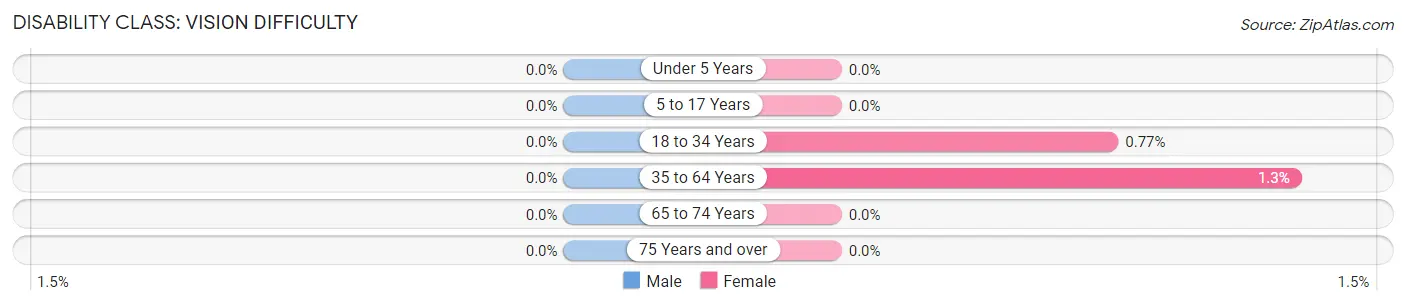
| Age Bracket | Male | Female |
| Under 5 Years | 0 (0.0%) | 0 (0.0%) |
| 5 to 17 Years | 0 (0.0%) | 0 (0.0%) |
| 18 to 34 Years | 0 (0.0%) | 2 (0.8%) |
| 35 to 64 Years | 0 (0.0%) | 5 (1.3%) |
| 65 to 74 Years | 0 (0.0%) | 0 (0.0%) |
| 75 Years and over | 0 (0.0%) | 0 (0.0%) |
Disability Class: Cognitive Difficulty
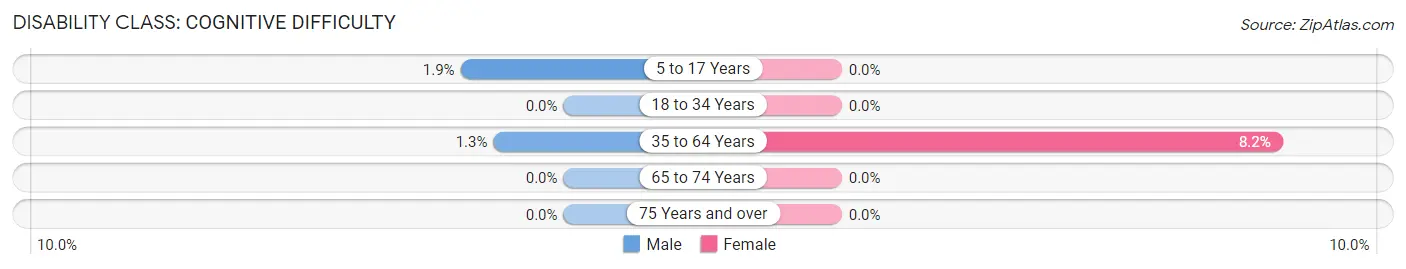
| Age Bracket | Male | Female |
| 5 to 17 Years | 3 (1.9%) | 0 (0.0%) |
| 18 to 34 Years | 0 (0.0%) | 0 (0.0%) |
| 35 to 64 Years | 4 (1.3%) | 32 (8.2%) |
| 65 to 74 Years | 0 (0.0%) | 0 (0.0%) |
| 75 Years and over | 0 (0.0%) | 0 (0.0%) |
Disability Class: Ambulatory Difficulty
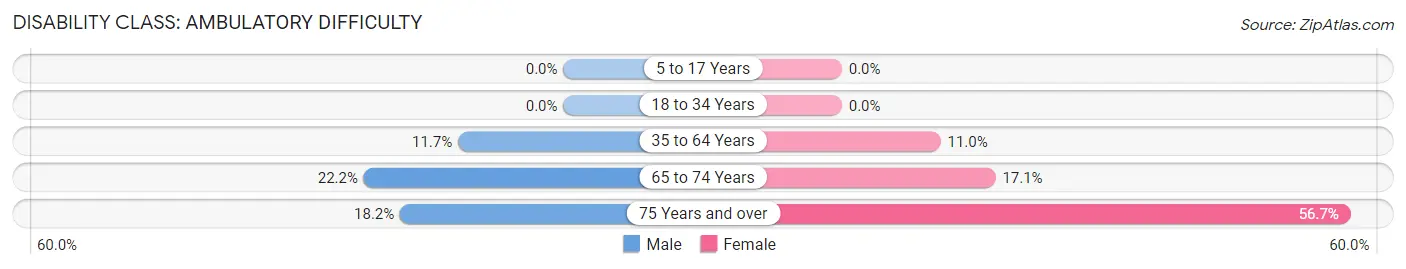
| Age Bracket | Male | Female |
| 5 to 17 Years | 0 (0.0%) | 0 (0.0%) |
| 18 to 34 Years | 0 (0.0%) | 0 (0.0%) |
| 35 to 64 Years | 36 (11.7%) | 43 (11.0%) |
| 65 to 74 Years | 8 (22.2%) | 13 (17.1%) |
| 75 Years and over | 4 (18.2%) | 17 (56.7%) |
Disability Class: Self-Care Difficulty
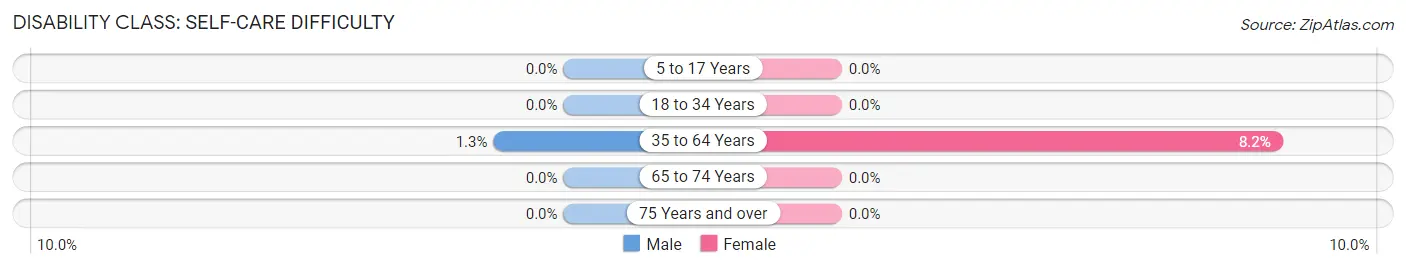
| Age Bracket | Male | Female |
| 5 to 17 Years | 0 (0.0%) | 0 (0.0%) |
| 18 to 34 Years | 0 (0.0%) | 0 (0.0%) |
| 35 to 64 Years | 4 (1.3%) | 32 (8.2%) |
| 65 to 74 Years | 0 (0.0%) | 0 (0.0%) |
| 75 Years and over | 0 (0.0%) | 0 (0.0%) |
Technology Access in Godley
Computing Device Access in Godley
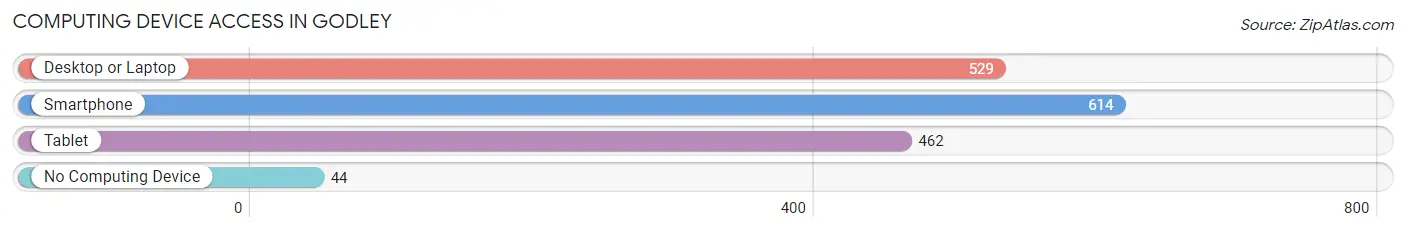
| Device Type | # Households | % Households |
| Desktop or Laptop | 529 | 75.0% |
| Smartphone | 614 | 87.1% |
| Tablet | 462 | 65.5% |
| No Computing Device | 44 | 6.2% |
| Total | 705 | 100.0% |
Internet Access in Godley
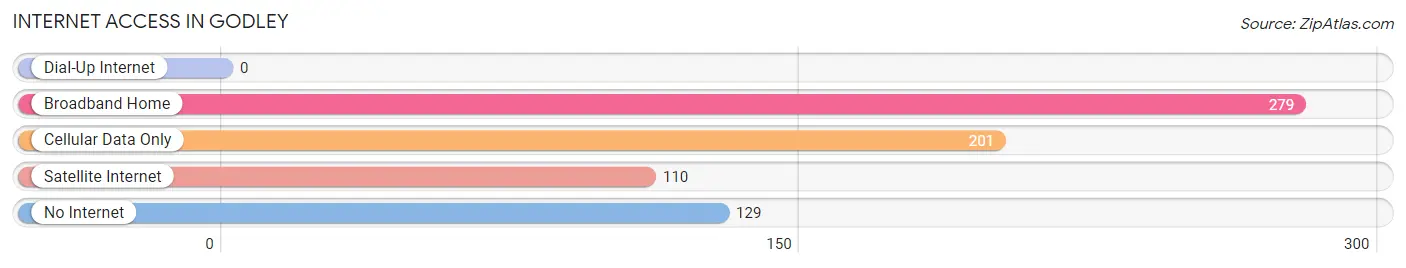
| Internet Type | # Households | % Households |
| Dial-Up Internet | 0 | 0.0% |
| Broadband Home | 279 | 39.6% |
| Cellular Data Only | 201 | 28.5% |
| Satellite Internet | 110 | 15.6% |
| No Internet | 129 | 18.3% |
| Total | 705 | 100.0% |
Godley Summary
Godley, Texas is a small town located in Johnson County, Texas, United States. The town is situated about 40 miles south of Fort Worth and is part of the Dallas-Fort Worth-Arlington metropolitan area. The population of Godley was 1,845 at the 2010 census, up from 1,619 at the 2000 census.
History
Godley was founded in 1881 by the Godley family, who had moved to the area from Tennessee. The town was named after the family and was originally known as Godley Station. The town was incorporated in 1883 and the first post office was established in 1884.
The town grew slowly but steadily over the years, and by the early 1900s, it had become a thriving agricultural community. Cotton was the main crop grown in the area, and the town was home to several cotton gins. The town also had a number of businesses, including a bank, a hotel, a blacksmith shop, and a general store.
In the 1920s, the town began to experience a decline in population as many of its residents moved away in search of better economic opportunities. The Great Depression of the 1930s further exacerbated the situation, and by 1940, the population had dropped to just over 500.
The population began to slowly increase again after World War II, and by the 1970s, the town had grown to over 1,000 residents. The population has remained relatively stable since then, and today, Godley is a small but vibrant community.
Geography
Godley is located in Johnson County, Texas, at the intersection of State Highway 171 and Farm to Market Road 917. The town is situated about 40 miles south of Fort Worth and is part of the Dallas-Fort Worth-Arlington metropolitan area.
The town is located in a flat, open area of the county, with an elevation of about 800 feet. The climate is generally mild, with hot summers and cool winters. The average annual temperature is around 70 degrees Fahrenheit, and the average annual precipitation is around 35 inches.
Economy
The economy of Godley is largely based on agriculture. Cotton is the main crop grown in the area, and the town is home to several cotton gins. Other crops grown in the area include corn, wheat, and hay.
The town also has a number of small businesses, including a bank, a hotel, a blacksmith shop, and a general store. There are also several restaurants and bars in the area.
Demographics
As of the 2010 census, the population of Godley was 1,845, up from 1,619 at the 2000 census. The racial makeup of the town was 94.3% White, 0.7% African American, 0.3% Native American, 0.2% Asian, 0.1% Pacific Islander, 2.7% from other races, and 1.7% from two or more races. Hispanic or Latino of any race were 5.2% of the population.
The median household income in Godley was $41,250, and the median family income was $48,750. The per capita income was $19,945. About 11.3% of families and 14.2% of the population were below the poverty line, including 18.2% of those under age 18 and 8.3% of those age 65 or over.
Common Questions
What is Per Capita Income in Godley?
Per Capita income in Godley is $28,106.
What is the Median Family Income in Godley?
Median Family Income in Godley is $86,591.
What is the Median Household income in Godley?
Median Household Income in Godley is $56,792.
What is Income or Wage Gap in Godley?
Income or Wage Gap in Godley is 55.8%.
Women in Godley earn 44.2 cents for every dollar earned by a man.
What is Inequality or Gini Index in Godley?
Inequality or Gini Index in Godley is 0.48.
What is the Total Population of Godley?
Total Population of Godley is 1,789.
What is the Total Male Population of Godley?
Total Male Population of Godley is 800.
What is the Total Female Population of Godley?
Total Female Population of Godley is 989.
What is the Ratio of Males per 100 Females in Godley?
There are 80.89 Males per 100 Females in Godley.
What is the Ratio of Females per 100 Males in Godley?
There are 123.62 Females per 100 Males in Godley.
What is the Median Population Age in Godley?
Median Population Age in Godley is 33.7 Years.
What is the Average Family Size in Godley
Average Family Size in Godley is 3.1 People.
What is the Average Household Size in Godley
Average Household Size in Godley is 2.5 People.
How Large is the Labor Force in Godley?
There are 902 People in the Labor Forcein in Godley.
What is the Percentage of People in the Labor Force in Godley?
68.1% of People are in the Labor Force in Godley.
What is the Unemployment Rate in Godley?
Unemployment Rate in Godley is 6.2%.