Christine, TX Map & Demographics
Christine Map
Christine Overview
$20,338
PER CAPITA INCOME
$79,500
AVG FAMILY INCOME
$45,625
AVG HOUSEHOLD INCOME
0.49
INEQUALITY / GINI INDEX
213
TOTAL POPULATION
79
MALE POPULATION
134
FEMALE POPULATION
58.96
MALES / 100 FEMALES
169.62
FEMALES / 100 MALES
43.3
MEDIAN AGE
4.1
AVG FAMILY SIZE
2.8
AVG HOUSEHOLD SIZE
98
LABOR FORCE [ PEOPLE ]
58.3%
PERCENT IN LABOR FORCE
18.4%
UNEMPLOYMENT RATE
Christine Zip Codes
Christine Area Codes
Income in Christine
Income Overview in Christine
Per Capita Income in Christine is $20,338, while median incomes of families and households are $79,500 and $45,625 respectively.
| Characteristic | Number | Measure |
| Per Capita Income | 213 | $20,338 |
| Median Family Income | 42 | $79,500 |
| Mean Family Income | 42 | $75,471 |
| Median Household Income | 76 | $45,625 |
| Mean Household Income | 76 | $51,871 |
| Income Deficit | 42 | $0 |
| Wage / Income Gap (%) | 213 | 0.00% |
| Wage / Income Gap ($) | 213 | 100.00¢ per $1 |
| Gini / Inequality Index | 213 | 0.49 |
Earnings by Sex in Christine
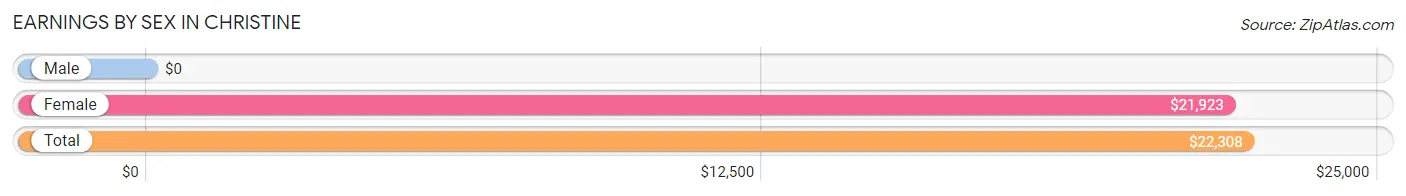
| Sex | Number | Average Earnings |
| Male | 56 (54.9%) | $0 |
| Female | 46 (45.1%) | $21,923 |
| Total | 102 (100.0%) | $22,308 |
Earnings by Sex by Income Bracket in Christine
The most common earnings brackets in Christine are $5,000 to $7,499 for men (13 | 23.2%) and $20,000 to $22,499 for women (13 | 28.3%).
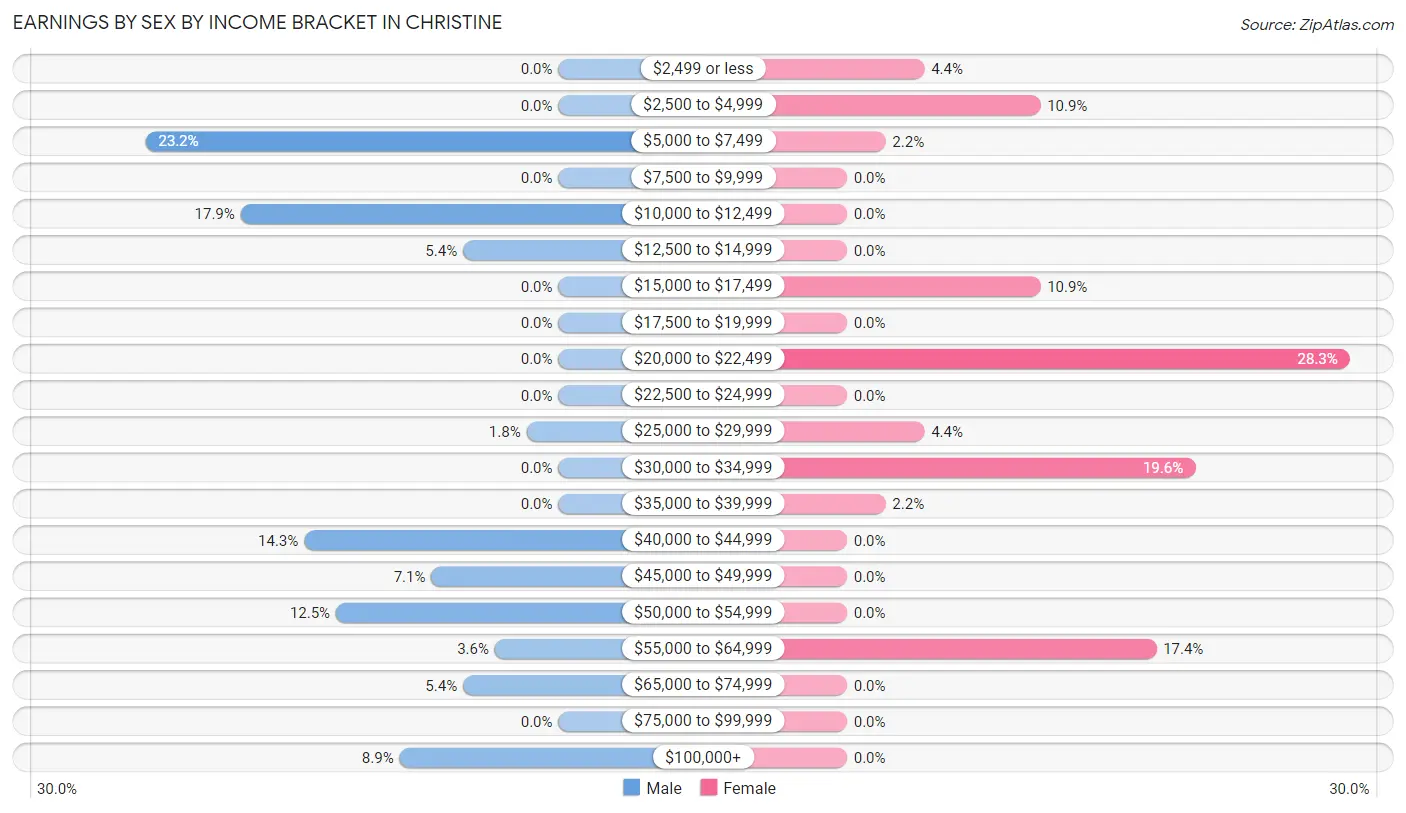
| Income | Male | Female |
| $2,499 or less | 0 (0.0%) | 2 (4.3%) |
| $2,500 to $4,999 | 0 (0.0%) | 5 (10.9%) |
| $5,000 to $7,499 | 13 (23.2%) | 1 (2.2%) |
| $7,500 to $9,999 | 0 (0.0%) | 0 (0.0%) |
| $10,000 to $12,499 | 10 (17.9%) | 0 (0.0%) |
| $12,500 to $14,999 | 3 (5.4%) | 0 (0.0%) |
| $15,000 to $17,499 | 0 (0.0%) | 5 (10.9%) |
| $17,500 to $19,999 | 0 (0.0%) | 0 (0.0%) |
| $20,000 to $22,499 | 0 (0.0%) | 13 (28.3%) |
| $22,500 to $24,999 | 0 (0.0%) | 0 (0.0%) |
| $25,000 to $29,999 | 1 (1.8%) | 2 (4.3%) |
| $30,000 to $34,999 | 0 (0.0%) | 9 (19.6%) |
| $35,000 to $39,999 | 0 (0.0%) | 1 (2.2%) |
| $40,000 to $44,999 | 8 (14.3%) | 0 (0.0%) |
| $45,000 to $49,999 | 4 (7.1%) | 0 (0.0%) |
| $50,000 to $54,999 | 7 (12.5%) | 0 (0.0%) |
| $55,000 to $64,999 | 2 (3.6%) | 8 (17.4%) |
| $65,000 to $74,999 | 3 (5.4%) | 0 (0.0%) |
| $75,000 to $99,999 | 0 (0.0%) | 0 (0.0%) |
| $100,000+ | 5 (8.9%) | 0 (0.0%) |
| Total | 56 (100.0%) | 46 (100.0%) |
Earnings by Sex by Educational Attainment in Christine
Average earnings in Christine are $42,344 for men and $22,404 for women, a difference of 47.1%. Men with an educational attainment of high school diploma enjoy the highest average annual earnings of $41,094, while those with high school diploma education earn the least with $41,094. Women with an educational attainment of less than high school earn the most with the average annual earnings of $31,094, while those with high school diploma education have the smallest earnings of $20,577.
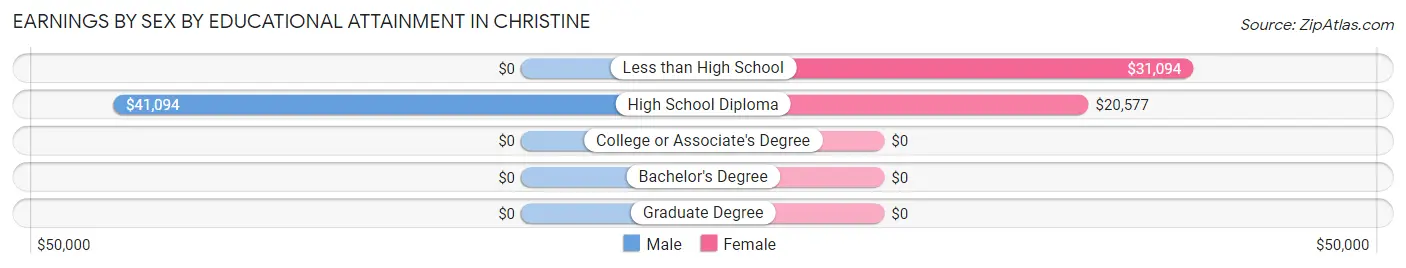
| Educational Attainment | Male Income | Female Income |
| Less than High School | - | - |
| High School Diploma | $41,094 | $20,577 |
| College or Associate's Degree | - | - |
| Bachelor's Degree | - | - |
| Graduate Degree | - | - |
| Total | $42,344 | $22,404 |
Family Income in Christine
Family Income Brackets in Christine
According to the Christine family income data, there are 17 families falling into the $75,000 to $99,999 income range, which is the most common income bracket and makes up 40.5% of all families.
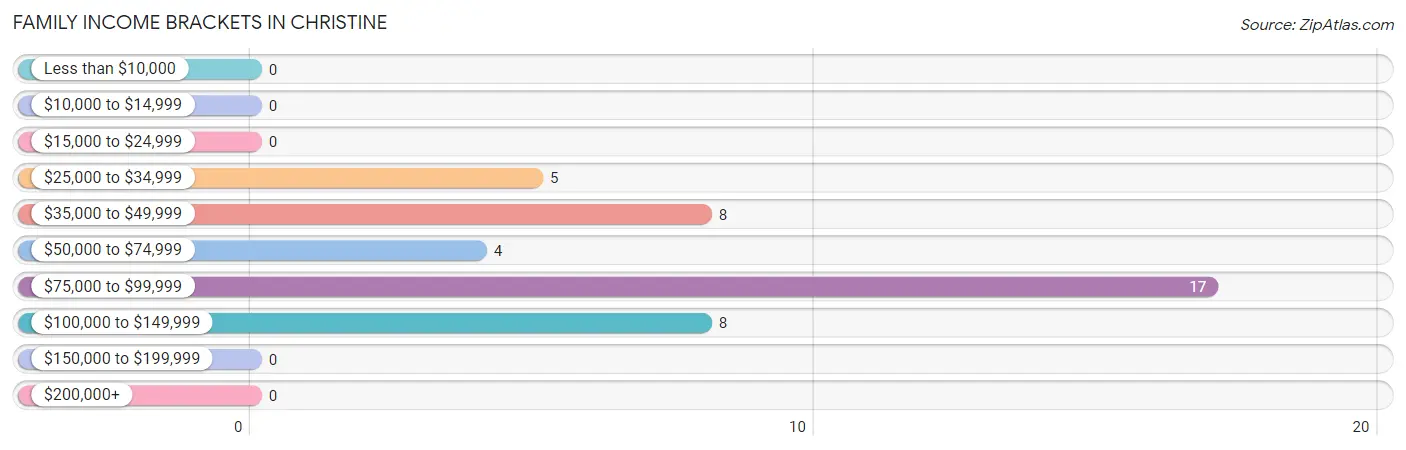
| Income Bracket | # Families | % Families |
| Less than $10,000 | 0 | 0.0% |
| $10,000 to $14,999 | 0 | 0.0% |
| $15,000 to $24,999 | 0 | 0.0% |
| $25,000 to $34,999 | 5 | 11.9% |
| $35,000 to $49,999 | 8 | 19.0% |
| $50,000 to $74,999 | 4 | 9.5% |
| $75,000 to $99,999 | 17 | 40.5% |
| $100,000 to $149,999 | 8 | 19.0% |
| $150,000 to $199,999 | 0 | 0.0% |
| $200,000+ | 0 | 0.0% |
Family Income by Famaliy Size in Christine
4-person families (13 | 30.9%) account for the highest median family income in Christine with $83,594 per family, while 3-person families (16 | 38.1%) have the highest median income of $26,500 per family member.
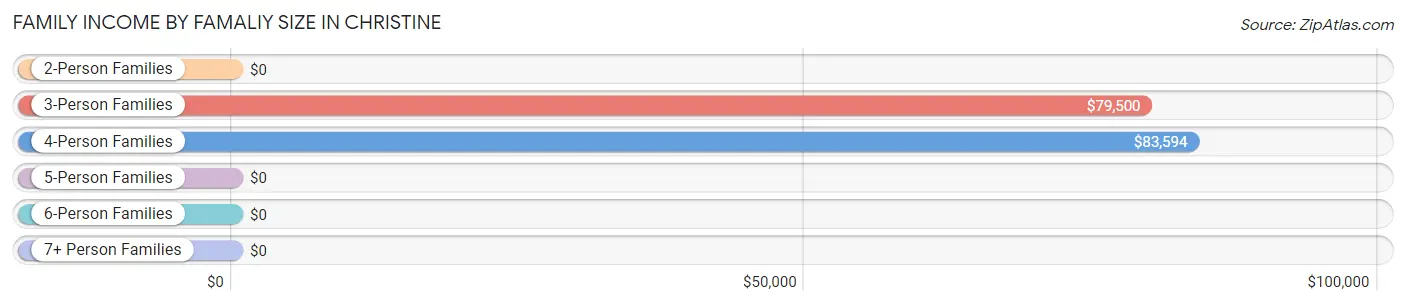
| Income Bracket | # Families | Median Income |
| 2-Person Families | 8 (19.1%) | $0 |
| 3-Person Families | 16 (38.1%) | $79,500 |
| 4-Person Families | 13 (30.9%) | $83,594 |
| 5-Person Families | 0 (0.0%) | $0 |
| 6-Person Families | 1 (2.4%) | $0 |
| 7+ Person Families | 4 (9.5%) | $0 |
| Total | 42 (100.0%) | $79,500 |
Family Income by Number of Earners in Christine
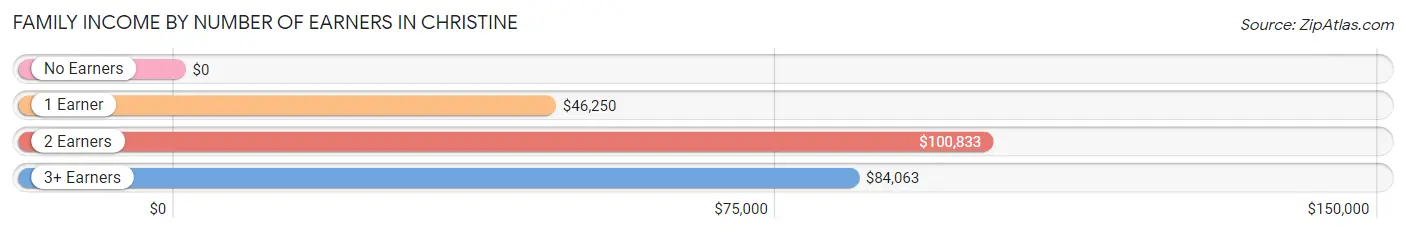
| Number of Earners | # Families | Median Income |
| No Earners | 4 (9.5%) | $0 |
| 1 Earner | 14 (33.3%) | $46,250 |
| 2 Earners | 14 (33.3%) | $100,833 |
| 3+ Earners | 10 (23.8%) | $84,063 |
| Total | 42 (100.0%) | $79,500 |
Household Income in Christine
Household Income Brackets in Christine
With 23 households falling in the category, the less than $10,000 income range is the most frequent in Christine, accounting for 30.3% of all households.
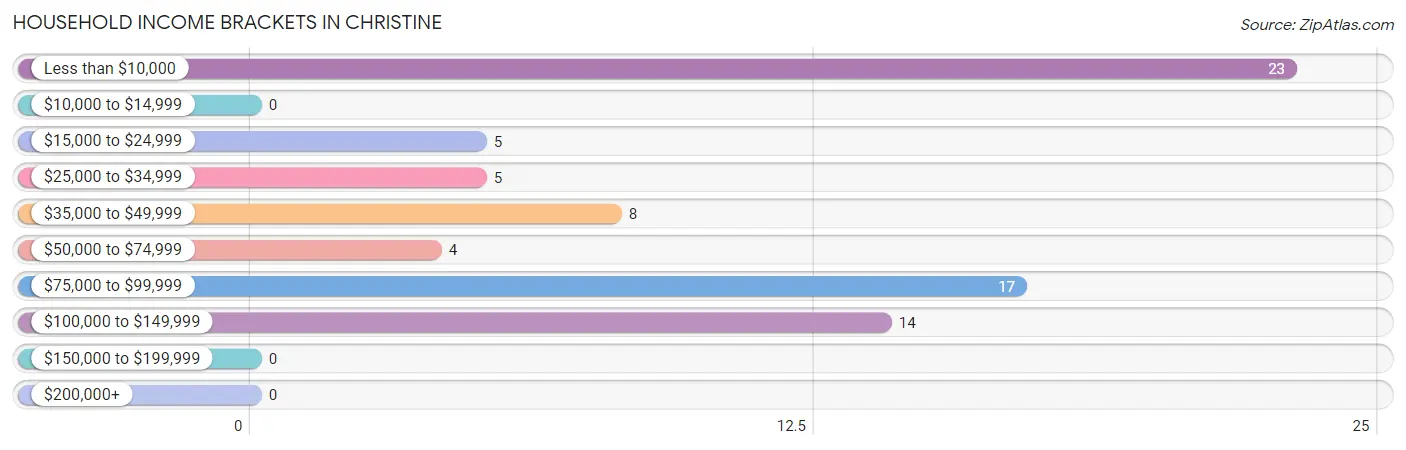
| Income Bracket | # Households | % Households |
| Less than $10,000 | 23 | 30.3% |
| $10,000 to $14,999 | 0 | 0.0% |
| $15,000 to $24,999 | 5 | 6.6% |
| $25,000 to $34,999 | 5 | 6.6% |
| $35,000 to $49,999 | 8 | 10.5% |
| $50,000 to $74,999 | 4 | 5.3% |
| $75,000 to $99,999 | 17 | 22.4% |
| $100,000 to $149,999 | 14 | 18.4% |
| $150,000 to $199,999 | 0 | 0.0% |
| $200,000+ | 0 | 0.0% |
Household Income by Householder Age in Christine
The median household income in Christine is $45,625, with the highest median household income of $30,625 found in the 65+ years age bracket for the primary householder. A total of 20 households (26.3%) fall into this category.
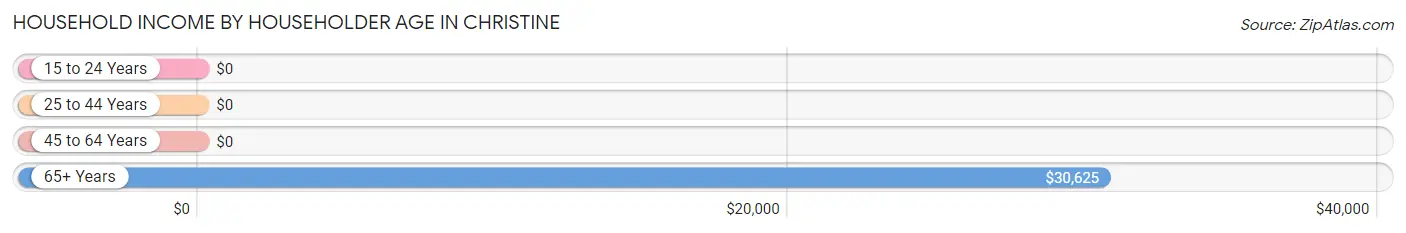
| Income Bracket | # Households | Median Income |
| 15 to 24 Years | 0 (0.0%) | $0 |
| 25 to 44 Years | 13 (17.1%) | $0 |
| 45 to 64 Years | 43 (56.6%) | $0 |
| 65+ Years | 20 (26.3%) | $30,625 |
| Total | 76 (100.0%) | $45,625 |
Poverty in Christine
Income Below Poverty by Sex and Age in Christine
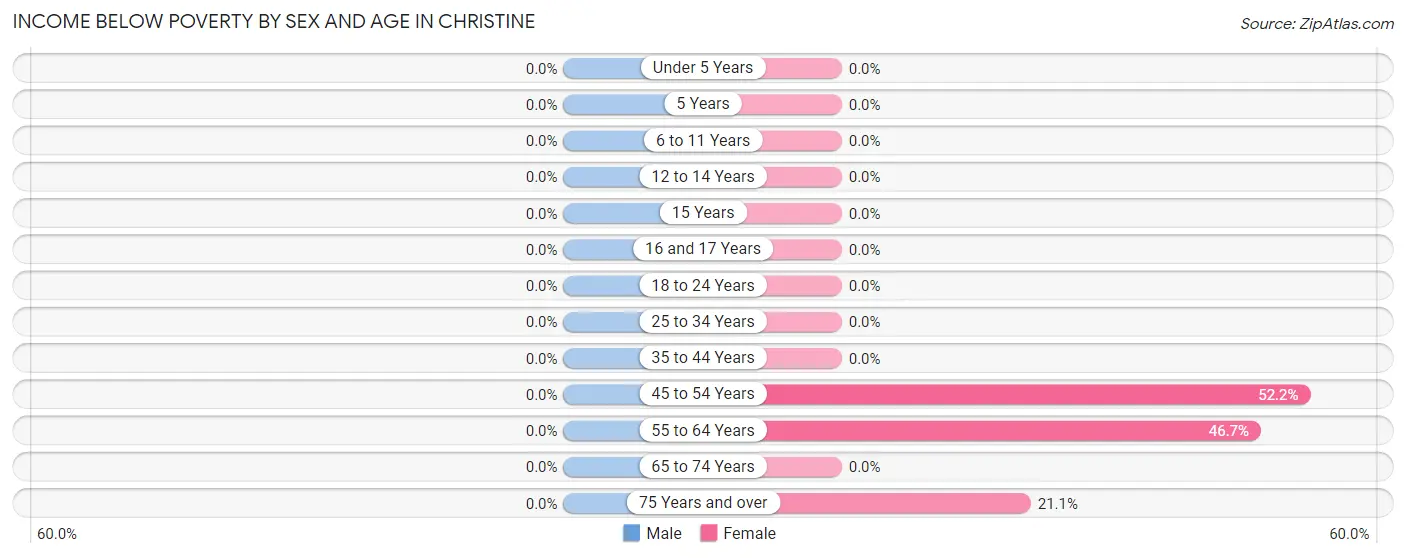
| Age Bracket | Male | Female |
| Under 5 Years | 0 (0.0%) | 0 (0.0%) |
| 5 Years | 0 (0.0%) | 0 (0.0%) |
| 6 to 11 Years | 0 (0.0%) | 0 (0.0%) |
| 12 to 14 Years | 0 (0.0%) | 0 (0.0%) |
| 15 Years | 0 (0.0%) | 0 (0.0%) |
| 16 and 17 Years | 0 (0.0%) | 0 (0.0%) |
| 18 to 24 Years | 0 (0.0%) | 0 (0.0%) |
| 25 to 34 Years | 0 (0.0%) | 0 (0.0%) |
| 35 to 44 Years | 0 (0.0%) | 0 (0.0%) |
| 45 to 54 Years | 0 (0.0%) | 12 (52.2%) |
| 55 to 64 Years | 0 (0.0%) | 7 (46.7%) |
| 65 to 74 Years | 0 (0.0%) | 0 (0.0%) |
| 75 Years and over | 0 (0.0%) | 4 (21.0%) |
| Total | 0 (0.0%) | 23 (17.2%) |
Income Above Poverty by Sex and Age in Christine
According to the poverty statistics in Christine, males aged under 5 years and females aged 6 to 11 years are the age groups that are most secure financially, with 100.0% of males and 100.0% of females in these age groups living above the poverty line.
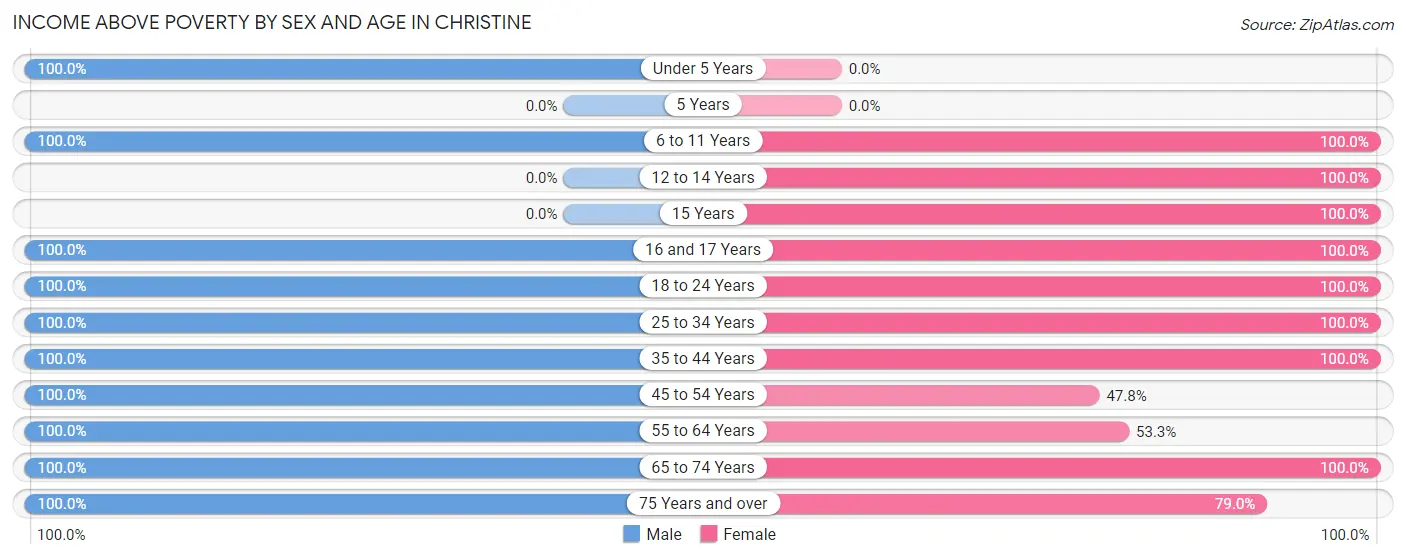
| Age Bracket | Male | Female |
| Under 5 Years | 2 (100.0%) | 0 (0.0%) |
| 5 Years | 0 (0.0%) | 0 (0.0%) |
| 6 to 11 Years | 9 (100.0%) | 17 (100.0%) |
| 12 to 14 Years | 0 (0.0%) | 15 (100.0%) |
| 15 Years | 0 (0.0%) | 2 (100.0%) |
| 16 and 17 Years | 10 (100.0%) | 2 (100.0%) |
| 18 to 24 Years | 7 (100.0%) | 5 (100.0%) |
| 25 to 34 Years | 10 (100.0%) | 16 (100.0%) |
| 35 to 44 Years | 13 (100.0%) | 11 (100.0%) |
| 45 to 54 Years | 15 (100.0%) | 11 (47.8%) |
| 55 to 64 Years | 2 (100.0%) | 8 (53.3%) |
| 65 to 74 Years | 7 (100.0%) | 9 (100.0%) |
| 75 Years and over | 4 (100.0%) | 15 (78.9%) |
| Total | 79 (100.0%) | 111 (82.8%) |
Income Below Poverty Among Married-Couple Families in Christine
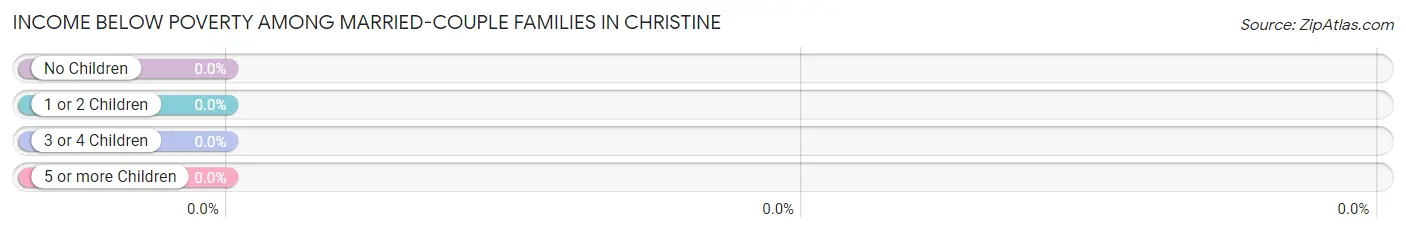
| Children | Above Poverty | Below Poverty |
| No Children | 9 (100.0%) | 0 (0.0%) |
| 1 or 2 Children | 15 (100.0%) | 0 (0.0%) |
| 3 or 4 Children | 0 (0.0%) | 0 (0.0%) |
| 5 or more Children | 4 (100.0%) | 0 (0.0%) |
| Total | 28 (100.0%) | 0 (0.0%) |
Income Below Poverty Among Single-Parent Households in Christine
| Children | Single Father | Single Mother |
| No Children | 0 (0.0%) | 0 (0.0%) |
| 1 or 2 Children | 0 (0.0%) | 0 (0.0%) |
| 3 or 4 Children | 0 (0.0%) | 0 (0.0%) |
| 5 or more Children | 0 (0.0%) | 0 (0.0%) |
| Total | 0 (0.0%) | 0 (0.0%) |
Income Below Poverty Among Married-Couple vs Single-Parent Households in Christine
| Children | Married-Couple Families | Single-Parent Households |
| No Children | 0 (0.0%) | 0 (0.0%) |
| 1 or 2 Children | 0 (0.0%) | 0 (0.0%) |
| 3 or 4 Children | 0 (0.0%) | 0 (0.0%) |
| 5 or more Children | 0 (0.0%) | 0 (0.0%) |
| Total | 0 (0.0%) | 0 (0.0%) |
Race in Christine
The most populous races in Christine are Hispanic or Latino (213 | 100.0%), Two or more Races (110 | 51.6%), and White / Caucasian (79 | 37.1%).
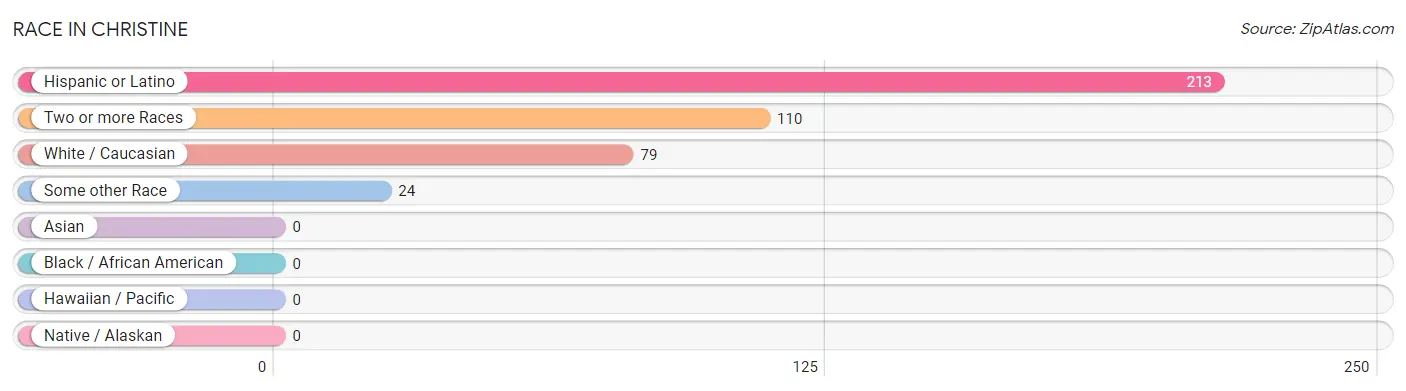
| Race | # Population | % Population |
| Asian | 0 | 0.0% |
| Black / African American | 0 | 0.0% |
| Hawaiian / Pacific | 0 | 0.0% |
| Hispanic or Latino | 213 | 100.0% |
| Native / Alaskan | 0 | 0.0% |
| White / Caucasian | 79 | 37.1% |
| Two or more Races | 110 | 51.6% |
| Some other Race | 24 | 11.3% |
| Total | 213 | 100.0% |
Ancestry in Christine
The most populous ancestries reported in Christine are Mexican (213 | 100.0%), Irish (8 | 3.8%), Portuguese (6 | 2.8%), and Cherokee (4 | 1.9%), together accounting for 108.5% of all Christine residents.
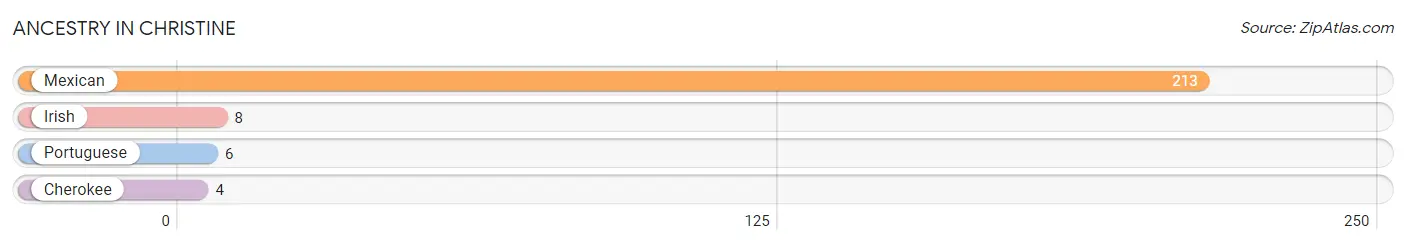
| Ancestry | # Population | % Population |
| Cherokee | 4 | 1.9% |
| Irish | 8 | 3.8% |
| Mexican | 213 | 100.0% |
| Portuguese | 6 | 2.8% | View All 4 Rows |
Immigrants in Christine
The most numerous immigrant groups reported in Christine came from Central America (34 | 16.0%), Latin America (34 | 16.0%), and Mexico (34 | 16.0%), together accounting for 47.9% of all Christine residents.
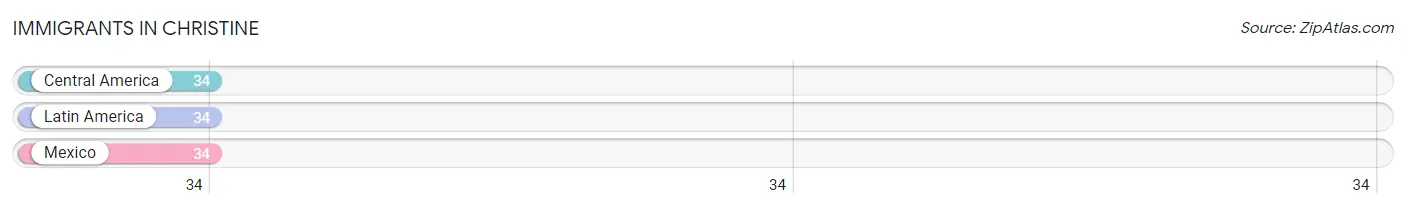
| Immigration Origin | # Population | % Population |
| Central America | 34 | 16.0% |
| Latin America | 34 | 16.0% |
| Mexico | 34 | 16.0% | View All 3 Rows |
Sex and Age in Christine
Sex and Age in Christine
The most populous age groups in Christine are 15 to 19 Years (17 | 21.5%) for men and 10 to 14 Years (23 | 17.2%) for women.
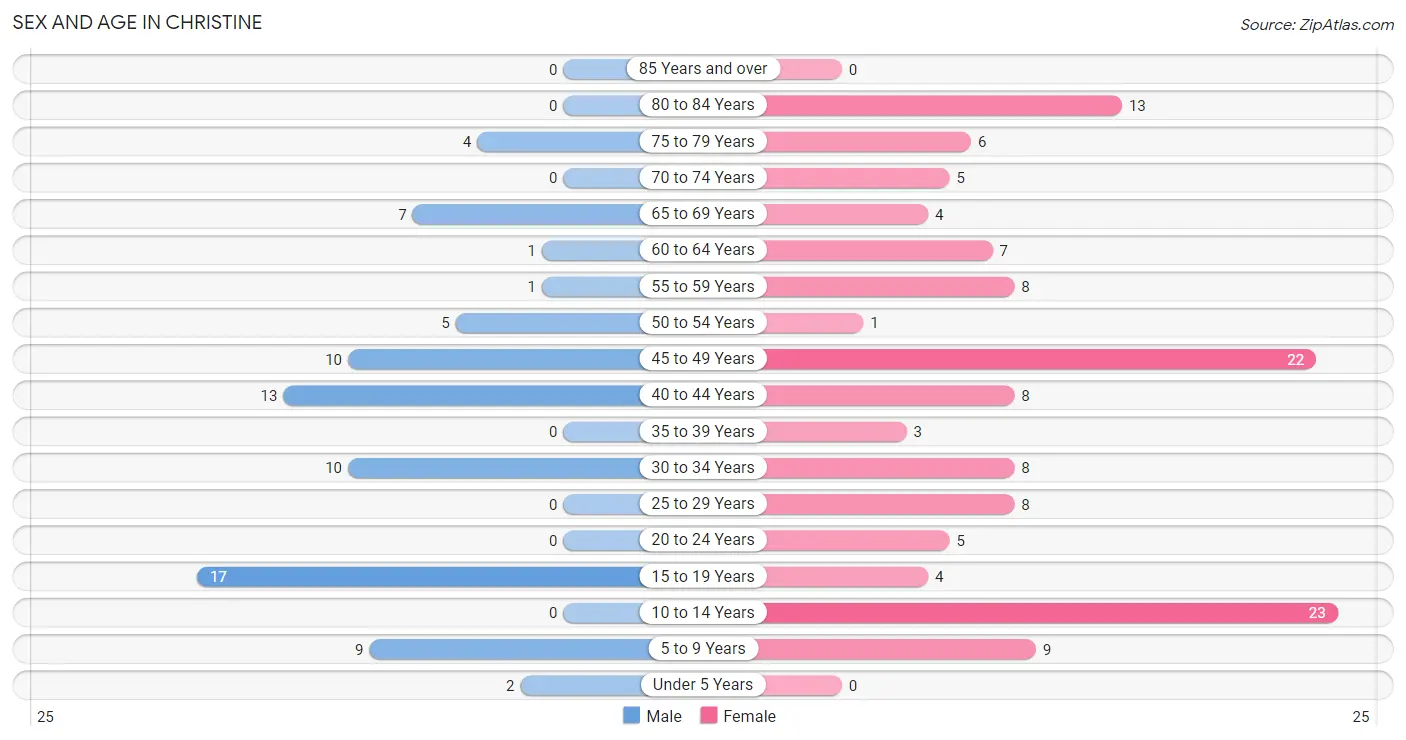
| Age Bracket | Male | Female |
| Under 5 Years | 2 (2.5%) | 0 (0.0%) |
| 5 to 9 Years | 9 (11.4%) | 9 (6.7%) |
| 10 to 14 Years | 0 (0.0%) | 23 (17.2%) |
| 15 to 19 Years | 17 (21.5%) | 4 (3.0%) |
| 20 to 24 Years | 0 (0.0%) | 5 (3.7%) |
| 25 to 29 Years | 0 (0.0%) | 8 (6.0%) |
| 30 to 34 Years | 10 (12.7%) | 8 (6.0%) |
| 35 to 39 Years | 0 (0.0%) | 3 (2.2%) |
| 40 to 44 Years | 13 (16.5%) | 8 (6.0%) |
| 45 to 49 Years | 10 (12.7%) | 22 (16.4%) |
| 50 to 54 Years | 5 (6.3%) | 1 (0.7%) |
| 55 to 59 Years | 1 (1.3%) | 8 (6.0%) |
| 60 to 64 Years | 1 (1.3%) | 7 (5.2%) |
| 65 to 69 Years | 7 (8.9%) | 4 (3.0%) |
| 70 to 74 Years | 0 (0.0%) | 5 (3.7%) |
| 75 to 79 Years | 4 (5.1%) | 6 (4.5%) |
| 80 to 84 Years | 0 (0.0%) | 13 (9.7%) |
| 85 Years and over | 0 (0.0%) | 0 (0.0%) |
| Total | 79 (100.0%) | 134 (100.0%) |
Families and Households in Christine
Median Family Size in Christine
The median family size in Christine is 4.07 persons per family, with single female/mother families (7 | 16.7%) accounting for the largest median family size of 5.14 persons per family. On the other hand, married-couple families (28 | 66.7%) represent the smallest median family size with 3.68 persons per family.
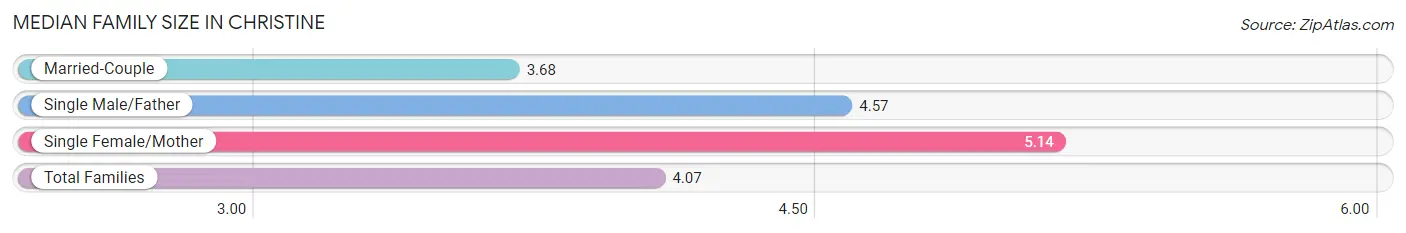
| Family Type | # Families | Family Size |
| Married-Couple | 28 (66.7%) | 3.68 |
| Single Male/Father | 7 (16.7%) | 4.57 |
| Single Female/Mother | 7 (16.7%) | 5.14 |
| Total Families | 42 (100.0%) | 4.07 |
Median Household Size in Christine
The median household size in Christine is 2.80 persons per household, with single female/mother households (7 | 9.2%) accounting for the largest median household size of 5.14 persons per household. non-family households (34 | 44.7%) represent the smallest median household size with 1.24 persons per household.
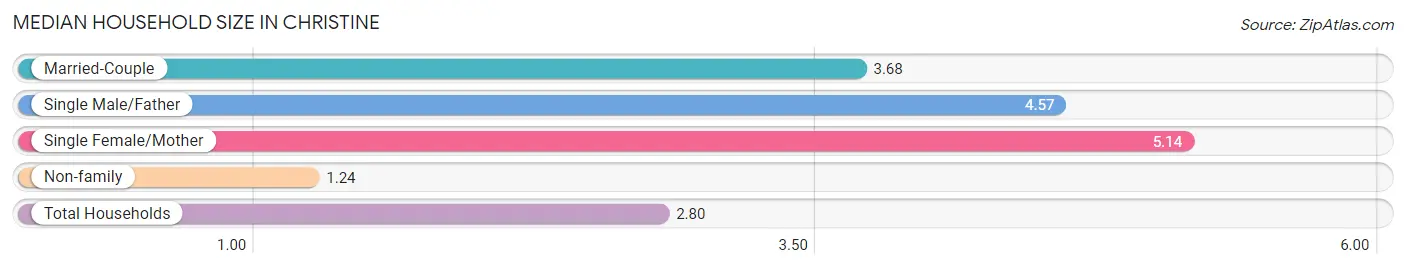
| Household Type | # Households | Household Size |
| Married-Couple | 28 (36.8%) | 3.68 |
| Single Male/Father | 7 (9.2%) | 4.57 |
| Single Female/Mother | 7 (9.2%) | 5.14 |
| Non-family | 34 (44.7%) | 1.24 |
| Total Households | 76 (100.0%) | 2.80 |
Household Size by Marriage Status in Christine
Out of a total of 76 households in Christine, 42 (55.3%) are family households, while 34 (44.7%) are nonfamily households. The most numerous type of family households are 3-person households, comprising 16, and the most common type of nonfamily households are 1-person households, comprising 28.
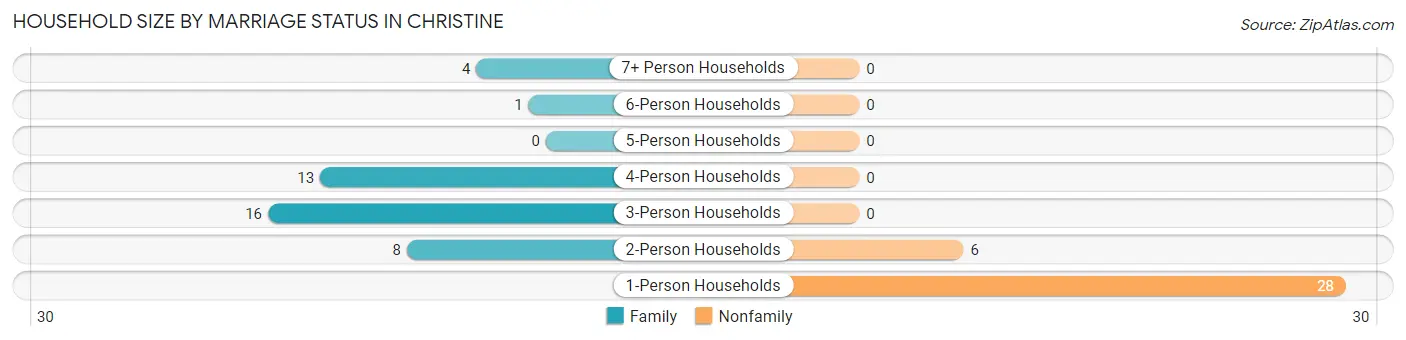
| Household Size | Family Households | Nonfamily Households |
| 1-Person Households | - | 28 (36.8%) |
| 2-Person Households | 8 (10.5%) | 6 (7.9%) |
| 3-Person Households | 16 (21.0%) | 0 (0.0%) |
| 4-Person Households | 13 (17.1%) | 0 (0.0%) |
| 5-Person Households | 0 (0.0%) | 0 (0.0%) |
| 6-Person Households | 1 (1.3%) | 0 (0.0%) |
| 7+ Person Households | 4 (5.3%) | 0 (0.0%) |
| Total | 42 (55.3%) | 34 (44.7%) |
Female Fertility in Christine
Fertility by Age in Christine
| Age Bracket | Women with Births | Births / 1,000 Women |
| 15 to 19 years | 0 (0.0%) | 0.0 |
| 20 to 34 years | 0 (0.0%) | 0.0 |
| 35 to 50 years | 0 (0.0%) | 0.0 |
| Total | 0 (0.0%) | 0.0 |
Fertility by Age by Marriage Status in Christine
| Age Bracket | Married | Unmarried |
| 15 to 19 years | 0 (0.0%) | 0 (0.0%) |
| 20 to 34 years | 0 (0.0%) | 0 (0.0%) |
| 35 to 50 years | 0 (0.0%) | 0 (0.0%) |
| Total | 0 (0.0%) | 0 (0.0%) |
Fertility by Education in Christine
| Educational Attainment | Women with Births | Births / 1,000 Women |
| Less than High School | 0 (0.0%) | 0.0 |
| High School Diploma | 0 (0.0%) | 0.0 |
| College or Associate's Degree | 0 (0.0%) | 0.0 |
| Bachelor's Degree | 0 (0.0%) | 0.0 |
| Graduate Degree | 0 (0.0%) | 0.0 |
| Total | 0 (0.0%) | 0.0 |
Fertility by Education by Marriage Status in Christine
| Educational Attainment | Married | Unmarried |
| Less than High School | 0 (0.0%) | 0 (0.0%) |
| High School Diploma | 0 (0.0%) | 0 (0.0%) |
| College or Associate's Degree | 0 (0.0%) | 0 (0.0%) |
| Bachelor's Degree | 0 (0.0%) | 0 (0.0%) |
| Graduate Degree | 0 (0.0%) | 0 (0.0%) |
| Total | 0 (0.0%) | 0 (0.0%) |
Employment Characteristics in Christine
Employment by Class of Employer in Christine
Among the 80 employed individuals in Christine, private company employees (37 | 46.3%), local government employees (23 | 28.7%), and state government employees (18 | 22.5%) make up the most common classes of employment.
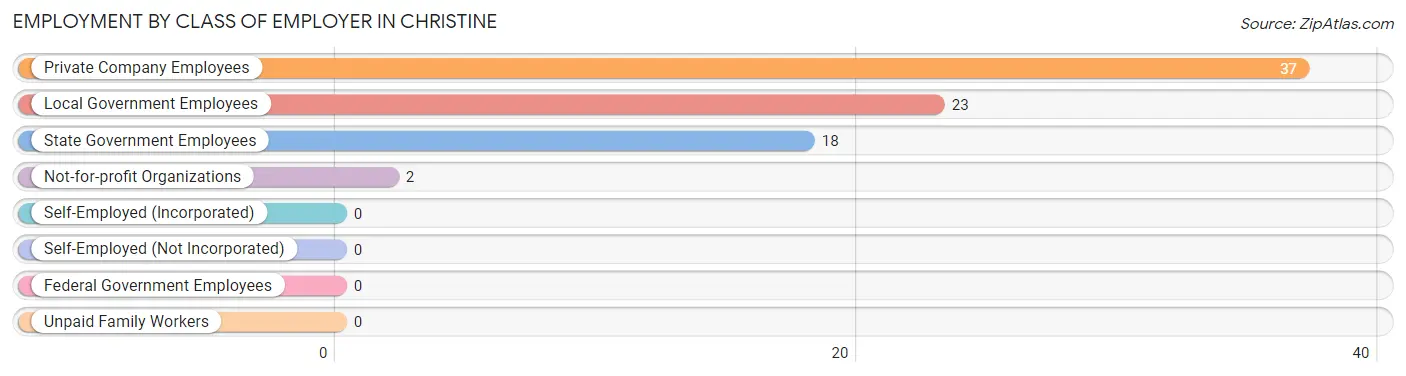
| Employer Class | # Employees | % Employees |
| Private Company Employees | 37 | 46.3% |
| Self-Employed (Incorporated) | 0 | 0.0% |
| Self-Employed (Not Incorporated) | 0 | 0.0% |
| Not-for-profit Organizations | 2 | 2.5% |
| Local Government Employees | 23 | 28.7% |
| State Government Employees | 18 | 22.5% |
| Federal Government Employees | 0 | 0.0% |
| Unpaid Family Workers | 0 | 0.0% |
| Total | 80 | 100.0% |
Employment Status by Age in Christine
According to the labor force statistics for Christine, out of the total population over 16 years of age (168), 58.3% or 98 individuals are in the labor force, with 18.4% or 18 of them unemployed. The age group with the highest labor force participation rate is 20 to 24 years, with 100.0% or 5 individuals in the labor force. Within the labor force, the 20 to 24 years age range has the highest percentage of unemployed individuals, with 100.0% or 5 of them being unemployed.
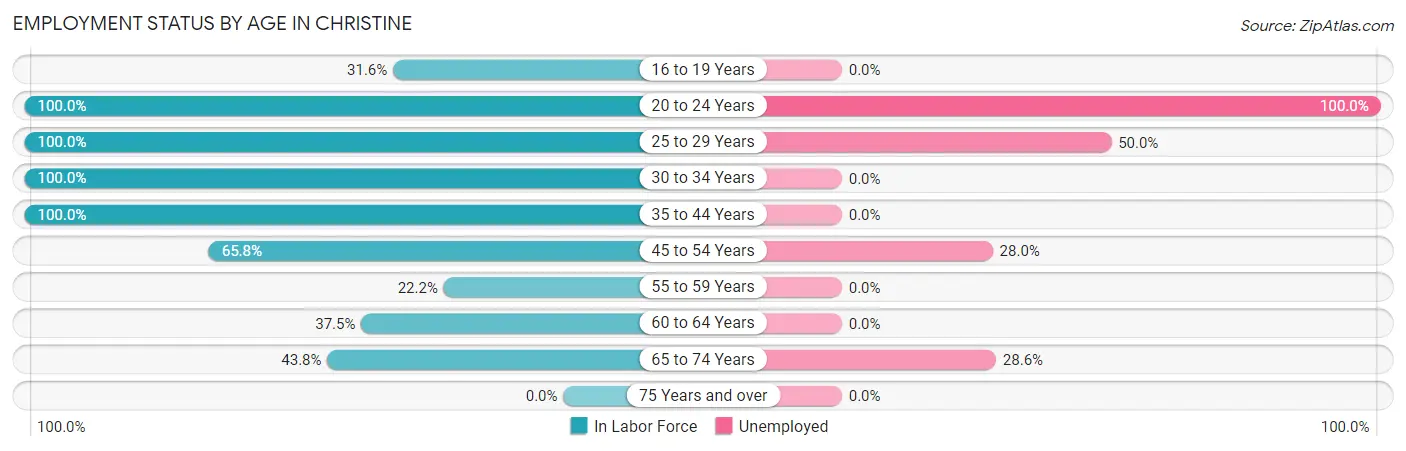
| Age Bracket | In Labor Force | Unemployed |
| 16 to 19 Years | 6 (31.6%) | 0 (0.0%) |
| 20 to 24 Years | 5 (100.0%) | 5 (100.0%) |
| 25 to 29 Years | 8 (100.0%) | 4 (50.0%) |
| 30 to 34 Years | 18 (100.0%) | 0 (0.0%) |
| 35 to 44 Years | 24 (100.0%) | 0 (0.0%) |
| 45 to 54 Years | 25 (65.8%) | 7 (28.0%) |
| 55 to 59 Years | 2 (22.2%) | 0 (0.0%) |
| 60 to 64 Years | 3 (37.5%) | 0 (0.0%) |
| 65 to 74 Years | 7 (43.8%) | 2 (28.6%) |
| 75 Years and over | 0 (0.0%) | 0 (0.0%) |
| Total | 98 (58.3%) | 18 (18.4%) |
Employment Status by Educational Attainment in Christine
According to labor force statistics for Christine, 76.2% of individuals (80) out of the total population between 25 and 64 years of age (105) are in the labor force, with 13.8% or 11 of them being unemployed. The group with the highest labor force participation rate are those with the educational attainment of college / associate degree, with 100.0% or 18 individuals in the labor force. Within the labor force, individuals with college / associate degree education have the highest percentage of unemployment, with 22.2% or 4 of them being unemployed.
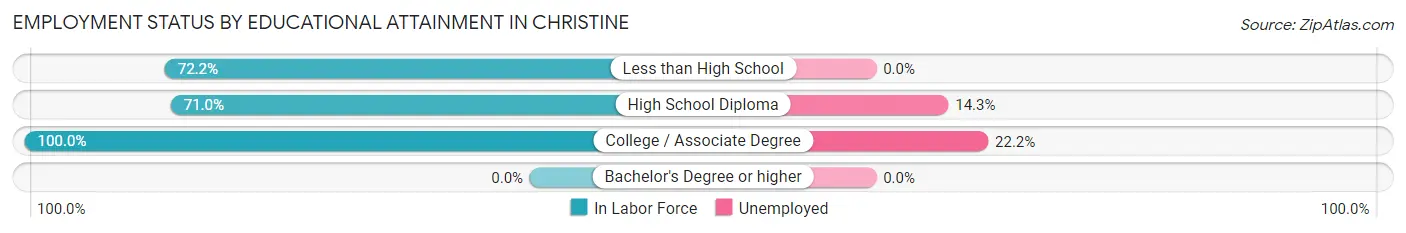
| Educational Attainment | In Labor Force | Unemployed |
| Less than High School | 13 (72.2%) | 0 (0.0%) |
| High School Diploma | 49 (71.0%) | 10 (14.3%) |
| College / Associate Degree | 18 (100.0%) | 4 (22.2%) |
| Bachelor's Degree or higher | 0 (0.0%) | 0 (0.0%) |
| Total | 80 (76.2%) | 14 (13.8%) |
Employment Occupations by Sex in Christine
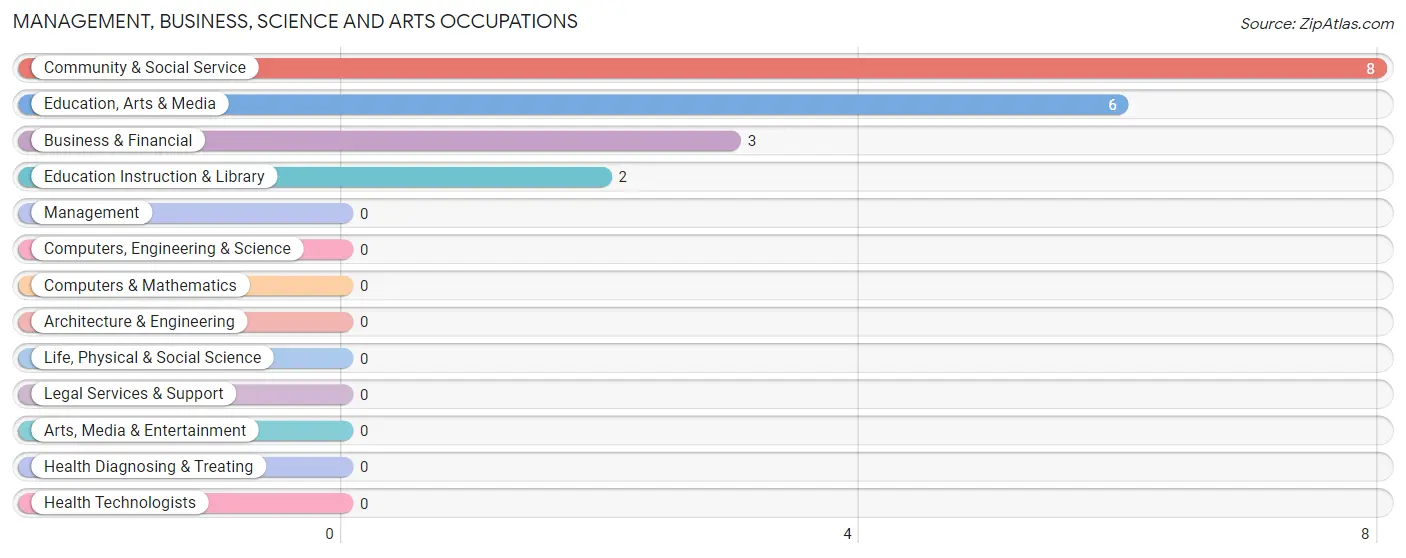
Management, Business, Science and Arts Occupations
The most common Management, Business, Science and Arts occupations in Christine are Community & Social Service (8 | 10.0%), Education, Arts & Media (6 | 7.5%), Business & Financial (3 | 3.7%), and Education Instruction & Library (2 | 2.5%).
Management, Business, Science and Arts Occupations by Sex
Within the Management, Business, Science and Arts occupations in Christine, the most male-oriented occupations are Business & Financial (100.0%), Education, Arts & Media (100.0%), and Community & Social Service (75.0%), while the most female-oriented occupations are Education Instruction & Library (100.0%), and Community & Social Service (25.0%).
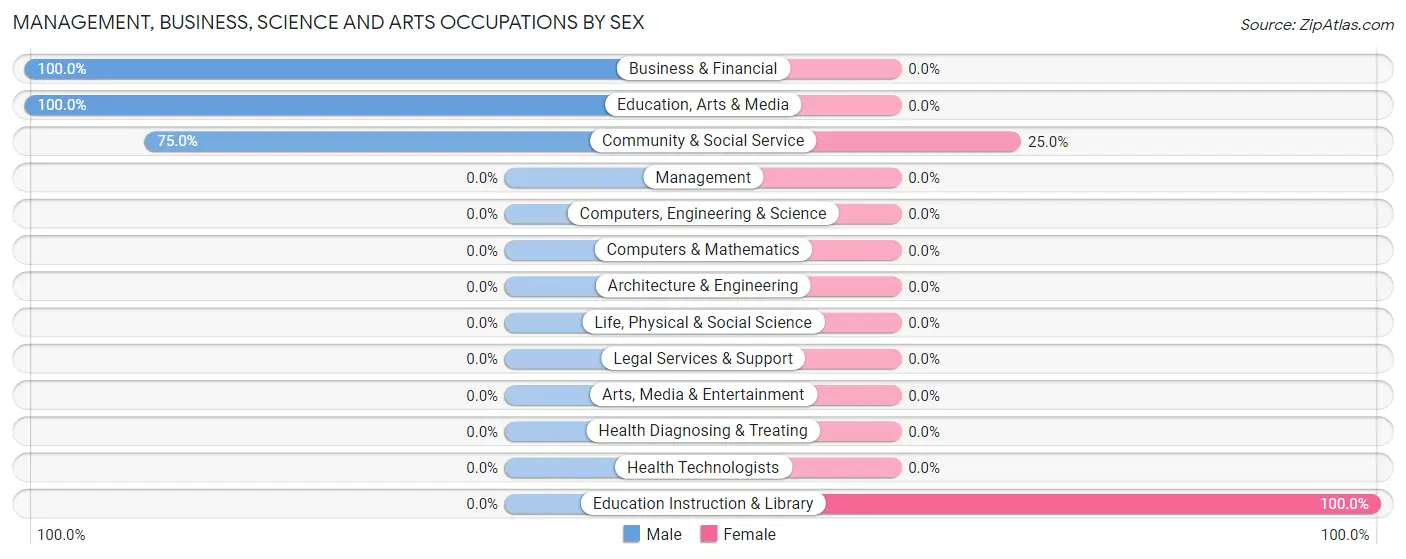
| Occupation | Male | Female |
| Management | 0 (0.0%) | 0 (0.0%) |
| Business & Financial | 3 (100.0%) | 0 (0.0%) |
| Computers, Engineering & Science | 0 (0.0%) | 0 (0.0%) |
| Computers & Mathematics | 0 (0.0%) | 0 (0.0%) |
| Architecture & Engineering | 0 (0.0%) | 0 (0.0%) |
| Life, Physical & Social Science | 0 (0.0%) | 0 (0.0%) |
| Community & Social Service | 6 (75.0%) | 2 (25.0%) |
| Education, Arts & Media | 6 (100.0%) | 0 (0.0%) |
| Legal Services & Support | 0 (0.0%) | 0 (0.0%) |
| Education Instruction & Library | 0 (0.0%) | 2 (100.0%) |
| Arts, Media & Entertainment | 0 (0.0%) | 0 (0.0%) |
| Health Diagnosing & Treating | 0 (0.0%) | 0 (0.0%) |
| Health Technologists | 0 (0.0%) | 0 (0.0%) |
| Total (Category) | 9 (81.8%) | 2 (18.2%) |
| Total (Overall) | 49 (61.3%) | 31 (38.8%) |
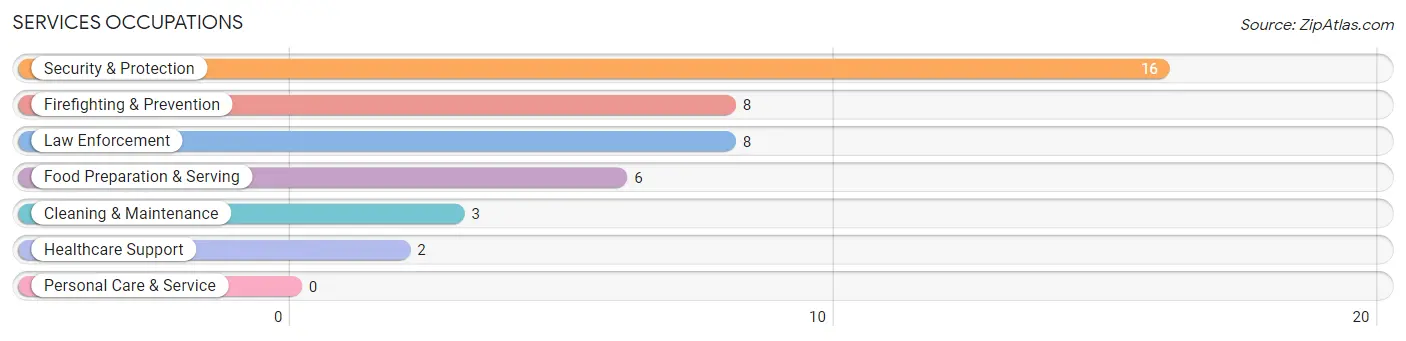
Services Occupations
The most common Services occupations in Christine are Security & Protection (16 | 20.0%), Firefighting & Prevention (8 | 10.0%), Law Enforcement (8 | 10.0%), Food Preparation & Serving (6 | 7.5%), and Cleaning & Maintenance (3 | 3.7%).
Services Occupations by Sex
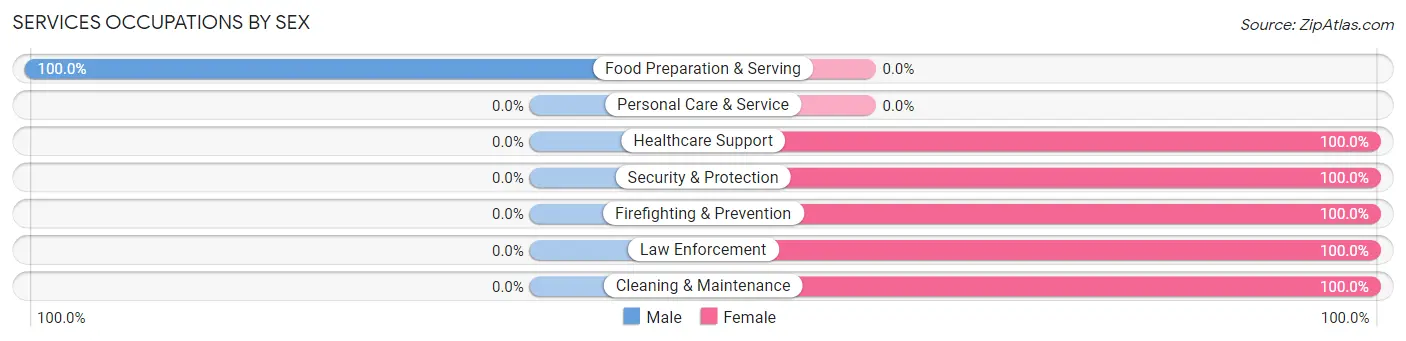
| Occupation | Male | Female |
| Healthcare Support | 0 (0.0%) | 2 (100.0%) |
| Security & Protection | 0 (0.0%) | 16 (100.0%) |
| Firefighting & Prevention | 0 (0.0%) | 8 (100.0%) |
| Law Enforcement | 0 (0.0%) | 8 (100.0%) |
| Food Preparation & Serving | 6 (100.0%) | 0 (0.0%) |
| Cleaning & Maintenance | 0 (0.0%) | 3 (100.0%) |
| Personal Care & Service | 0 (0.0%) | 0 (0.0%) |
| Total (Category) | 6 (22.2%) | 21 (77.8%) |
| Total (Overall) | 49 (61.3%) | 31 (38.8%) |
Sales and Office Occupations
The most common Sales and Office occupations in Christine are Office & Administration (6 | 7.5%), and Sales & Related (3 | 3.7%).
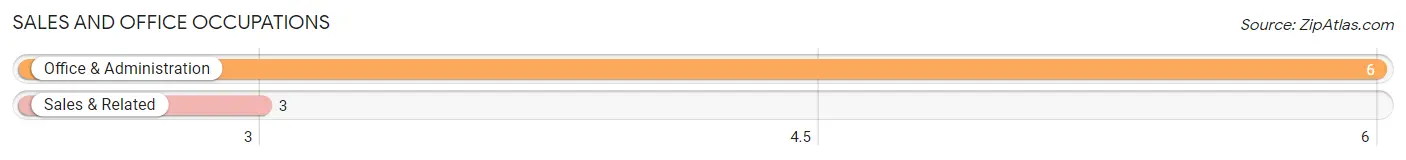
Sales and Office Occupations by Sex
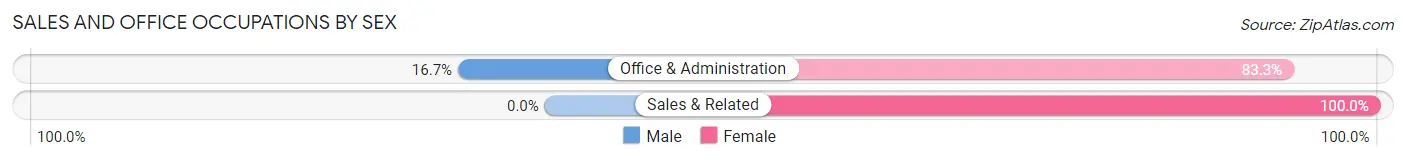
| Occupation | Male | Female |
| Sales & Related | 0 (0.0%) | 3 (100.0%) |
| Office & Administration | 1 (16.7%) | 5 (83.3%) |
| Total (Category) | 1 (11.1%) | 8 (88.9%) |
| Total (Overall) | 49 (61.3%) | 31 (38.8%) |
Natural Resources, Construction and Maintenance Occupations
The most common Natural Resources, Construction and Maintenance occupations in Christine are Construction & Extraction (11 | 13.8%), and Installation, Maintenance & Repair (3 | 3.7%).
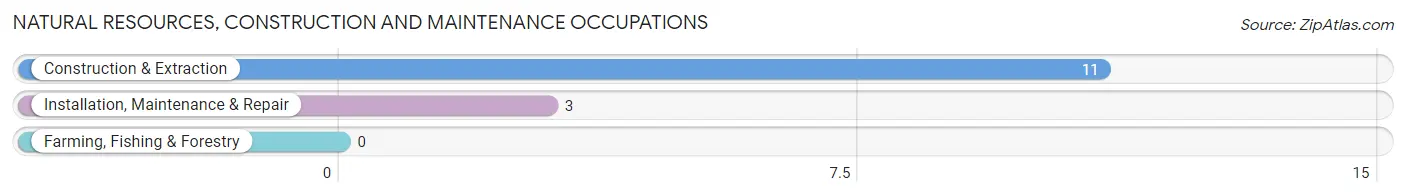
Natural Resources, Construction and Maintenance Occupations by Sex
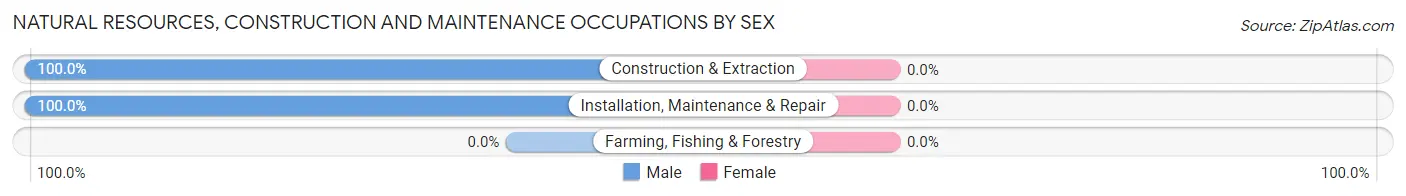
| Occupation | Male | Female |
| Farming, Fishing & Forestry | 0 (0.0%) | 0 (0.0%) |
| Construction & Extraction | 11 (100.0%) | 0 (0.0%) |
| Installation, Maintenance & Repair | 3 (100.0%) | 0 (0.0%) |
| Total (Category) | 14 (100.0%) | 0 (0.0%) |
| Total (Overall) | 49 (61.3%) | 31 (38.8%) |
Production, Transportation and Moving Occupations
The most common Production, Transportation and Moving occupations in Christine are Production (9 | 11.3%), Transportation (8 | 10.0%), and Material Moving (2 | 2.5%).
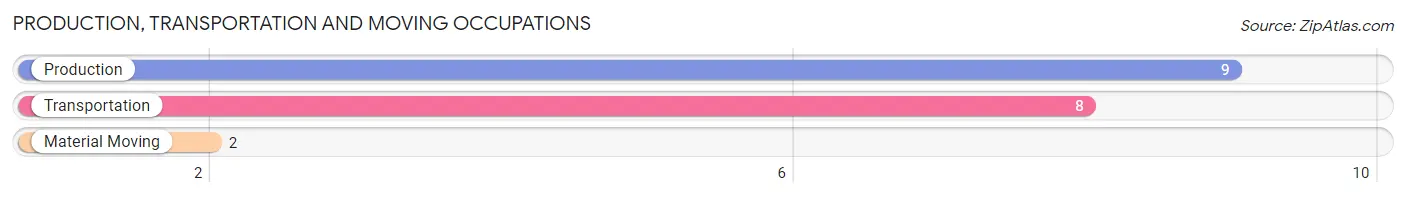
Production, Transportation and Moving Occupations by Sex
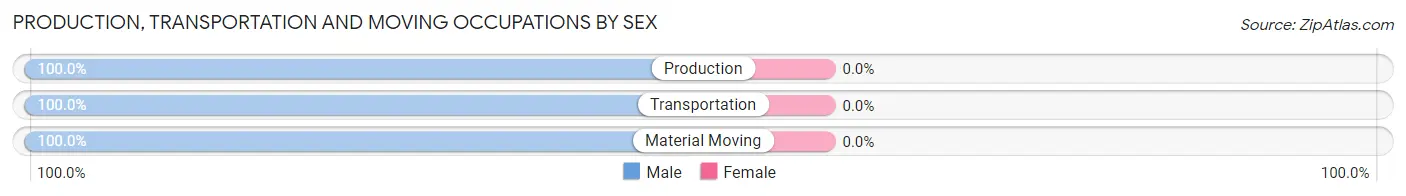
| Occupation | Male | Female |
| Production | 9 (100.0%) | 0 (0.0%) |
| Transportation | 8 (100.0%) | 0 (0.0%) |
| Material Moving | 2 (100.0%) | 0 (0.0%) |
| Total (Category) | 19 (100.0%) | 0 (0.0%) |
| Total (Overall) | 49 (61.3%) | 31 (38.8%) |
Employment Industries by Sex in Christine
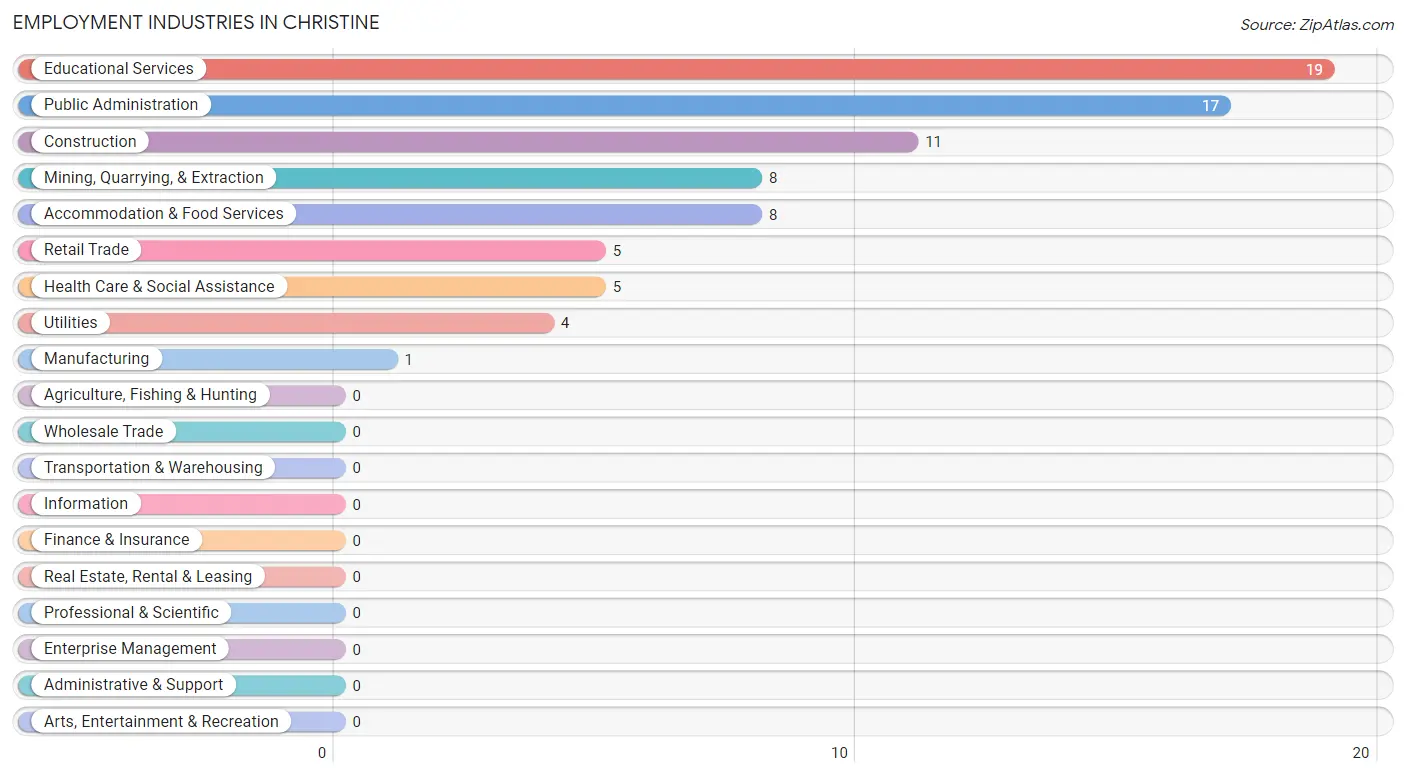
Employment Industries in Christine
The major employment industries in Christine include Educational Services (19 | 23.7%), Public Administration (17 | 21.2%), Construction (11 | 13.8%), Mining, Quarrying, & Extraction (8 | 10.0%), and Accommodation & Food Services (8 | 10.0%).
Employment Industries by Sex in Christine
The Christine industries that see more men than women are Mining, Quarrying, & Extraction (100.0%), Construction (100.0%), and Manufacturing (100.0%), whereas the industries that tend to have a higher number of women are Health Care & Social Assistance (100.0%), Retail Trade (60.0%), and Educational Services (57.9%).
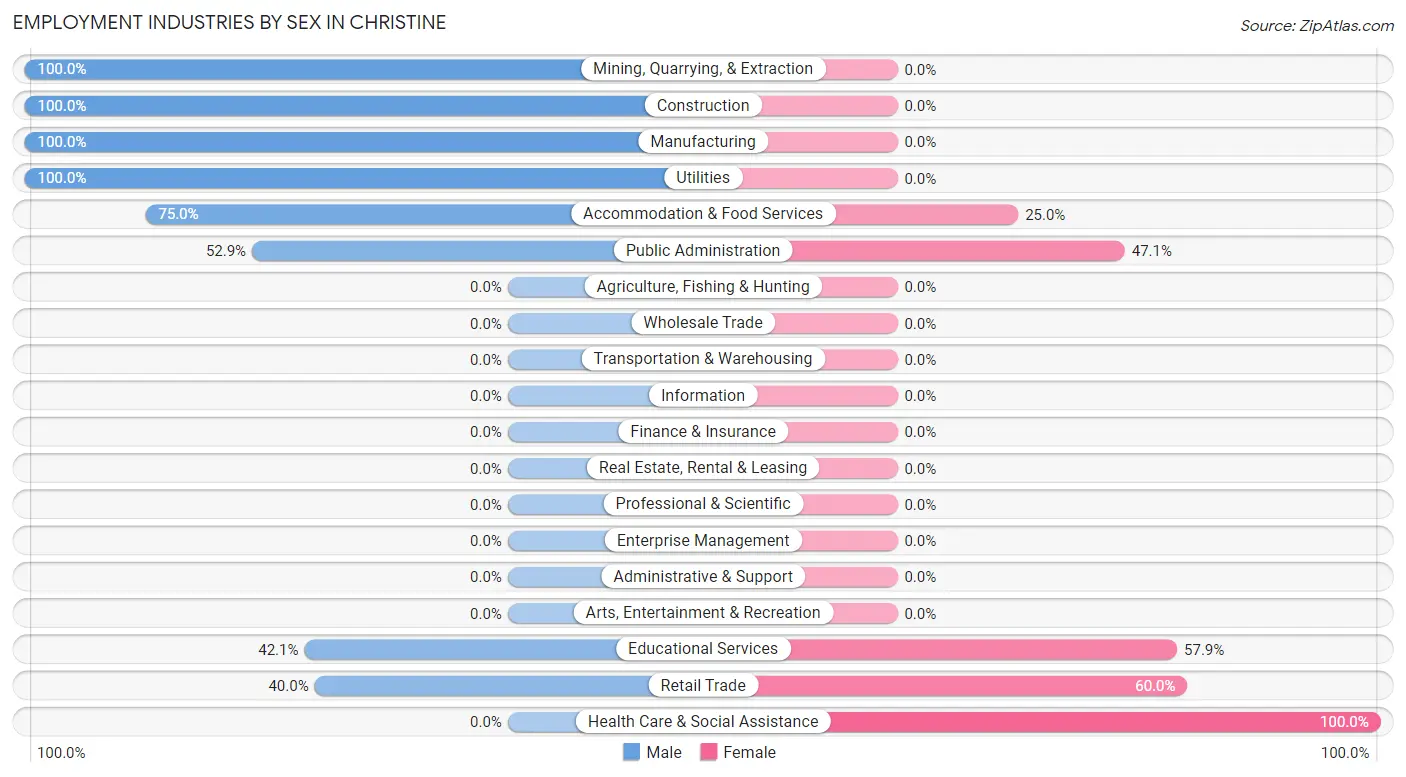
| Industry | Male | Female |
| Agriculture, Fishing & Hunting | 0 (0.0%) | 0 (0.0%) |
| Mining, Quarrying, & Extraction | 8 (100.0%) | 0 (0.0%) |
| Construction | 11 (100.0%) | 0 (0.0%) |
| Manufacturing | 1 (100.0%) | 0 (0.0%) |
| Wholesale Trade | 0 (0.0%) | 0 (0.0%) |
| Retail Trade | 2 (40.0%) | 3 (60.0%) |
| Transportation & Warehousing | 0 (0.0%) | 0 (0.0%) |
| Utilities | 4 (100.0%) | 0 (0.0%) |
| Information | 0 (0.0%) | 0 (0.0%) |
| Finance & Insurance | 0 (0.0%) | 0 (0.0%) |
| Real Estate, Rental & Leasing | 0 (0.0%) | 0 (0.0%) |
| Professional & Scientific | 0 (0.0%) | 0 (0.0%) |
| Enterprise Management | 0 (0.0%) | 0 (0.0%) |
| Administrative & Support | 0 (0.0%) | 0 (0.0%) |
| Educational Services | 8 (42.1%) | 11 (57.9%) |
| Health Care & Social Assistance | 0 (0.0%) | 5 (100.0%) |
| Arts, Entertainment & Recreation | 0 (0.0%) | 0 (0.0%) |
| Accommodation & Food Services | 6 (75.0%) | 2 (25.0%) |
| Public Administration | 9 (52.9%) | 8 (47.1%) |
| Total | 49 (61.3%) | 31 (38.8%) |
Education in Christine
School Enrollment in Christine
The most common levels of schooling among the 62 students in Christine are middle school (23 | 37.1%), high school (21 | 33.9%), and elementary school (17 | 27.4%).
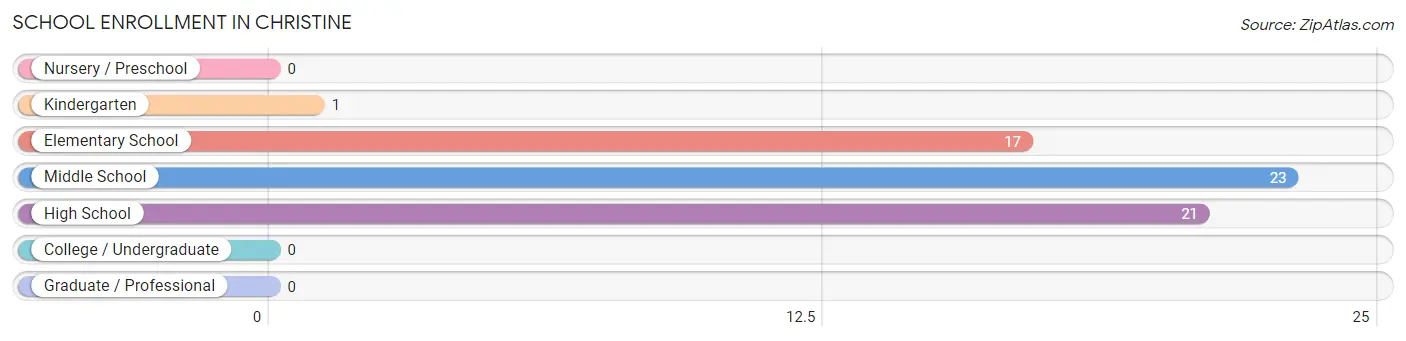
| School Level | # Students | % Students |
| Nursery / Preschool | 0 | 0.0% |
| Kindergarten | 1 | 1.6% |
| Elementary School | 17 | 27.4% |
| Middle School | 23 | 37.1% |
| High School | 21 | 33.9% |
| College / Undergraduate | 0 | 0.0% |
| Graduate / Professional | 0 | 0.0% |
| Total | 62 | 100.0% |
School Enrollment by Age by Funding Source in Christine
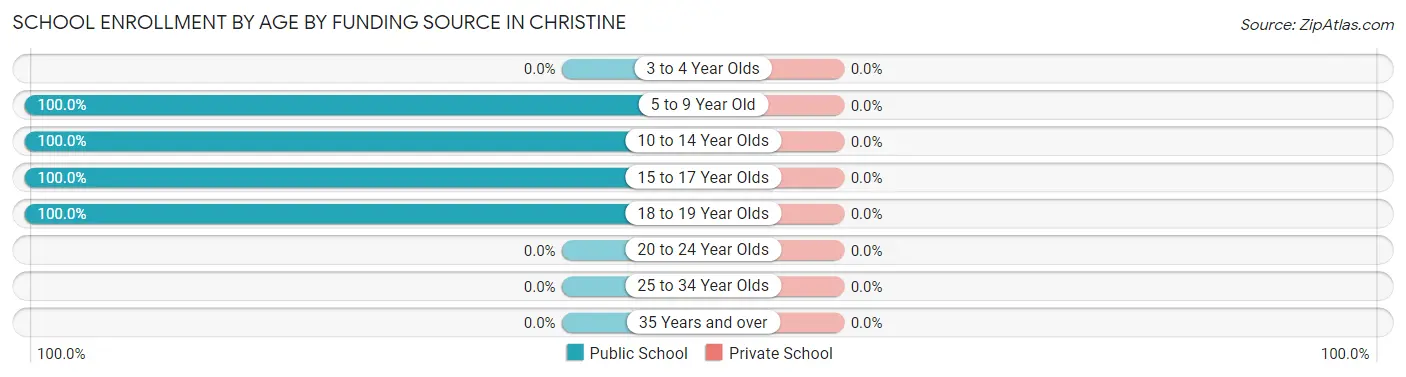
| Age Bracket | Public School | Private School |
| 3 to 4 Year Olds | 0 (0.0%) | 0 (0.0%) |
| 5 to 9 Year Old | 18 (100.0%) | 0 (0.0%) |
| 10 to 14 Year Olds | 23 (100.0%) | 0 (0.0%) |
| 15 to 17 Year Olds | 14 (100.0%) | 0 (0.0%) |
| 18 to 19 Year Olds | 7 (100.0%) | 0 (0.0%) |
| 20 to 24 Year Olds | 0 (0.0%) | 0 (0.0%) |
| 25 to 34 Year Olds | 0 (0.0%) | 0 (0.0%) |
| 35 Years and over | 0 (0.0%) | 0 (0.0%) |
| Total | 62 (100.0%) | 0 (0.0%) |
Educational Attainment by Field of Study in Christine
| Field of Study | # Graduates | % Graduates |
| Computers & Mathematics | 0 | 0.0% |
| Bio, Nature & Agricultural | 0 | 0.0% |
| Physical & Health Sciences | 0 | 0.0% |
| Psychology | 0 | 0.0% |
| Social Sciences | 0 | 0.0% |
| Engineering | 0 | 0.0% |
| Multidisciplinary Studies | 0 | 0.0% |
| Science & Technology | 0 | 0.0% |
| Business | 0 | 0.0% |
| Education | 0 | 0.0% |
| Literature & Languages | 0 | 0.0% |
| Liberal Arts & History | 0 | 0.0% |
| Visual & Performing Arts | 0 | 0.0% |
| Communications | 0 | 0.0% |
| Arts & Humanities | 0 | 0.0% |
| Total | 0 | 0.0% |
Transportation & Commute in Christine
Vehicle Availability by Sex in Christine
The most prevalent vehicle ownership categories in Christine are males with 4 vehicles (22, accounting for 44.9%) and females with 4 vehicles (12, making up 71.0%).
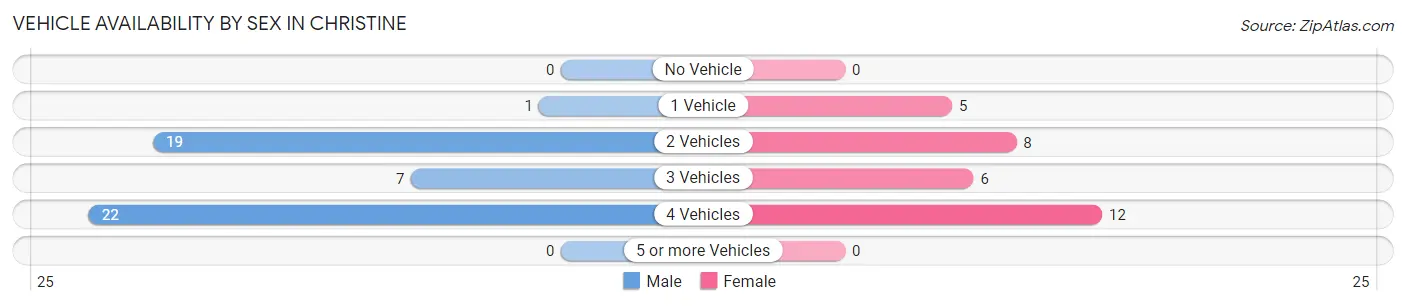
| Vehicles Available | Male | Female |
| No Vehicle | 0 (0.0%) | 0 (0.0%) |
| 1 Vehicle | 1 (2.0%) | 5 (16.1%) |
| 2 Vehicles | 19 (38.8%) | 8 (25.8%) |
| 3 Vehicles | 7 (14.3%) | 6 (19.4%) |
| 4 Vehicles | 22 (44.9%) | 12 (38.7%) |
| 5 or more Vehicles | 0 (0.0%) | 0 (0.0%) |
| Total | 49 (100.0%) | 31 (100.0%) |
Commute Time in Christine
The most frequently occuring commute durations in Christine are 20 to 24 minutes (36 commuters, 45.0%), 5 to 9 minutes (12 commuters, 15.0%), and 60 to 89 minutes (9 commuters, 11.3%).
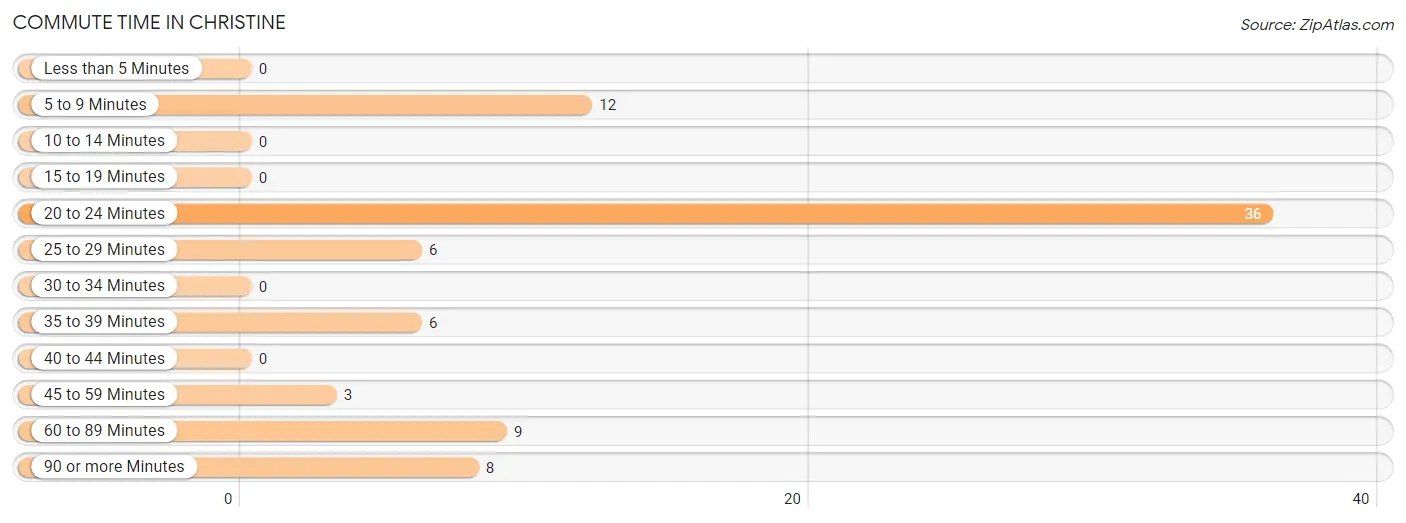
| Commute Time | # Commuters | % Commuters |
| Less than 5 Minutes | 0 | 0.0% |
| 5 to 9 Minutes | 12 | 15.0% |
| 10 to 14 Minutes | 0 | 0.0% |
| 15 to 19 Minutes | 0 | 0.0% |
| 20 to 24 Minutes | 36 | 45.0% |
| 25 to 29 Minutes | 6 | 7.5% |
| 30 to 34 Minutes | 0 | 0.0% |
| 35 to 39 Minutes | 6 | 7.5% |
| 40 to 44 Minutes | 0 | 0.0% |
| 45 to 59 Minutes | 3 | 3.7% |
| 60 to 89 Minutes | 9 | 11.3% |
| 90 or more Minutes | 8 | 10.0% |
Commute Time by Sex in Christine
The most common commute times in Christine are 20 to 24 minutes (18 commuters, 36.7%) for males and 20 to 24 minutes (18 commuters, 58.1%) for females.
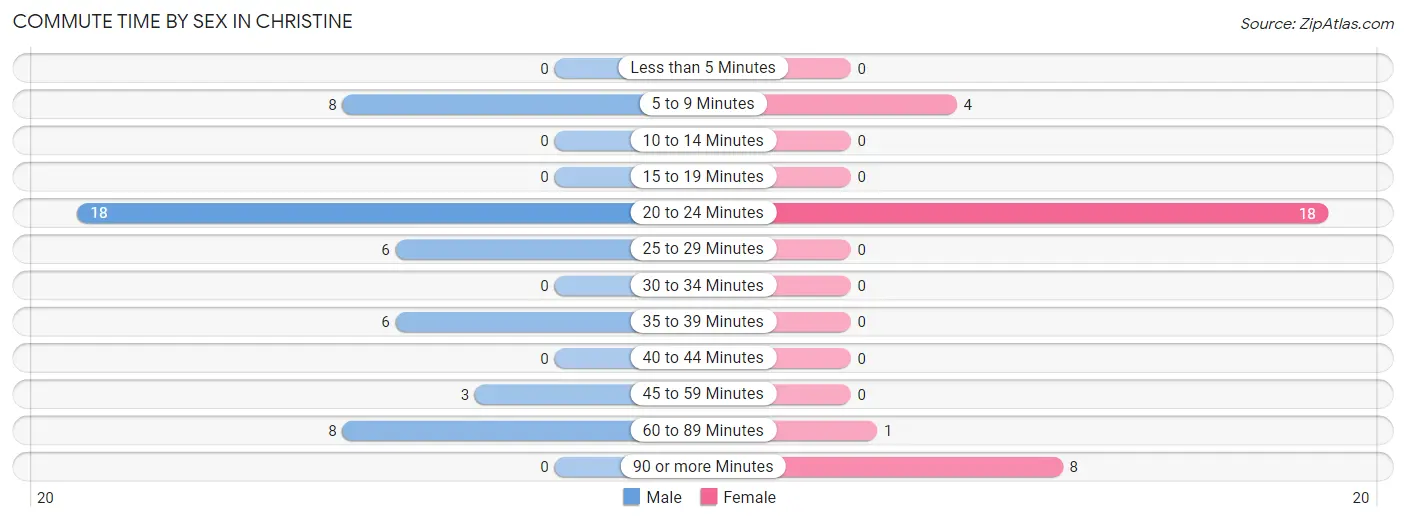
| Commute Time | Male | Female |
| Less than 5 Minutes | 0 (0.0%) | 0 (0.0%) |
| 5 to 9 Minutes | 8 (16.3%) | 4 (12.9%) |
| 10 to 14 Minutes | 0 (0.0%) | 0 (0.0%) |
| 15 to 19 Minutes | 0 (0.0%) | 0 (0.0%) |
| 20 to 24 Minutes | 18 (36.7%) | 18 (58.1%) |
| 25 to 29 Minutes | 6 (12.2%) | 0 (0.0%) |
| 30 to 34 Minutes | 0 (0.0%) | 0 (0.0%) |
| 35 to 39 Minutes | 6 (12.2%) | 0 (0.0%) |
| 40 to 44 Minutes | 0 (0.0%) | 0 (0.0%) |
| 45 to 59 Minutes | 3 (6.1%) | 0 (0.0%) |
| 60 to 89 Minutes | 8 (16.3%) | 1 (3.2%) |
| 90 or more Minutes | 0 (0.0%) | 8 (25.8%) |
Time of Departure to Work by Sex in Christine
The most frequent times of departure to work in Christine are 4:00 PM to 11:59 PM (12, 24.5%) for males and 4:00 PM to 11:59 PM (11, 35.5%) for females.
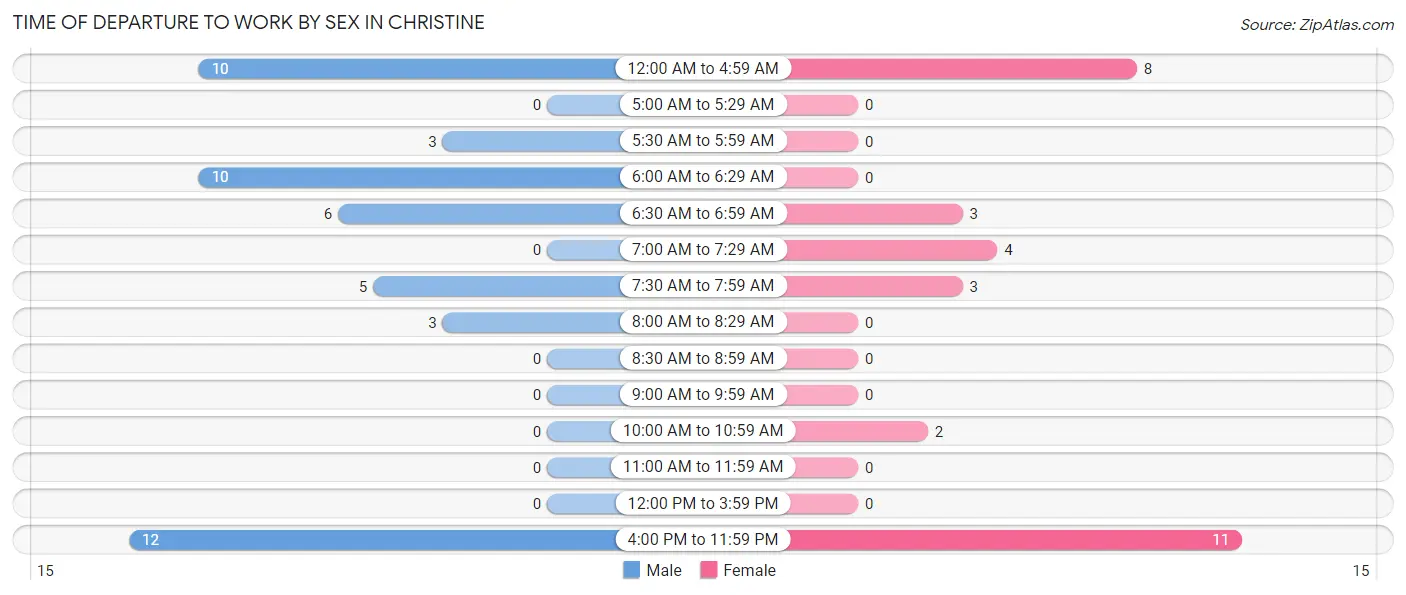
| Time of Departure | Male | Female |
| 12:00 AM to 4:59 AM | 10 (20.4%) | 8 (25.8%) |
| 5:00 AM to 5:29 AM | 0 (0.0%) | 0 (0.0%) |
| 5:30 AM to 5:59 AM | 3 (6.1%) | 0 (0.0%) |
| 6:00 AM to 6:29 AM | 10 (20.4%) | 0 (0.0%) |
| 6:30 AM to 6:59 AM | 6 (12.2%) | 3 (9.7%) |
| 7:00 AM to 7:29 AM | 0 (0.0%) | 4 (12.9%) |
| 7:30 AM to 7:59 AM | 5 (10.2%) | 3 (9.7%) |
| 8:00 AM to 8:29 AM | 3 (6.1%) | 0 (0.0%) |
| 8:30 AM to 8:59 AM | 0 (0.0%) | 0 (0.0%) |
| 9:00 AM to 9:59 AM | 0 (0.0%) | 0 (0.0%) |
| 10:00 AM to 10:59 AM | 0 (0.0%) | 2 (6.5%) |
| 11:00 AM to 11:59 AM | 0 (0.0%) | 0 (0.0%) |
| 12:00 PM to 3:59 PM | 0 (0.0%) | 0 (0.0%) |
| 4:00 PM to 11:59 PM | 12 (24.5%) | 11 (35.5%) |
| Total | 49 (100.0%) | 31 (100.0%) |
Housing Occupancy in Christine
Occupancy by Ownership in Christine
Of the total 76 dwellings in Christine, owner-occupied units account for 58 (76.3%), while renter-occupied units make up 18 (23.7%).
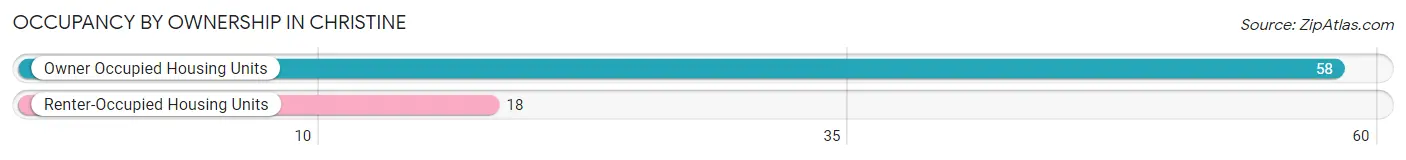
| Occupancy | # Housing Units | % Housing Units |
| Owner Occupied Housing Units | 58 | 76.3% |
| Renter-Occupied Housing Units | 18 | 23.7% |
| Total Occupied Housing Units | 76 | 100.0% |
Occupancy by Household Size in Christine
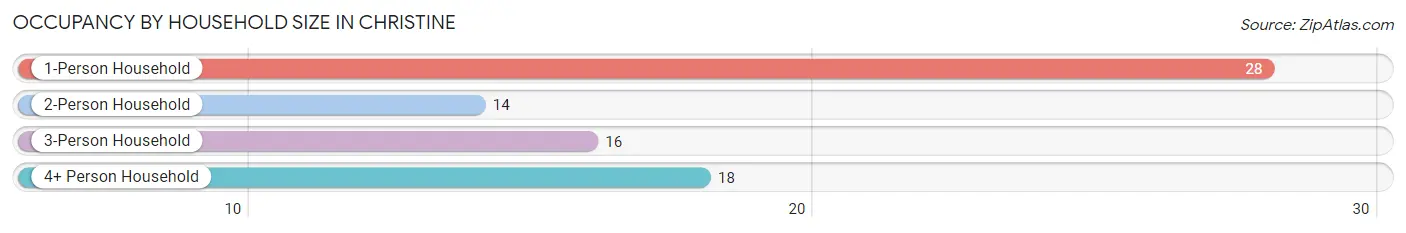
| Household Size | # Housing Units | % Housing Units |
| 1-Person Household | 28 | 36.8% |
| 2-Person Household | 14 | 18.4% |
| 3-Person Household | 16 | 21.0% |
| 4+ Person Household | 18 | 23.7% |
| Total Housing Units | 76 | 100.0% |
Occupancy by Ownership by Household Size in Christine
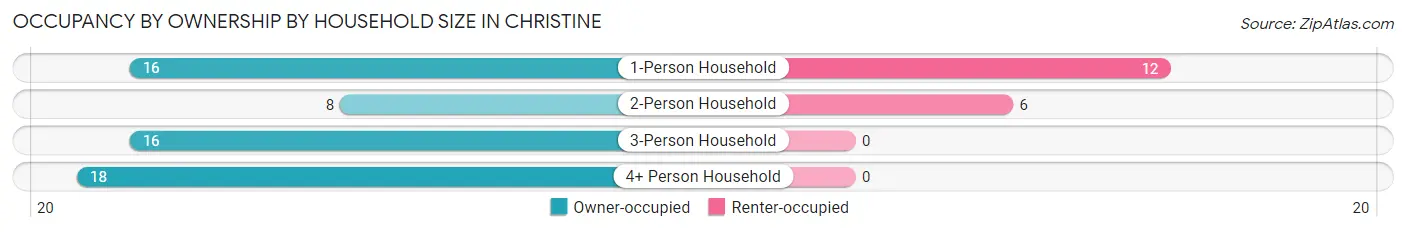
| Household Size | Owner-occupied | Renter-occupied |
| 1-Person Household | 16 (57.1%) | 12 (42.9%) |
| 2-Person Household | 8 (57.1%) | 6 (42.9%) |
| 3-Person Household | 16 (100.0%) | 0 (0.0%) |
| 4+ Person Household | 18 (100.0%) | 0 (0.0%) |
| Total Housing Units | 58 (76.3%) | 18 (23.7%) |
Occupancy by Educational Attainment in Christine
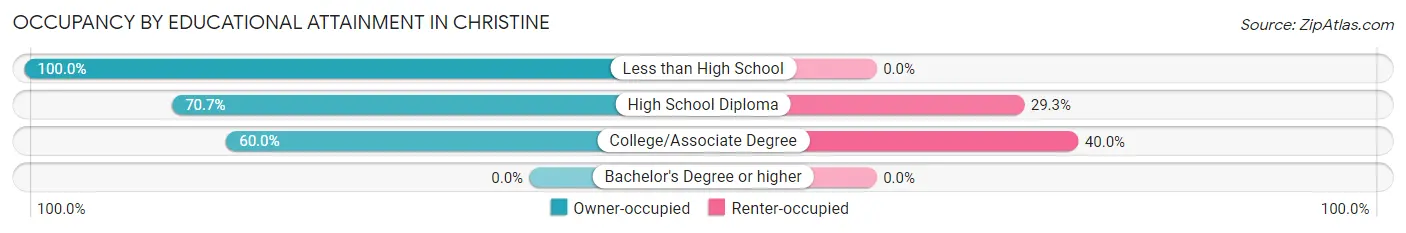
| Household Size | Owner-occupied | Renter-occupied |
| Less than High School | 20 (100.0%) | 0 (0.0%) |
| High School Diploma | 29 (70.7%) | 12 (29.3%) |
| College/Associate Degree | 9 (60.0%) | 6 (40.0%) |
| Bachelor's Degree or higher | 0 (0.0%) | 0 (0.0%) |
Occupancy by Age of Householder in Christine
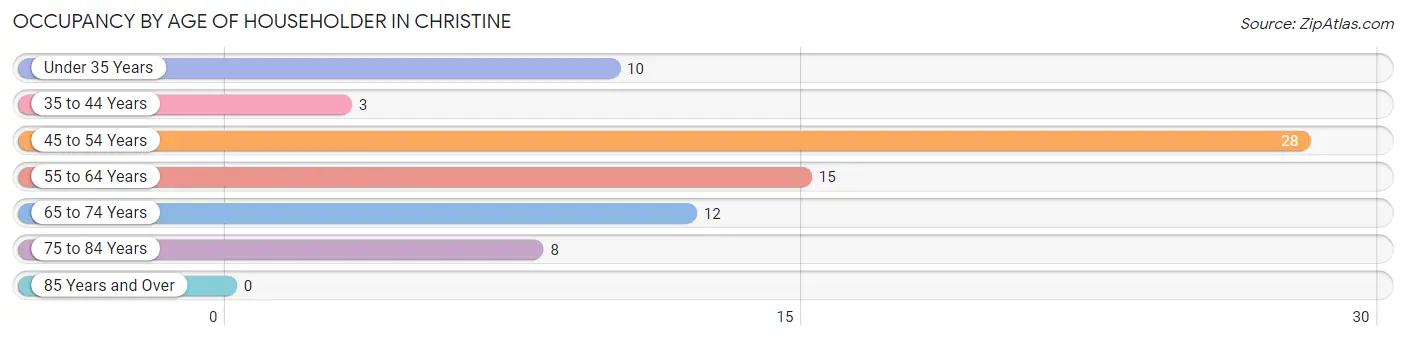
| Age Bracket | # Households | % Households |
| Under 35 Years | 10 | 13.2% |
| 35 to 44 Years | 3 | 4.0% |
| 45 to 54 Years | 28 | 36.8% |
| 55 to 64 Years | 15 | 19.7% |
| 65 to 74 Years | 12 | 15.8% |
| 75 to 84 Years | 8 | 10.5% |
| 85 Years and Over | 0 | 0.0% |
| Total | 76 | 100.0% |
Housing Finances in Christine
Median Income by Occupancy in Christine
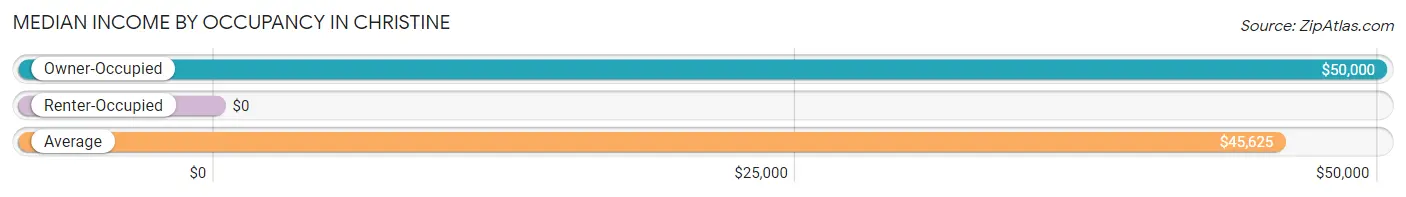
| Occupancy Type | # Households | Median Income |
| Owner-Occupied | 58 (76.3%) | $50,000 |
| Renter-Occupied | 18 (23.7%) | $0 |
| Average | 76 (100.0%) | $45,625 |
Occupancy by Householder Income Bracket in Christine
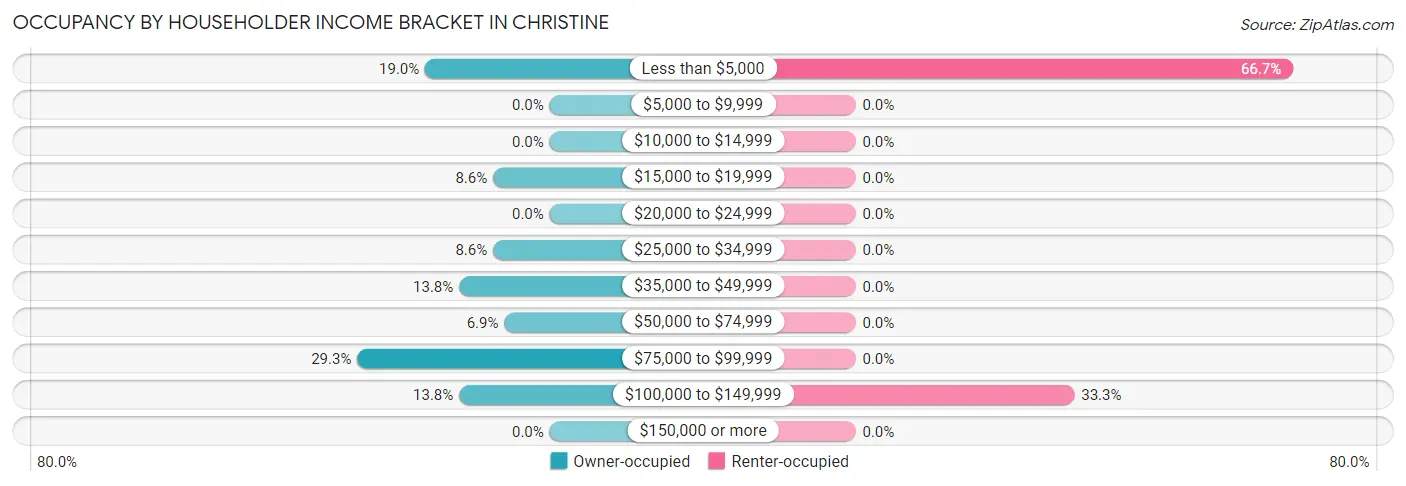
| Income Bracket | Owner-occupied | Renter-occupied |
| Less than $5,000 | 11 (19.0%) | 12 (66.7%) |
| $5,000 to $9,999 | 0 (0.0%) | 0 (0.0%) |
| $10,000 to $14,999 | 0 (0.0%) | 0 (0.0%) |
| $15,000 to $19,999 | 5 (8.6%) | 0 (0.0%) |
| $20,000 to $24,999 | 0 (0.0%) | 0 (0.0%) |
| $25,000 to $34,999 | 5 (8.6%) | 0 (0.0%) |
| $35,000 to $49,999 | 8 (13.8%) | 0 (0.0%) |
| $50,000 to $74,999 | 4 (6.9%) | 0 (0.0%) |
| $75,000 to $99,999 | 17 (29.3%) | 0 (0.0%) |
| $100,000 to $149,999 | 8 (13.8%) | 6 (33.3%) |
| $150,000 or more | 0 (0.0%) | 0 (0.0%) |
| Total | 58 (100.0%) | 18 (100.0%) |
Monthly Housing Cost Tiers in Christine
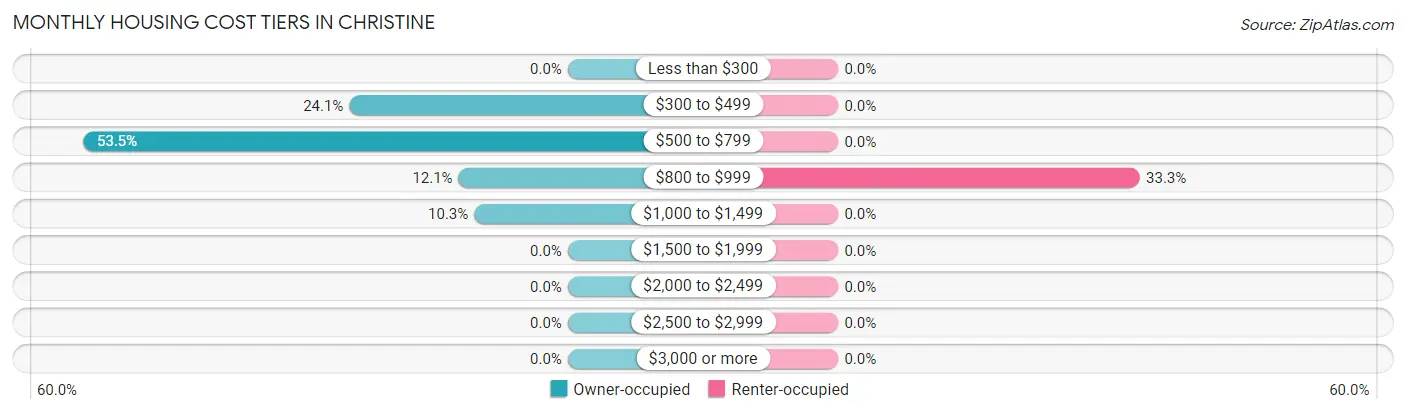
| Monthly Cost | Owner-occupied | Renter-occupied |
| Less than $300 | 0 (0.0%) | 0 (0.0%) |
| $300 to $499 | 14 (24.1%) | 0 (0.0%) |
| $500 to $799 | 31 (53.4%) | 0 (0.0%) |
| $800 to $999 | 7 (12.1%) | 6 (33.3%) |
| $1,000 to $1,499 | 6 (10.3%) | 0 (0.0%) |
| $1,500 to $1,999 | 0 (0.0%) | 0 (0.0%) |
| $2,000 to $2,499 | 0 (0.0%) | 0 (0.0%) |
| $2,500 to $2,999 | 0 (0.0%) | 0 (0.0%) |
| $3,000 or more | 0 (0.0%) | 0 (0.0%) |
| Total | 58 (100.0%) | 18 (100.0%) |
Physical Housing Characteristics in Christine
Housing Structures in Christine
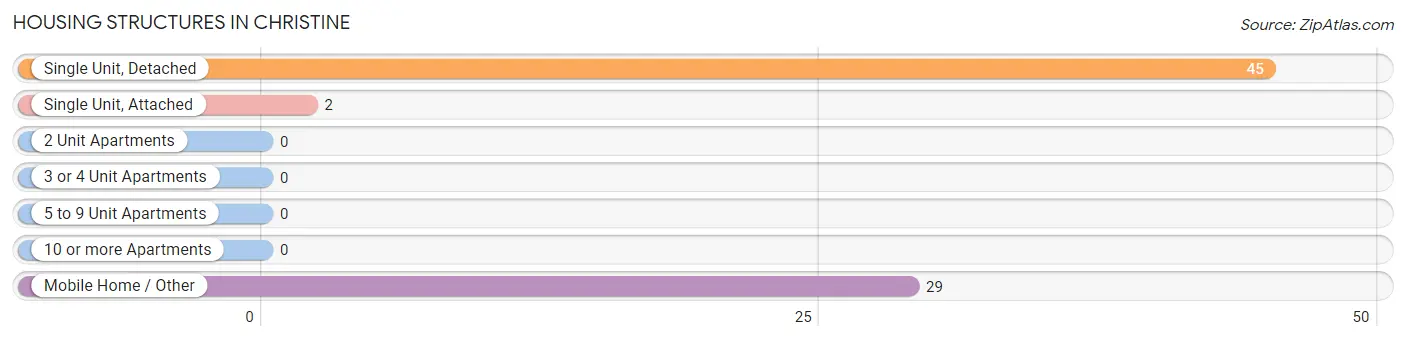
| Structure Type | # Housing Units | % Housing Units |
| Single Unit, Detached | 45 | 59.2% |
| Single Unit, Attached | 2 | 2.6% |
| 2 Unit Apartments | 0 | 0.0% |
| 3 or 4 Unit Apartments | 0 | 0.0% |
| 5 to 9 Unit Apartments | 0 | 0.0% |
| 10 or more Apartments | 0 | 0.0% |
| Mobile Home / Other | 29 | 38.2% |
| Total | 76 | 100.0% |
Housing Structures by Occupancy in Christine
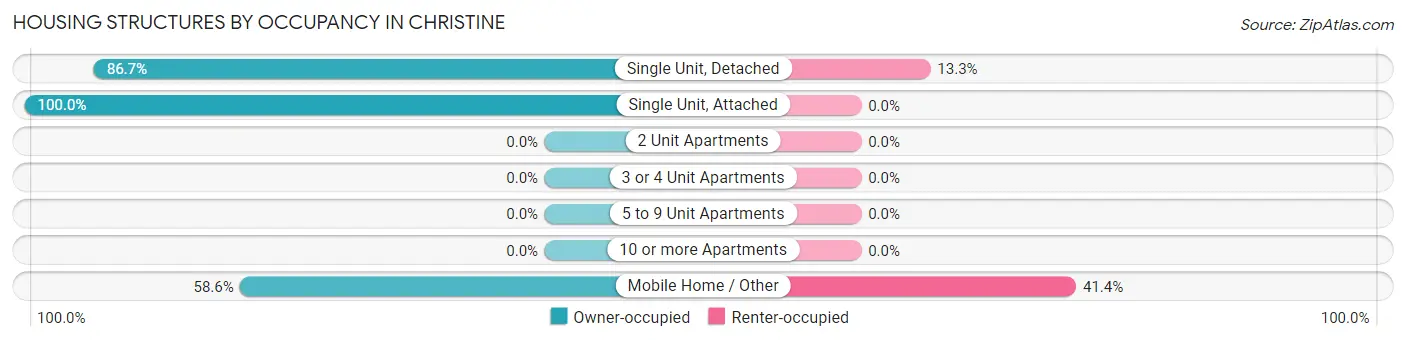
| Structure Type | Owner-occupied | Renter-occupied |
| Single Unit, Detached | 39 (86.7%) | 6 (13.3%) |
| Single Unit, Attached | 2 (100.0%) | 0 (0.0%) |
| 2 Unit Apartments | 0 (0.0%) | 0 (0.0%) |
| 3 or 4 Unit Apartments | 0 (0.0%) | 0 (0.0%) |
| 5 to 9 Unit Apartments | 0 (0.0%) | 0 (0.0%) |
| 10 or more Apartments | 0 (0.0%) | 0 (0.0%) |
| Mobile Home / Other | 17 (58.6%) | 12 (41.4%) |
| Total | 58 (76.3%) | 18 (23.7%) |
Housing Structures by Number of Rooms in Christine
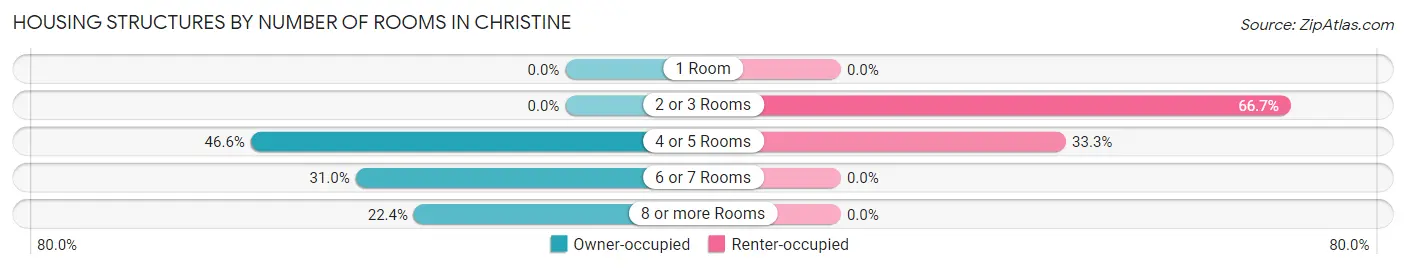
| Number of Rooms | Owner-occupied | Renter-occupied |
| 1 Room | 0 (0.0%) | 0 (0.0%) |
| 2 or 3 Rooms | 0 (0.0%) | 12 (66.7%) |
| 4 or 5 Rooms | 27 (46.6%) | 6 (33.3%) |
| 6 or 7 Rooms | 18 (31.0%) | 0 (0.0%) |
| 8 or more Rooms | 13 (22.4%) | 0 (0.0%) |
| Total | 58 (100.0%) | 18 (100.0%) |
Housing Structure by Heating Type in Christine
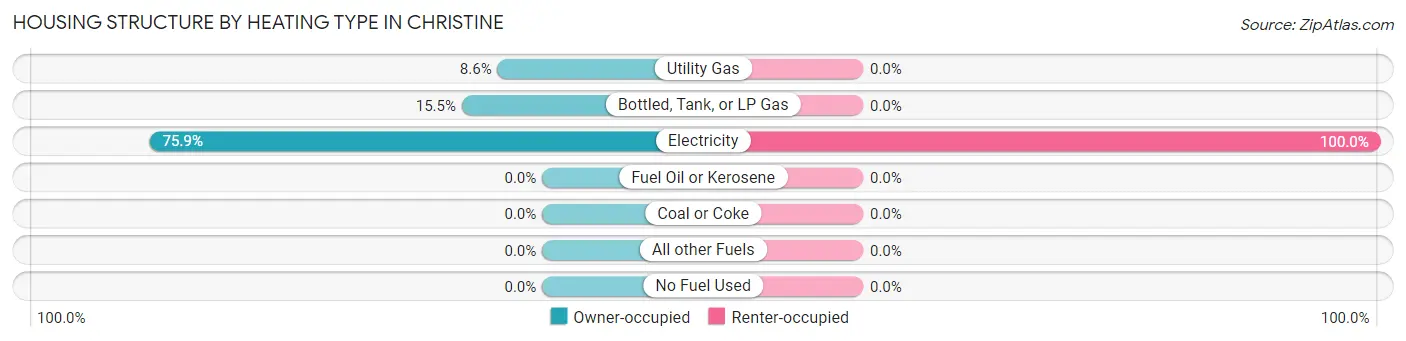
| Heating Type | Owner-occupied | Renter-occupied |
| Utility Gas | 5 (8.6%) | 0 (0.0%) |
| Bottled, Tank, or LP Gas | 9 (15.5%) | 0 (0.0%) |
| Electricity | 44 (75.9%) | 18 (100.0%) |
| Fuel Oil or Kerosene | 0 (0.0%) | 0 (0.0%) |
| Coal or Coke | 0 (0.0%) | 0 (0.0%) |
| All other Fuels | 0 (0.0%) | 0 (0.0%) |
| No Fuel Used | 0 (0.0%) | 0 (0.0%) |
| Total | 58 (100.0%) | 18 (100.0%) |
Household Vehicle Usage in Christine
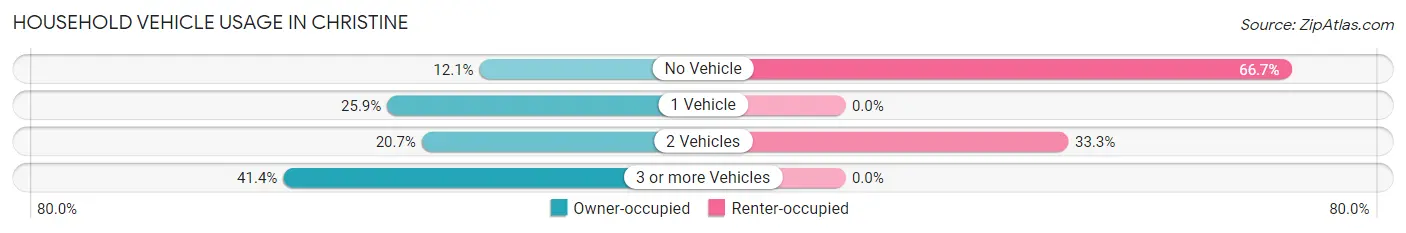
| Vehicles per Household | Owner-occupied | Renter-occupied |
| No Vehicle | 7 (12.1%) | 12 (66.7%) |
| 1 Vehicle | 15 (25.9%) | 0 (0.0%) |
| 2 Vehicles | 12 (20.7%) | 6 (33.3%) |
| 3 or more Vehicles | 24 (41.4%) | 0 (0.0%) |
| Total | 58 (100.0%) | 18 (100.0%) |
Real Estate & Mortgages in Christine
Real Estate and Mortgage Overview in Christine
| Characteristic | Without Mortgage | With Mortgage |
| Housing Units | 47 | 11 |
| Median Property Value | $94,400 | $88,800 |
| Median Household Income | - | - |
| Monthly Housing Costs | $545 | $0 |
| Real Estate Taxes | $2,071 | $0 |
Property Value by Mortgage Status in Christine
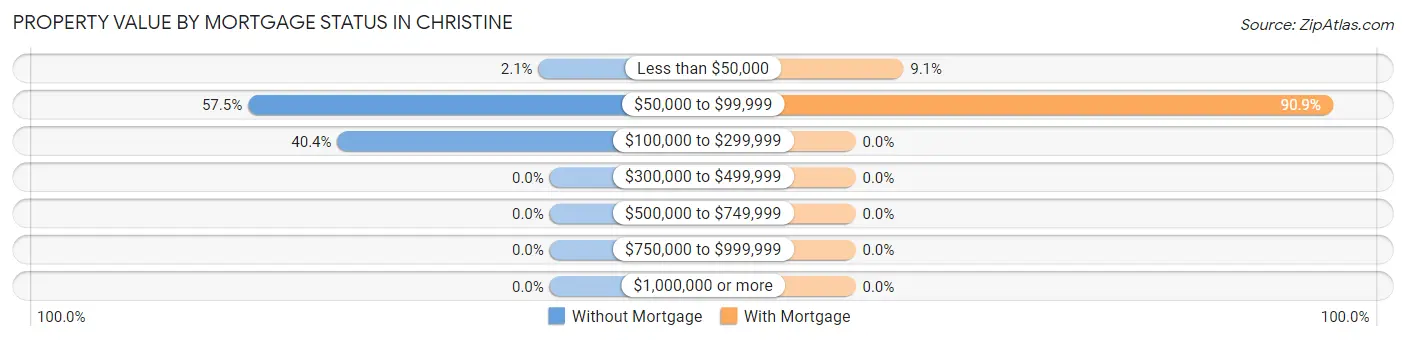
| Property Value | Without Mortgage | With Mortgage |
| Less than $50,000 | 1 (2.1%) | 1 (9.1%) |
| $50,000 to $99,999 | 27 (57.5%) | 10 (90.9%) |
| $100,000 to $299,999 | 19 (40.4%) | 0 (0.0%) |
| $300,000 to $499,999 | 0 (0.0%) | 0 (0.0%) |
| $500,000 to $749,999 | 0 (0.0%) | 0 (0.0%) |
| $750,000 to $999,999 | 0 (0.0%) | 0 (0.0%) |
| $1,000,000 or more | 0 (0.0%) | 0 (0.0%) |
| Total | 47 (100.0%) | 11 (100.0%) |
Household Income by Mortgage Status in Christine
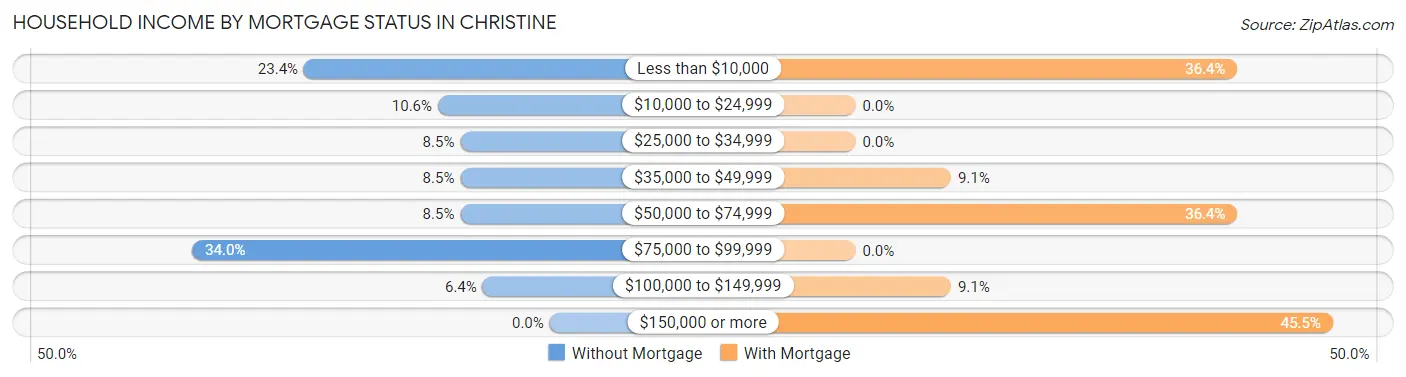
| Household Income | Without Mortgage | With Mortgage |
| Less than $10,000 | 11 (23.4%) | 4 (36.4%) |
| $10,000 to $24,999 | 5 (10.6%) | 0 (0.0%) |
| $25,000 to $34,999 | 4 (8.5%) | 0 (0.0%) |
| $35,000 to $49,999 | 4 (8.5%) | 1 (9.1%) |
| $50,000 to $74,999 | 4 (8.5%) | 4 (36.4%) |
| $75,000 to $99,999 | 16 (34.0%) | 0 (0.0%) |
| $100,000 to $149,999 | 3 (6.4%) | 1 (9.1%) |
| $150,000 or more | 0 (0.0%) | 5 (45.5%) |
| Total | 47 (100.0%) | 11 (100.0%) |
Property Value to Household Income Ratio in Christine
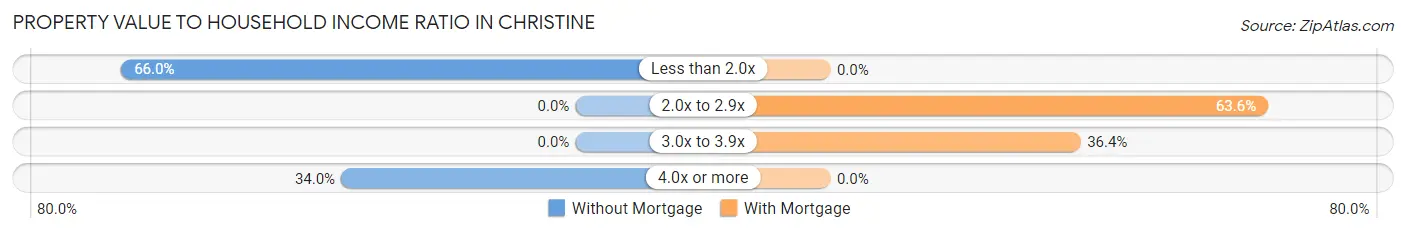
| Value-to-Income Ratio | Without Mortgage | With Mortgage |
| Less than 2.0x | 31 (66.0%) | 0 (0.0%) |
| 2.0x to 2.9x | 0 (0.0%) | 7 (63.6%) |
| 3.0x to 3.9x | 0 (0.0%) | 4 (36.4%) |
| 4.0x or more | 16 (34.0%) | 0 (0.0%) |
| Total | 47 (100.0%) | 11 (100.0%) |
Real Estate Taxes by Mortgage Status in Christine
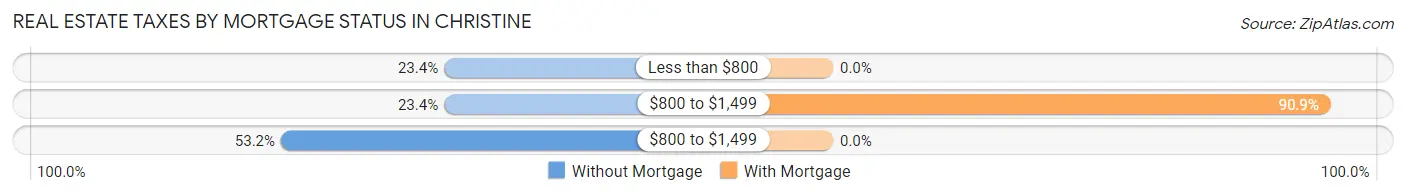
| Property Taxes | Without Mortgage | With Mortgage |
| Less than $800 | 11 (23.4%) | 0 (0.0%) |
| $800 to $1,499 | 11 (23.4%) | 10 (90.9%) |
| $800 to $1,499 | 25 (53.2%) | 0 (0.0%) |
| Total | 47 (100.0%) | 11 (100.0%) |
Health & Disability in Christine
Health Insurance Coverage by Age in Christine
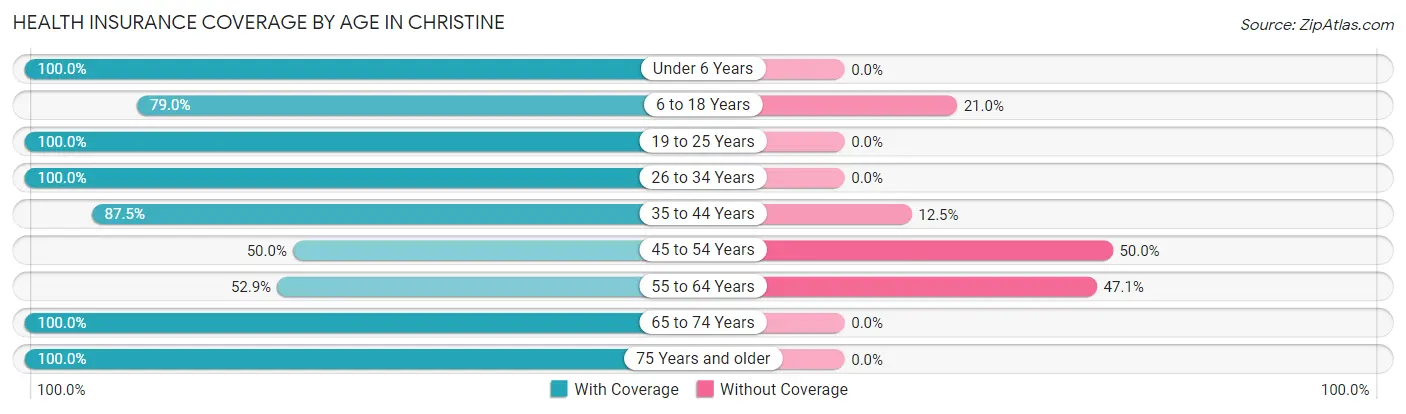
| Age Bracket | With Coverage | Without Coverage |
| Under 6 Years | 2 (100.0%) | 0 (0.0%) |
| 6 to 18 Years | 49 (79.0%) | 13 (21.0%) |
| 19 to 25 Years | 7 (100.0%) | 0 (0.0%) |
| 26 to 34 Years | 24 (100.0%) | 0 (0.0%) |
| 35 to 44 Years | 21 (87.5%) | 3 (12.5%) |
| 45 to 54 Years | 19 (50.0%) | 19 (50.0%) |
| 55 to 64 Years | 9 (52.9%) | 8 (47.1%) |
| 65 to 74 Years | 16 (100.0%) | 0 (0.0%) |
| 75 Years and older | 23 (100.0%) | 0 (0.0%) |
| Total | 170 (79.8%) | 43 (20.2%) |
Health Insurance Coverage by Citizenship Status in Christine
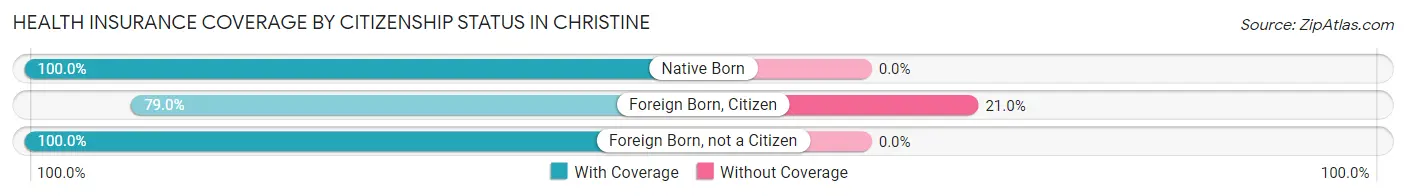
| Citizenship Status | With Coverage | Without Coverage |
| Native Born | 2 (100.0%) | 0 (0.0%) |
| Foreign Born, Citizen | 49 (79.0%) | 13 (21.0%) |
| Foreign Born, not a Citizen | 7 (100.0%) | 0 (0.0%) |
Health Insurance Coverage by Household Income in Christine
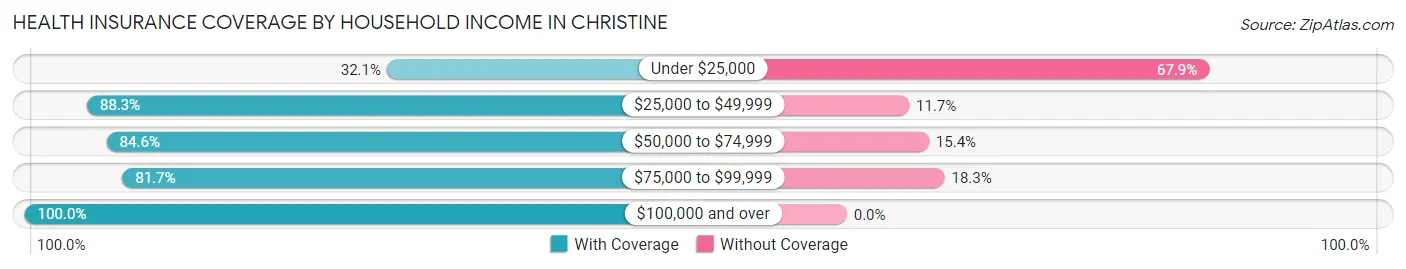
| Household Income | With Coverage | Without Coverage |
| Under $25,000 | 9 (32.1%) | 19 (67.9%) |
| $25,000 to $49,999 | 53 (88.3%) | 7 (11.7%) |
| $50,000 to $74,999 | 22 (84.6%) | 4 (15.4%) |
| $75,000 to $99,999 | 58 (81.7%) | 13 (18.3%) |
| $100,000 and over | 28 (100.0%) | 0 (0.0%) |
Public vs Private Health Insurance Coverage by Age in Christine
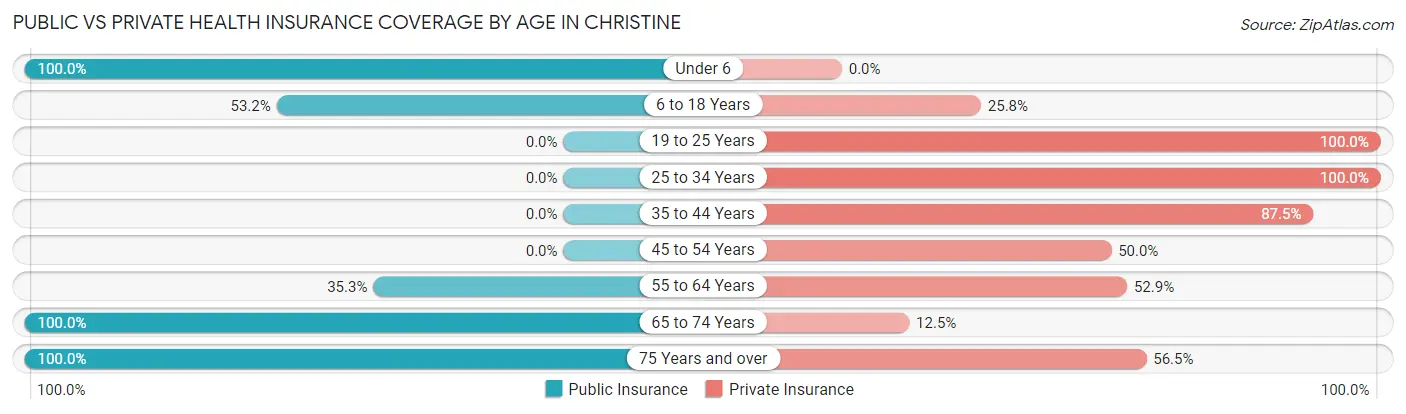
| Age Bracket | Public Insurance | Private Insurance |
| Under 6 | 2 (100.0%) | 0 (0.0%) |
| 6 to 18 Years | 33 (53.2%) | 16 (25.8%) |
| 19 to 25 Years | 0 (0.0%) | 7 (100.0%) |
| 25 to 34 Years | 0 (0.0%) | 24 (100.0%) |
| 35 to 44 Years | 0 (0.0%) | 21 (87.5%) |
| 45 to 54 Years | 0 (0.0%) | 19 (50.0%) |
| 55 to 64 Years | 6 (35.3%) | 9 (52.9%) |
| 65 to 74 Years | 16 (100.0%) | 2 (12.5%) |
| 75 Years and over | 23 (100.0%) | 13 (56.5%) |
| Total | 80 (37.6%) | 111 (52.1%) |
Disability Status by Sex by Age in Christine
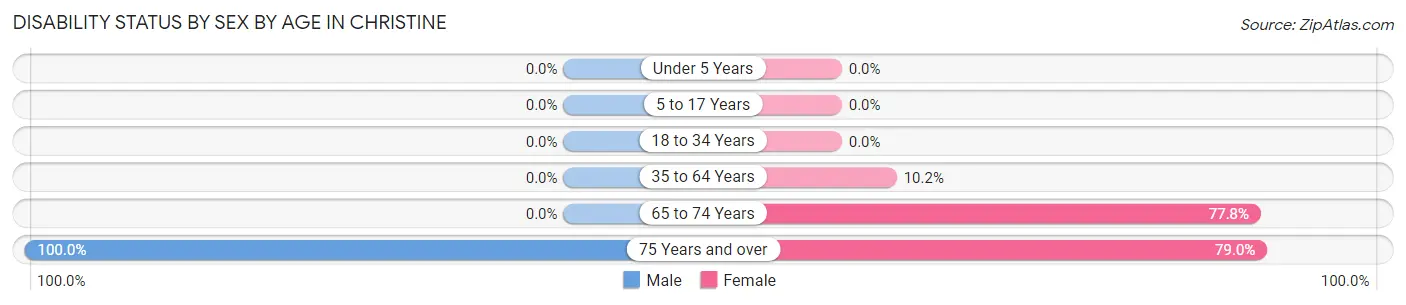
| Age Bracket | Male | Female |
| Under 5 Years | 0 (0.0%) | 0 (0.0%) |
| 5 to 17 Years | 0 (0.0%) | 0 (0.0%) |
| 18 to 34 Years | 0 (0.0%) | 0 (0.0%) |
| 35 to 64 Years | 0 (0.0%) | 5 (10.2%) |
| 65 to 74 Years | 0 (0.0%) | 7 (77.8%) |
| 75 Years and over | 4 (100.0%) | 15 (78.9%) |
Disability Class by Sex by Age in Christine
Disability Class: Hearing Difficulty
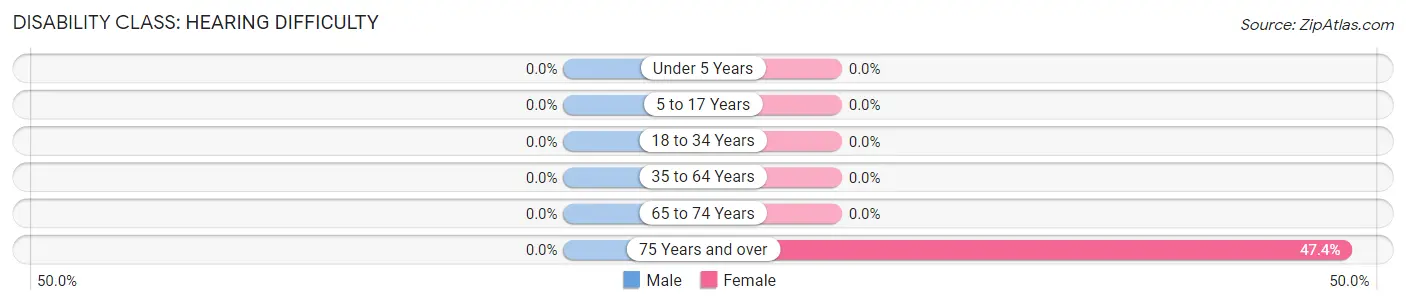
| Age Bracket | Male | Female |
| Under 5 Years | 0 (0.0%) | 0 (0.0%) |
| 5 to 17 Years | 0 (0.0%) | 0 (0.0%) |
| 18 to 34 Years | 0 (0.0%) | 0 (0.0%) |
| 35 to 64 Years | 0 (0.0%) | 0 (0.0%) |
| 65 to 74 Years | 0 (0.0%) | 0 (0.0%) |
| 75 Years and over | 0 (0.0%) | 9 (47.4%) |
Disability Class: Vision Difficulty
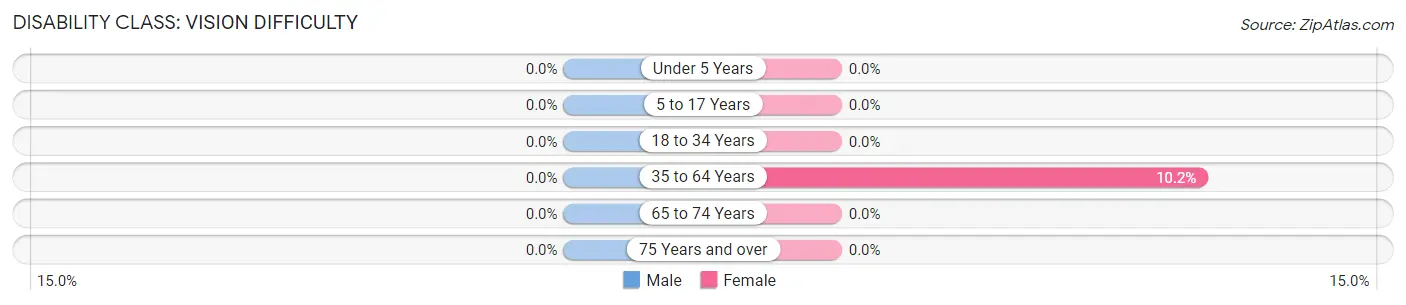
| Age Bracket | Male | Female |
| Under 5 Years | 0 (0.0%) | 0 (0.0%) |
| 5 to 17 Years | 0 (0.0%) | 0 (0.0%) |
| 18 to 34 Years | 0 (0.0%) | 0 (0.0%) |
| 35 to 64 Years | 0 (0.0%) | 5 (10.2%) |
| 65 to 74 Years | 0 (0.0%) | 0 (0.0%) |
| 75 Years and over | 0 (0.0%) | 0 (0.0%) |
Disability Class: Cognitive Difficulty
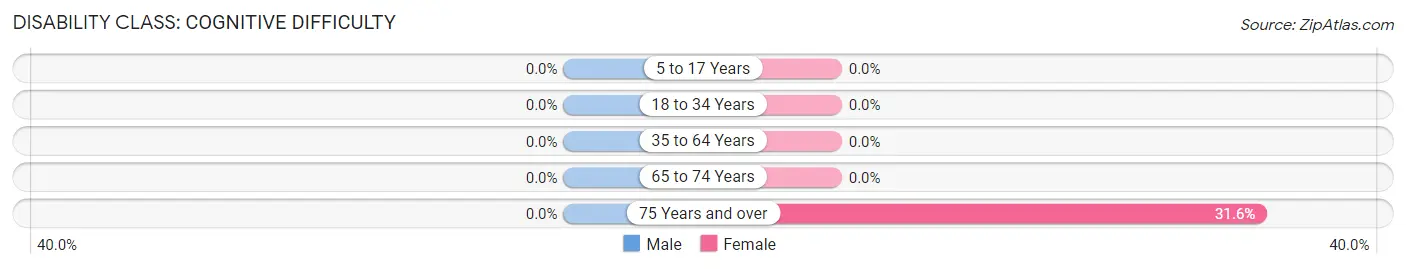
| Age Bracket | Male | Female |
| 5 to 17 Years | 0 (0.0%) | 0 (0.0%) |
| 18 to 34 Years | 0 (0.0%) | 0 (0.0%) |
| 35 to 64 Years | 0 (0.0%) | 0 (0.0%) |
| 65 to 74 Years | 0 (0.0%) | 0 (0.0%) |
| 75 Years and over | 0 (0.0%) | 6 (31.6%) |
Disability Class: Ambulatory Difficulty
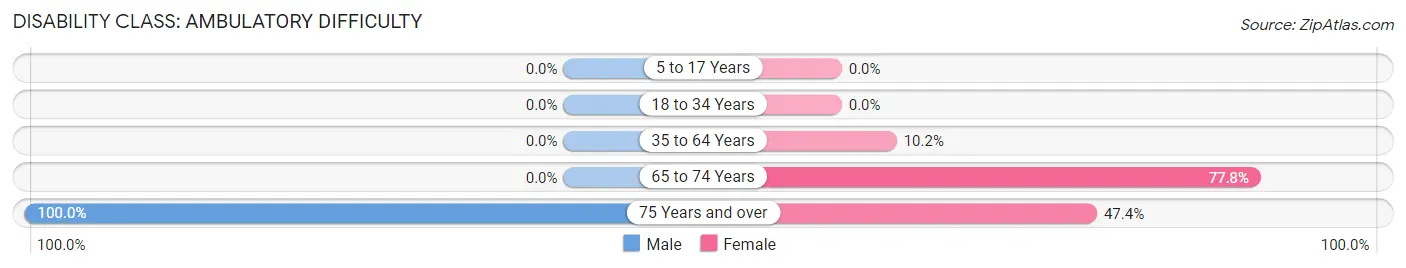
| Age Bracket | Male | Female |
| 5 to 17 Years | 0 (0.0%) | 0 (0.0%) |
| 18 to 34 Years | 0 (0.0%) | 0 (0.0%) |
| 35 to 64 Years | 0 (0.0%) | 5 (10.2%) |
| 65 to 74 Years | 0 (0.0%) | 7 (77.8%) |
| 75 Years and over | 4 (100.0%) | 9 (47.4%) |
Disability Class: Self-Care Difficulty
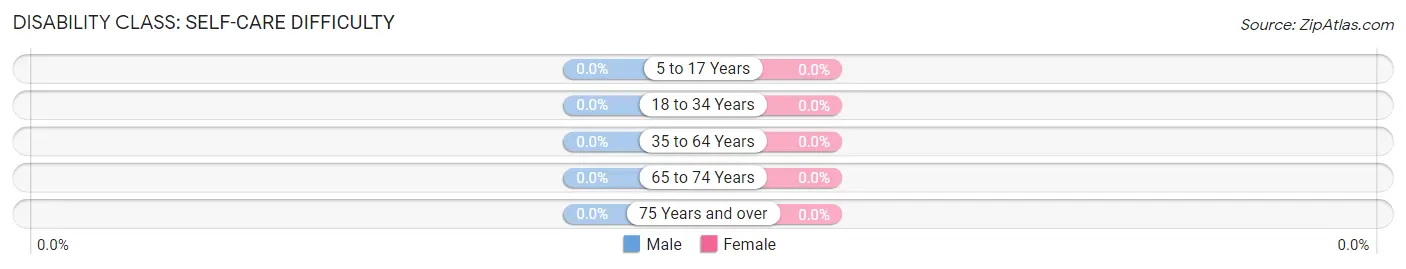
| Age Bracket | Male | Female |
| 5 to 17 Years | 0 (0.0%) | 0 (0.0%) |
| 18 to 34 Years | 0 (0.0%) | 0 (0.0%) |
| 35 to 64 Years | 0 (0.0%) | 0 (0.0%) |
| 65 to 74 Years | 0 (0.0%) | 0 (0.0%) |
| 75 Years and over | 0 (0.0%) | 0 (0.0%) |
Technology Access in Christine
Computing Device Access in Christine
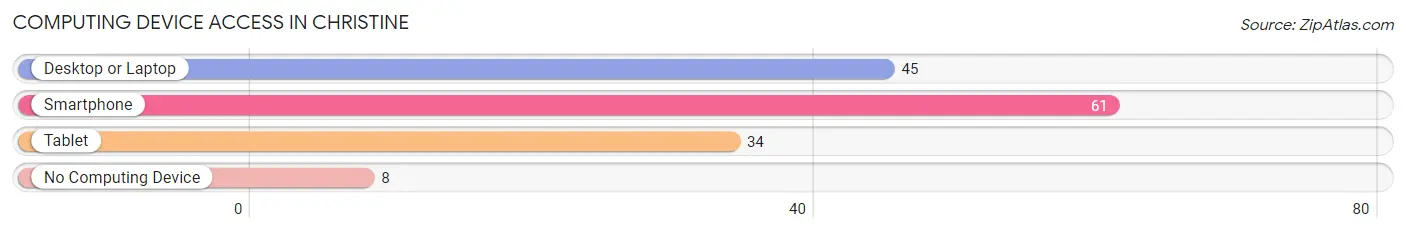
| Device Type | # Households | % Households |
| Desktop or Laptop | 45 | 59.2% |
| Smartphone | 61 | 80.3% |
| Tablet | 34 | 44.7% |
| No Computing Device | 8 | 10.5% |
| Total | 76 | 100.0% |
Internet Access in Christine
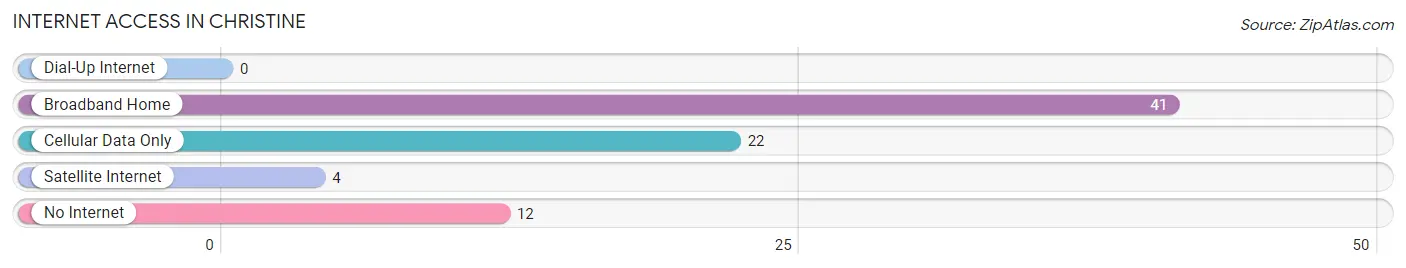
| Internet Type | # Households | % Households |
| Dial-Up Internet | 0 | 0.0% |
| Broadband Home | 41 | 53.9% |
| Cellular Data Only | 22 | 28.9% |
| Satellite Internet | 4 | 5.3% |
| No Internet | 12 | 15.8% |
| Total | 76 | 100.0% |
Christine Summary
Texas is a state located in the south-central region of the United States. It is the second largest state in the country, both in terms of population and land area. Texas is bordered by the states of Oklahoma, Arkansas, Louisiana, New Mexico, and the Mexican states of Chihuahua, Coahuila, Nuevo Leon, and Tamaulipas. The state capital is Austin, and the largest city is Houston.
History
The history of Texas dates back to the 16th century, when Spanish explorers first arrived in the region. The area was part of the Spanish Empire until 1821, when it became part of the newly independent Mexican Republic. In 1836, Texas declared its independence from Mexico and became the Republic of Texas. The Republic of Texas was annexed by the United States in 1845, and Texas became the 28th state in the Union.
During the American Civil War, Texas seceded from the Union and joined the Confederate States of America. After the war, Texas was readmitted to the Union in 1870. In the late 19th and early 20th centuries, Texas experienced a period of rapid growth and industrialization. This period was marked by the discovery of oil in the state, which led to an economic boom.
Geography
Texas is located in the south-central region of the United States. It is bordered by the states of Oklahoma, Arkansas, Louisiana, New Mexico, and the Mexican states of Chihuahua, Coahuila, Nuevo Leon, and Tamaulipas. The state has a total area of 268,820 square miles, making it the second largest state in the country.
Texas is divided into four distinct geographic regions: the Gulf Coastal Plains, the Great Plains, the Edwards Plateau, and the Basin and Range Province. The Gulf Coastal Plains are located in the southeastern part of the state and are characterized by flat, marshy terrain. The Great Plains are located in the northern and western parts of the state and are characterized by rolling hills and grasslands. The Edwards Plateau is located in the central part of the state and is characterized by rugged hills and canyons. The Basin and Range Province is located in the western part of the state and is characterized by mountains and desert.
Economy
The economy of Texas is one of the largest and most diverse in the United States. The state is a major producer of oil and natural gas, and is also a major producer of agricultural products such as cotton, cattle, and wheat. The state is also a major producer of industrial products such as chemicals, electronics, and machinery.
The state’s economy is also heavily reliant on the service sector, which includes tourism, finance, and healthcare. The state is home to several major corporations, including ExxonMobil, AT&T, and Dell.
Demographics
As of 2020, the population of Texas was estimated to be 29.1 million. The state is one of the most populous in the country, and is the second most populous state after California. The state is also one of the most diverse in the country, with a population that is composed of a variety of ethnic and racial groups.
The largest racial group in the state is White, which makes up 43.7% of the population. The second largest racial group is Hispanic or Latino, which makes up 39.4% of the population. Other racial groups include African American (11.9%), Asian (3.8%), and Native American (0.7%).
The median household income in Texas is $59,206, which is slightly lower than the national median of $61,937. The poverty rate in the state is 14.7%, which is slightly higher than the national rate of 11.8%.
Common Questions
What is Per Capita Income in Christine?
Per Capita income in Christine is $20,338.
What is the Median Family Income in Christine?
Median Family Income in Christine is $79,500.
What is the Median Household income in Christine?
Median Household Income in Christine is $45,625.
What is Inequality or Gini Index in Christine?
Inequality or Gini Index in Christine is 0.49.
What is the Total Population of Christine?
Total Population of Christine is 213.
What is the Total Male Population of Christine?
Total Male Population of Christine is 79.
What is the Total Female Population of Christine?
Total Female Population of Christine is 134.
What is the Ratio of Males per 100 Females in Christine?
There are 58.96 Males per 100 Females in Christine.
What is the Ratio of Females per 100 Males in Christine?
There are 169.62 Females per 100 Males in Christine.
What is the Median Population Age in Christine?
Median Population Age in Christine is 43.3 Years.
What is the Average Family Size in Christine
Average Family Size in Christine is 4.1 People.
What is the Average Household Size in Christine
Average Household Size in Christine is 2.8 People.
How Large is the Labor Force in Christine?
There are 98 People in the Labor Forcein in Christine.
What is the Percentage of People in the Labor Force in Christine?
58.3% of People are in the Labor Force in Christine.
What is the Unemployment Rate in Christine?
Unemployment Rate in Christine is 18.4%.