Medina, TX Map & Demographics
Medina Map
Medina Overview
$14,684
PER CAPITA INCOME
$26,591
AVG FAMILY INCOME
$24,566
AVG HOUSEHOLD INCOME
0.59
INEQUALITY / GINI INDEX
4,436
TOTAL POPULATION
1,963
MALE POPULATION
2,473
FEMALE POPULATION
79.38
MALES / 100 FEMALES
125.98
FEMALES / 100 MALES
24.4
MEDIAN AGE
3.7
AVG FAMILY SIZE
3.7
AVG HOUSEHOLD SIZE
1,677
LABOR FORCE [ PEOPLE ]
57.1%
PERCENT IN LABOR FORCE
14.7%
UNEMPLOYMENT RATE
Medina Zip Codes
Medina Area Codes
Income in Medina
Income Overview in Medina
Per Capita Income in Medina is $14,684, while median incomes of families and households are $26,591 and $24,566 respectively.
| Characteristic | Number | Measure |
| Per Capita Income | 4,436 | $14,684 |
| Median Family Income | 1,058 | $26,591 |
| Mean Family Income | 1,058 | $56,878 |
| Median Household Income | 1,211 | $24,566 |
| Mean Household Income | 1,211 | $52,502 |
| Income Deficit | 1,058 | $0 |
| Wage / Income Gap (%) | 4,436 | 0.00% |
| Wage / Income Gap ($) | 4,436 | 100.00¢ per $1 |
| Gini / Inequality Index | 4,436 | 0.59 |
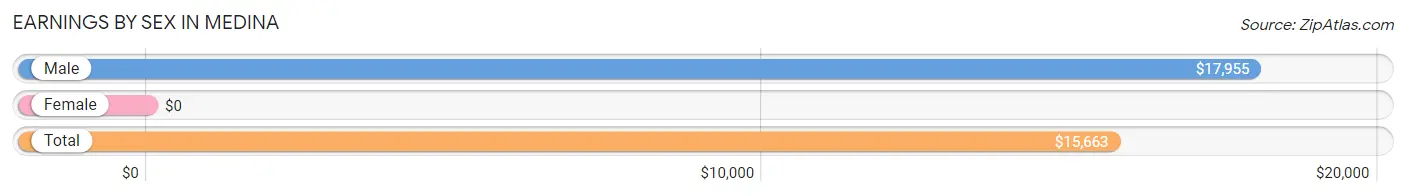
Earnings by Sex in Medina
| Sex | Number | Average Earnings |
| Male | 892 (50.6%) | $17,955 |
| Female | 872 (49.4%) | $0 |
| Total | 1,764 (100.0%) | $15,663 |
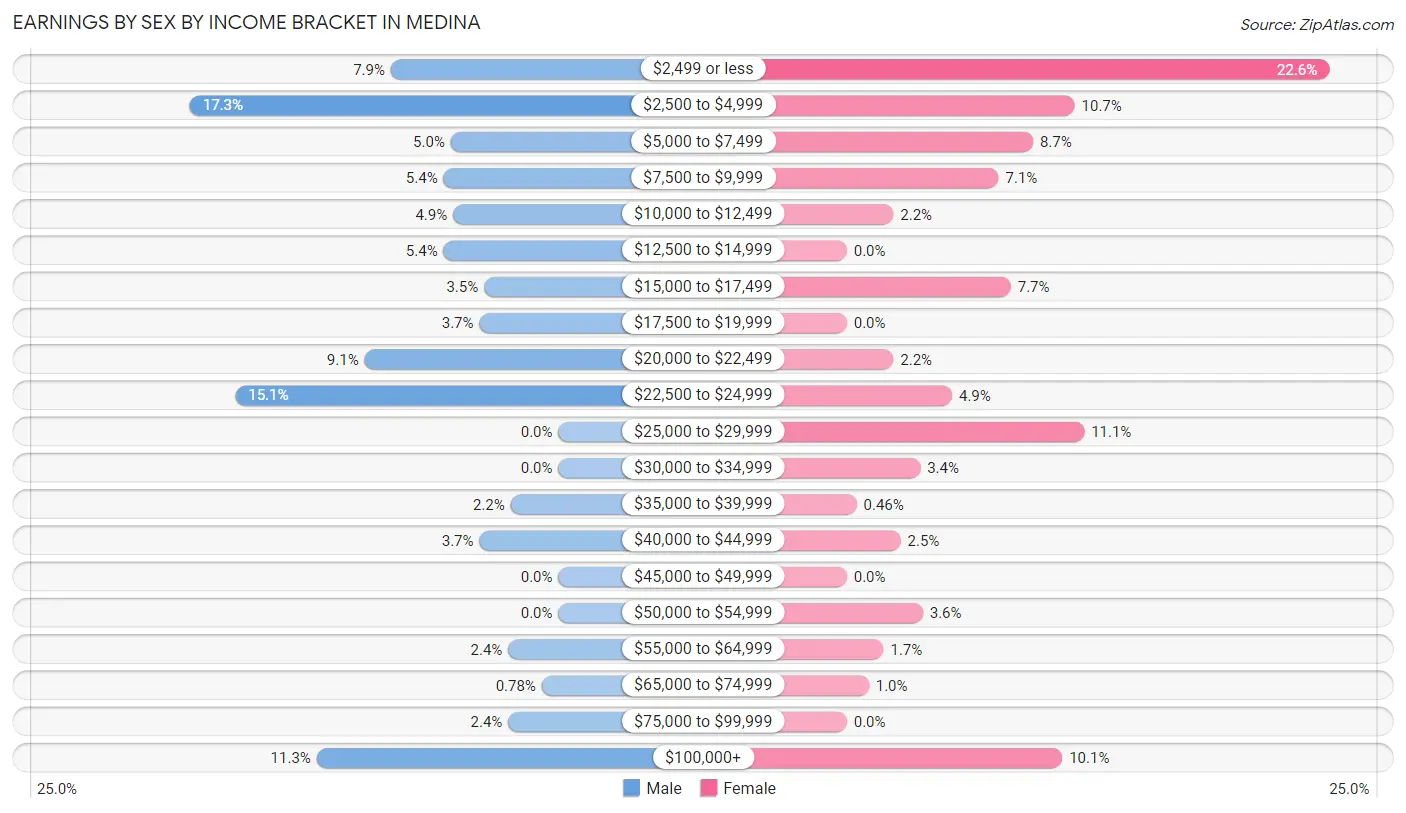
Earnings by Sex by Income Bracket in Medina
The most common earnings brackets in Medina are $2,500 to $4,999 for men (154 | 17.3%) and $2,499 or less for women (197 | 22.6%).
| Income | Male | Female |
| $2,499 or less | 70 (7.9%) | 197 (22.6%) |
| $2,500 to $4,999 | 154 (17.3%) | 93 (10.7%) |
| $5,000 to $7,499 | 45 (5.0%) | 76 (8.7%) |
| $7,500 to $9,999 | 48 (5.4%) | 62 (7.1%) |
| $10,000 to $12,499 | 44 (4.9%) | 19 (2.2%) |
| $12,500 to $14,999 | 48 (5.4%) | 0 (0.0%) |
| $15,000 to $17,499 | 31 (3.5%) | 67 (7.7%) |
| $17,500 to $19,999 | 33 (3.7%) | 0 (0.0%) |
| $20,000 to $22,499 | 81 (9.1%) | 19 (2.2%) |
| $22,500 to $24,999 | 135 (15.1%) | 43 (4.9%) |
| $25,000 to $29,999 | 0 (0.0%) | 97 (11.1%) |
| $30,000 to $34,999 | 0 (0.0%) | 30 (3.4%) |
| $35,000 to $39,999 | 20 (2.2%) | 4 (0.5%) |
| $40,000 to $44,999 | 33 (3.7%) | 22 (2.5%) |
| $45,000 to $49,999 | 0 (0.0%) | 0 (0.0%) |
| $50,000 to $54,999 | 0 (0.0%) | 31 (3.6%) |
| $55,000 to $64,999 | 21 (2.4%) | 15 (1.7%) |
| $65,000 to $74,999 | 7 (0.8%) | 9 (1.0%) |
| $75,000 to $99,999 | 21 (2.4%) | 0 (0.0%) |
| $100,000+ | 101 (11.3%) | 88 (10.1%) |
| Total | 892 (100.0%) | 872 (100.0%) |
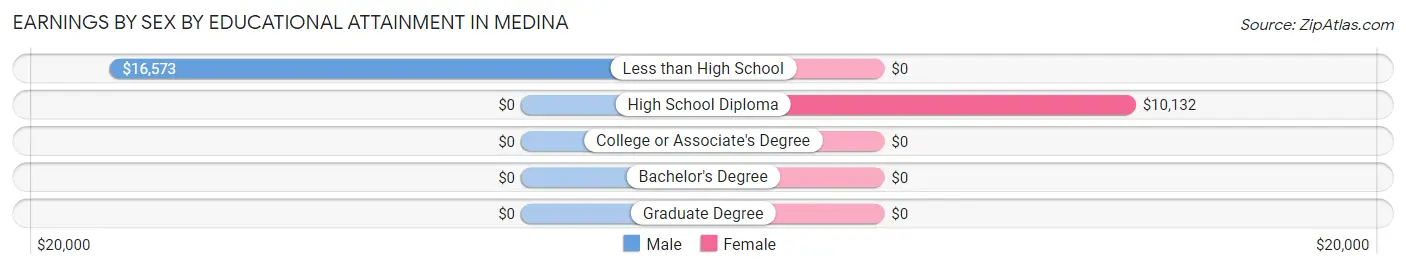
Earnings by Sex by Educational Attainment in Medina
Average earnings in Medina are $20,432 for men and $22,965 for women, a difference of 11.0%. Men with an educational attainment of less than high school enjoy the highest average annual earnings of $16,573, while those with less than high school education earn the least with $16,573. Women with an educational attainment of high school diploma earn the most with the average annual earnings of $10,132, while those with high school diploma education have the smallest earnings of $10,132.
| Educational Attainment | Male Income | Female Income |
| Less than High School | $16,573 | $0 |
| High School Diploma | - | - |
| College or Associate's Degree | - | - |
| Bachelor's Degree | - | - |
| Graduate Degree | - | - |
| Total | $20,432 | $22,965 |
Family Income in Medina
Family Income Brackets in Medina
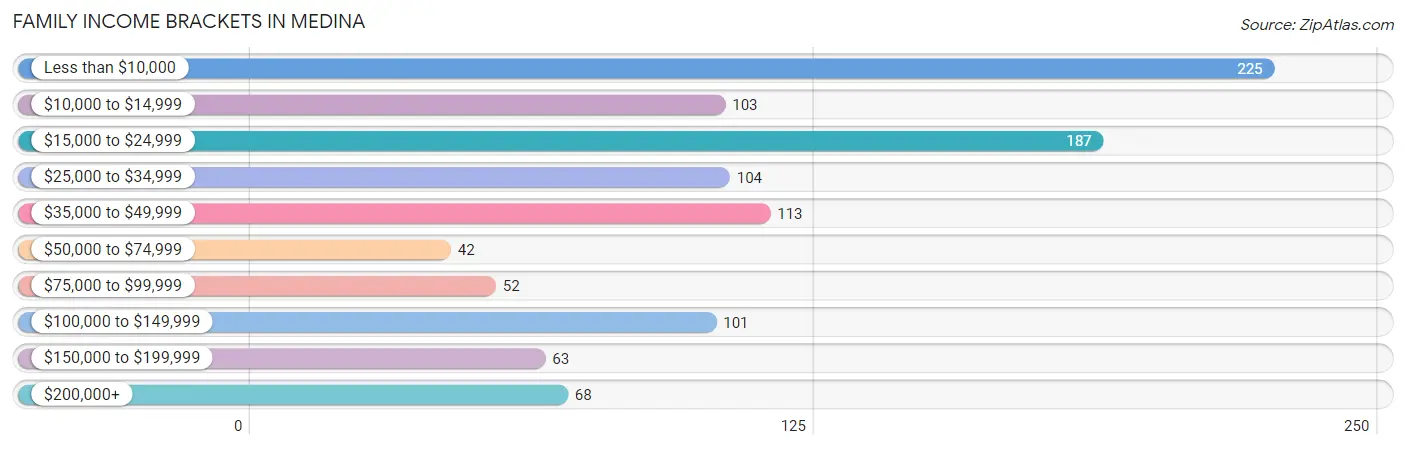
According to the Medina family income data, there are 225 families falling into the less than $10,000 income range, which is the most common income bracket and makes up 21.3% of all families. Conversely, the $50,000 to $74,999 income bracket is the least frequent group with only 42 families (4.0%) belonging to this category.
| Income Bracket | # Families | % Families |
| Less than $10,000 | 225 | 21.3% |
| $10,000 to $14,999 | 103 | 9.7% |
| $15,000 to $24,999 | 187 | 17.7% |
| $25,000 to $34,999 | 104 | 9.8% |
| $35,000 to $49,999 | 113 | 10.7% |
| $50,000 to $74,999 | 42 | 4.0% |
| $75,000 to $99,999 | 52 | 4.9% |
| $100,000 to $149,999 | 101 | 9.5% |
| $150,000 to $199,999 | 63 | 6.0% |
| $200,000+ | 68 | 6.4% |
Family Income by Famaliy Size in Medina
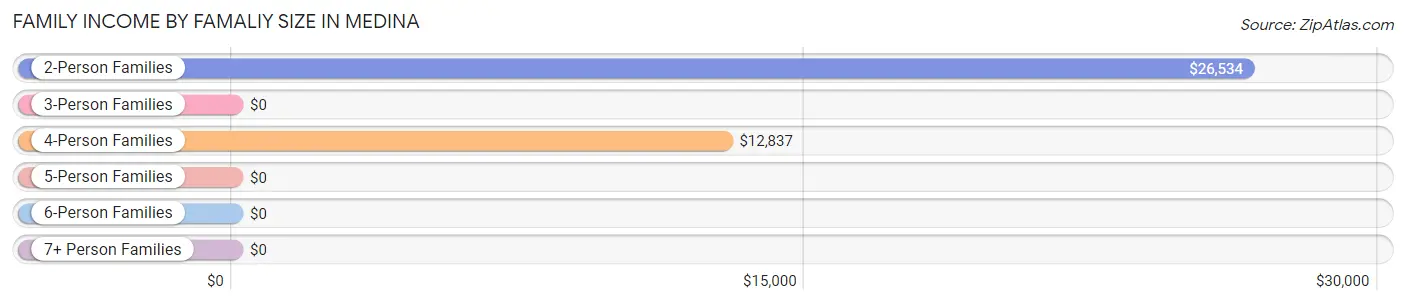
2-person families (325 | 30.7%) account for the highest median family income in Medina with $26,534 per family, while 2-person families (325 | 30.7%) have the highest median income of $13,267 per family member.
| Income Bracket | # Families | Median Income |
| 2-Person Families | 325 (30.7%) | $26,534 |
| 3-Person Families | 241 (22.8%) | $0 |
| 4-Person Families | 163 (15.4%) | $12,837 |
| 5-Person Families | 146 (13.8%) | $0 |
| 6-Person Families | 134 (12.7%) | $0 |
| 7+ Person Families | 49 (4.6%) | $0 |
| Total | 1,058 (100.0%) | $26,591 |
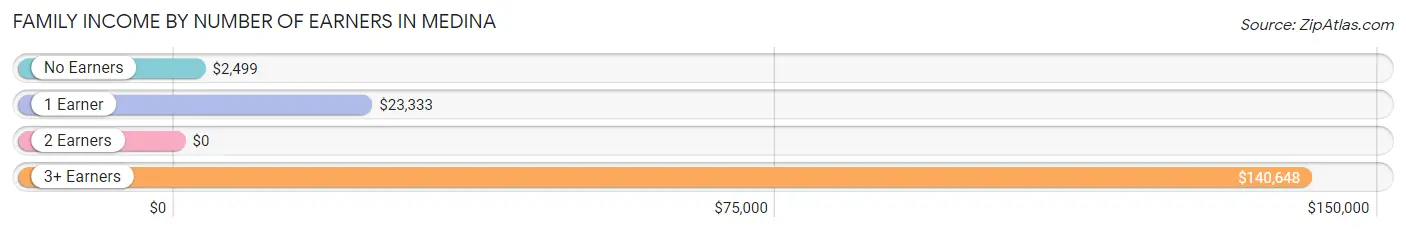
Family Income by Number of Earners in Medina
| Number of Earners | # Families | Median Income |
| No Earners | 92 (8.7%) | $2,499 |
| 1 Earner | 662 (62.6%) | $23,333 |
| 2 Earners | 198 (18.7%) | $0 |
| 3+ Earners | 106 (10.0%) | $140,648 |
| Total | 1,058 (100.0%) | $26,591 |
Household Income in Medina
Household Income Brackets in Medina
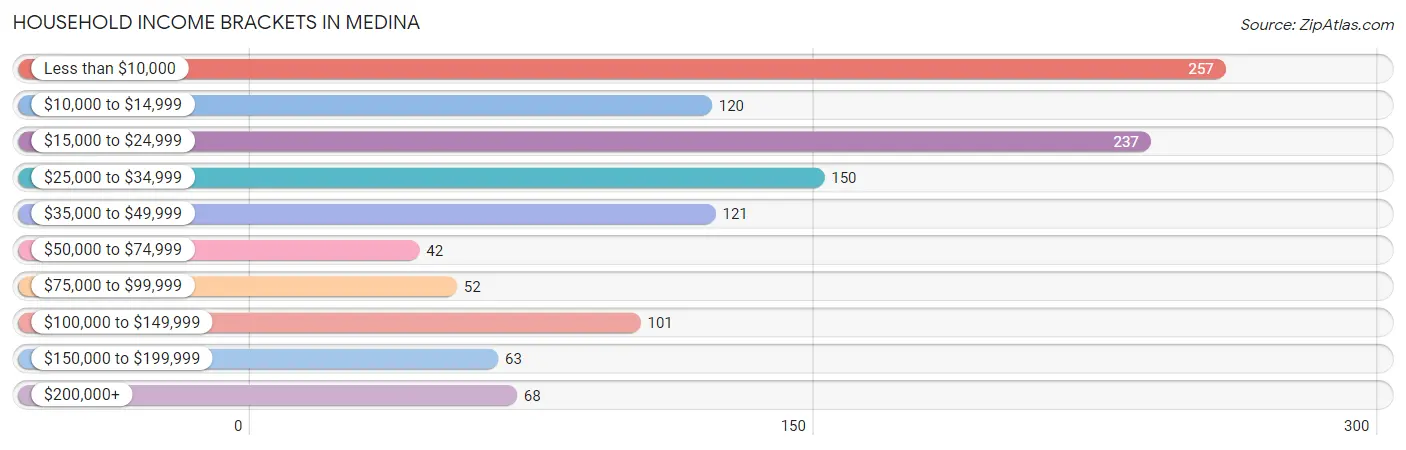
With 257 households falling in the category, the less than $10,000 income range is the most frequent in Medina, accounting for 21.2% of all households. In contrast, only 42 households (3.5%) fall into the $50,000 to $74,999 income bracket, making it the least populous group.
| Income Bracket | # Households | % Households |
| Less than $10,000 | 257 | 21.2% |
| $10,000 to $14,999 | 120 | 9.9% |
| $15,000 to $24,999 | 237 | 19.6% |
| $25,000 to $34,999 | 150 | 12.4% |
| $35,000 to $49,999 | 121 | 10.0% |
| $50,000 to $74,999 | 42 | 3.5% |
| $75,000 to $99,999 | 52 | 4.3% |
| $100,000 to $149,999 | 101 | 8.3% |
| $150,000 to $199,999 | 63 | 5.2% |
| $200,000+ | 68 | 5.6% |
Household Income by Householder Age in Medina
The median household income in Medina is $24,566, with the highest median household income of $36,318 found in the 25 to 44 years age bracket for the primary householder. A total of 503 households (41.5%) fall into this category. Meanwhile, the 15 to 24 years age bracket for the primary householder has the lowest median household income of $0, with 238 households (19.7%) in this group.
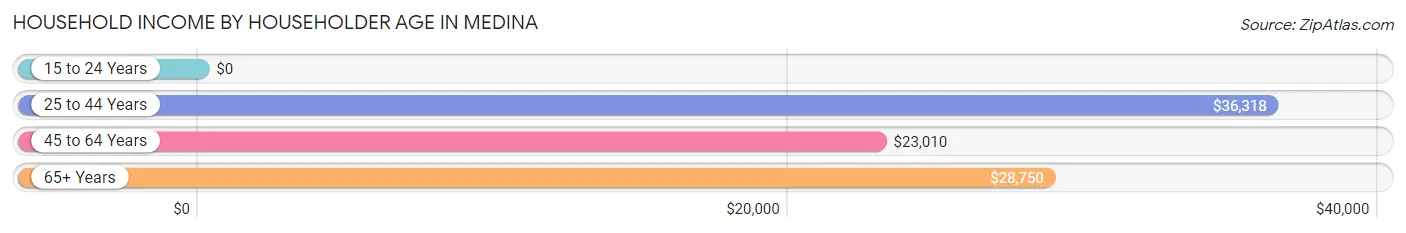
| Income Bracket | # Households | Median Income |
| 15 to 24 Years | 238 (19.7%) | $0 |
| 25 to 44 Years | 503 (41.5%) | $36,318 |
| 45 to 64 Years | 316 (26.1%) | $23,010 |
| 65+ Years | 154 (12.7%) | $28,750 |
| Total | 1,211 (100.0%) | $24,566 |
Poverty in Medina
Income Below Poverty by Sex and Age in Medina
With 48.9% poverty level for males and 59.0% for females among the residents of Medina, under 5 year old males and 25 to 34 year old females are the most vulnerable to poverty, with 62 males (100.0%) and 215 females (86.4%) in their respective age groups living below the poverty level.
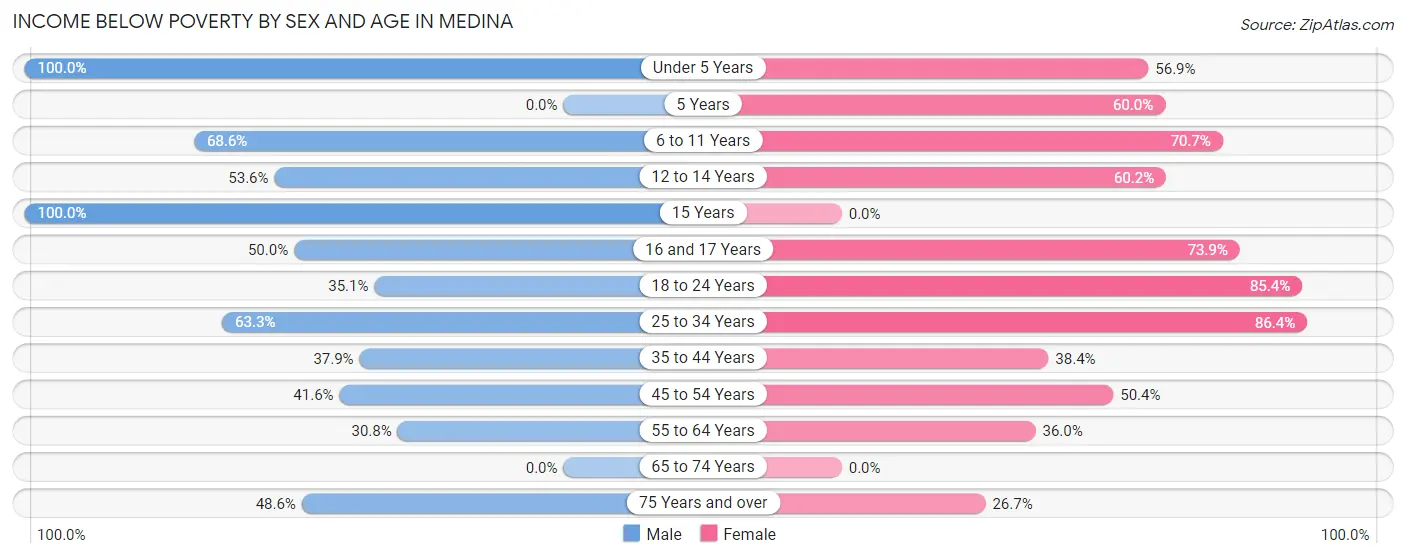
| Age Bracket | Male | Female |
| Under 5 Years | 62 (100.0%) | 165 (56.9%) |
| 5 Years | 0 (0.0%) | 18 (60.0%) |
| 6 to 11 Years | 242 (68.6%) | 205 (70.7%) |
| 12 to 14 Years | 118 (53.6%) | 68 (60.2%) |
| 15 Years | 23 (100.0%) | 0 (0.0%) |
| 16 and 17 Years | 23 (50.0%) | 113 (73.9%) |
| 18 to 24 Years | 73 (35.1%) | 316 (85.4%) |
| 25 to 34 Years | 183 (63.3%) | 215 (86.4%) |
| 35 to 44 Years | 120 (37.9%) | 135 (38.4%) |
| 45 to 54 Years | 69 (41.6%) | 130 (50.4%) |
| 55 to 64 Years | 20 (30.8%) | 64 (36.0%) |
| 65 to 74 Years | 0 (0.0%) | 0 (0.0%) |
| 75 Years and over | 17 (48.6%) | 20 (26.7%) |
| Total | 950 (48.9%) | 1,449 (59.0%) |
Income Above Poverty by Sex and Age in Medina
According to the poverty statistics in Medina, males aged 5 years and females aged 15 years are the age groups that are most secure financially, with 100.0% of males and 100.0% of females in these age groups living above the poverty line.
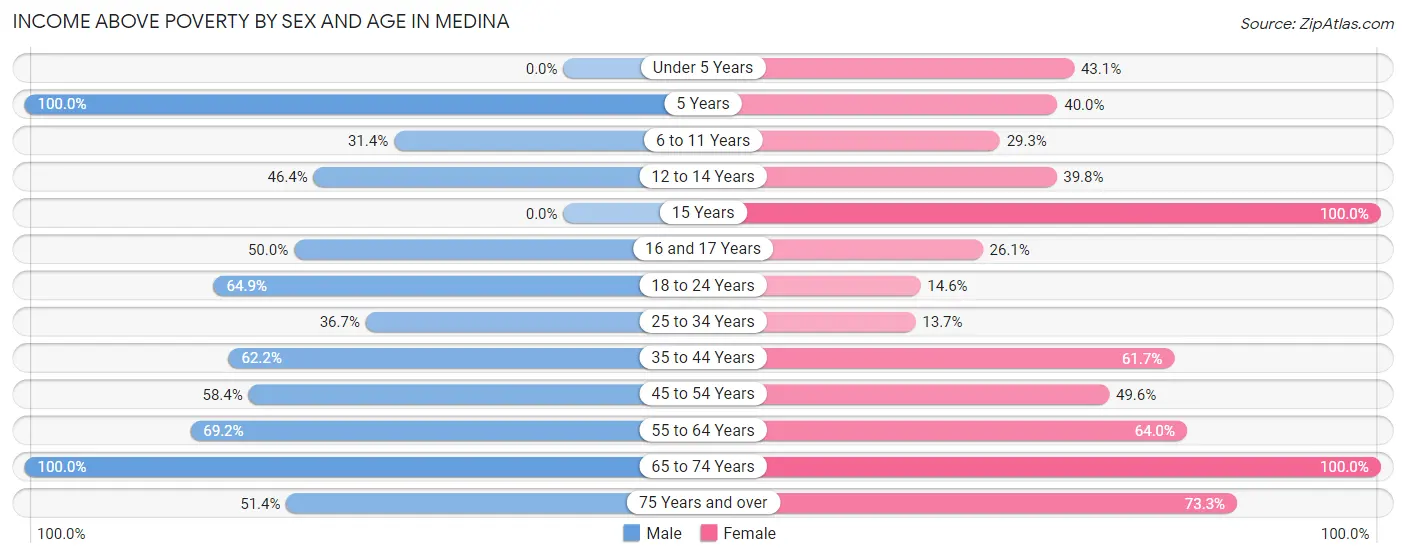
| Age Bracket | Male | Female |
| Under 5 Years | 0 (0.0%) | 125 (43.1%) |
| 5 Years | 55 (100.0%) | 12 (40.0%) |
| 6 to 11 Years | 111 (31.4%) | 85 (29.3%) |
| 12 to 14 Years | 102 (46.4%) | 45 (39.8%) |
| 15 Years | 0 (0.0%) | 26 (100.0%) |
| 16 and 17 Years | 23 (50.0%) | 40 (26.1%) |
| 18 to 24 Years | 135 (64.9%) | 54 (14.6%) |
| 25 to 34 Years | 106 (36.7%) | 34 (13.7%) |
| 35 to 44 Years | 197 (62.2%) | 217 (61.7%) |
| 45 to 54 Years | 97 (58.4%) | 128 (49.6%) |
| 55 to 64 Years | 45 (69.2%) | 114 (64.0%) |
| 65 to 74 Years | 103 (100.0%) | 73 (100.0%) |
| 75 Years and over | 18 (51.4%) | 55 (73.3%) |
| Total | 992 (51.1%) | 1,008 (41.0%) |
Income Below Poverty Among Married-Couple Families in Medina
The poverty statistics for married-couple families in Medina show that 38.4% or 175 of the total 456 families live below the poverty line. Families with 1 or 2 children have the highest poverty rate of 76.5%, comprising of 101 families. On the other hand, families with no children have the lowest poverty rate of 9.9%, which includes 15 families.
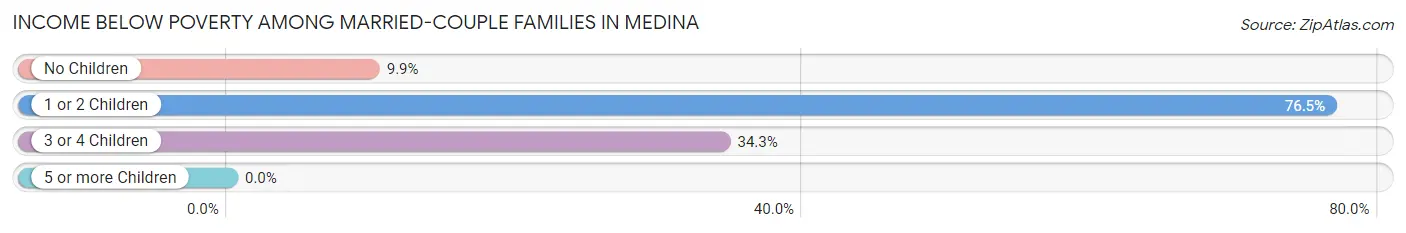
| Children | Above Poverty | Below Poverty |
| No Children | 137 (90.1%) | 15 (9.9%) |
| 1 or 2 Children | 31 (23.5%) | 101 (76.5%) |
| 3 or 4 Children | 113 (65.7%) | 59 (34.3%) |
| 5 or more Children | 0 (0.0%) | 0 (0.0%) |
| Total | 281 (61.6%) | 175 (38.4%) |
Income Below Poverty Among Single-Parent Households in Medina
According to the poverty data in Medina, 36.8% or 53 single-father households and 66.6% or 305 single-mother households are living below the poverty line. Among single-father households, those with 3 or 4 children have the highest poverty rate, with 25 households (100.0%) experiencing poverty. Likewise, among single-mother households, those with 5 or more children have the highest poverty rate, with 62 households (100.0%) falling below the poverty line.
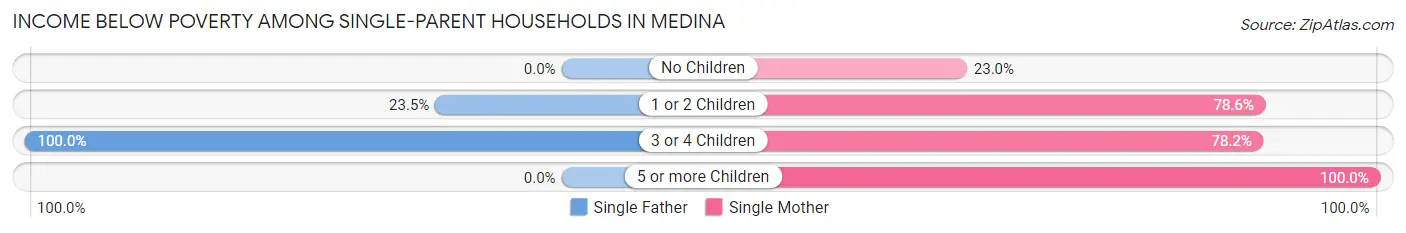
| Children | Single Father | Single Mother |
| No Children | 0 (0.0%) | 28 (23.0%) |
| 1 or 2 Children | 28 (23.5%) | 136 (78.6%) |
| 3 or 4 Children | 25 (100.0%) | 79 (78.2%) |
| 5 or more Children | 0 (0.0%) | 62 (100.0%) |
| Total | 53 (36.8%) | 305 (66.6%) |
Income Below Poverty Among Married-Couple vs Single-Parent Households in Medina
The poverty data for Medina shows that 175 of the married-couple family households (38.4%) and 358 of the single-parent households (59.5%) are living below the poverty level. Within the married-couple family households, those with 1 or 2 children have the highest poverty rate, with 101 households (76.5%) falling below the poverty line. Among the single-parent households, those with 5 or more children have the highest poverty rate, with 62 household (100.0%) living below poverty.
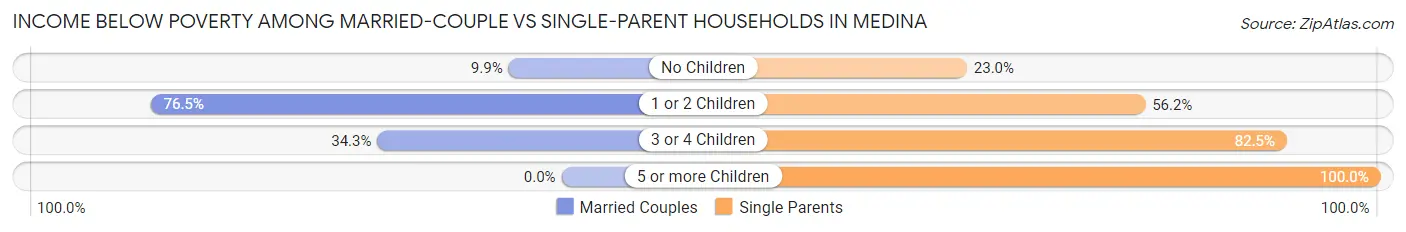
| Children | Married-Couple Families | Single-Parent Households |
| No Children | 15 (9.9%) | 28 (23.0%) |
| 1 or 2 Children | 101 (76.5%) | 164 (56.2%) |
| 3 or 4 Children | 59 (34.3%) | 104 (82.5%) |
| 5 or more Children | 0 (0.0%) | 62 (100.0%) |
| Total | 175 (38.4%) | 358 (59.5%) |
Race in Medina
The most populous races in Medina are Hispanic or Latino (4,370 | 98.5%), White / Caucasian (1,965 | 44.3%), and Two or more Races (1,604 | 36.2%).
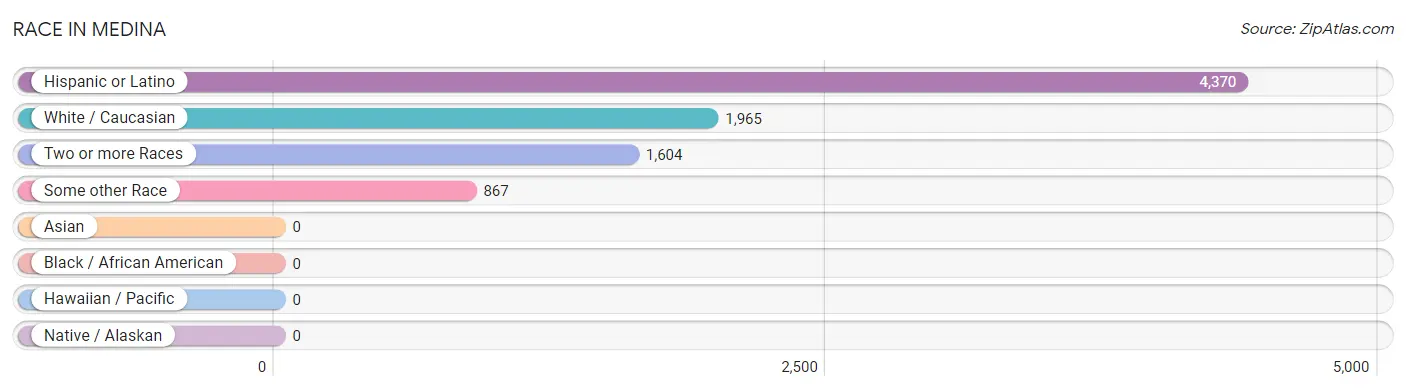
| Race | # Population | % Population |
| Asian | 0 | 0.0% |
| Black / African American | 0 | 0.0% |
| Hawaiian / Pacific | 0 | 0.0% |
| Hispanic or Latino | 4,370 | 98.5% |
| Native / Alaskan | 0 | 0.0% |
| White / Caucasian | 1,965 | 44.3% |
| Two or more Races | 1,604 | 36.2% |
| Some other Race | 867 | 19.5% |
| Total | 4,436 | 100.0% |
Ancestry in Medina
The most populous ancestries reported in Medina are Mexican (4,076 | 91.9%), American (47 | 1.1%), Austrian (17 | 0.4%), Irish (17 | 0.4%), and Eastern European (14 | 0.3%), together accounting for 94.0% of all Medina residents.
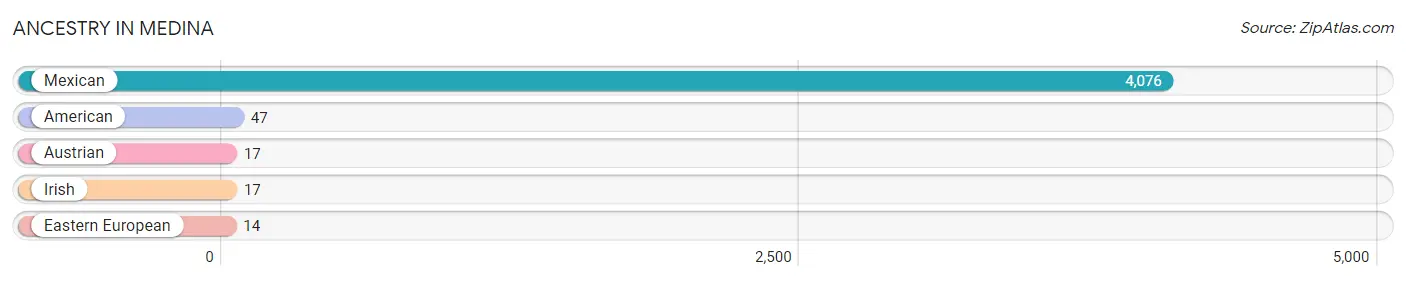
| Ancestry | # Population | % Population |
| American | 47 | 1.1% |
| Austrian | 17 | 0.4% |
| Eastern European | 14 | 0.3% |
| Irish | 17 | 0.4% |
| Mexican | 4,076 | 91.9% | View All 5 Rows |
Immigrants in Medina
The most numerous immigrant groups reported in Medina came from Central America (1,265 | 28.5%), Latin America (1,265 | 28.5%), and Mexico (1,265 | 28.5%), together accounting for 85.6% of all Medina residents.
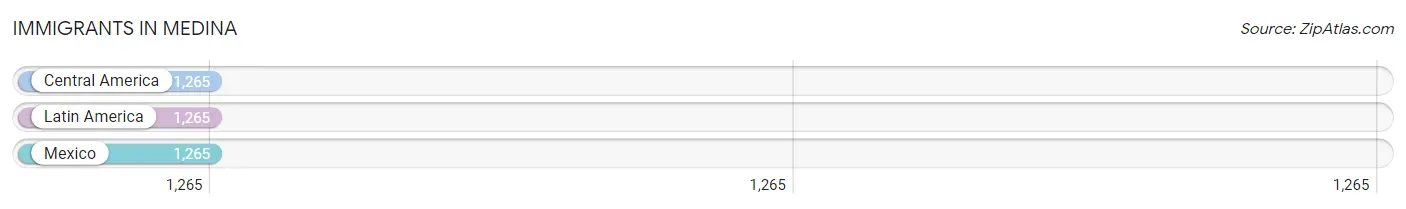
| Immigration Origin | # Population | % Population |
| Central America | 1,265 | 28.5% |
| Latin America | 1,265 | 28.5% |
| Mexico | 1,265 | 28.5% | View All 3 Rows |
Sex and Age in Medina
Sex and Age in Medina
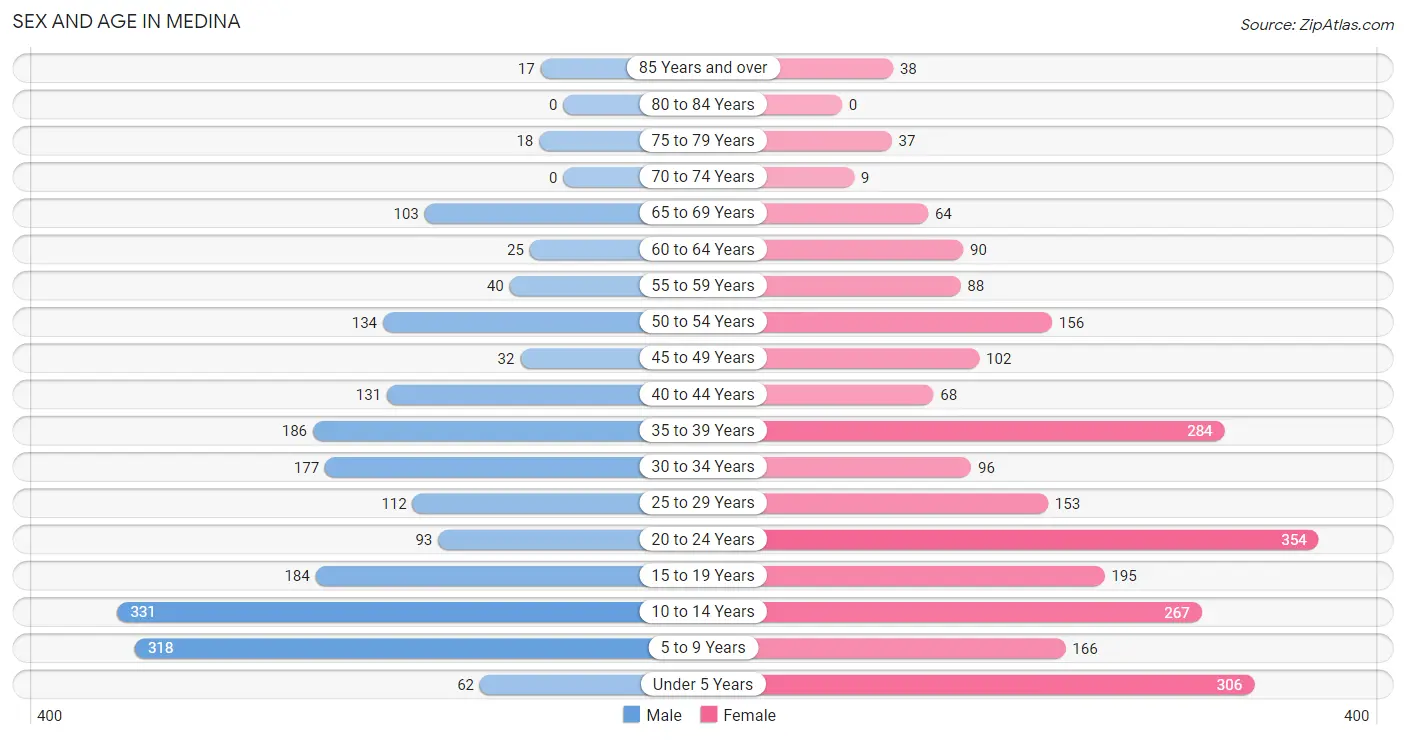
The most populous age groups in Medina are 10 to 14 Years (331 | 16.9%) for men and 20 to 24 Years (354 | 14.3%) for women.
| Age Bracket | Male | Female |
| Under 5 Years | 62 (3.2%) | 306 (12.4%) |
| 5 to 9 Years | 318 (16.2%) | 166 (6.7%) |
| 10 to 14 Years | 331 (16.9%) | 267 (10.8%) |
| 15 to 19 Years | 184 (9.4%) | 195 (7.9%) |
| 20 to 24 Years | 93 (4.7%) | 354 (14.3%) |
| 25 to 29 Years | 112 (5.7%) | 153 (6.2%) |
| 30 to 34 Years | 177 (9.0%) | 96 (3.9%) |
| 35 to 39 Years | 186 (9.5%) | 284 (11.5%) |
| 40 to 44 Years | 131 (6.7%) | 68 (2.8%) |
| 45 to 49 Years | 32 (1.6%) | 102 (4.1%) |
| 50 to 54 Years | 134 (6.8%) | 156 (6.3%) |
| 55 to 59 Years | 40 (2.0%) | 88 (3.6%) |
| 60 to 64 Years | 25 (1.3%) | 90 (3.6%) |
| 65 to 69 Years | 103 (5.2%) | 64 (2.6%) |
| 70 to 74 Years | 0 (0.0%) | 9 (0.4%) |
| 75 to 79 Years | 18 (0.9%) | 37 (1.5%) |
| 80 to 84 Years | 0 (0.0%) | 0 (0.0%) |
| 85 Years and over | 17 (0.9%) | 38 (1.5%) |
| Total | 1,963 (100.0%) | 2,473 (100.0%) |
Families and Households in Medina
Median Family Size in Medina
The median family size in Medina is 3.74 persons per family, with married-couple families (456 | 43.1%) accounting for the largest median family size of 4.38 persons per family. On the other hand, single male/father families (144 | 13.6%) represent the smallest median family size with 2.74 persons per family.
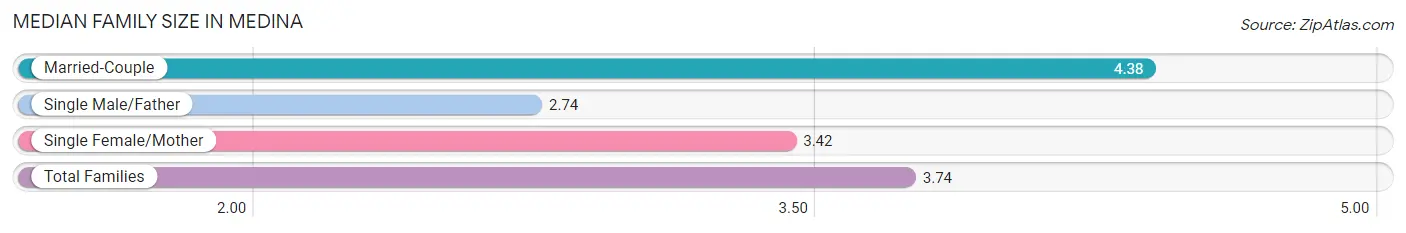
| Family Type | # Families | Family Size |
| Married-Couple | 456 (43.1%) | 4.38 |
| Single Male/Father | 144 (13.6%) | 2.74 |
| Single Female/Mother | 458 (43.3%) | 3.42 |
| Total Families | 1,058 (100.0%) | 3.74 |
Median Household Size in Medina
The median household size in Medina is 3.66 persons per household, with married-couple households (456 | 37.7%) accounting for the largest median household size of 4.51 persons per household. non-family households (153 | 12.6%) represent the smallest median household size with 1.07 persons per household.
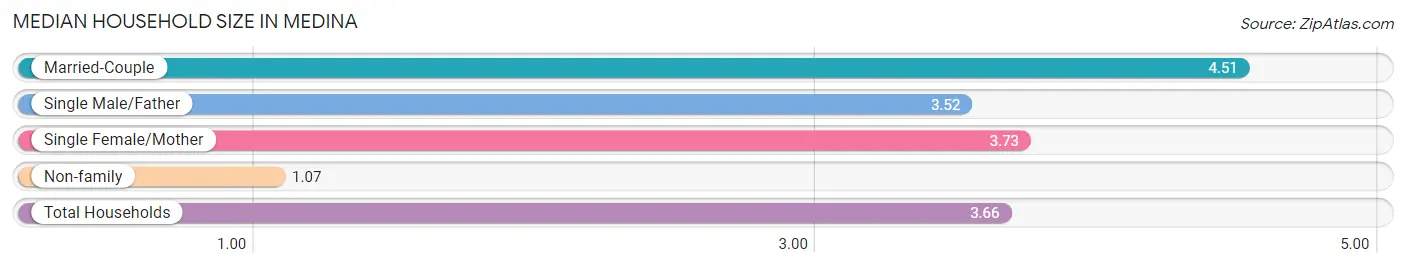
| Household Type | # Households | Household Size |
| Married-Couple | 456 (37.7%) | 4.51 |
| Single Male/Father | 144 (11.9%) | 3.52 |
| Single Female/Mother | 458 (37.8%) | 3.73 |
| Non-family | 153 (12.6%) | 1.07 |
| Total Households | 1,211 (100.0%) | 3.66 |
Household Size by Marriage Status in Medina
Out of a total of 1,211 households in Medina, 1,058 (87.4%) are family households, while 153 (12.6%) are nonfamily households. The most numerous type of family households are 3-person households, comprising 302, and the most common type of nonfamily households are 1-person households, comprising 141.
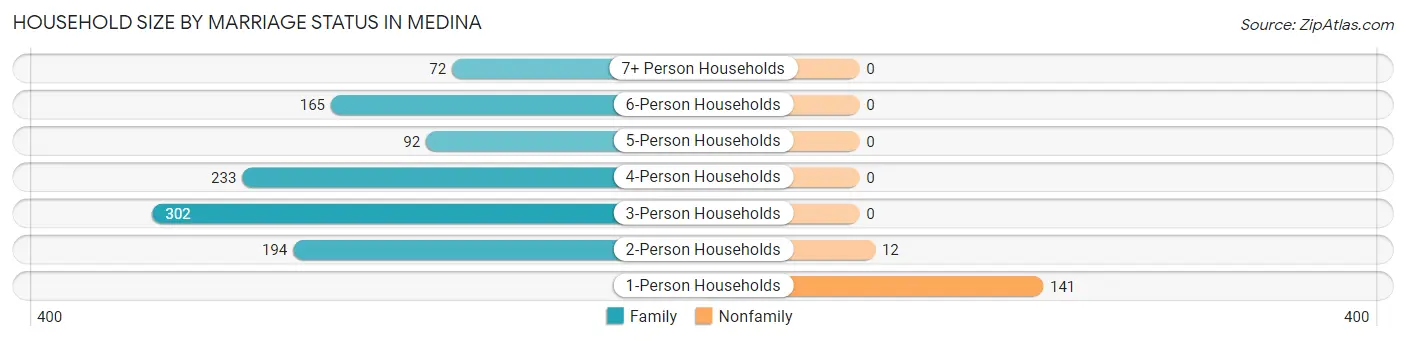
| Household Size | Family Households | Nonfamily Households |
| 1-Person Households | - | 141 (11.6%) |
| 2-Person Households | 194 (16.0%) | 12 (1.0%) |
| 3-Person Households | 302 (24.9%) | 0 (0.0%) |
| 4-Person Households | 233 (19.2%) | 0 (0.0%) |
| 5-Person Households | 92 (7.6%) | 0 (0.0%) |
| 6-Person Households | 165 (13.6%) | 0 (0.0%) |
| 7+ Person Households | 72 (5.9%) | 0 (0.0%) |
| Total | 1,058 (87.4%) | 153 (12.6%) |
Female Fertility in Medina
Fertility by Age in Medina
Average fertility rate in Medina is 115.0 births per 1,000 women. Women in the age bracket of 20 to 34 years have the highest fertility rate with 250.0 births per 1,000 women. Women in the age bracket of 20 to 34 years acount for 100.0% of all women with births.
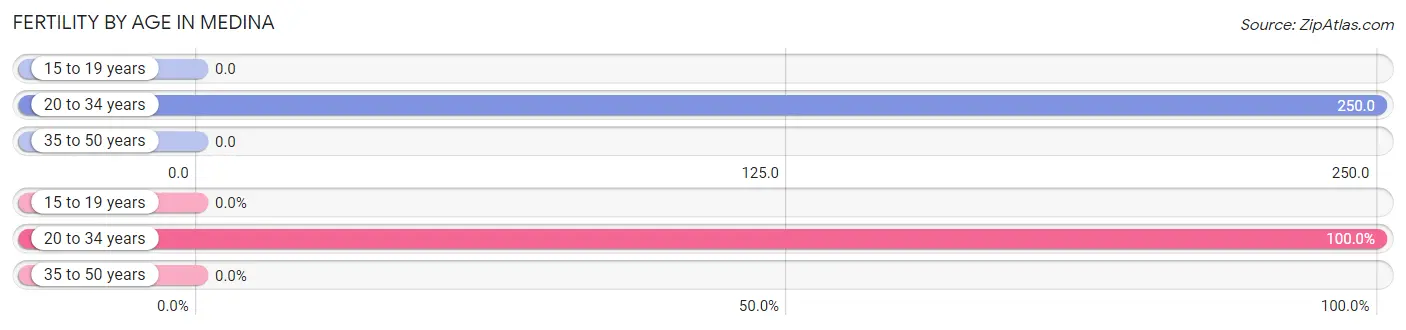
| Age Bracket | Women with Births | Births / 1,000 Women |
| 15 to 19 years | 0 (0.0%) | 0.0 |
| 20 to 34 years | 151 (100.0%) | 250.0 |
| 35 to 50 years | 0 (0.0%) | 0.0 |
| Total | 151 (100.0%) | 115.0 |
Fertility by Age by Marriage Status in Medina
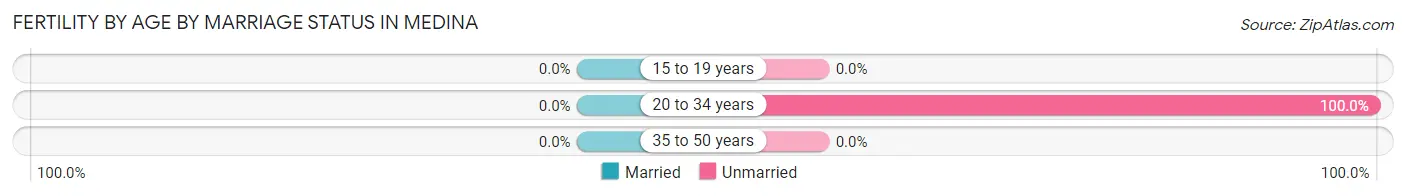
| Age Bracket | Married | Unmarried |
| 15 to 19 years | 0 (0.0%) | 0 (0.0%) |
| 20 to 34 years | 0 (0.0%) | 151 (100.0%) |
| 35 to 50 years | 0 (0.0%) | 0 (0.0%) |
| Total | 0 (0.0%) | 151 (100.0%) |
Fertility by Education in Medina
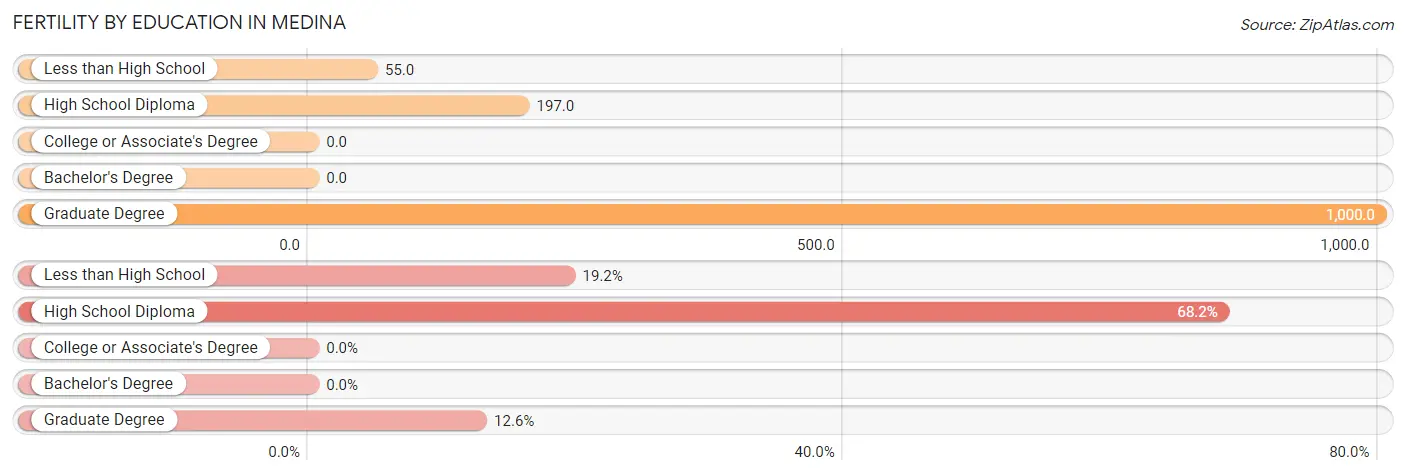
| Educational Attainment | Women with Births | Births / 1,000 Women |
| Less than High School | 29 (19.2%) | 55.0 |
| High School Diploma | 103 (68.2%) | 197.0 |
| College or Associate's Degree | 0 (0.0%) | 0.0 |
| Bachelor's Degree | 0 (0.0%) | 0.0 |
| Graduate Degree | 19 (12.6%) | 1,000.0 |
| Total | 151 (100.0%) | 115.0 |
Fertility by Education by Marriage Status in Medina
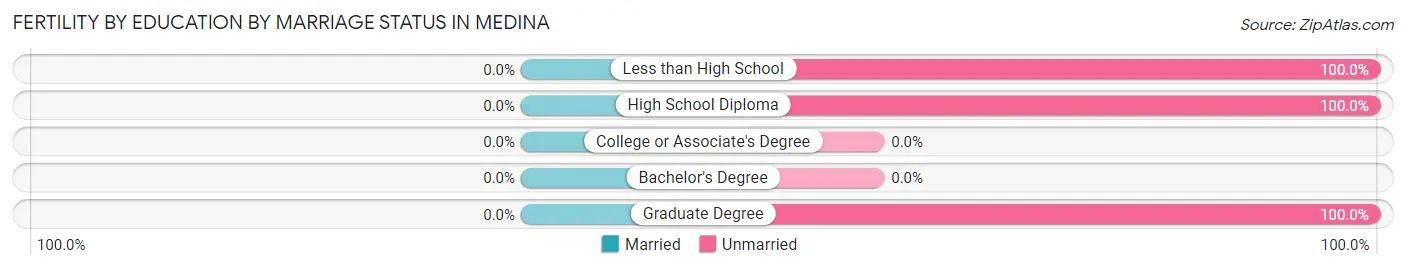
| Educational Attainment | Married | Unmarried |
| Less than High School | 0 (0.0%) | 29 (100.0%) |
| High School Diploma | 0 (0.0%) | 103 (100.0%) |
| College or Associate's Degree | 0 (0.0%) | 0 (0.0%) |
| Bachelor's Degree | 0 (0.0%) | 0 (0.0%) |
| Graduate Degree | 0 (0.0%) | 19 (100.0%) |
| Total | 0 (0.0%) | 151 (100.0%) |
Employment Characteristics in Medina
Employment by Class of Employer in Medina
Among the 1,356 employed individuals in Medina, private company employees (768 | 56.6%), self-employed (not incorporated) (205 | 15.1%), and local government employees (170 | 12.5%) make up the most common classes of employment.
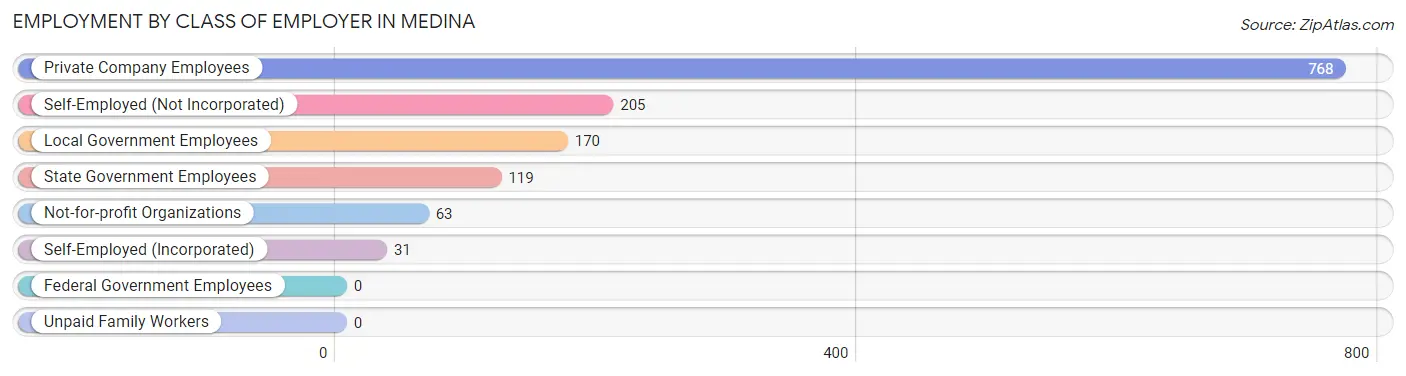
| Employer Class | # Employees | % Employees |
| Private Company Employees | 768 | 56.6% |
| Self-Employed (Incorporated) | 31 | 2.3% |
| Self-Employed (Not Incorporated) | 205 | 15.1% |
| Not-for-profit Organizations | 63 | 4.6% |
| Local Government Employees | 170 | 12.5% |
| State Government Employees | 119 | 8.8% |
| Federal Government Employees | 0 | 0.0% |
| Unpaid Family Workers | 0 | 0.0% |
| Total | 1,356 | 100.0% |
Employment Status by Age in Medina
According to the labor force statistics for Medina, out of the total population over 16 years of age (2,937), 57.1% or 1,677 individuals are in the labor force, with 14.7% or 247 of them unemployed. The age group with the highest labor force participation rate is 55 to 59 years, with 100.0% or 128 individuals in the labor force. Within the labor force, the 16 to 19 years age range has the highest percentage of unemployed individuals, with 59.3% or 48 of them being unemployed.
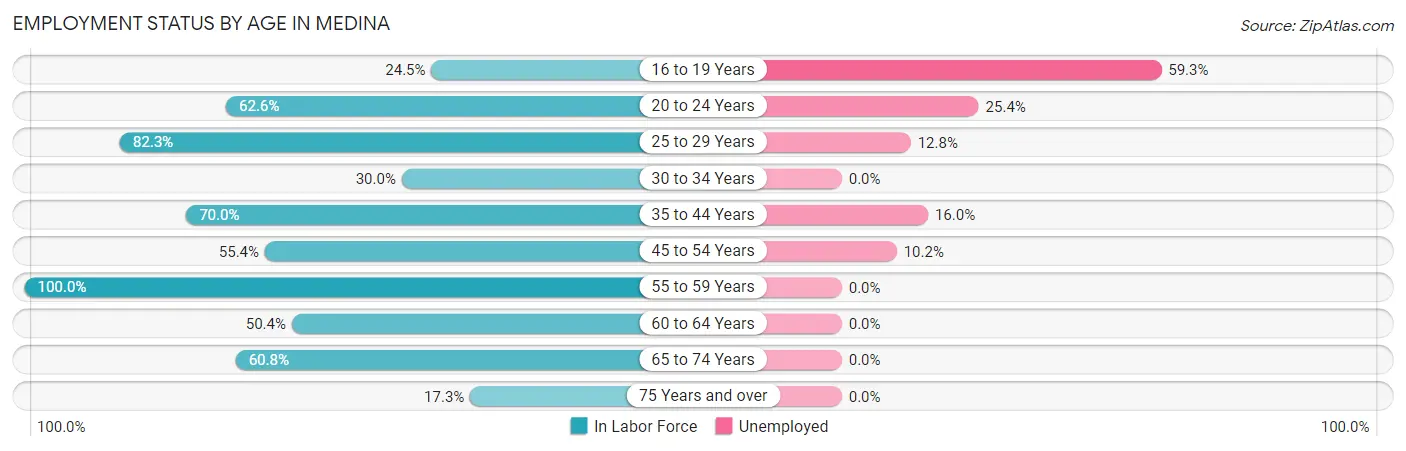
| Age Bracket | In Labor Force | Unemployed |
| 16 to 19 Years | 81 (24.5%) | 48 (59.3%) |
| 20 to 24 Years | 280 (62.6%) | 71 (25.4%) |
| 25 to 29 Years | 218 (82.3%) | 28 (12.8%) |
| 30 to 34 Years | 82 (30.0%) | 0 (0.0%) |
| 35 to 44 Years | 468 (70.0%) | 75 (16.0%) |
| 45 to 54 Years | 235 (55.4%) | 24 (10.2%) |
| 55 to 59 Years | 128 (100.0%) | 0 (0.0%) |
| 60 to 64 Years | 58 (50.4%) | 0 (0.0%) |
| 65 to 74 Years | 107 (60.8%) | 0 (0.0%) |
| 75 Years and over | 19 (17.3%) | 0 (0.0%) |
| Total | 1,677 (57.1%) | 247 (14.7%) |
Employment Status by Educational Attainment in Medina
According to labor force statistics for Medina, 63.4% of individuals (1,188) out of the total population between 25 and 64 years of age (1,874) are in the labor force, with 10.7% or 127 of them being unemployed. The group with the highest labor force participation rate are those with the educational attainment of college / associate degree, with 100.0% or 256 individuals in the labor force. Within the labor force, individuals with high school diploma education have the highest percentage of unemployment, with 21.3% or 66 of them being unemployed.
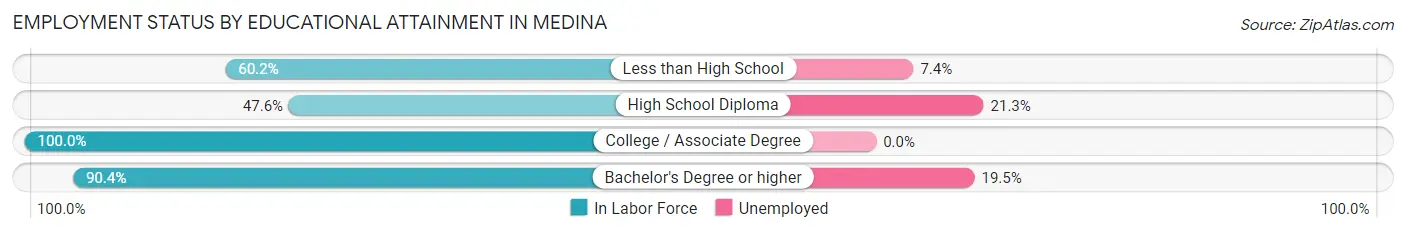
| Educational Attainment | In Labor Force | Unemployed |
| Less than High School | 500 (60.2%) | 61 (7.4%) |
| High School Diploma | 310 (47.6%) | 139 (21.3%) |
| College / Associate Degree | 256 (100.0%) | 0 (0.0%) |
| Bachelor's Degree or higher | 123 (90.4%) | 27 (19.5%) |
| Total | 1,188 (63.4%) | 201 (10.7%) |
Employment Occupations by Sex in Medina
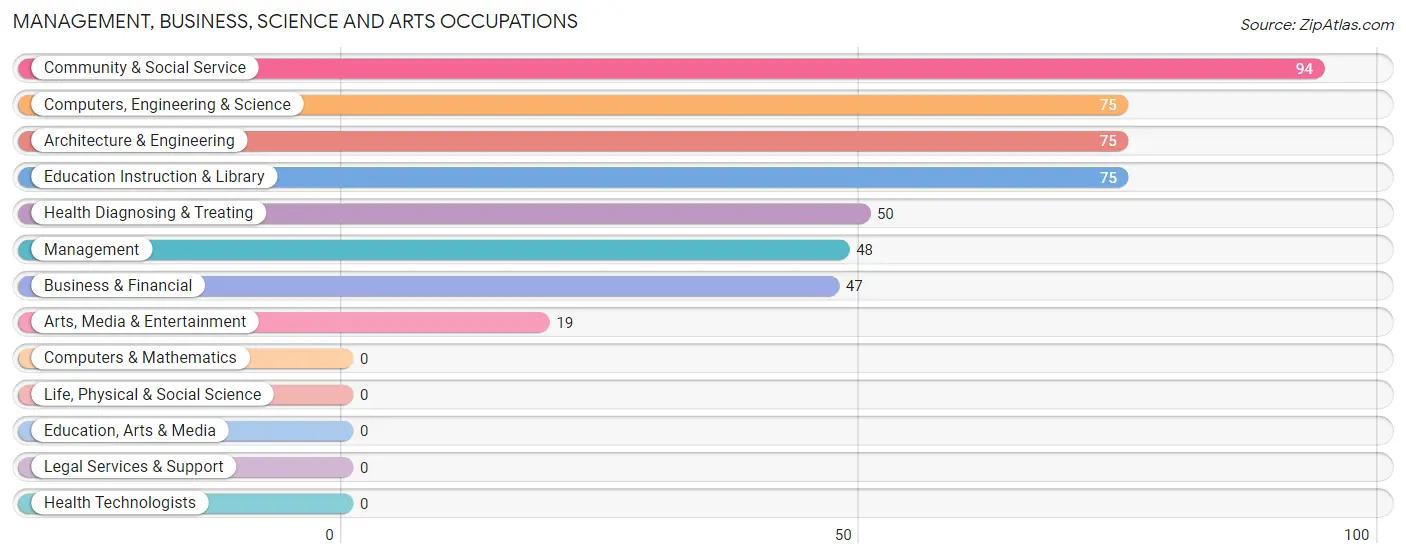
Management, Business, Science and Arts Occupations
The most common Management, Business, Science and Arts occupations in Medina are Community & Social Service (94 | 6.6%), Computers, Engineering & Science (75 | 5.2%), Architecture & Engineering (75 | 5.2%), Education Instruction & Library (75 | 5.2%), and Health Diagnosing & Treating (50 | 3.5%).
Management, Business, Science and Arts Occupations by Sex
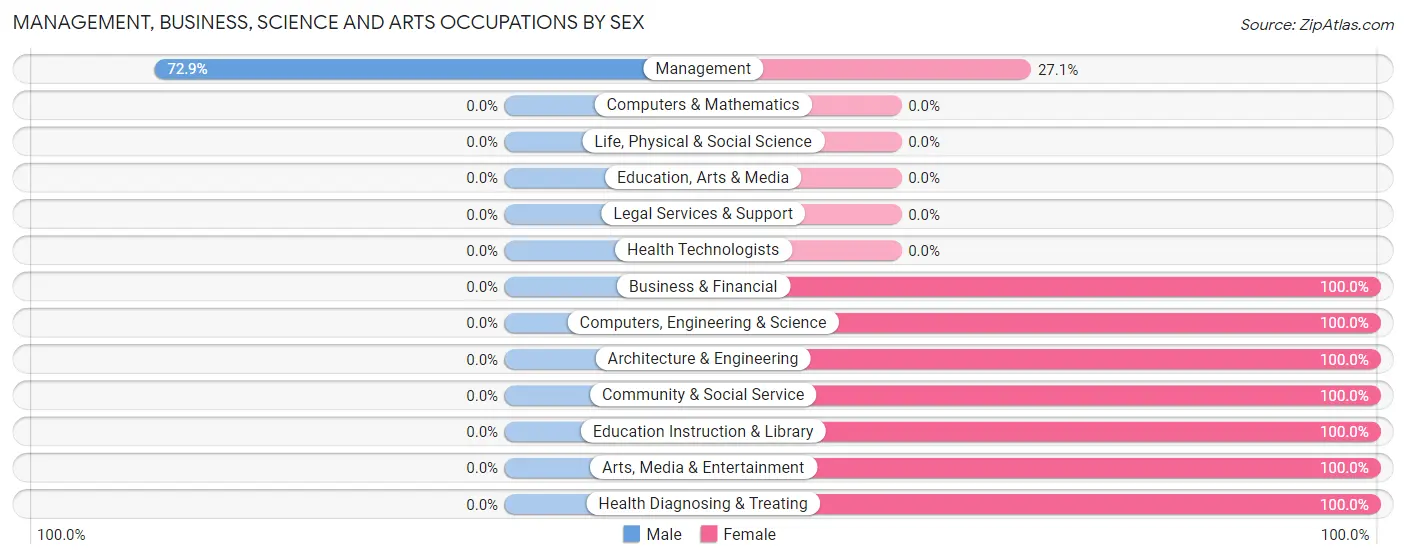
| Occupation | Male | Female |
| Management | 35 (72.9%) | 13 (27.1%) |
| Business & Financial | 0 (0.0%) | 47 (100.0%) |
| Computers, Engineering & Science | 0 (0.0%) | 75 (100.0%) |
| Computers & Mathematics | 0 (0.0%) | 0 (0.0%) |
| Architecture & Engineering | 0 (0.0%) | 75 (100.0%) |
| Life, Physical & Social Science | 0 (0.0%) | 0 (0.0%) |
| Community & Social Service | 0 (0.0%) | 94 (100.0%) |
| Education, Arts & Media | 0 (0.0%) | 0 (0.0%) |
| Legal Services & Support | 0 (0.0%) | 0 (0.0%) |
| Education Instruction & Library | 0 (0.0%) | 75 (100.0%) |
| Arts, Media & Entertainment | 0 (0.0%) | 19 (100.0%) |
| Health Diagnosing & Treating | 0 (0.0%) | 50 (100.0%) |
| Health Technologists | 0 (0.0%) | 0 (0.0%) |
| Total (Category) | 35 (11.2%) | 279 (88.8%) |
| Total (Overall) | 724 (50.6%) | 706 (49.4%) |
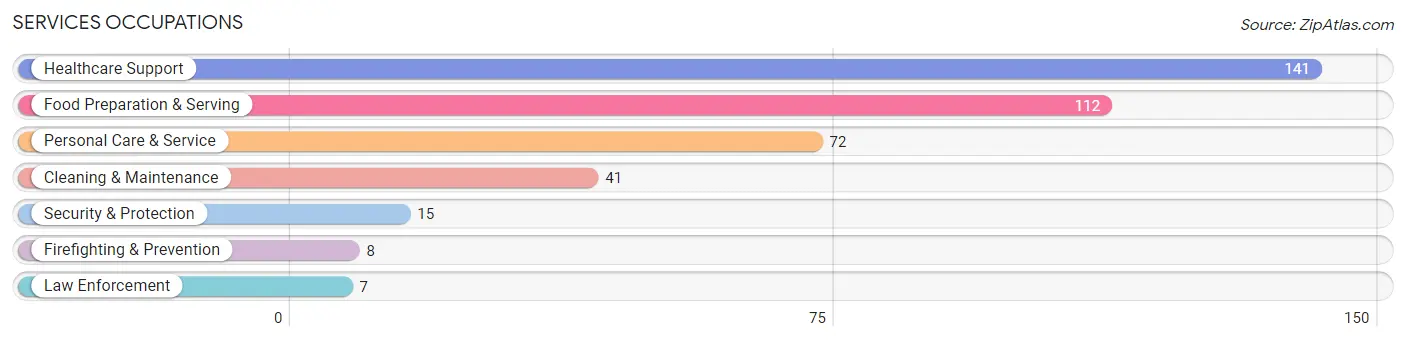
Services Occupations
The most common Services occupations in Medina are Healthcare Support (141 | 9.9%), Food Preparation & Serving (112 | 7.8%), Personal Care & Service (72 | 5.0%), Cleaning & Maintenance (41 | 2.9%), and Security & Protection (15 | 1.1%).
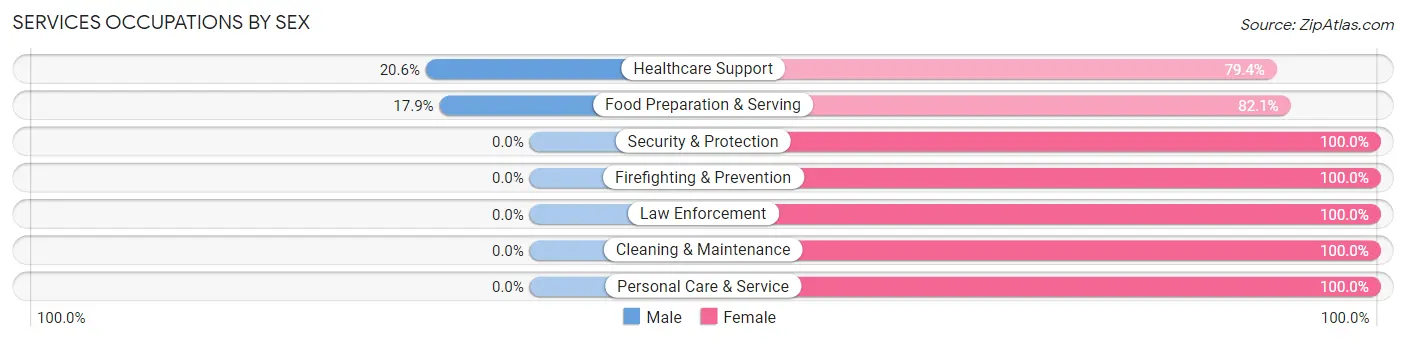
Services Occupations by Sex
Within the Services occupations in Medina, the most male-oriented occupations are Healthcare Support (20.6%), and Food Preparation & Serving (17.9%), while the most female-oriented occupations are Security & Protection (100.0%), Firefighting & Prevention (100.0%), and Law Enforcement (100.0%).
| Occupation | Male | Female |
| Healthcare Support | 29 (20.6%) | 112 (79.4%) |
| Security & Protection | 0 (0.0%) | 15 (100.0%) |
| Firefighting & Prevention | 0 (0.0%) | 8 (100.0%) |
| Law Enforcement | 0 (0.0%) | 7 (100.0%) |
| Food Preparation & Serving | 20 (17.9%) | 92 (82.1%) |
| Cleaning & Maintenance | 0 (0.0%) | 41 (100.0%) |
| Personal Care & Service | 0 (0.0%) | 72 (100.0%) |
| Total (Category) | 49 (12.9%) | 332 (87.1%) |
| Total (Overall) | 724 (50.6%) | 706 (49.4%) |
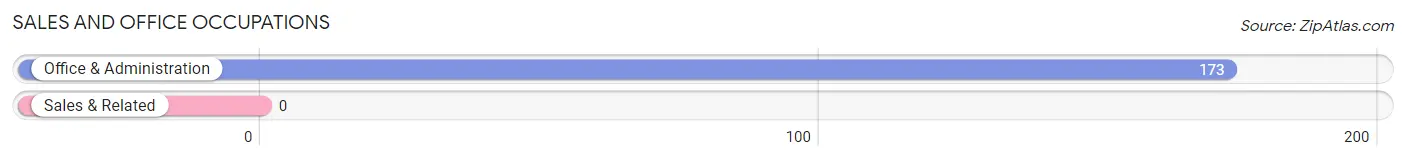
Sales and Office Occupations
The most common Sales and Office occupations in Medina are , and Office & Administration (173 | 12.1%).
Sales and Office Occupations by Sex
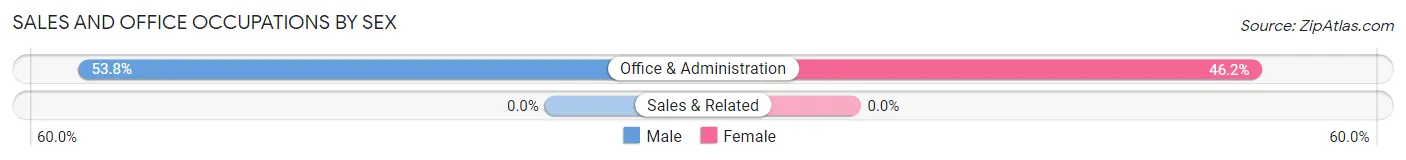
| Occupation | Male | Female |
| Sales & Related | 0 (0.0%) | 0 (0.0%) |
| Office & Administration | 93 (53.8%) | 80 (46.2%) |
| Total (Category) | 93 (53.8%) | 80 (46.2%) |
| Total (Overall) | 724 (50.6%) | 706 (49.4%) |
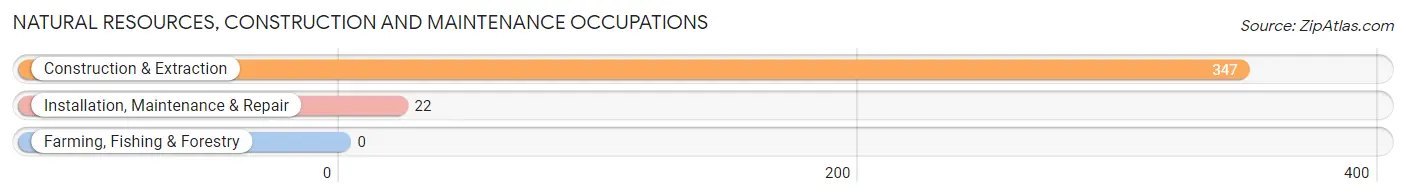
Natural Resources, Construction and Maintenance Occupations
The most common Natural Resources, Construction and Maintenance occupations in Medina are Construction & Extraction (347 | 24.3%), and Installation, Maintenance & Repair (22 | 1.5%).
Natural Resources, Construction and Maintenance Occupations by Sex
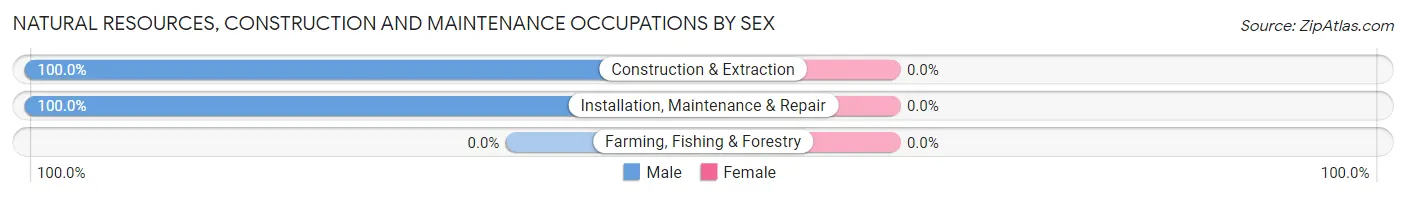
| Occupation | Male | Female |
| Farming, Fishing & Forestry | 0 (0.0%) | 0 (0.0%) |
| Construction & Extraction | 347 (100.0%) | 0 (0.0%) |
| Installation, Maintenance & Repair | 22 (100.0%) | 0 (0.0%) |
| Total (Category) | 369 (100.0%) | 0 (0.0%) |
| Total (Overall) | 724 (50.6%) | 706 (49.4%) |
Production, Transportation and Moving Occupations
The most common Production, Transportation and Moving occupations in Medina are Transportation (91 | 6.4%), Production (66 | 4.6%), and Material Moving (36 | 2.5%).
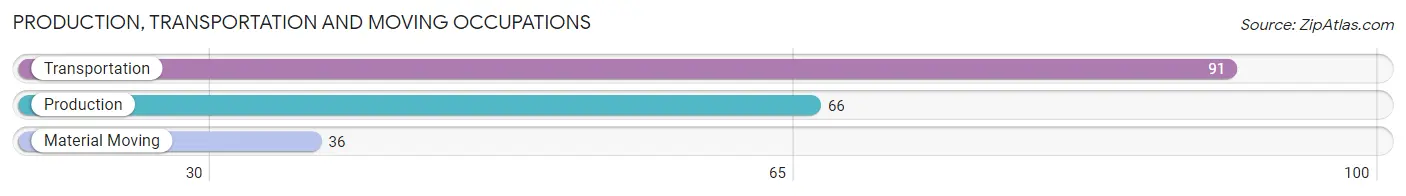
Production, Transportation and Moving Occupations by Sex
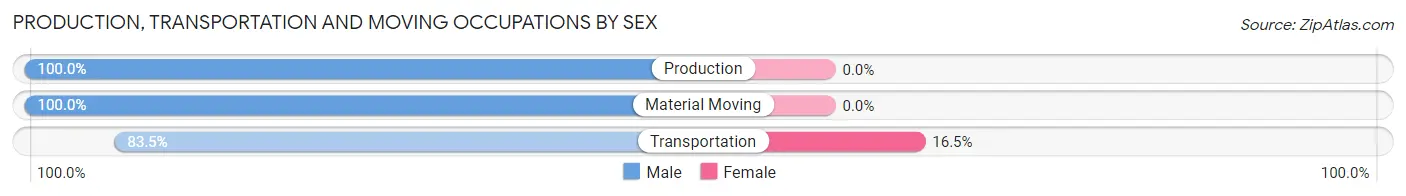
| Occupation | Male | Female |
| Production | 66 (100.0%) | 0 (0.0%) |
| Transportation | 76 (83.5%) | 15 (16.5%) |
| Material Moving | 36 (100.0%) | 0 (0.0%) |
| Total (Category) | 178 (92.2%) | 15 (7.8%) |
| Total (Overall) | 724 (50.6%) | 706 (49.4%) |
Employment Industries by Sex in Medina
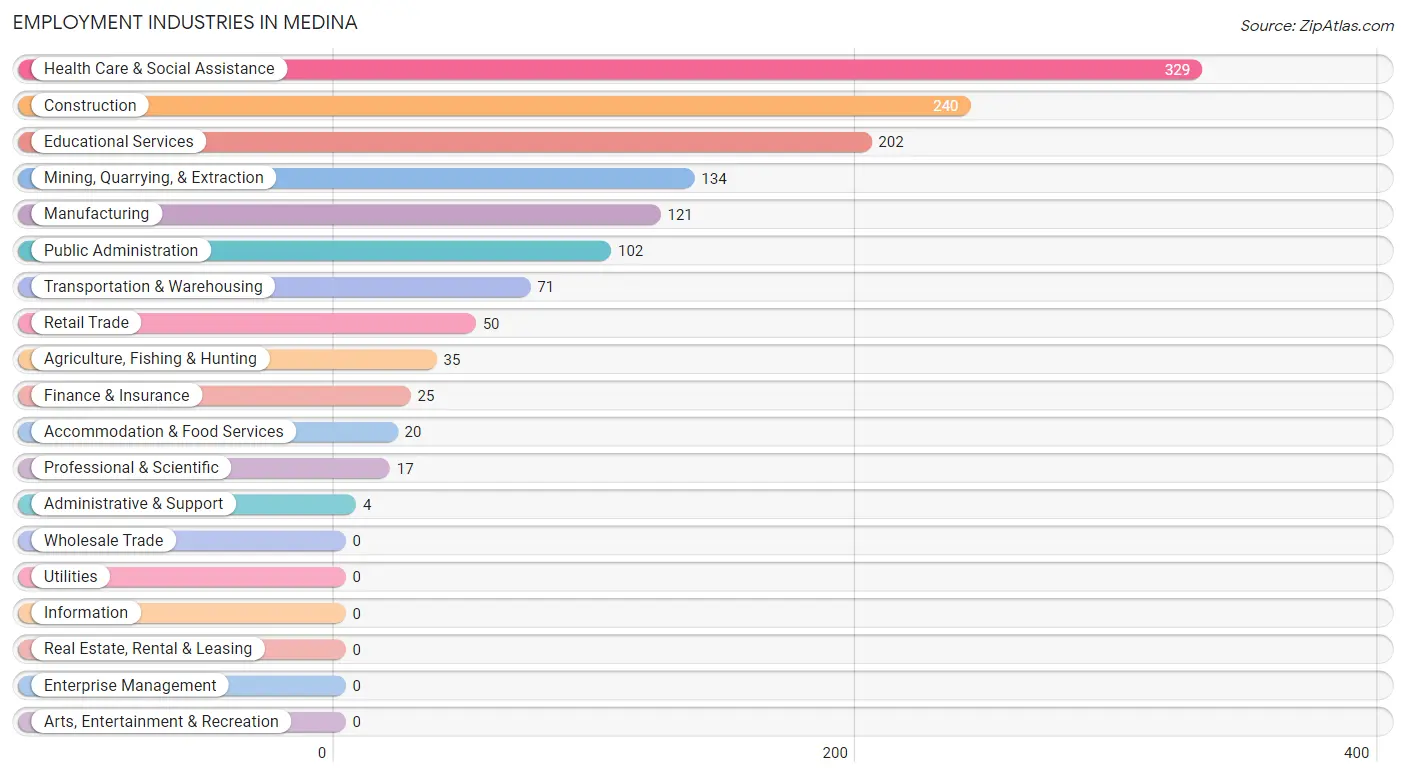
Employment Industries in Medina
The major employment industries in Medina include Health Care & Social Assistance (329 | 23.0%), Construction (240 | 16.8%), Educational Services (202 | 14.1%), Mining, Quarrying, & Extraction (134 | 9.4%), and Manufacturing (121 | 8.5%).
Employment Industries by Sex in Medina
The Medina industries that see more men than women are Agriculture, Fishing & Hunting (100.0%), Mining, Quarrying, & Extraction (100.0%), and Construction (100.0%), whereas the industries that tend to have a higher number of women are Professional & Scientific (100.0%), Administrative & Support (100.0%), and Educational Services (100.0%).
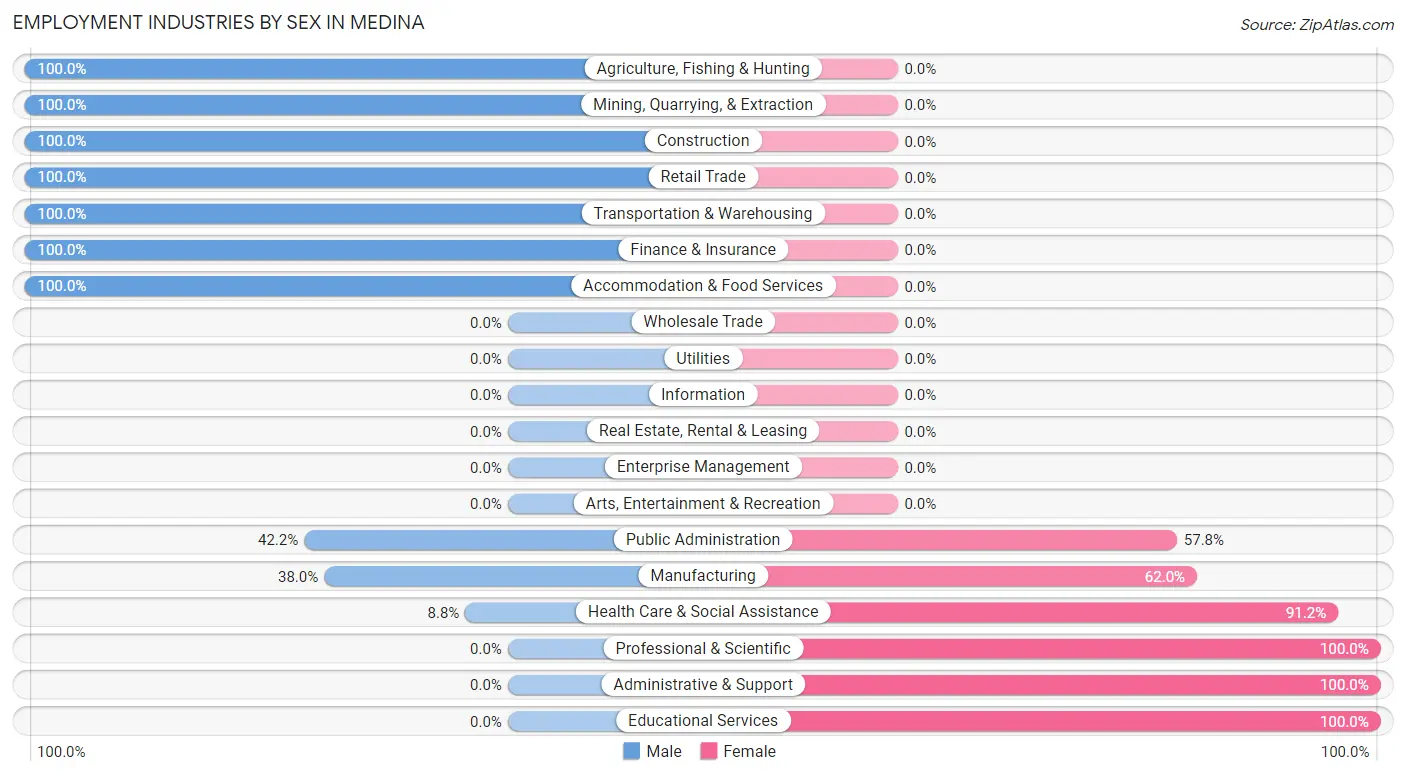
| Industry | Male | Female |
| Agriculture, Fishing & Hunting | 35 (100.0%) | 0 (0.0%) |
| Mining, Quarrying, & Extraction | 134 (100.0%) | 0 (0.0%) |
| Construction | 240 (100.0%) | 0 (0.0%) |
| Manufacturing | 46 (38.0%) | 75 (62.0%) |
| Wholesale Trade | 0 (0.0%) | 0 (0.0%) |
| Retail Trade | 50 (100.0%) | 0 (0.0%) |
| Transportation & Warehousing | 71 (100.0%) | 0 (0.0%) |
| Utilities | 0 (0.0%) | 0 (0.0%) |
| Information | 0 (0.0%) | 0 (0.0%) |
| Finance & Insurance | 25 (100.0%) | 0 (0.0%) |
| Real Estate, Rental & Leasing | 0 (0.0%) | 0 (0.0%) |
| Professional & Scientific | 0 (0.0%) | 17 (100.0%) |
| Enterprise Management | 0 (0.0%) | 0 (0.0%) |
| Administrative & Support | 0 (0.0%) | 4 (100.0%) |
| Educational Services | 0 (0.0%) | 202 (100.0%) |
| Health Care & Social Assistance | 29 (8.8%) | 300 (91.2%) |
| Arts, Entertainment & Recreation | 0 (0.0%) | 0 (0.0%) |
| Accommodation & Food Services | 20 (100.0%) | 0 (0.0%) |
| Public Administration | 43 (42.2%) | 59 (57.8%) |
| Total | 724 (50.6%) | 706 (49.4%) |
Education in Medina
School Enrollment in Medina
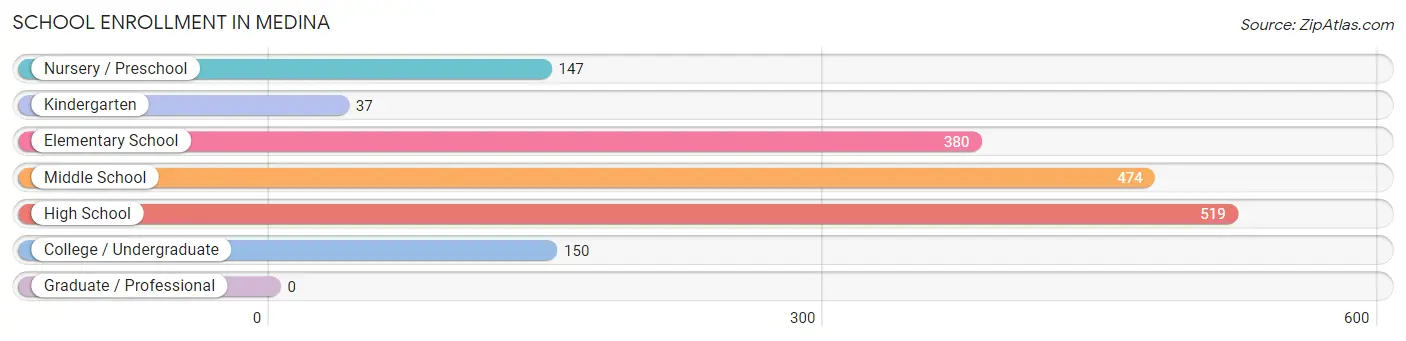
The most common levels of schooling among the 1,707 students in Medina are high school (519 | 30.4%), middle school (474 | 27.8%), and elementary school (380 | 22.3%).
| School Level | # Students | % Students |
| Nursery / Preschool | 147 | 8.6% |
| Kindergarten | 37 | 2.2% |
| Elementary School | 380 | 22.3% |
| Middle School | 474 | 27.8% |
| High School | 519 | 30.4% |
| College / Undergraduate | 150 | 8.8% |
| Graduate / Professional | 0 | 0.0% |
| Total | 1,707 | 100.0% |
School Enrollment by Age by Funding Source in Medina
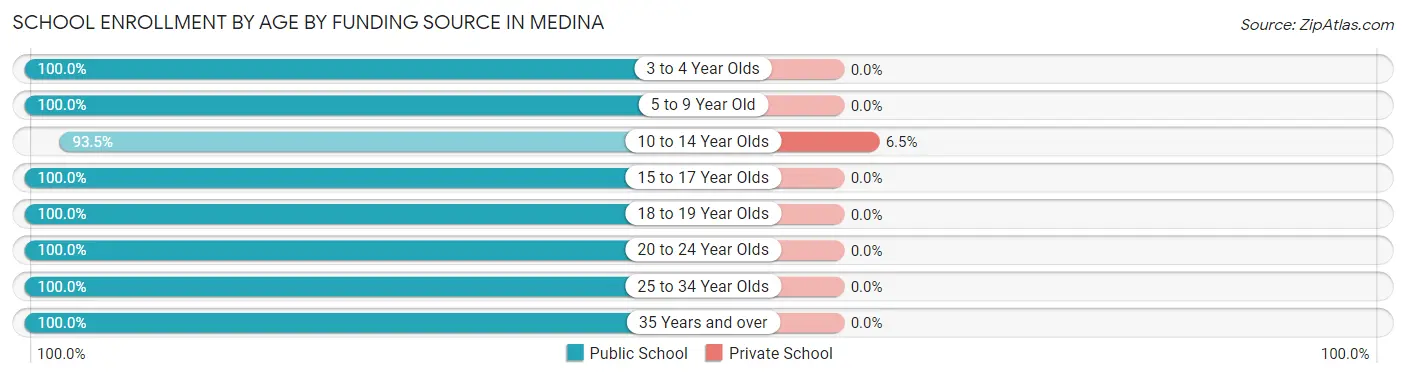
Out of a total of 1,707 students who are enrolled in schools in Medina, 39 (2.3%) attend a private institution, while the remaining 1,668 (97.7%) are enrolled in public schools. The age group of 10 to 14 year olds has the highest likelihood of being enrolled in private schools, with 39 (6.5% in the age bracket) enrolled. Conversely, the age group of 3 to 4 year olds has the lowest likelihood of being enrolled in a private school, with 114 (100.0% in the age bracket) attending a public institution.
| Age Bracket | Public School | Private School |
| 3 to 4 Year Olds | 114 (100.0%) | 0 (0.0%) |
| 5 to 9 Year Old | 429 (100.0%) | 0 (0.0%) |
| 10 to 14 Year Olds | 559 (93.5%) | 39 (6.5%) |
| 15 to 17 Year Olds | 248 (100.0%) | 0 (0.0%) |
| 18 to 19 Year Olds | 64 (100.0%) | 0 (0.0%) |
| 20 to 24 Year Olds | 54 (100.0%) | 0 (0.0%) |
| 25 to 34 Year Olds | 162 (100.0%) | 0 (0.0%) |
| 35 Years and over | 38 (100.0%) | 0 (0.0%) |
| Total | 1,668 (97.7%) | 39 (2.3%) |
Educational Attainment by Field of Study in Medina
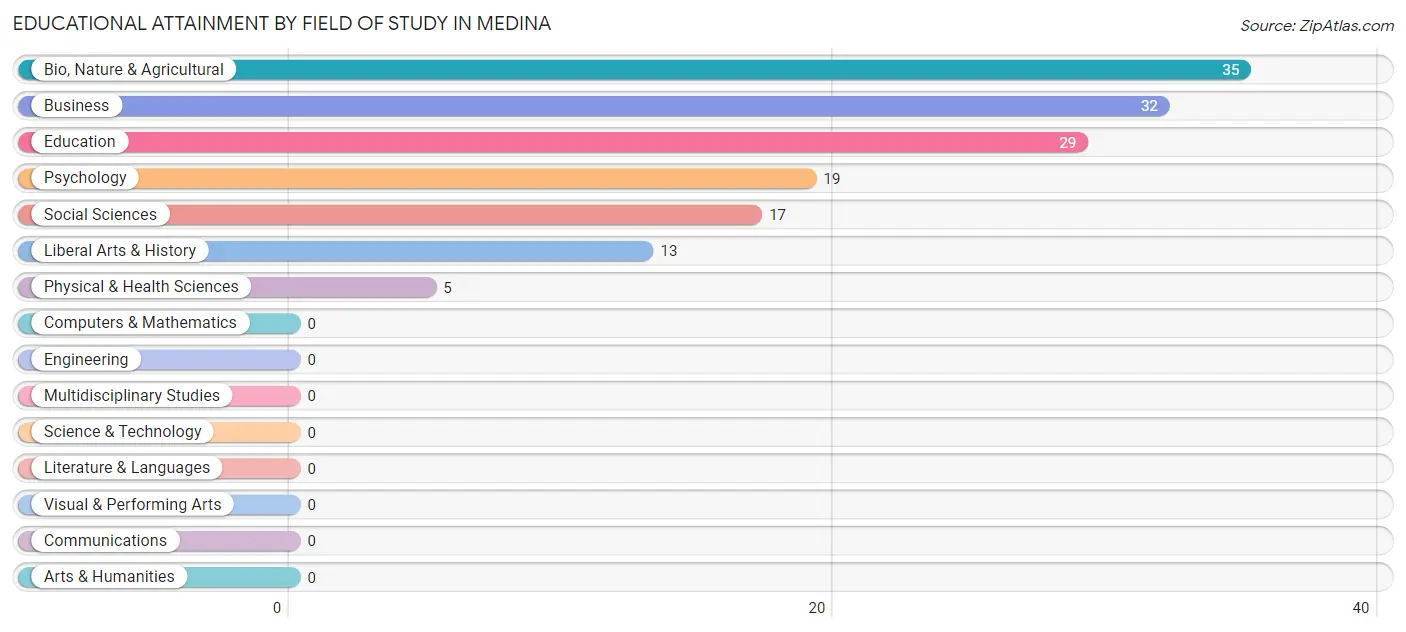
Bio, nature & agricultural (35 | 23.3%), business (32 | 21.3%), education (29 | 19.3%), psychology (19 | 12.7%), and social sciences (17 | 11.3%) are the most common fields of study among 150 individuals in Medina who have obtained a bachelor's degree or higher.
| Field of Study | # Graduates | % Graduates |
| Computers & Mathematics | 0 | 0.0% |
| Bio, Nature & Agricultural | 35 | 23.3% |
| Physical & Health Sciences | 5 | 3.3% |
| Psychology | 19 | 12.7% |
| Social Sciences | 17 | 11.3% |
| Engineering | 0 | 0.0% |
| Multidisciplinary Studies | 0 | 0.0% |
| Science & Technology | 0 | 0.0% |
| Business | 32 | 21.3% |
| Education | 29 | 19.3% |
| Literature & Languages | 0 | 0.0% |
| Liberal Arts & History | 13 | 8.7% |
| Visual & Performing Arts | 0 | 0.0% |
| Communications | 0 | 0.0% |
| Arts & Humanities | 0 | 0.0% |
| Total | 150 | 100.0% |
Transportation & Commute in Medina
Vehicle Availability by Sex in Medina
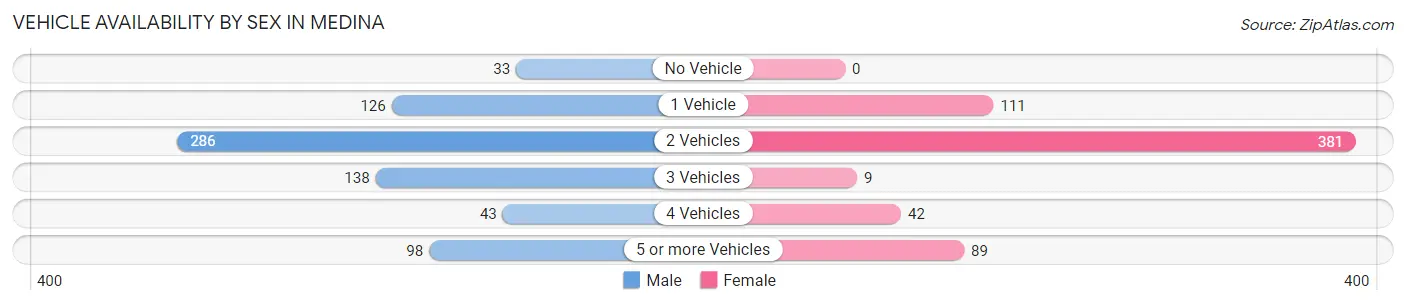
The most prevalent vehicle ownership categories in Medina are males with 2 vehicles (286, accounting for 39.5%) and females with 2 vehicles (381, making up 45.3%).
| Vehicles Available | Male | Female |
| No Vehicle | 33 (4.6%) | 0 (0.0%) |
| 1 Vehicle | 126 (17.4%) | 111 (17.6%) |
| 2 Vehicles | 286 (39.5%) | 381 (60.3%) |
| 3 Vehicles | 138 (19.1%) | 9 (1.4%) |
| 4 Vehicles | 43 (5.9%) | 42 (6.7%) |
| 5 or more Vehicles | 98 (13.5%) | 89 (14.1%) |
| Total | 724 (100.0%) | 632 (100.0%) |
Commute Time in Medina
The most frequently occuring commute durations in Medina are 5 to 9 minutes (473 commuters, 37.2%), 10 to 14 minutes (372 commuters, 29.3%), and 15 to 19 minutes (217 commuters, 17.1%).
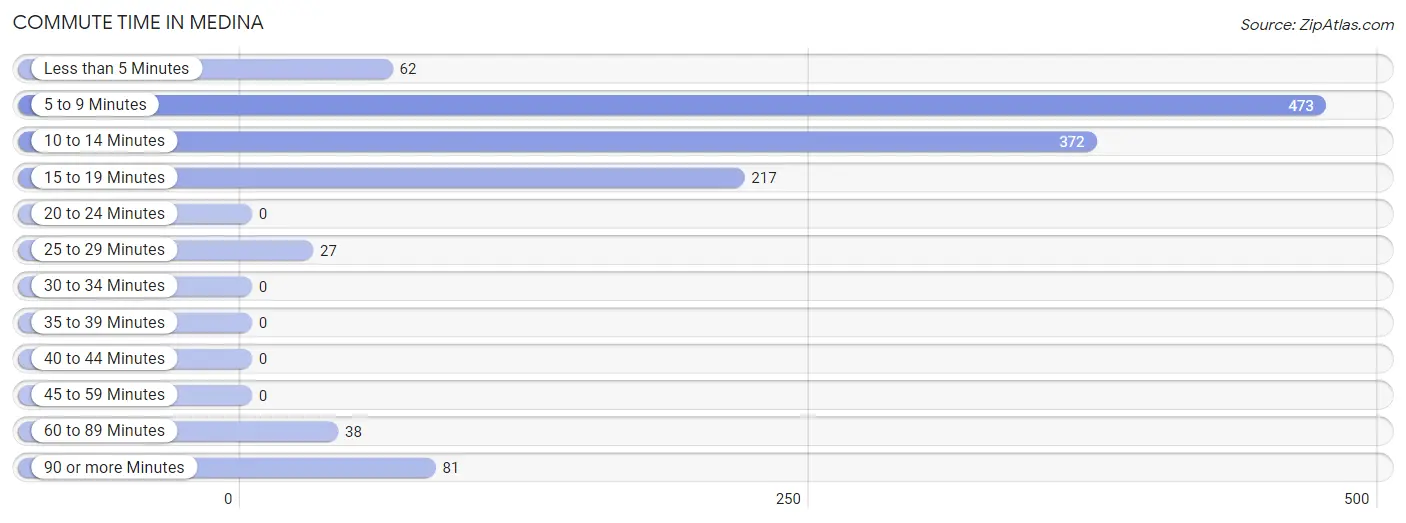
| Commute Time | # Commuters | % Commuters |
| Less than 5 Minutes | 62 | 4.9% |
| 5 to 9 Minutes | 473 | 37.2% |
| 10 to 14 Minutes | 372 | 29.3% |
| 15 to 19 Minutes | 217 | 17.1% |
| 20 to 24 Minutes | 0 | 0.0% |
| 25 to 29 Minutes | 27 | 2.1% |
| 30 to 34 Minutes | 0 | 0.0% |
| 35 to 39 Minutes | 0 | 0.0% |
| 40 to 44 Minutes | 0 | 0.0% |
| 45 to 59 Minutes | 0 | 0.0% |
| 60 to 89 Minutes | 38 | 3.0% |
| 90 or more Minutes | 81 | 6.4% |
Commute Time by Sex in Medina
The most common commute times in Medina are 10 to 14 minutes (246 commuters, 37.2%) for males and 5 to 9 minutes (348 commuters, 57.1%) for females.
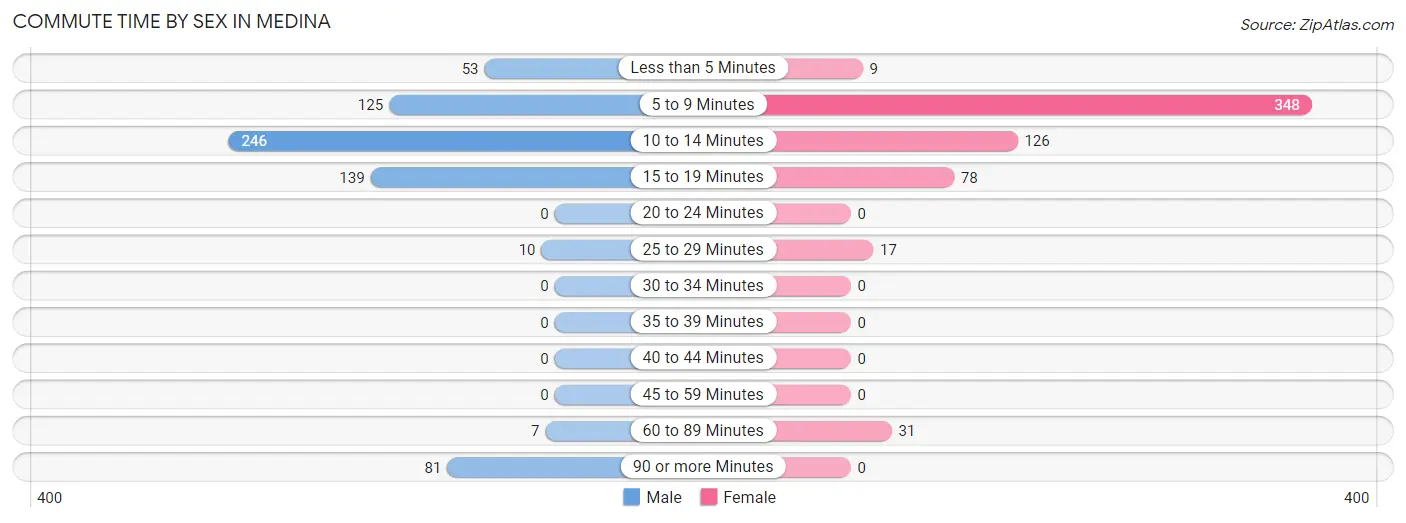
| Commute Time | Male | Female |
| Less than 5 Minutes | 53 (8.0%) | 9 (1.5%) |
| 5 to 9 Minutes | 125 (18.9%) | 348 (57.1%) |
| 10 to 14 Minutes | 246 (37.2%) | 126 (20.7%) |
| 15 to 19 Minutes | 139 (21.0%) | 78 (12.8%) |
| 20 to 24 Minutes | 0 (0.0%) | 0 (0.0%) |
| 25 to 29 Minutes | 10 (1.5%) | 17 (2.8%) |
| 30 to 34 Minutes | 0 (0.0%) | 0 (0.0%) |
| 35 to 39 Minutes | 0 (0.0%) | 0 (0.0%) |
| 40 to 44 Minutes | 0 (0.0%) | 0 (0.0%) |
| 45 to 59 Minutes | 0 (0.0%) | 0 (0.0%) |
| 60 to 89 Minutes | 7 (1.1%) | 31 (5.1%) |
| 90 or more Minutes | 81 (12.2%) | 0 (0.0%) |
Time of Departure to Work by Sex in Medina
The most frequent times of departure to work in Medina are 12:00 AM to 4:59 AM (135, 20.4%) for males and 7:00 AM to 7:29 AM (132, 21.7%) for females.
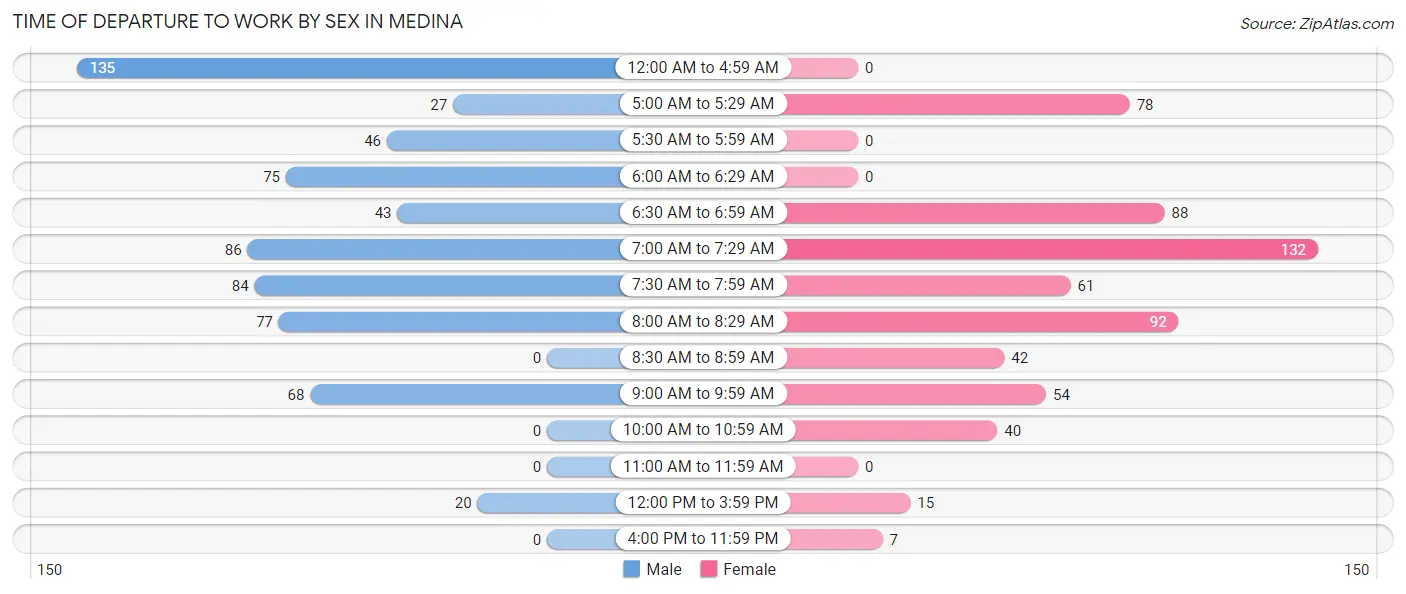
| Time of Departure | Male | Female |
| 12:00 AM to 4:59 AM | 135 (20.4%) | 0 (0.0%) |
| 5:00 AM to 5:29 AM | 27 (4.1%) | 78 (12.8%) |
| 5:30 AM to 5:59 AM | 46 (7.0%) | 0 (0.0%) |
| 6:00 AM to 6:29 AM | 75 (11.4%) | 0 (0.0%) |
| 6:30 AM to 6:59 AM | 43 (6.5%) | 88 (14.4%) |
| 7:00 AM to 7:29 AM | 86 (13.0%) | 132 (21.7%) |
| 7:30 AM to 7:59 AM | 84 (12.7%) | 61 (10.0%) |
| 8:00 AM to 8:29 AM | 77 (11.7%) | 92 (15.1%) |
| 8:30 AM to 8:59 AM | 0 (0.0%) | 42 (6.9%) |
| 9:00 AM to 9:59 AM | 68 (10.3%) | 54 (8.9%) |
| 10:00 AM to 10:59 AM | 0 (0.0%) | 40 (6.6%) |
| 11:00 AM to 11:59 AM | 0 (0.0%) | 0 (0.0%) |
| 12:00 PM to 3:59 PM | 20 (3.0%) | 15 (2.5%) |
| 4:00 PM to 11:59 PM | 0 (0.0%) | 7 (1.1%) |
| Total | 661 (100.0%) | 609 (100.0%) |
Housing Occupancy in Medina
Occupancy by Ownership in Medina
Of the total 1,211 dwellings in Medina, owner-occupied units account for 882 (72.8%), while renter-occupied units make up 329 (27.2%).
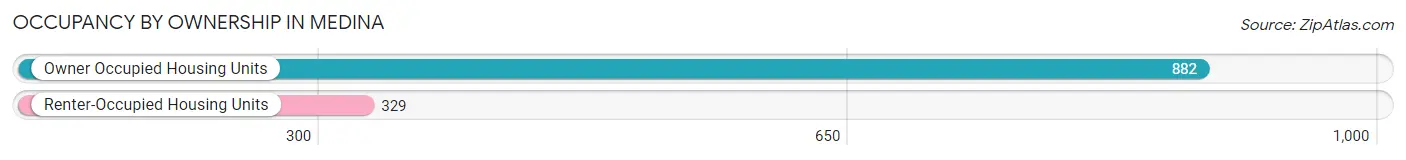
| Occupancy | # Housing Units | % Housing Units |
| Owner Occupied Housing Units | 882 | 72.8% |
| Renter-Occupied Housing Units | 329 | 27.2% |
| Total Occupied Housing Units | 1,211 | 100.0% |
Occupancy by Household Size in Medina
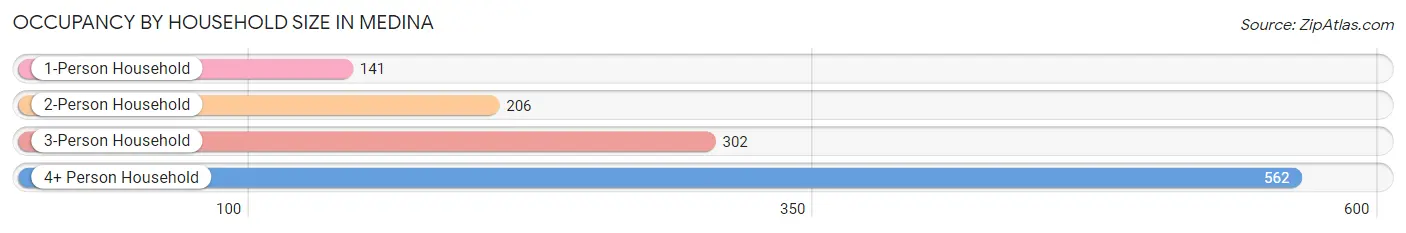
| Household Size | # Housing Units | % Housing Units |
| 1-Person Household | 141 | 11.6% |
| 2-Person Household | 206 | 17.0% |
| 3-Person Household | 302 | 24.9% |
| 4+ Person Household | 562 | 46.4% |
| Total Housing Units | 1,211 | 100.0% |
Occupancy by Ownership by Household Size in Medina
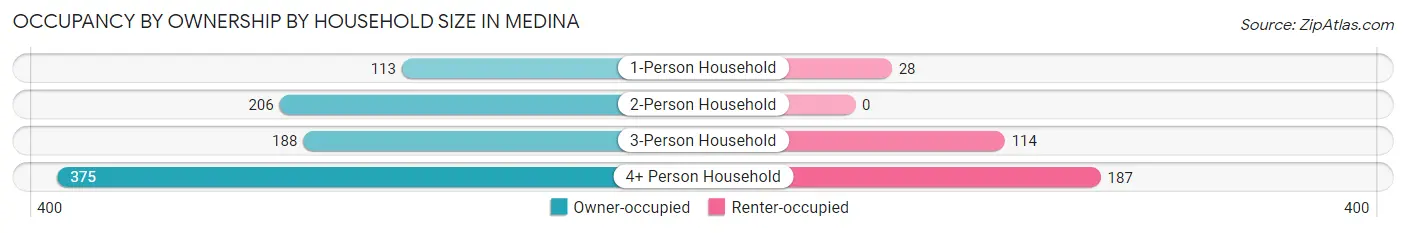
| Household Size | Owner-occupied | Renter-occupied |
| 1-Person Household | 113 (80.1%) | 28 (19.9%) |
| 2-Person Household | 206 (100.0%) | 0 (0.0%) |
| 3-Person Household | 188 (62.3%) | 114 (37.8%) |
| 4+ Person Household | 375 (66.7%) | 187 (33.3%) |
| Total Housing Units | 882 (72.8%) | 329 (27.2%) |
Occupancy by Educational Attainment in Medina
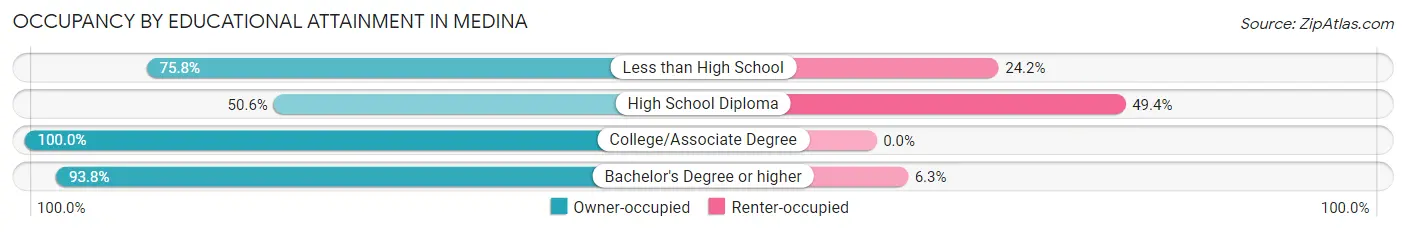
| Household Size | Owner-occupied | Renter-occupied |
| Less than High School | 385 (75.8%) | 123 (24.2%) |
| High School Diploma | 203 (50.6%) | 198 (49.4%) |
| College/Associate Degree | 174 (100.0%) | 0 (0.0%) |
| Bachelor's Degree or higher | 120 (93.8%) | 8 (6.2%) |
Occupancy by Age of Householder in Medina

| Age Bracket | # Households | % Households |
| Under 35 Years | 433 | 35.8% |
| 35 to 44 Years | 308 | 25.4% |
| 45 to 54 Years | 171 | 14.1% |
| 55 to 64 Years | 145 | 12.0% |
| 65 to 74 Years | 78 | 6.4% |
| 75 to 84 Years | 21 | 1.7% |
| 85 Years and Over | 55 | 4.5% |
| Total | 1,211 | 100.0% |
Housing Finances in Medina
Median Income by Occupancy in Medina
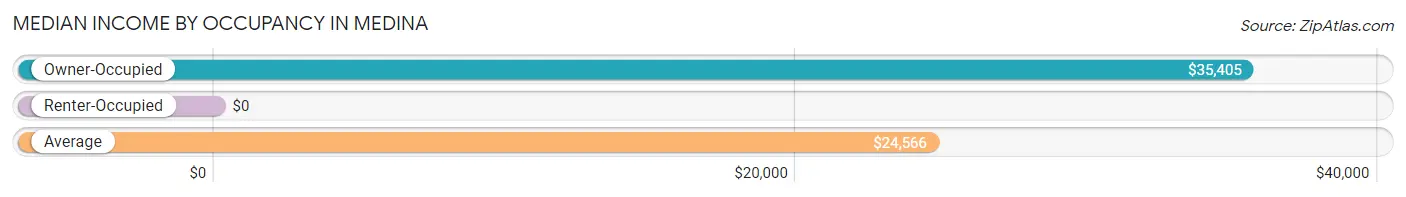
| Occupancy Type | # Households | Median Income |
| Owner-Occupied | 882 (72.8%) | $35,405 |
| Renter-Occupied | 329 (27.2%) | $0 |
| Average | 1,211 (100.0%) | $24,566 |
Occupancy by Householder Income Bracket in Medina
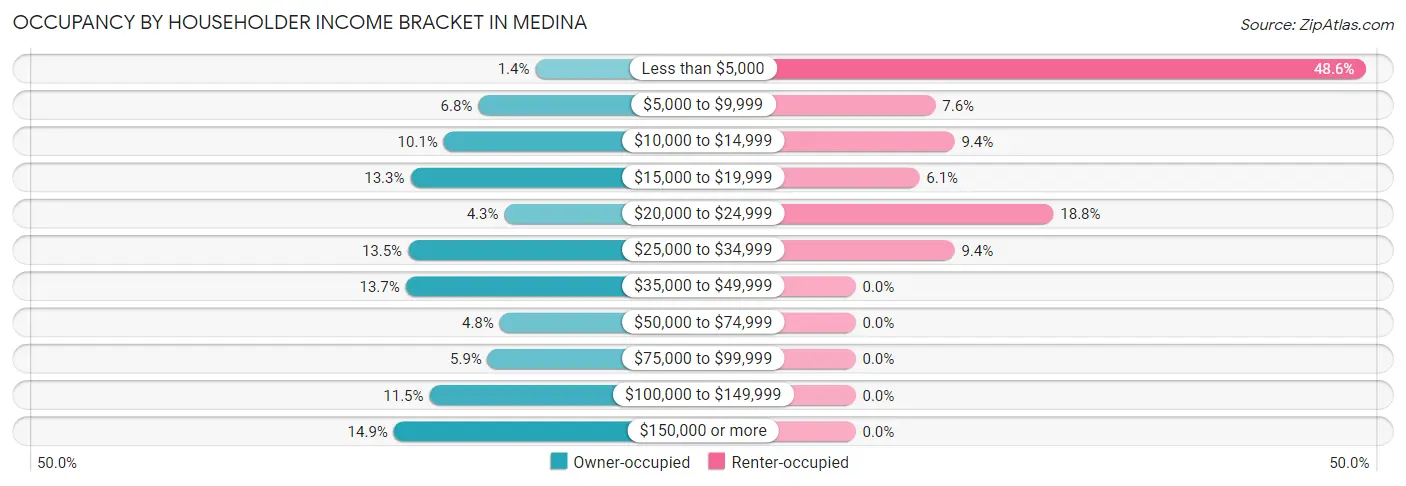
| Income Bracket | Owner-occupied | Renter-occupied |
| Less than $5,000 | 12 (1.4%) | 160 (48.6%) |
| $5,000 to $9,999 | 60 (6.8%) | 25 (7.6%) |
| $10,000 to $14,999 | 89 (10.1%) | 31 (9.4%) |
| $15,000 to $19,999 | 117 (13.3%) | 20 (6.1%) |
| $20,000 to $24,999 | 38 (4.3%) | 62 (18.8%) |
| $25,000 to $34,999 | 119 (13.5%) | 31 (9.4%) |
| $35,000 to $49,999 | 121 (13.7%) | 0 (0.0%) |
| $50,000 to $74,999 | 42 (4.8%) | 0 (0.0%) |
| $75,000 to $99,999 | 52 (5.9%) | 0 (0.0%) |
| $100,000 to $149,999 | 101 (11.5%) | 0 (0.0%) |
| $150,000 or more | 131 (14.8%) | 0 (0.0%) |
| Total | 882 (100.0%) | 329 (100.0%) |
Monthly Housing Cost Tiers in Medina
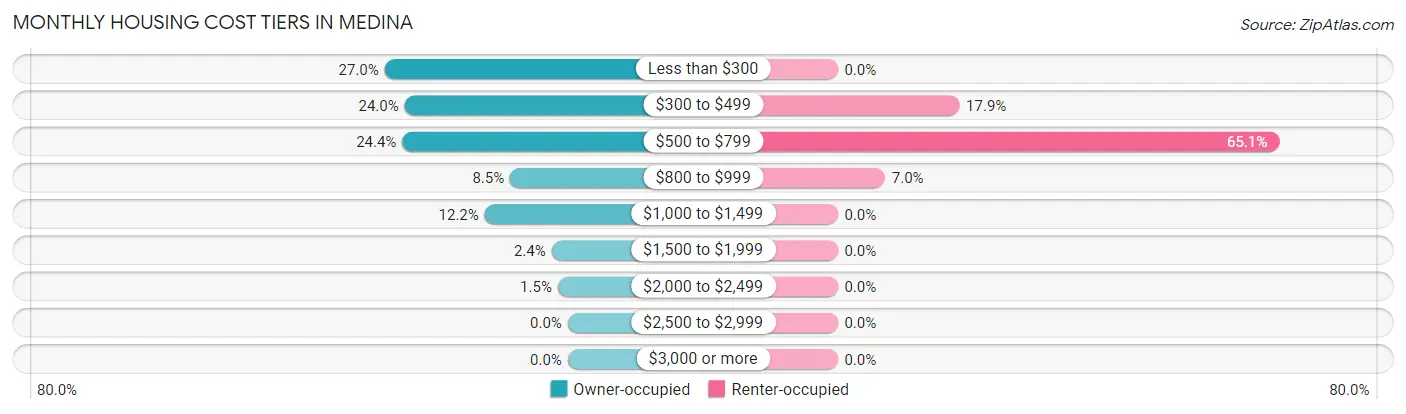
| Monthly Cost | Owner-occupied | Renter-occupied |
| Less than $300 | 238 (27.0%) | 0 (0.0%) |
| $300 to $499 | 212 (24.0%) | 59 (17.9%) |
| $500 to $799 | 215 (24.4%) | 214 (65.0%) |
| $800 to $999 | 75 (8.5%) | 23 (7.0%) |
| $1,000 to $1,499 | 108 (12.2%) | 0 (0.0%) |
| $1,500 to $1,999 | 21 (2.4%) | 0 (0.0%) |
| $2,000 to $2,499 | 13 (1.5%) | 0 (0.0%) |
| $2,500 to $2,999 | 0 (0.0%) | 0 (0.0%) |
| $3,000 or more | 0 (0.0%) | 0 (0.0%) |
| Total | 882 (100.0%) | 329 (100.0%) |
Physical Housing Characteristics in Medina
Housing Structures in Medina
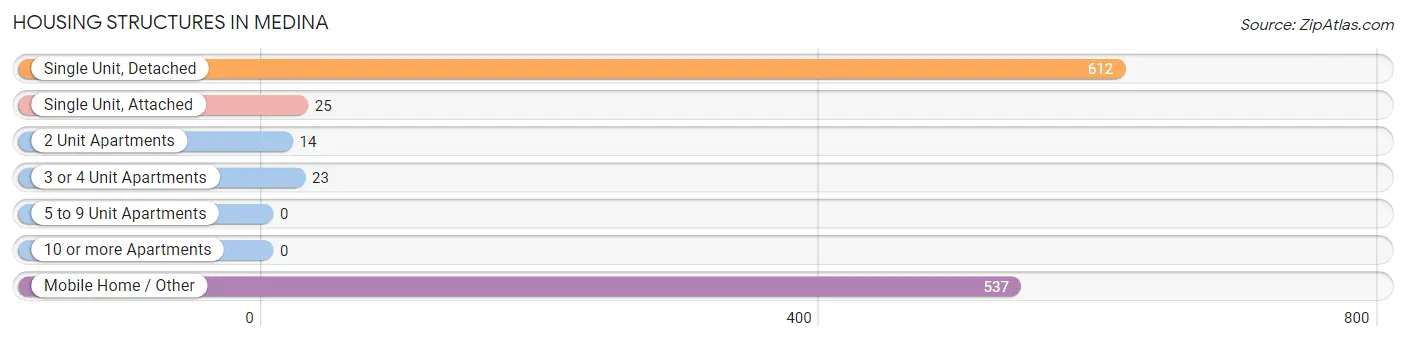
| Structure Type | # Housing Units | % Housing Units |
| Single Unit, Detached | 612 | 50.5% |
| Single Unit, Attached | 25 | 2.1% |
| 2 Unit Apartments | 14 | 1.2% |
| 3 or 4 Unit Apartments | 23 | 1.9% |
| 5 to 9 Unit Apartments | 0 | 0.0% |
| 10 or more Apartments | 0 | 0.0% |
| Mobile Home / Other | 537 | 44.3% |
| Total | 1,211 | 100.0% |
Housing Structures by Occupancy in Medina
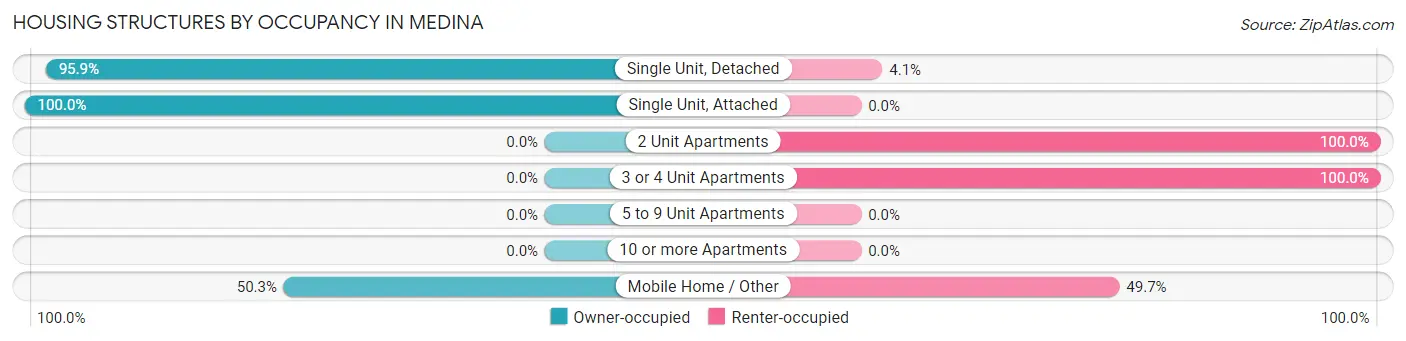
| Structure Type | Owner-occupied | Renter-occupied |
| Single Unit, Detached | 587 (95.9%) | 25 (4.1%) |
| Single Unit, Attached | 25 (100.0%) | 0 (0.0%) |
| 2 Unit Apartments | 0 (0.0%) | 14 (100.0%) |
| 3 or 4 Unit Apartments | 0 (0.0%) | 23 (100.0%) |
| 5 to 9 Unit Apartments | 0 (0.0%) | 0 (0.0%) |
| 10 or more Apartments | 0 (0.0%) | 0 (0.0%) |
| Mobile Home / Other | 270 (50.3%) | 267 (49.7%) |
| Total | 882 (72.8%) | 329 (27.2%) |
Housing Structures by Number of Rooms in Medina
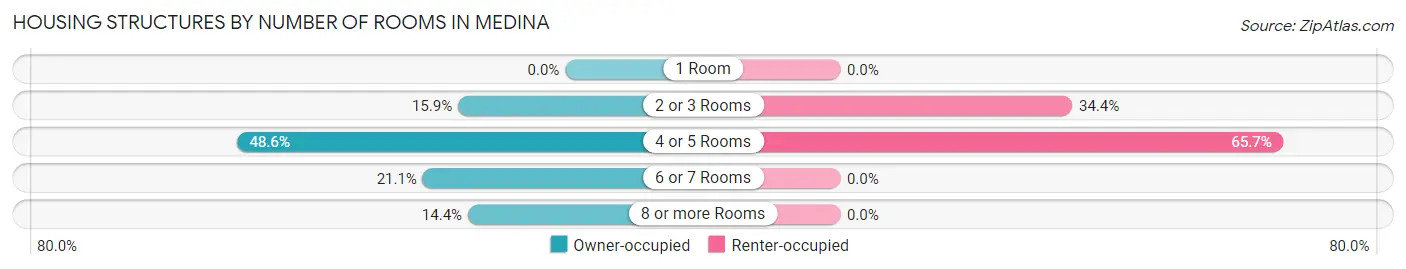
| Number of Rooms | Owner-occupied | Renter-occupied |
| 1 Room | 0 (0.0%) | 0 (0.0%) |
| 2 or 3 Rooms | 140 (15.9%) | 113 (34.4%) |
| 4 or 5 Rooms | 429 (48.6%) | 216 (65.6%) |
| 6 or 7 Rooms | 186 (21.1%) | 0 (0.0%) |
| 8 or more Rooms | 127 (14.4%) | 0 (0.0%) |
| Total | 882 (100.0%) | 329 (100.0%) |
Housing Structure by Heating Type in Medina
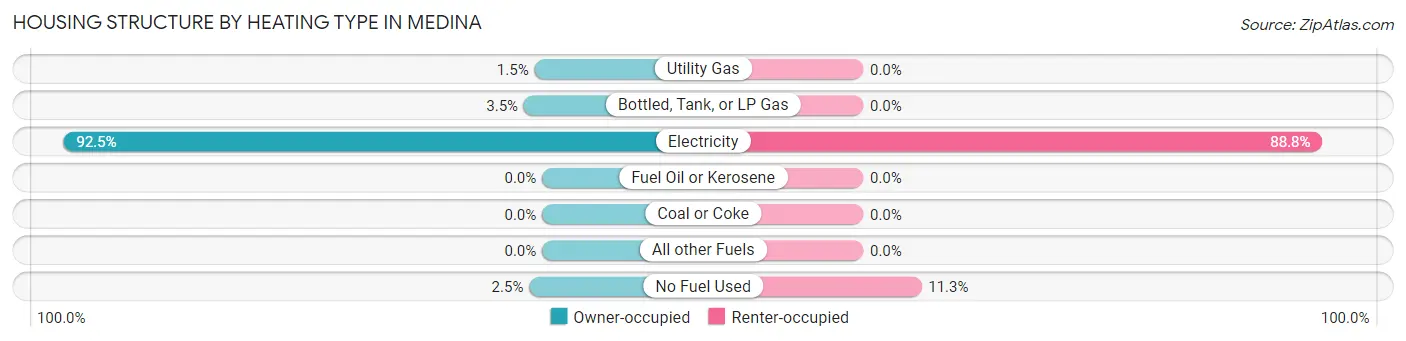
| Heating Type | Owner-occupied | Renter-occupied |
| Utility Gas | 13 (1.5%) | 0 (0.0%) |
| Bottled, Tank, or LP Gas | 31 (3.5%) | 0 (0.0%) |
| Electricity | 816 (92.5%) | 292 (88.7%) |
| Fuel Oil or Kerosene | 0 (0.0%) | 0 (0.0%) |
| Coal or Coke | 0 (0.0%) | 0 (0.0%) |
| All other Fuels | 0 (0.0%) | 0 (0.0%) |
| No Fuel Used | 22 (2.5%) | 37 (11.3%) |
| Total | 882 (100.0%) | 329 (100.0%) |
Household Vehicle Usage in Medina
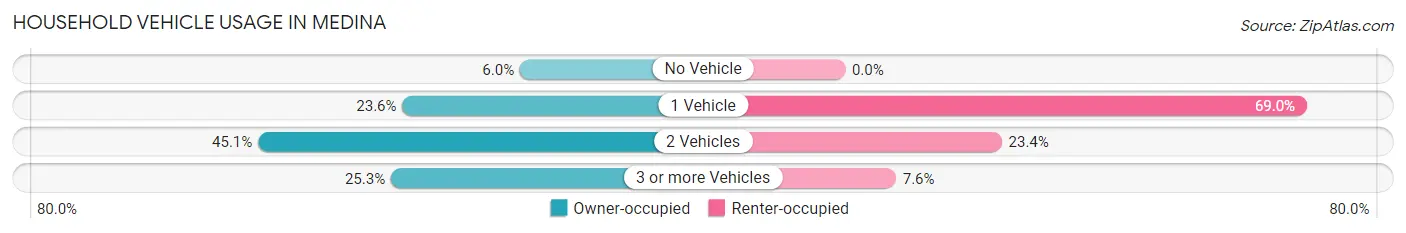
| Vehicles per Household | Owner-occupied | Renter-occupied |
| No Vehicle | 53 (6.0%) | 0 (0.0%) |
| 1 Vehicle | 208 (23.6%) | 227 (69.0%) |
| 2 Vehicles | 398 (45.1%) | 77 (23.4%) |
| 3 or more Vehicles | 223 (25.3%) | 25 (7.6%) |
| Total | 882 (100.0%) | 329 (100.0%) |
Real Estate & Mortgages in Medina
Real Estate and Mortgage Overview in Medina
| Characteristic | Without Mortgage | With Mortgage |
| Housing Units | 658 | 224 |
| Median Property Value | $45,600 | $74,200 |
| Median Household Income | $32,500 | $41 |
| Monthly Housing Costs | $363 | $0 |
| Real Estate Taxes | $591 | $0 |
Property Value by Mortgage Status in Medina
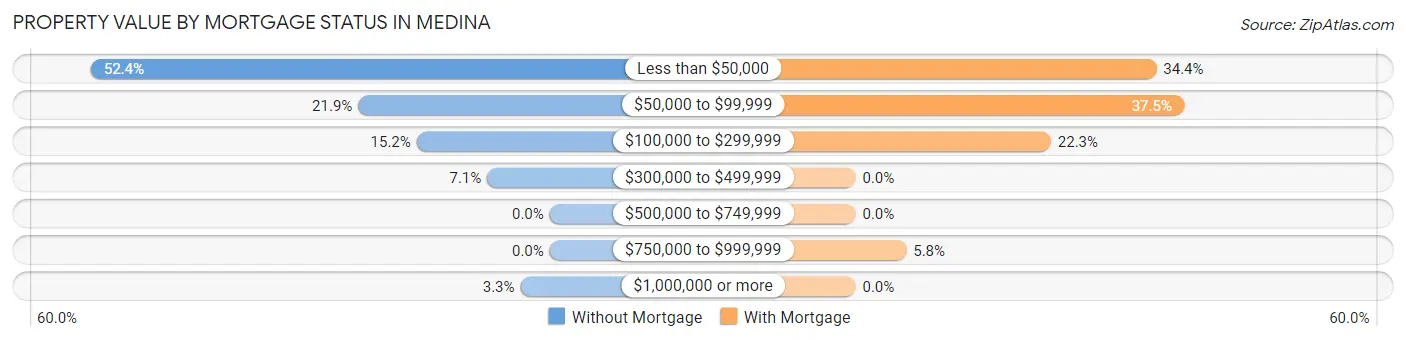
| Property Value | Without Mortgage | With Mortgage |
| Less than $50,000 | 345 (52.4%) | 77 (34.4%) |
| $50,000 to $99,999 | 144 (21.9%) | 84 (37.5%) |
| $100,000 to $299,999 | 100 (15.2%) | 50 (22.3%) |
| $300,000 to $499,999 | 47 (7.1%) | 0 (0.0%) |
| $500,000 to $749,999 | 0 (0.0%) | 0 (0.0%) |
| $750,000 to $999,999 | 0 (0.0%) | 13 (5.8%) |
| $1,000,000 or more | 22 (3.3%) | 0 (0.0%) |
| Total | 658 (100.0%) | 224 (100.0%) |
Household Income by Mortgage Status in Medina
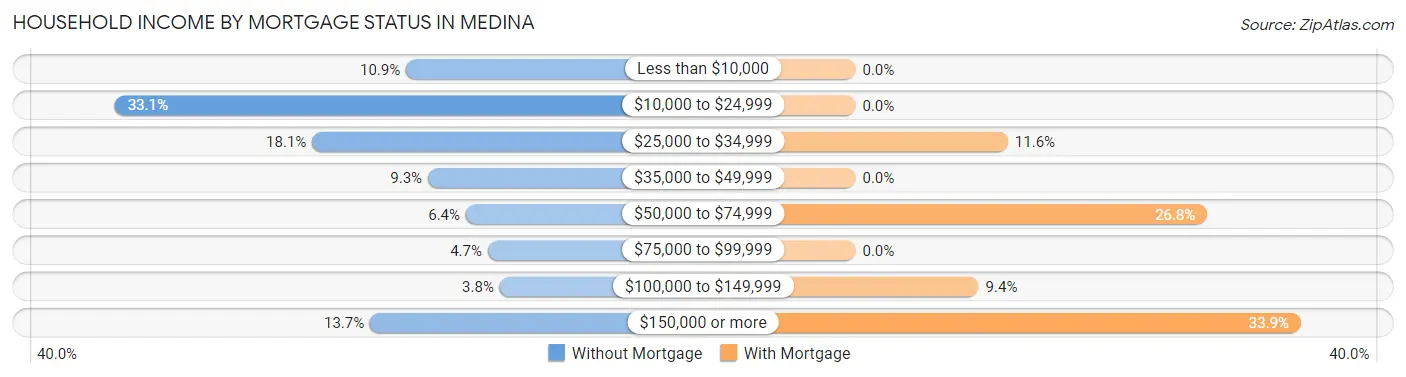
| Household Income | Without Mortgage | With Mortgage |
| Less than $10,000 | 72 (10.9%) | 0 (0.0%) |
| $10,000 to $24,999 | 218 (33.1%) | 0 (0.0%) |
| $25,000 to $34,999 | 119 (18.1%) | 26 (11.6%) |
| $35,000 to $49,999 | 61 (9.3%) | 0 (0.0%) |
| $50,000 to $74,999 | 42 (6.4%) | 60 (26.8%) |
| $75,000 to $99,999 | 31 (4.7%) | 0 (0.0%) |
| $100,000 to $149,999 | 25 (3.8%) | 21 (9.4%) |
| $150,000 or more | 90 (13.7%) | 76 (33.9%) |
| Total | 658 (100.0%) | 224 (100.0%) |
Property Value to Household Income Ratio in Medina
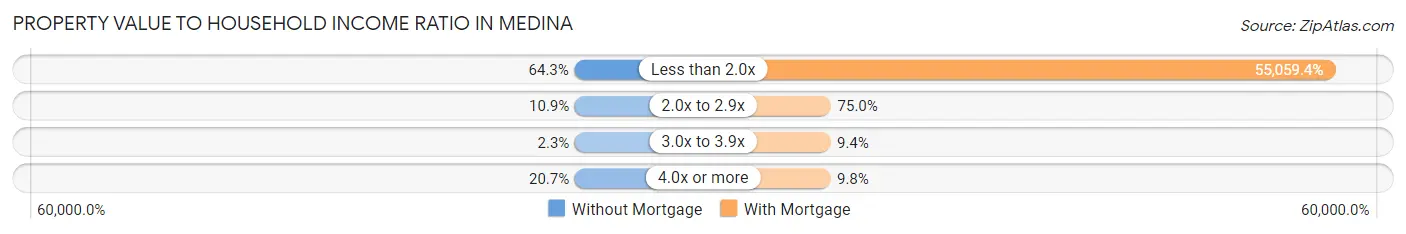
| Value-to-Income Ratio | Without Mortgage | With Mortgage |
| Less than 2.0x | 423 (64.3%) | 123,333 (55,059.4%) |
| 2.0x to 2.9x | 72 (10.9%) | 168 (75.0%) |
| 3.0x to 3.9x | 15 (2.3%) | 21 (9.4%) |
| 4.0x or more | 136 (20.7%) | 22 (9.8%) |
| Total | 658 (100.0%) | 224 (100.0%) |
Real Estate Taxes by Mortgage Status in Medina
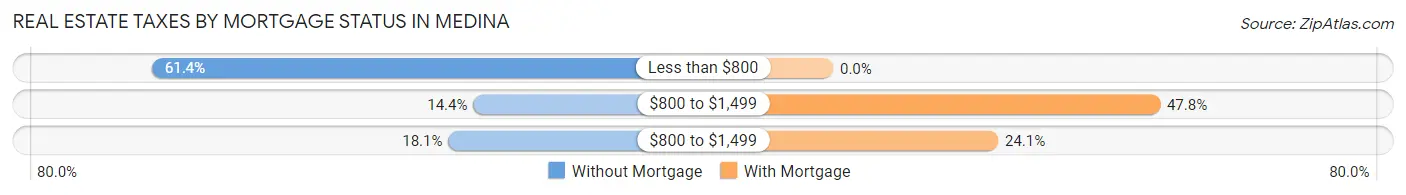
| Property Taxes | Without Mortgage | With Mortgage |
| Less than $800 | 404 (61.4%) | 0 (0.0%) |
| $800 to $1,499 | 95 (14.4%) | 107 (47.8%) |
| $800 to $1,499 | 119 (18.1%) | 54 (24.1%) |
| Total | 658 (100.0%) | 224 (100.0%) |
Health & Disability in Medina
Health Insurance Coverage by Age in Medina
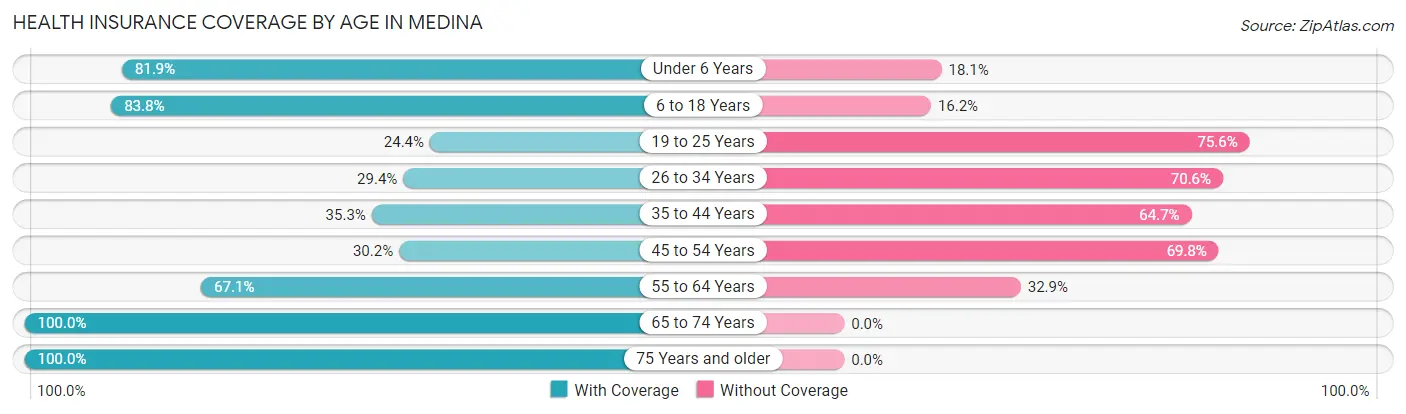
| Age Bracket | With Coverage | Without Coverage |
| Under 6 Years | 388 (81.9%) | 86 (18.1%) |
| 6 to 18 Years | 1,095 (83.8%) | 211 (16.2%) |
| 19 to 25 Years | 128 (24.4%) | 396 (75.6%) |
| 26 to 34 Years | 150 (29.4%) | 360 (70.6%) |
| 35 to 44 Years | 236 (35.3%) | 433 (64.7%) |
| 45 to 54 Years | 128 (30.2%) | 296 (69.8%) |
| 55 to 64 Years | 163 (67.1%) | 80 (32.9%) |
| 65 to 74 Years | 176 (100.0%) | 0 (0.0%) |
| 75 Years and older | 110 (100.0%) | 0 (0.0%) |
| Total | 2,574 (58.0%) | 1,862 (42.0%) |
Health Insurance Coverage by Citizenship Status in Medina
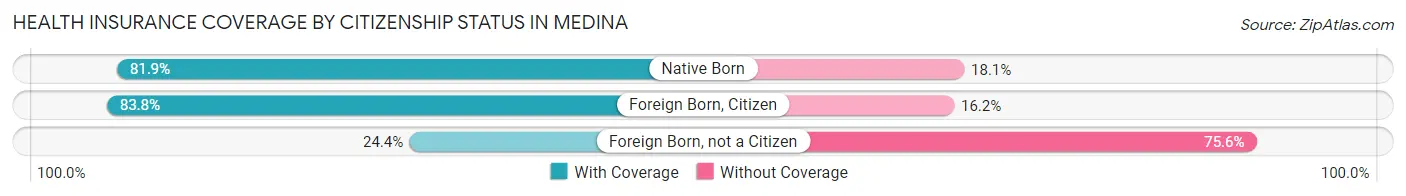
| Citizenship Status | With Coverage | Without Coverage |
| Native Born | 388 (81.9%) | 86 (18.1%) |
| Foreign Born, Citizen | 1,095 (83.8%) | 211 (16.2%) |
| Foreign Born, not a Citizen | 128 (24.4%) | 396 (75.6%) |
Health Insurance Coverage by Household Income in Medina
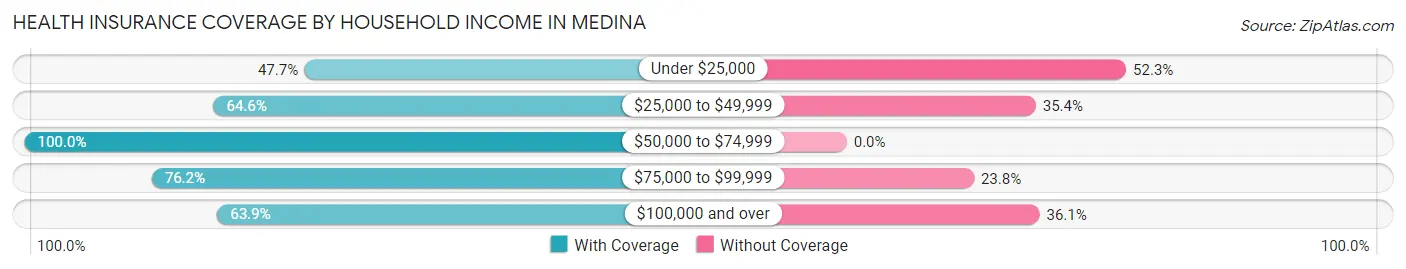
| Household Income | With Coverage | Without Coverage |
| Under $25,000 | 945 (47.7%) | 1,038 (52.3%) |
| $25,000 to $49,999 | 684 (64.6%) | 375 (35.4%) |
| $50,000 to $74,999 | 85 (100.0%) | 0 (0.0%) |
| $75,000 to $99,999 | 147 (76.2%) | 46 (23.8%) |
| $100,000 and over | 713 (63.9%) | 403 (36.1%) |
Public vs Private Health Insurance Coverage by Age in Medina
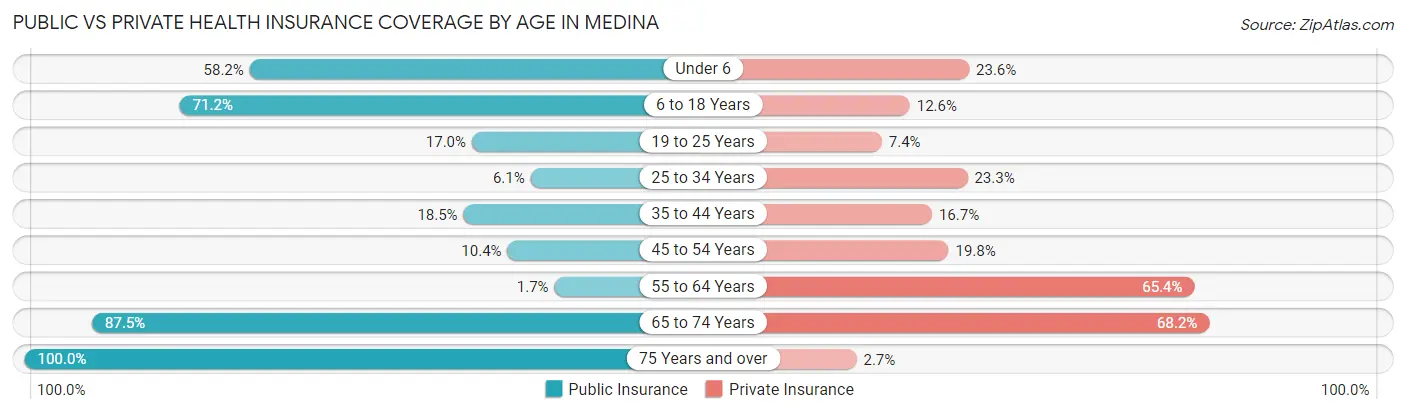
| Age Bracket | Public Insurance | Private Insurance |
| Under 6 | 276 (58.2%) | 112 (23.6%) |
| 6 to 18 Years | 930 (71.2%) | 165 (12.6%) |
| 19 to 25 Years | 89 (17.0%) | 39 (7.4%) |
| 25 to 34 Years | 31 (6.1%) | 119 (23.3%) |
| 35 to 44 Years | 124 (18.5%) | 112 (16.7%) |
| 45 to 54 Years | 44 (10.4%) | 84 (19.8%) |
| 55 to 64 Years | 4 (1.7%) | 159 (65.4%) |
| 65 to 74 Years | 154 (87.5%) | 120 (68.2%) |
| 75 Years and over | 110 (100.0%) | 3 (2.7%) |
| Total | 1,762 (39.7%) | 913 (20.6%) |
Disability Status by Sex by Age in Medina
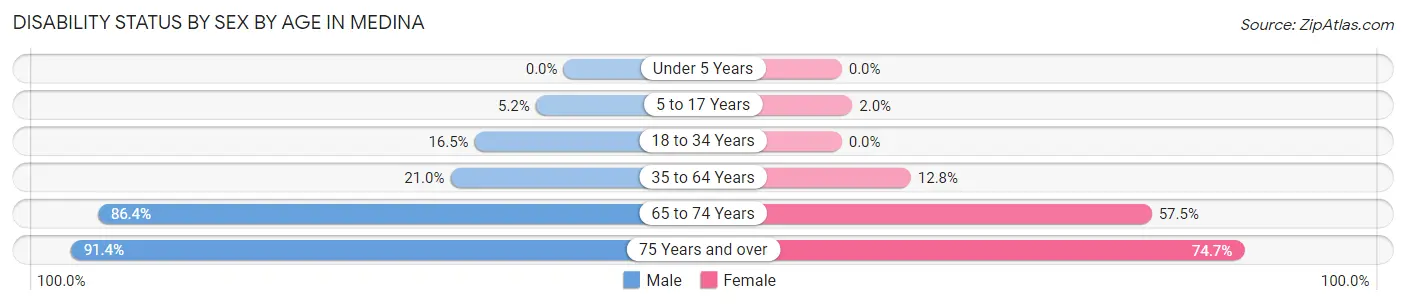
| Age Bracket | Male | Female |
| Under 5 Years | 0 (0.0%) | 0 (0.0%) |
| 5 to 17 Years | 37 (5.1%) | 12 (2.0%) |
| 18 to 34 Years | 82 (16.5%) | 0 (0.0%) |
| 35 to 64 Years | 115 (21.0%) | 101 (12.8%) |
| 65 to 74 Years | 89 (86.4%) | 42 (57.5%) |
| 75 Years and over | 32 (91.4%) | 56 (74.7%) |
Disability Class by Sex by Age in Medina
Disability Class: Hearing Difficulty
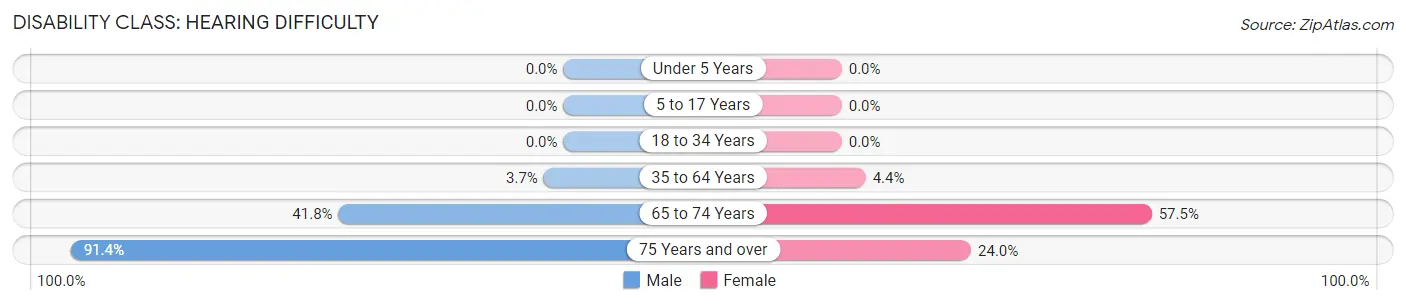
| Age Bracket | Male | Female |
| Under 5 Years | 0 (0.0%) | 0 (0.0%) |
| 5 to 17 Years | 0 (0.0%) | 0 (0.0%) |
| 18 to 34 Years | 0 (0.0%) | 0 (0.0%) |
| 35 to 64 Years | 20 (3.6%) | 35 (4.4%) |
| 65 to 74 Years | 43 (41.7%) | 42 (57.5%) |
| 75 Years and over | 32 (91.4%) | 18 (24.0%) |
Disability Class: Vision Difficulty
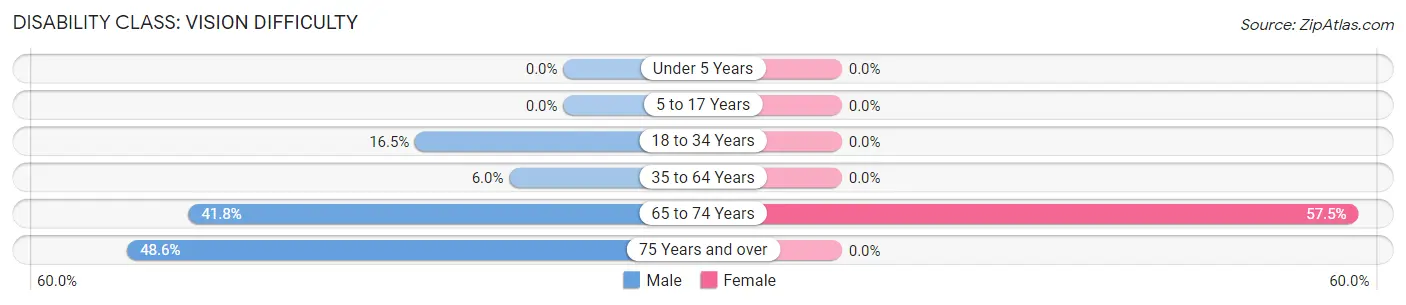
| Age Bracket | Male | Female |
| Under 5 Years | 0 (0.0%) | 0 (0.0%) |
| 5 to 17 Years | 0 (0.0%) | 0 (0.0%) |
| 18 to 34 Years | 82 (16.5%) | 0 (0.0%) |
| 35 to 64 Years | 33 (6.0%) | 0 (0.0%) |
| 65 to 74 Years | 43 (41.7%) | 42 (57.5%) |
| 75 Years and over | 17 (48.6%) | 0 (0.0%) |
Disability Class: Cognitive Difficulty
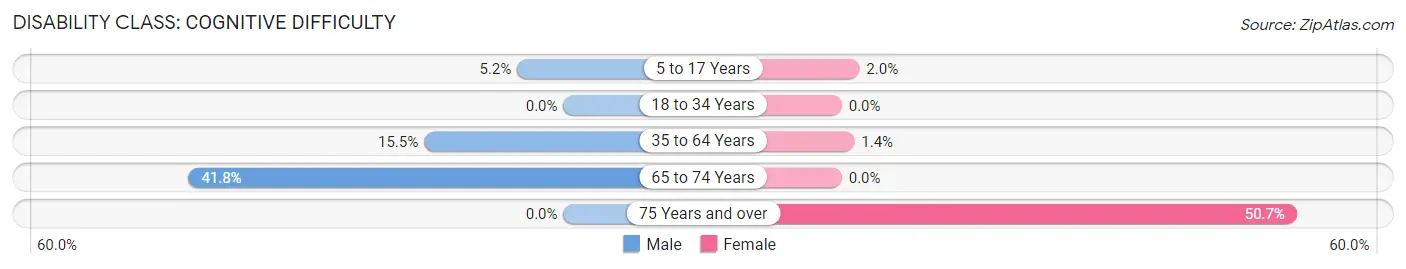
| Age Bracket | Male | Female |
| 5 to 17 Years | 37 (5.1%) | 12 (2.0%) |
| 18 to 34 Years | 0 (0.0%) | 0 (0.0%) |
| 35 to 64 Years | 85 (15.5%) | 11 (1.4%) |
| 65 to 74 Years | 43 (41.7%) | 0 (0.0%) |
| 75 Years and over | 0 (0.0%) | 38 (50.7%) |
Disability Class: Ambulatory Difficulty
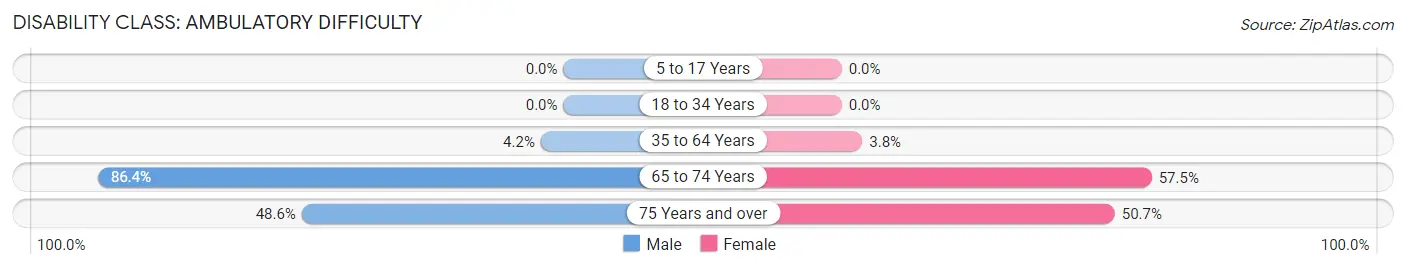
| Age Bracket | Male | Female |
| 5 to 17 Years | 0 (0.0%) | 0 (0.0%) |
| 18 to 34 Years | 0 (0.0%) | 0 (0.0%) |
| 35 to 64 Years | 23 (4.2%) | 30 (3.8%) |
| 65 to 74 Years | 89 (86.4%) | 42 (57.5%) |
| 75 Years and over | 17 (48.6%) | 38 (50.7%) |
Disability Class: Self-Care Difficulty
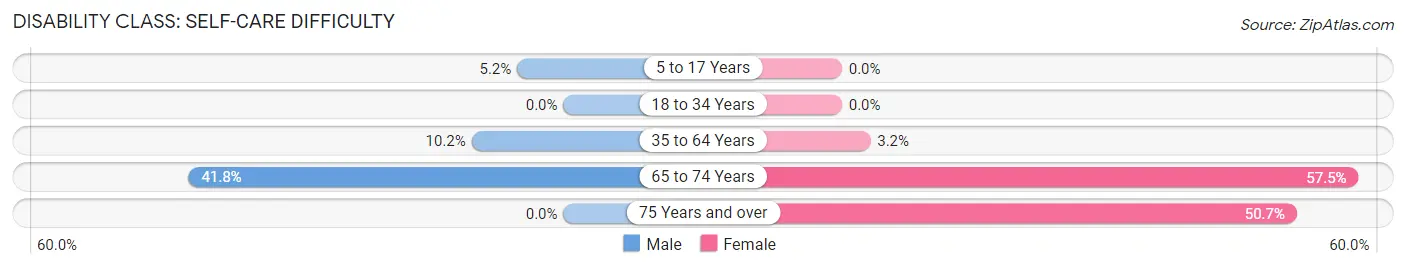
| Age Bracket | Male | Female |
| 5 to 17 Years | 37 (5.1%) | 0 (0.0%) |
| 18 to 34 Years | 0 (0.0%) | 0 (0.0%) |
| 35 to 64 Years | 56 (10.2%) | 25 (3.2%) |
| 65 to 74 Years | 43 (41.7%) | 42 (57.5%) |
| 75 Years and over | 0 (0.0%) | 38 (50.7%) |
Technology Access in Medina
Computing Device Access in Medina
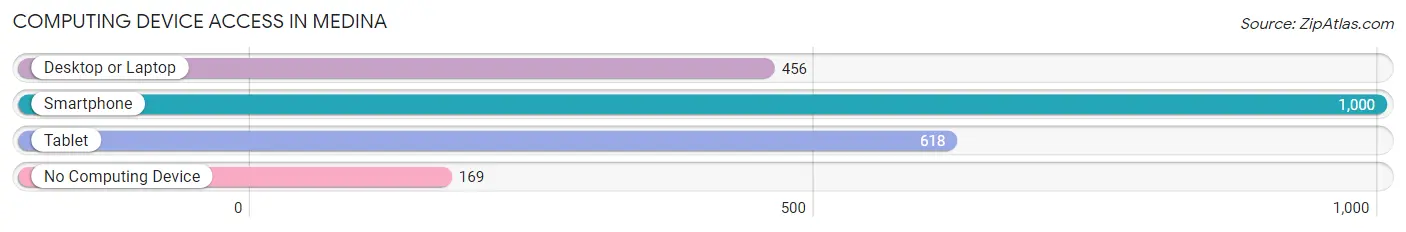
| Device Type | # Households | % Households |
| Desktop or Laptop | 456 | 37.7% |
| Smartphone | 1,000 | 82.6% |
| Tablet | 618 | 51.0% |
| No Computing Device | 169 | 14.0% |
| Total | 1,211 | 100.0% |
Internet Access in Medina
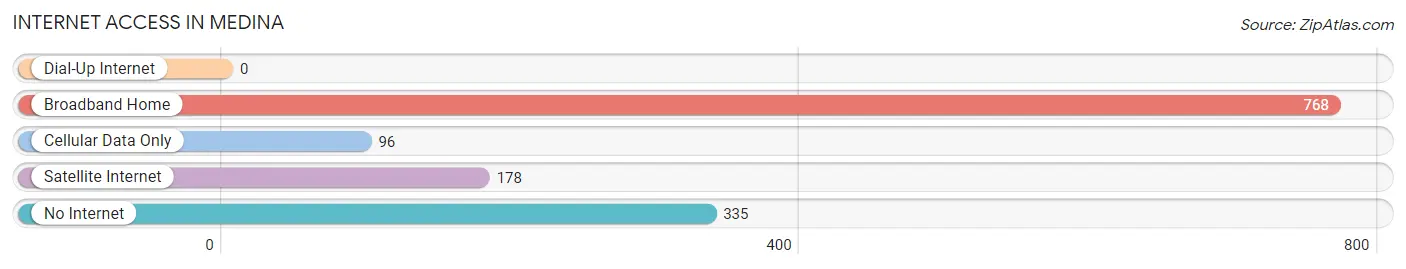
| Internet Type | # Households | % Households |
| Dial-Up Internet | 0 | 0.0% |
| Broadband Home | 768 | 63.4% |
| Cellular Data Only | 96 | 7.9% |
| Satellite Internet | 178 | 14.7% |
| No Internet | 335 | 27.7% |
| Total | 1,211 | 100.0% |
Medina Summary
Medina, Texas is a small town located in Bandera County, Texas. It is situated in the Hill Country region of the state, about an hour northwest of San Antonio. The town was founded in 1846 and named after the nearby Medina River. The population of Medina in 2000 was 1,093.
Geography
Medina is located in the Hill Country region of Texas, about an hour northwest of San Antonio. The town is situated on the Medina River, which is a tributary of the San Antonio River. The terrain is mostly rolling hills and the area is known for its scenic beauty. The climate is semi-arid, with hot summers and mild winters.
Economy
The economy of Medina is largely based on agriculture and tourism. The town is home to several ranches and farms, which produce a variety of crops, including corn, cotton, and hay. The area is also known for its hunting and fishing opportunities. Tourism is an important part of the local economy, with visitors coming to enjoy the scenic beauty of the Hill Country.
Demographics
The population of Medina in 2000 was 1,093. The racial makeup of the town was 94.3% White, 0.3% African American, 0.2% Native American, 0.2% Asian, 0.1% Pacific Islander, 3.7% from other races, and 1.2% from two or more races. Hispanic or Latino of any race were 8.2% of the population.
The median income for a household in the town was $30,000, and the median income for a family was $35,000. About 15.2% of families and 17.2% of the population were below the poverty line, including 22.2% of those under age 18 and 10.2% of those age 65 or over.
History
Medina was founded in 1846 and named after the nearby Medina River. The town was originally a trading post for the local Native American tribes. In the late 19th century, the town began to grow as a center for ranching and farming. The town was incorporated in 1891 and the first post office was established in 1892.
In the early 20th century, Medina became a popular tourist destination, with visitors coming to enjoy the scenic beauty of the Hill Country. The town was also home to several resorts and spas. In the 1950s, the town began to decline as the local economy shifted away from agriculture and tourism.
Today, Medina is a small town with a population of just over 1,000. The town is still home to several ranches and farms, and tourism is an important part of the local economy. The town is also known for its scenic beauty and is a popular destination for visitors looking to explore the Hill Country.
Common Questions
What is Per Capita Income in Medina?
Per Capita income in Medina is $14,684.
What is the Median Family Income in Medina?
Median Family Income in Medina is $26,591.
What is the Median Household income in Medina?
Median Household Income in Medina is $24,566.
What is Inequality or Gini Index in Medina?
Inequality or Gini Index in Medina is 0.59.
What is the Total Population of Medina?
Total Population of Medina is 4,436.
What is the Total Male Population of Medina?
Total Male Population of Medina is 1,963.
What is the Total Female Population of Medina?
Total Female Population of Medina is 2,473.
What is the Ratio of Males per 100 Females in Medina?
There are 79.38 Males per 100 Females in Medina.
What is the Ratio of Females per 100 Males in Medina?
There are 125.98 Females per 100 Males in Medina.
What is the Median Population Age in Medina?
Median Population Age in Medina is 24.4 Years.
What is the Average Family Size in Medina
Average Family Size in Medina is 3.7 People.
What is the Average Household Size in Medina
Average Household Size in Medina is 3.7 People.
How Large is the Labor Force in Medina?
There are 1,677 People in the Labor Forcein in Medina.
What is the Percentage of People in the Labor Force in Medina?
57.1% of People are in the Labor Force in Medina.
What is the Unemployment Rate in Medina?
Unemployment Rate in Medina is 14.7%.