Sandia, TX Map & Demographics
Sandia Map
Sandia Overview
$58,201
PER CAPITA INCOME
$250,001
AVG FAMILY INCOME
0.58
INEQUALITY / GINI INDEX
333
TOTAL POPULATION
185
MALE POPULATION
148
FEMALE POPULATION
125.00
MALES / 100 FEMALES
80.00
FEMALES / 100 MALES
57.4
MEDIAN AGE
3.4
AVG FAMILY SIZE
2.0
AVG HOUSEHOLD SIZE
221
LABOR FORCE [ PEOPLE ]
79.2%
PERCENT IN LABOR FORCE
Sandia Zip Codes
Sandia Area Codes
Income in Sandia
Income Overview in Sandia
| Characteristic | Number | Measure |
| Per Capita Income | 333 | $58,201 |
| Median Family Income | 64 | $250,001 |
| Mean Family Income | 64 | $223,603 |
| Median Household Income | 169 | $0 |
| Mean Household Income | 169 | $99,935 |
| Income Deficit | 64 | $0 |
| Wage / Income Gap (%) | 333 | 0.00% |
| Wage / Income Gap ($) | 333 | 100.00¢ per $1 |
| Gini / Inequality Index | 333 | 0.58 |
Earnings by Sex in Sandia
| Sex | Number | Average Earnings |
| Male | 163 (73.8%) | $0 |
| Female | 58 (26.2%) | $0 |
| Total | 221 (100.0%) | $0 |
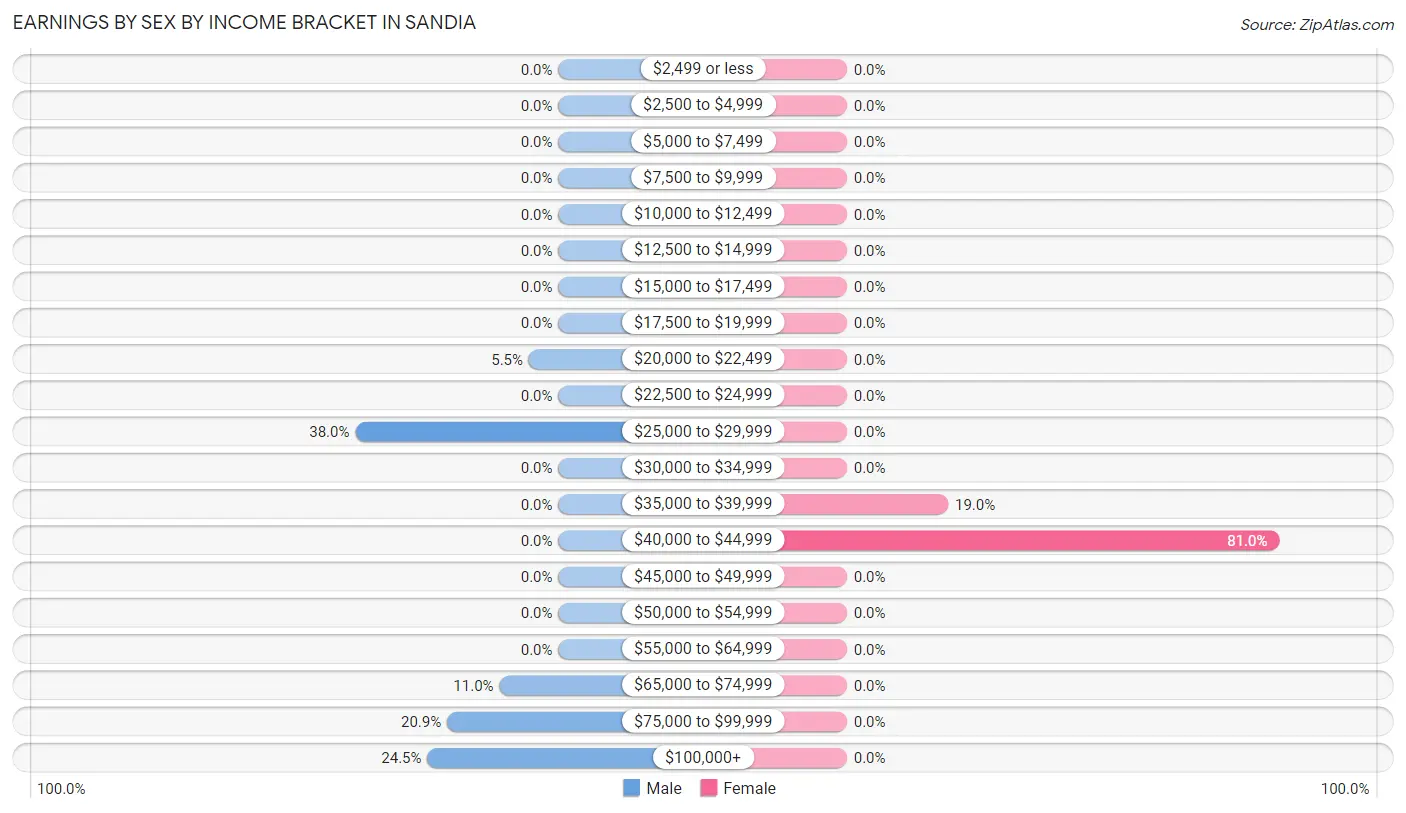
Earnings by Sex by Income Bracket in Sandia
The most common earnings brackets in Sandia are $25,000 to $29,999 for men (62 | 38.0%) and $40,000 to $44,999 for women (47 | 81.0%).
| Income | Male | Female |
| $2,499 or less | 0 (0.0%) | 0 (0.0%) |
| $2,500 to $4,999 | 0 (0.0%) | 0 (0.0%) |
| $5,000 to $7,499 | 0 (0.0%) | 0 (0.0%) |
| $7,500 to $9,999 | 0 (0.0%) | 0 (0.0%) |
| $10,000 to $12,499 | 0 (0.0%) | 0 (0.0%) |
| $12,500 to $14,999 | 0 (0.0%) | 0 (0.0%) |
| $15,000 to $17,499 | 0 (0.0%) | 0 (0.0%) |
| $17,500 to $19,999 | 0 (0.0%) | 0 (0.0%) |
| $20,000 to $22,499 | 9 (5.5%) | 0 (0.0%) |
| $22,500 to $24,999 | 0 (0.0%) | 0 (0.0%) |
| $25,000 to $29,999 | 62 (38.0%) | 0 (0.0%) |
| $30,000 to $34,999 | 0 (0.0%) | 0 (0.0%) |
| $35,000 to $39,999 | 0 (0.0%) | 11 (19.0%) |
| $40,000 to $44,999 | 0 (0.0%) | 47 (81.0%) |
| $45,000 to $49,999 | 0 (0.0%) | 0 (0.0%) |
| $50,000 to $54,999 | 0 (0.0%) | 0 (0.0%) |
| $55,000 to $64,999 | 0 (0.0%) | 0 (0.0%) |
| $65,000 to $74,999 | 18 (11.0%) | 0 (0.0%) |
| $75,000 to $99,999 | 34 (20.9%) | 0 (0.0%) |
| $100,000+ | 40 (24.5%) | 0 (0.0%) |
| Total | 163 (100.0%) | 58 (100.0%) |
Earnings by Sex by Educational Attainment in Sandia
| Educational Attainment | Male Income | Female Income |
| Less than High School | - | - |
| High School Diploma | - | - |
| College or Associate's Degree | - | - |
| Bachelor's Degree | - | - |
| Graduate Degree | - | - |
| Total | - | - |
Family Income in Sandia
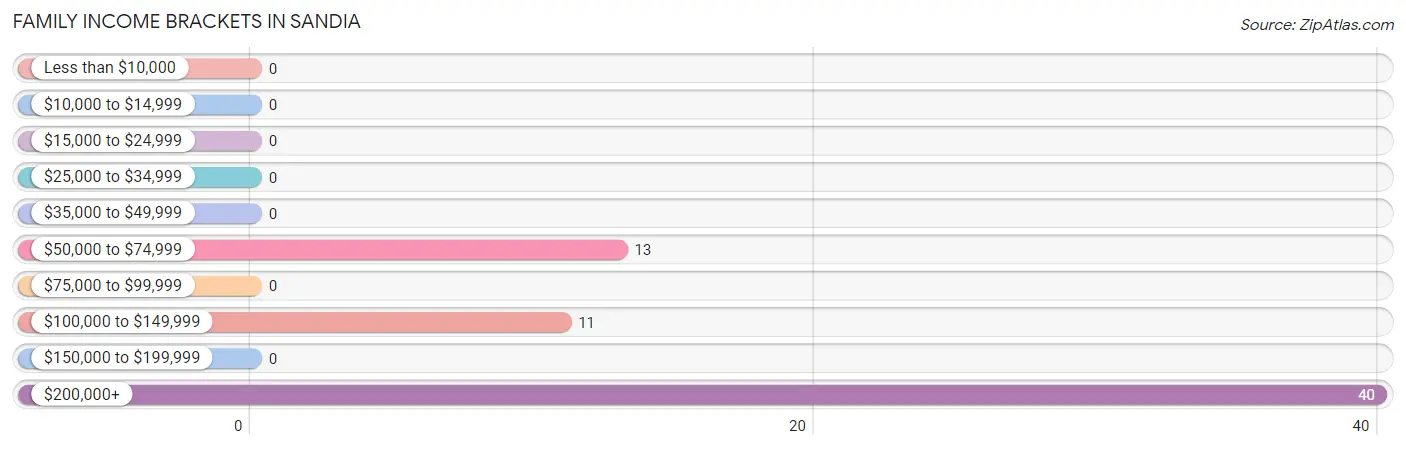
Family Income Brackets in Sandia
According to the Sandia family income data, there are 40 families falling into the $200,000+ income range, which is the most common income bracket and makes up 62.5% of all families.
| Income Bracket | # Families | % Families |
| Less than $10,000 | 0 | 0.0% |
| $10,000 to $14,999 | 0 | 0.0% |
| $15,000 to $24,999 | 0 | 0.0% |
| $25,000 to $34,999 | 0 | 0.0% |
| $35,000 to $49,999 | 0 | 0.0% |
| $50,000 to $74,999 | 13 | 20.3% |
| $75,000 to $99,999 | 0 | 0.0% |
| $100,000 to $149,999 | 11 | 17.2% |
| $150,000 to $199,999 | 0 | 0.0% |
| $200,000+ | 40 | 62.5% |
Family Income by Famaliy Size in Sandia
| Income Bracket | # Families | Median Income |
| 2-Person Families | 24 (37.5%) | $0 |
| 3-Person Families | 0 (0.0%) | $0 |
| 4-Person Families | 40 (62.5%) | $0 |
| 5-Person Families | 0 (0.0%) | $0 |
| 6-Person Families | 0 (0.0%) | $0 |
| 7+ Person Families | 0 (0.0%) | $0 |
| Total | 64 (100.0%) | $250,001 |
Family Income by Number of Earners in Sandia
| Number of Earners | # Families | Median Income |
| No Earners | 0 (0.0%) | $0 |
| 1 Earner | 24 (37.5%) | $0 |
| 2 Earners | 40 (62.5%) | $0 |
| 3+ Earners | 0 (0.0%) | $0 |
| Total | 64 (100.0%) | $250,001 |
Household Income in Sandia
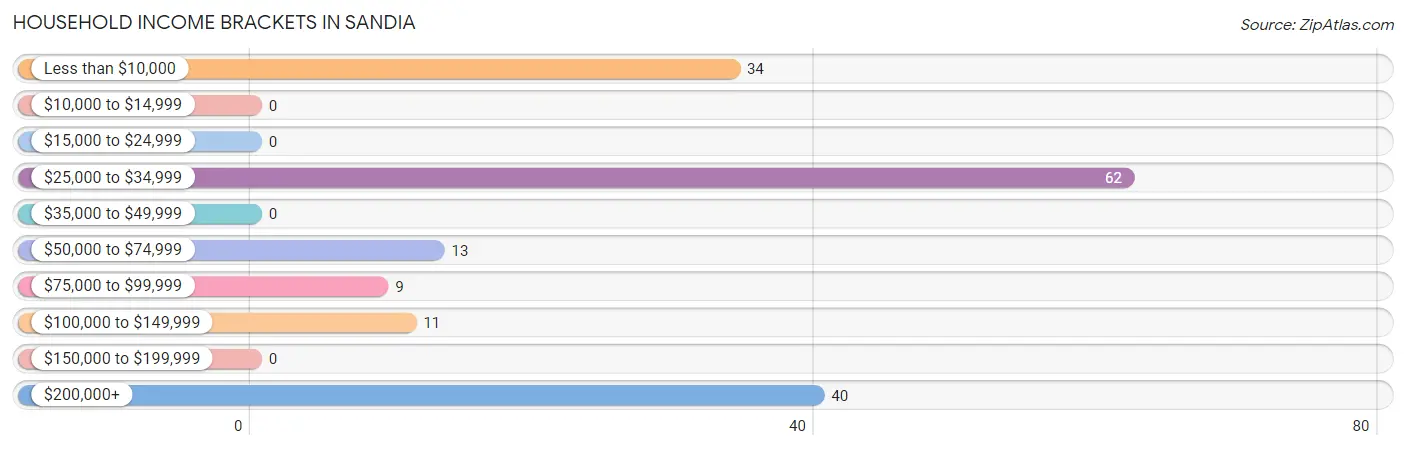
Household Income Brackets in Sandia
With 62 households falling in the category, the $25,000 to $34,999 income range is the most frequent in Sandia, accounting for 36.7% of all households.
| Income Bracket | # Households | % Households |
| Less than $10,000 | 34 | 20.1% |
| $10,000 to $14,999 | 0 | 0.0% |
| $15,000 to $24,999 | 0 | 0.0% |
| $25,000 to $34,999 | 62 | 36.7% |
| $35,000 to $49,999 | 0 | 0.0% |
| $50,000 to $74,999 | 13 | 7.7% |
| $75,000 to $99,999 | 9 | 5.3% |
| $100,000 to $149,999 | 11 | 6.5% |
| $150,000 to $199,999 | 0 | 0.0% |
| $200,000+ | 40 | 23.7% |
Household Income by Householder Age in Sandia
| Income Bracket | # Households | Median Income |
| 15 to 24 Years | 0 (0.0%) | $0 |
| 25 to 44 Years | 40 (23.7%) | $0 |
| 45 to 64 Years | 75 (44.4%) | $0 |
| 65+ Years | 54 (32.0%) | $0 |
| Total | 169 (100.0%) | $0 |
Poverty in Sandia
Income Below Poverty by Sex and Age in Sandia
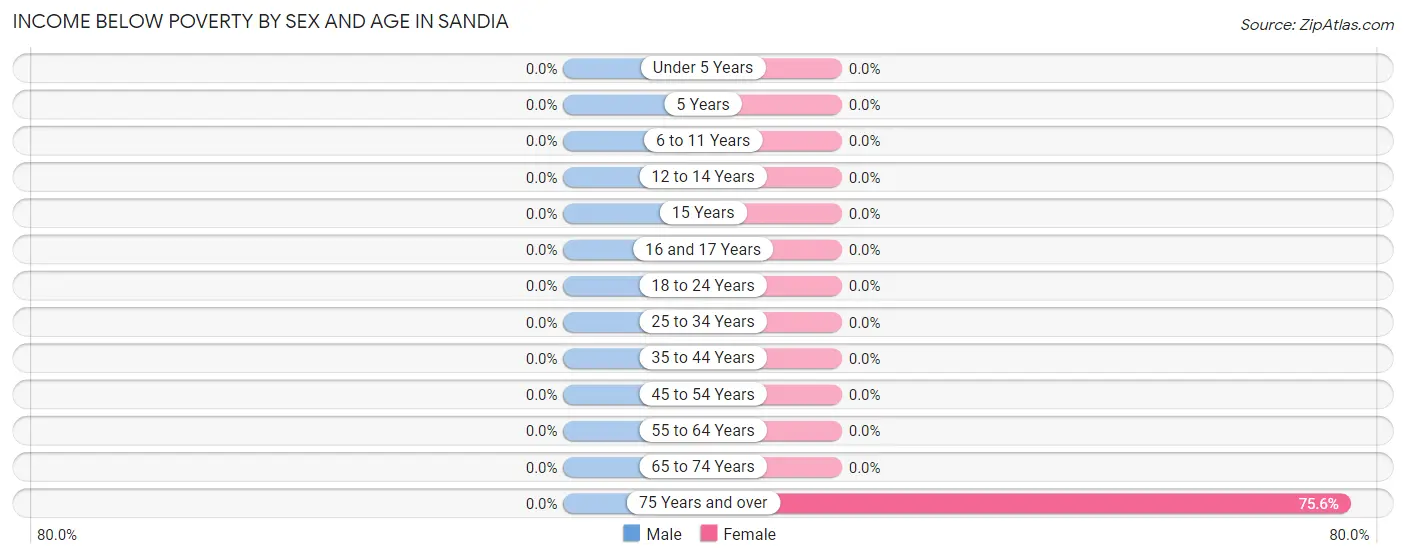
| Age Bracket | Male | Female |
| Under 5 Years | 0 (0.0%) | 0 (0.0%) |
| 5 Years | 0 (0.0%) | 0 (0.0%) |
| 6 to 11 Years | 0 (0.0%) | 0 (0.0%) |
| 12 to 14 Years | 0 (0.0%) | 0 (0.0%) |
| 15 Years | 0 (0.0%) | 0 (0.0%) |
| 16 and 17 Years | 0 (0.0%) | 0 (0.0%) |
| 18 to 24 Years | 0 (0.0%) | 0 (0.0%) |
| 25 to 34 Years | 0 (0.0%) | 0 (0.0%) |
| 35 to 44 Years | 0 (0.0%) | 0 (0.0%) |
| 45 to 54 Years | 0 (0.0%) | 0 (0.0%) |
| 55 to 64 Years | 0 (0.0%) | 0 (0.0%) |
| 65 to 74 Years | 0 (0.0%) | 0 (0.0%) |
| 75 Years and over | 0 (0.0%) | 34 (75.6%) |
| Total | 0 (0.0%) | 34 (23.0%) |
Income Above Poverty by Sex and Age in Sandia
According to the poverty statistics in Sandia, males aged 12 to 14 years and females aged 6 to 11 years are the age groups that are most secure financially, with 100.0% of males and 100.0% of females in these age groups living above the poverty line.
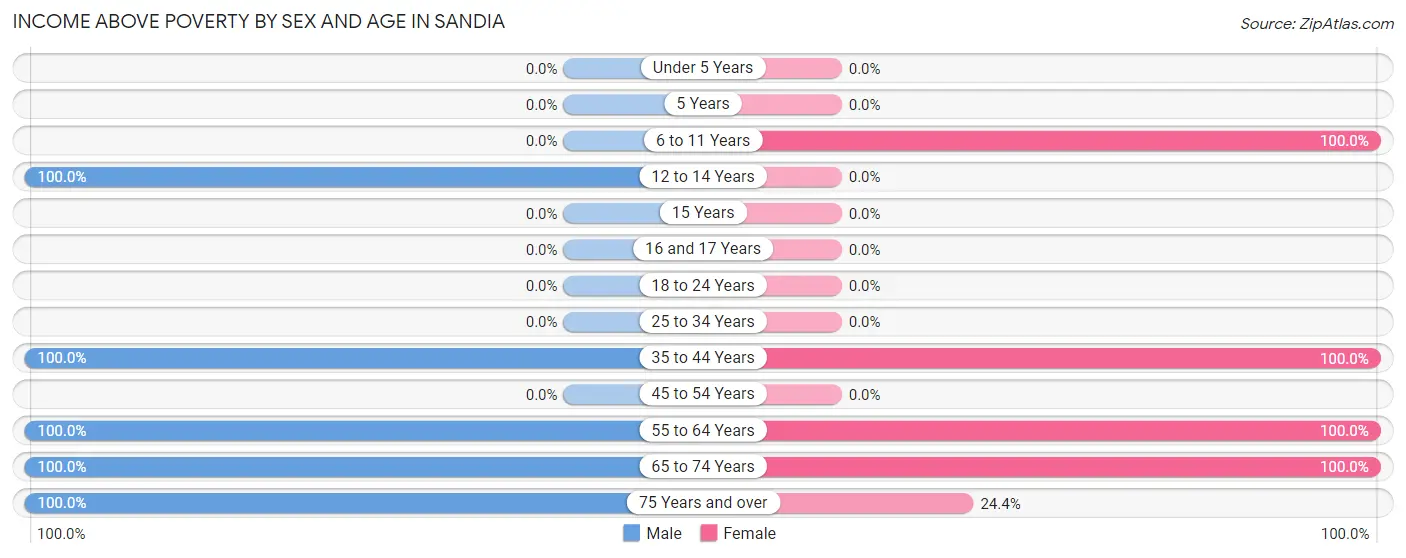
| Age Bracket | Male | Female |
| Under 5 Years | 0 (0.0%) | 0 (0.0%) |
| 5 Years | 0 (0.0%) | 0 (0.0%) |
| 6 to 11 Years | 0 (0.0%) | 32 (100.0%) |
| 12 to 14 Years | 22 (100.0%) | 0 (0.0%) |
| 15 Years | 0 (0.0%) | 0 (0.0%) |
| 16 and 17 Years | 0 (0.0%) | 0 (0.0%) |
| 18 to 24 Years | 0 (0.0%) | 0 (0.0%) |
| 25 to 34 Years | 0 (0.0%) | 0 (0.0%) |
| 35 to 44 Years | 40 (100.0%) | 47 (100.0%) |
| 45 to 54 Years | 0 (0.0%) | 0 (0.0%) |
| 55 to 64 Years | 96 (100.0%) | 13 (100.0%) |
| 65 to 74 Years | 18 (100.0%) | 11 (100.0%) |
| 75 Years and over | 9 (100.0%) | 11 (24.4%) |
| Total | 185 (100.0%) | 114 (77.0%) |
Income Below Poverty Among Married-Couple Families in Sandia
| Children | Above Poverty | Below Poverty |
| No Children | 24 (100.0%) | 0 (0.0%) |
| 1 or 2 Children | 40 (100.0%) | 0 (0.0%) |
| 3 or 4 Children | 0 (0.0%) | 0 (0.0%) |
| 5 or more Children | 0 (0.0%) | 0 (0.0%) |
| Total | 64 (100.0%) | 0 (0.0%) |
Income Below Poverty Among Single-Parent Households in Sandia
| Children | Single Father | Single Mother |
| No Children | 0 (0.0%) | 0 (0.0%) |
| 1 or 2 Children | 0 (0.0%) | 0 (0.0%) |
| 3 or 4 Children | 0 (0.0%) | 0 (0.0%) |
| 5 or more Children | 0 (0.0%) | 0 (0.0%) |
| Total | 0 (0.0%) | 0 (0.0%) |
Income Below Poverty Among Married-Couple vs Single-Parent Households in Sandia
| Children | Married-Couple Families | Single-Parent Households |
| No Children | 0 (0.0%) | 0 (0.0%) |
| 1 or 2 Children | 0 (0.0%) | 0 (0.0%) |
| 3 or 4 Children | 0 (0.0%) | 0 (0.0%) |
| 5 or more Children | 0 (0.0%) | 0 (0.0%) |
| Total | 0 (0.0%) | 0 (0.0%) |
Race in Sandia
The most populous races in Sandia are White / Caucasian (279 | 83.8%), Hispanic or Latino (116 | 34.8%), and Two or more Races (34 | 10.2%).
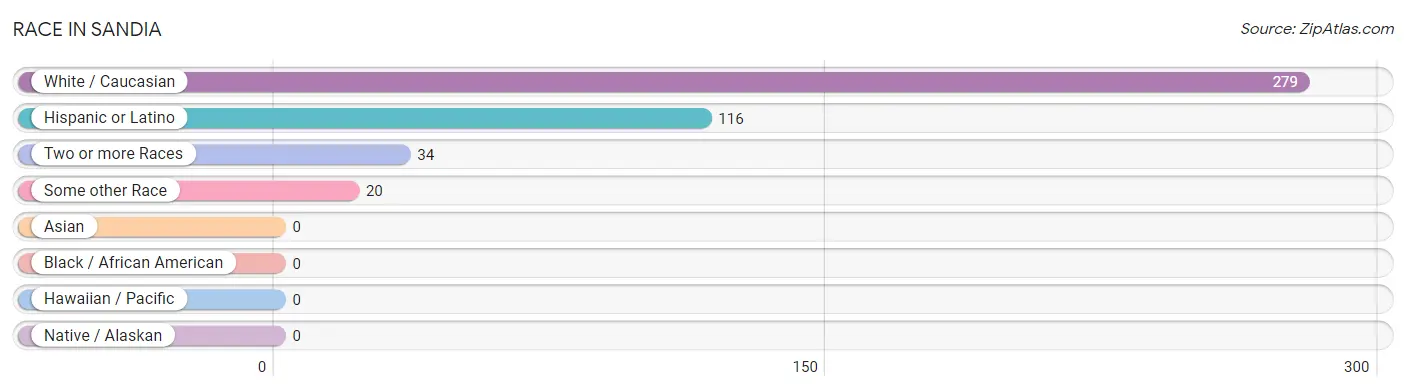
| Race | # Population | % Population |
| Asian | 0 | 0.0% |
| Black / African American | 0 | 0.0% |
| Hawaiian / Pacific | 0 | 0.0% |
| Hispanic or Latino | 116 | 34.8% |
| Native / Alaskan | 0 | 0.0% |
| White / Caucasian | 279 | 83.8% |
| Two or more Races | 34 | 10.2% |
| Some other Race | 20 | 6.0% |
| Total | 333 | 100.0% |
Ancestry in Sandia
The most populous ancestries reported in Sandia are Mexican (116 | 34.8%), Polish (101 | 30.3%), French (94 | 28.2%), Bhutanese (34 | 10.2%), and German (34 | 10.2%), together accounting for 113.8% of all Sandia residents.
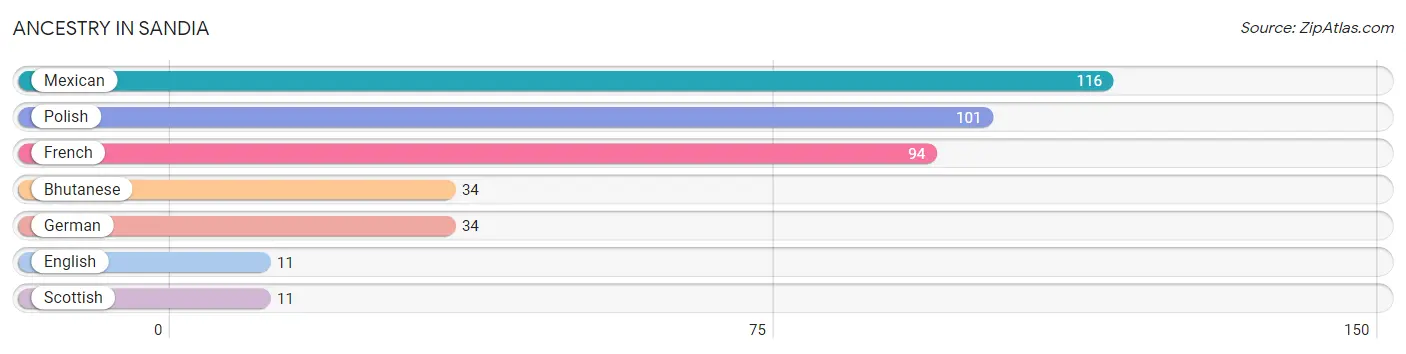
| Ancestry | # Population | % Population |
| Bhutanese | 34 | 10.2% |
| English | 11 | 3.3% |
| French | 94 | 28.2% |
| German | 34 | 10.2% |
| Mexican | 116 | 34.8% |
| Polish | 101 | 30.3% |
| Scottish | 11 | 3.3% | View All 7 Rows |
Immigrants in Sandia

| Immigration Origin | # Population | % Population | View All 0 Rows |
Sex and Age in Sandia
Sex and Age in Sandia
The most populous age groups in Sandia are 55 to 59 Years (96 | 51.9%) for men and 40 to 44 Years (47 | 31.8%) for women.
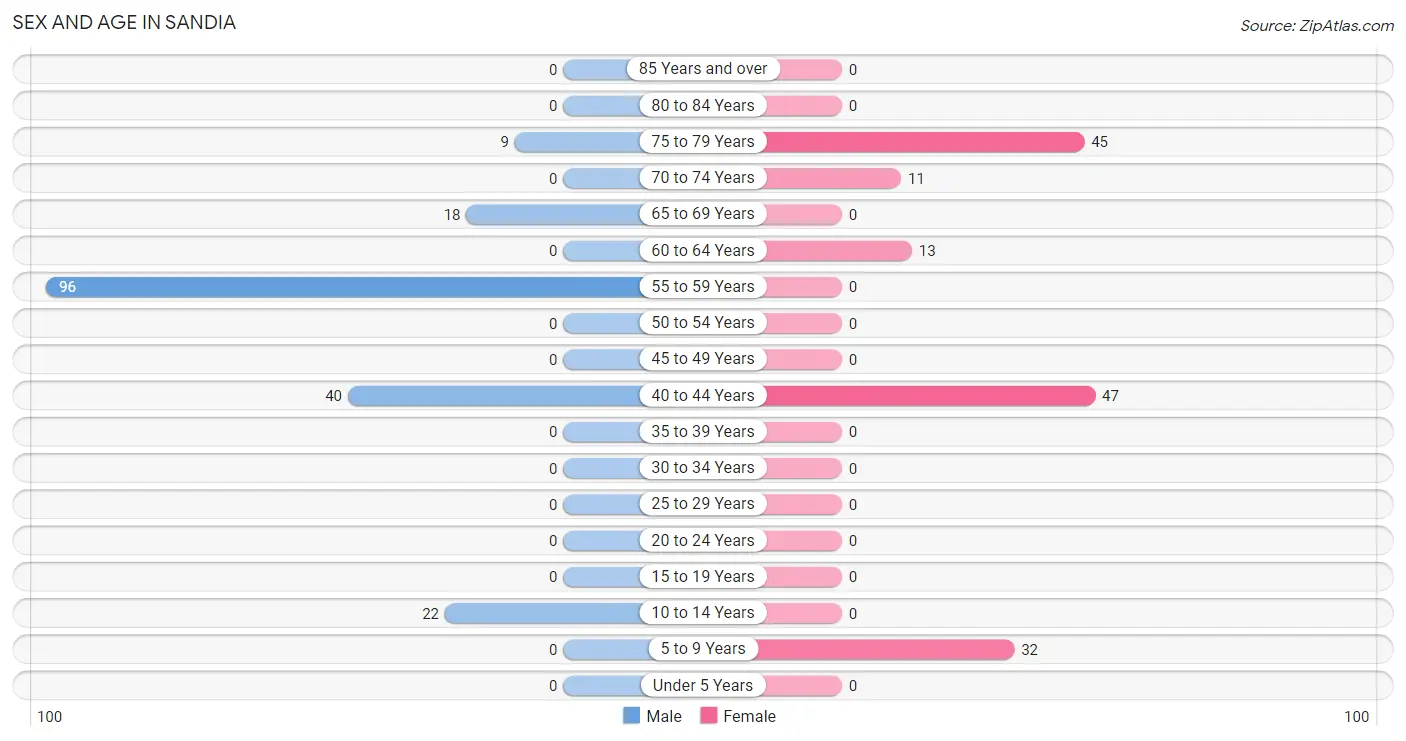
| Age Bracket | Male | Female |
| Under 5 Years | 0 (0.0%) | 0 (0.0%) |
| 5 to 9 Years | 0 (0.0%) | 32 (21.6%) |
| 10 to 14 Years | 22 (11.9%) | 0 (0.0%) |
| 15 to 19 Years | 0 (0.0%) | 0 (0.0%) |
| 20 to 24 Years | 0 (0.0%) | 0 (0.0%) |
| 25 to 29 Years | 0 (0.0%) | 0 (0.0%) |
| 30 to 34 Years | 0 (0.0%) | 0 (0.0%) |
| 35 to 39 Years | 0 (0.0%) | 0 (0.0%) |
| 40 to 44 Years | 40 (21.6%) | 47 (31.8%) |
| 45 to 49 Years | 0 (0.0%) | 0 (0.0%) |
| 50 to 54 Years | 0 (0.0%) | 0 (0.0%) |
| 55 to 59 Years | 96 (51.9%) | 0 (0.0%) |
| 60 to 64 Years | 0 (0.0%) | 13 (8.8%) |
| 65 to 69 Years | 18 (9.7%) | 0 (0.0%) |
| 70 to 74 Years | 0 (0.0%) | 11 (7.4%) |
| 75 to 79 Years | 9 (4.9%) | 45 (30.4%) |
| 80 to 84 Years | 0 (0.0%) | 0 (0.0%) |
| 85 Years and over | 0 (0.0%) | 0 (0.0%) |
| Total | 185 (100.0%) | 148 (100.0%) |
Families and Households in Sandia
Median Family Size in Sandia
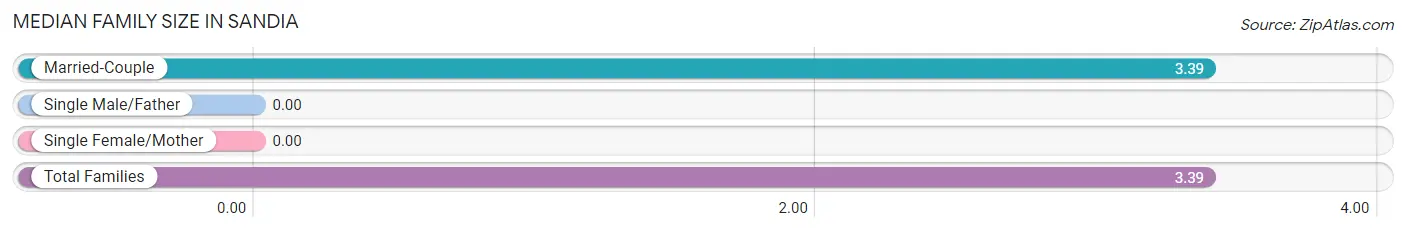
| Family Type | # Families | Family Size |
| Married-Couple | 64 (100.0%) | 3.39 |
| Single Male/Father | 0 (0.0%) | - |
| Single Female/Mother | 0 (0.0%) | - |
| Total Families | 64 (100.0%) | 3.39 |
Median Household Size in Sandia
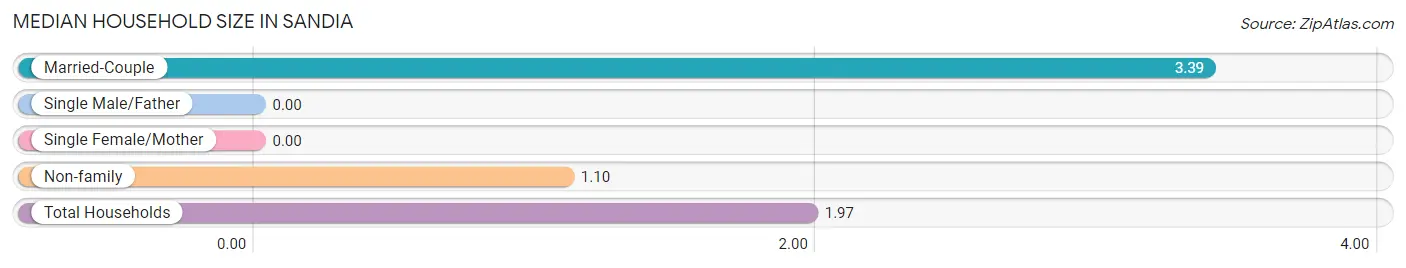
| Household Type | # Households | Household Size |
| Married-Couple | 64 (37.9%) | 3.39 |
| Single Male/Father | 0 (0.0%) | - |
| Single Female/Mother | 0 (0.0%) | - |
| Non-family | 105 (62.1%) | 1.10 |
| Total Households | 169 (100.0%) | 1.97 |
Household Size by Marriage Status in Sandia
Out of a total of 169 households in Sandia, 64 (37.9%) are family households, while 105 (62.1%) are nonfamily households. The most numerous type of family households are 4-person households, comprising 40, and the most common type of nonfamily households are 1-person households, comprising 96.
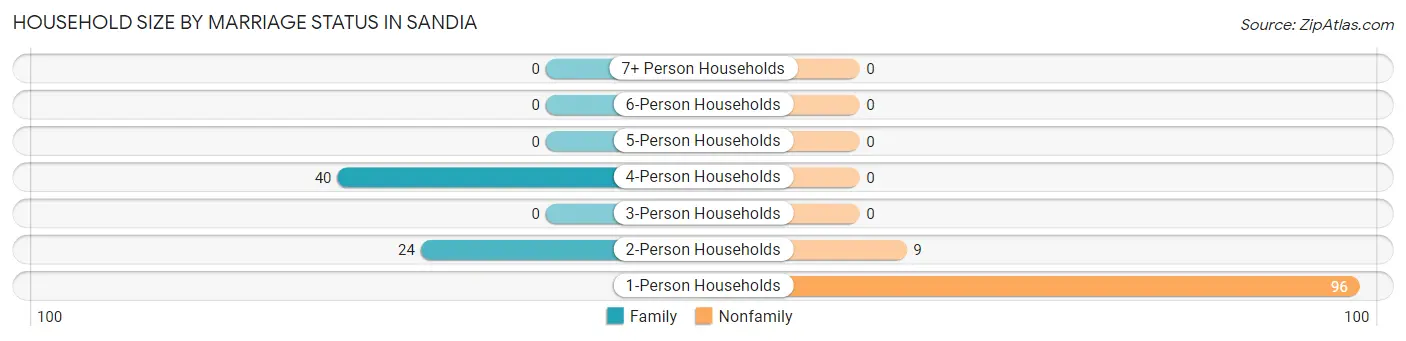
| Household Size | Family Households | Nonfamily Households |
| 1-Person Households | - | 96 (56.8%) |
| 2-Person Households | 24 (14.2%) | 9 (5.3%) |
| 3-Person Households | 0 (0.0%) | 0 (0.0%) |
| 4-Person Households | 40 (23.7%) | 0 (0.0%) |
| 5-Person Households | 0 (0.0%) | 0 (0.0%) |
| 6-Person Households | 0 (0.0%) | 0 (0.0%) |
| 7+ Person Households | 0 (0.0%) | 0 (0.0%) |
| Total | 64 (37.9%) | 105 (62.1%) |
Female Fertility in Sandia
Fertility by Age in Sandia
| Age Bracket | Women with Births | Births / 1,000 Women |
| 15 to 19 years | 0 (0.0%) | 0.0 |
| 20 to 34 years | 0 (0.0%) | 0.0 |
| 35 to 50 years | 0 (0.0%) | 0.0 |
| Total | 0 (0.0%) | 0.0 |
Fertility by Age by Marriage Status in Sandia
| Age Bracket | Married | Unmarried |
| 15 to 19 years | 0 (0.0%) | 0 (0.0%) |
| 20 to 34 years | 0 (0.0%) | 0 (0.0%) |
| 35 to 50 years | 0 (0.0%) | 0 (0.0%) |
| Total | 0 (0.0%) | 0 (0.0%) |
Fertility by Education in Sandia
| Educational Attainment | Women with Births | Births / 1,000 Women |
| Less than High School | 0 (0.0%) | 0.0 |
| High School Diploma | 0 (0.0%) | 0.0 |
| College or Associate's Degree | 0 (0.0%) | 0.0 |
| Bachelor's Degree | 0 (0.0%) | 0.0 |
| Graduate Degree | 0 (0.0%) | 0.0 |
| Total | 0 (0.0%) | 0.0 |
Fertility by Education by Marriage Status in Sandia
| Educational Attainment | Married | Unmarried |
| Less than High School | 0 (0.0%) | 0 (0.0%) |
| High School Diploma | 0 (0.0%) | 0 (0.0%) |
| College or Associate's Degree | 0 (0.0%) | 0 (0.0%) |
| Bachelor's Degree | 0 (0.0%) | 0 (0.0%) |
| Graduate Degree | 0 (0.0%) | 0 (0.0%) |
| Total | 0 (0.0%) | 0 (0.0%) |
Employment Characteristics in Sandia
Employment by Class of Employer in Sandia
Among the 221 employed individuals in Sandia, private company employees (107 | 48.4%), local government employees (62 | 28.1%), and state government employees (34 | 15.4%) make up the most common classes of employment.
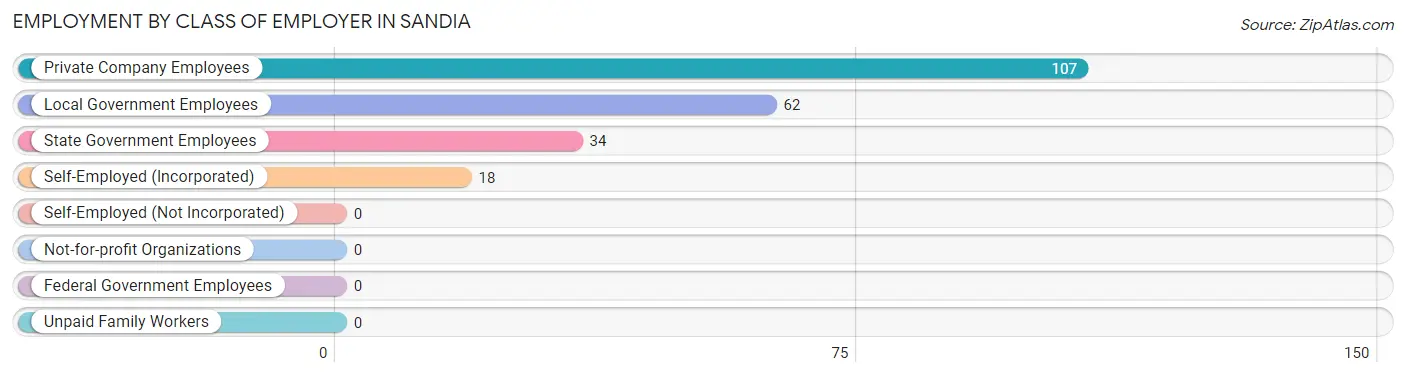
| Employer Class | # Employees | % Employees |
| Private Company Employees | 107 | 48.4% |
| Self-Employed (Incorporated) | 18 | 8.1% |
| Self-Employed (Not Incorporated) | 0 | 0.0% |
| Not-for-profit Organizations | 0 | 0.0% |
| Local Government Employees | 62 | 28.1% |
| State Government Employees | 34 | 15.4% |
| Federal Government Employees | 0 | 0.0% |
| Unpaid Family Workers | 0 | 0.0% |
| Total | 221 | 100.0% |
Employment Status by Age in Sandia
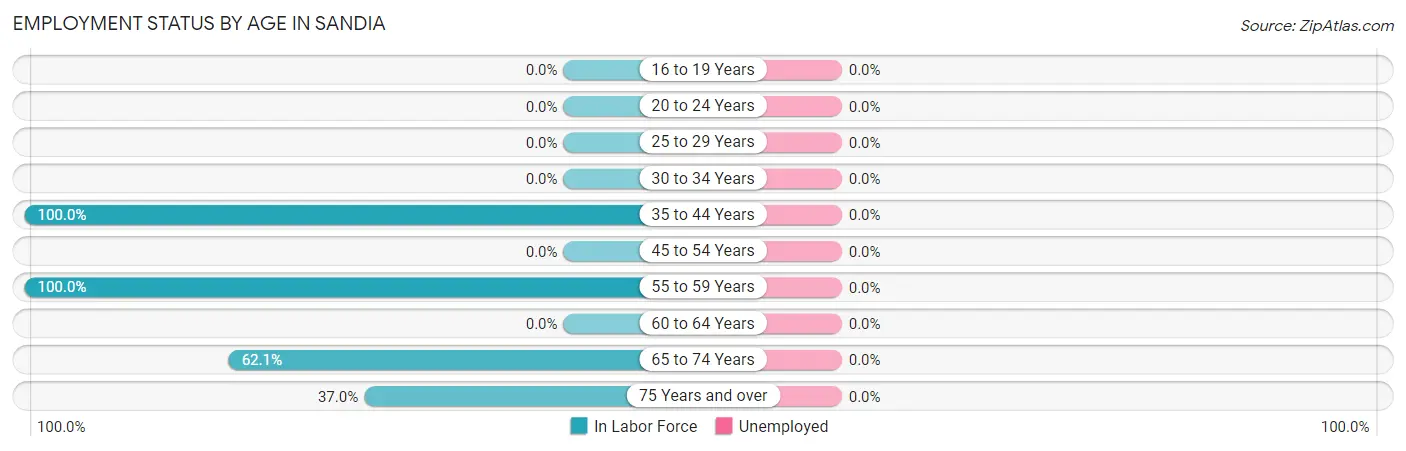
| Age Bracket | In Labor Force | Unemployed |
| 16 to 19 Years | 0 (0.0%) | 0 (0.0%) |
| 20 to 24 Years | 0 (0.0%) | 0 (0.0%) |
| 25 to 29 Years | 0 (0.0%) | 0 (0.0%) |
| 30 to 34 Years | 0 (0.0%) | 0 (0.0%) |
| 35 to 44 Years | 87 (100.0%) | 0 (0.0%) |
| 45 to 54 Years | 0 (0.0%) | 0 (0.0%) |
| 55 to 59 Years | 96 (100.0%) | 0 (0.0%) |
| 60 to 64 Years | 0 (0.0%) | 0 (0.0%) |
| 65 to 74 Years | 18 (62.1%) | 0 (0.0%) |
| 75 Years and over | 20 (37.0%) | 0 (0.0%) |
| Total | 221 (79.2%) | 0 (0.0%) |
Employment Status by Educational Attainment in Sandia
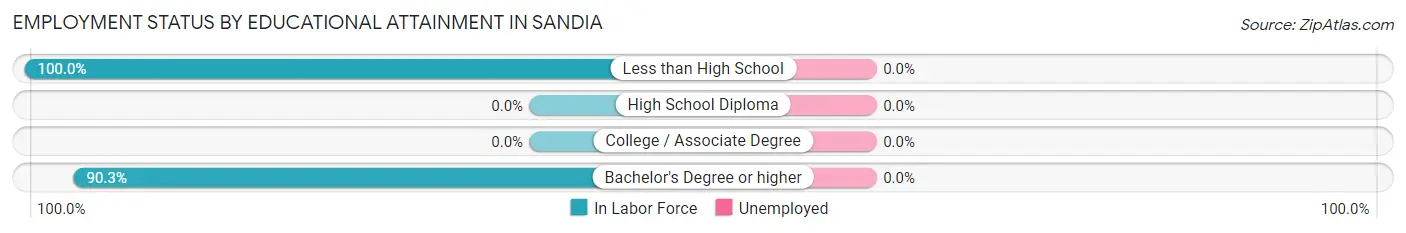
| Educational Attainment | In Labor Force | Unemployed |
| Less than High School | 62 (100.0%) | 0 (0.0%) |
| High School Diploma | 0 (0.0%) | 0 (0.0%) |
| College / Associate Degree | 0 (0.0%) | 0 (0.0%) |
| Bachelor's Degree or higher | 121 (90.3%) | 0 (0.0%) |
| Total | 183 (93.4%) | 0 (0.0%) |
Employment Occupations by Sex in Sandia
Management, Business, Science and Arts Occupations
The most common Management, Business, Science and Arts occupations in Sandia are Community & Social Service (81 | 36.6%), and Education Instruction & Library (81 | 36.6%).
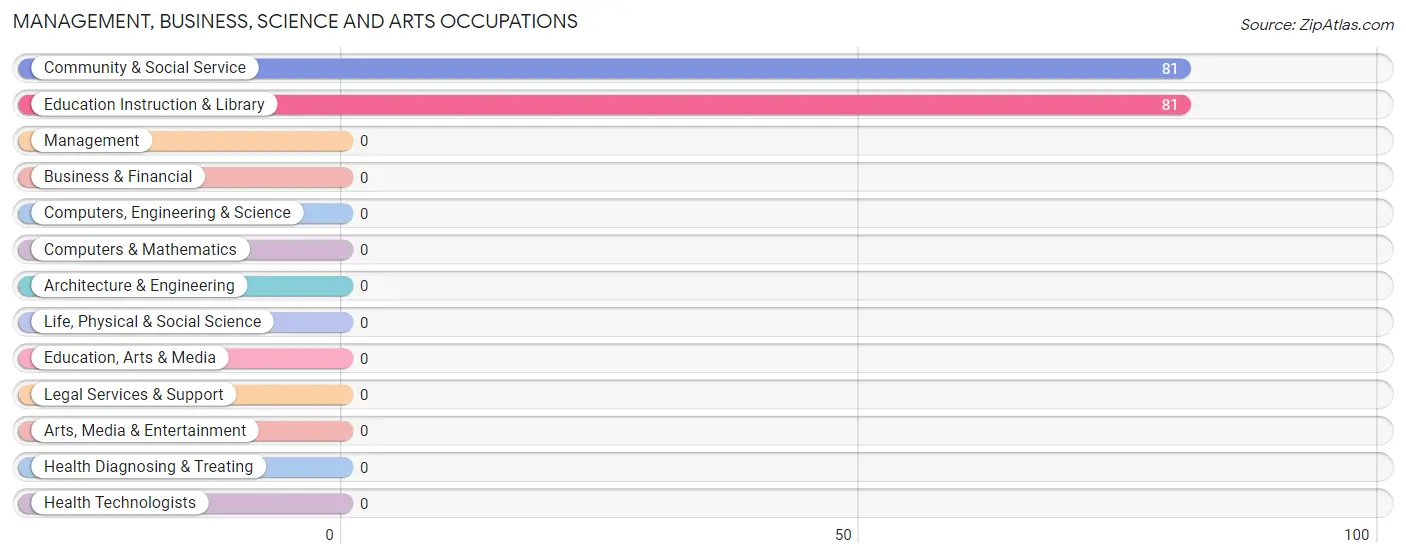
Management, Business, Science and Arts Occupations by Sex
Within the Management, Business, Science and Arts occupations in Sandia, the most male-oriented occupations are Community & Social Service (42.0%), and Education Instruction & Library (42.0%), while the most female-oriented occupations are Community & Social Service (58.0%), and Education Instruction & Library (58.0%).
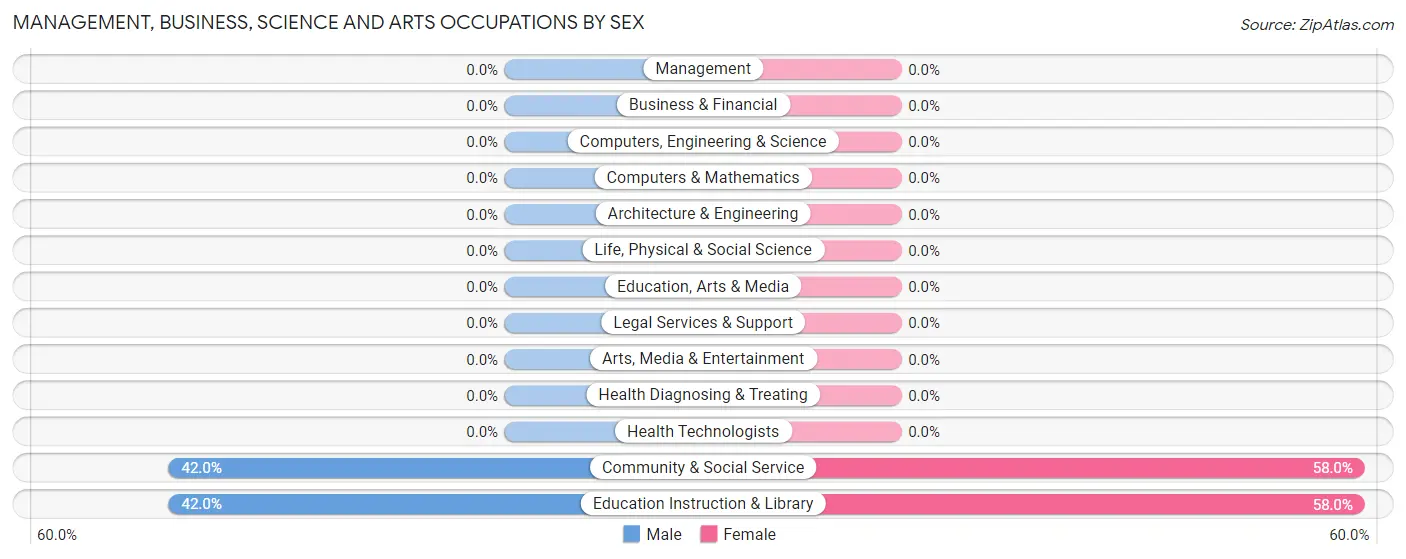
| Occupation | Male | Female |
| Management | 0 (0.0%) | 0 (0.0%) |
| Business & Financial | 0 (0.0%) | 0 (0.0%) |
| Computers, Engineering & Science | 0 (0.0%) | 0 (0.0%) |
| Computers & Mathematics | 0 (0.0%) | 0 (0.0%) |
| Architecture & Engineering | 0 (0.0%) | 0 (0.0%) |
| Life, Physical & Social Science | 0 (0.0%) | 0 (0.0%) |
| Community & Social Service | 34 (42.0%) | 47 (58.0%) |
| Education, Arts & Media | 0 (0.0%) | 0 (0.0%) |
| Legal Services & Support | 0 (0.0%) | 0 (0.0%) |
| Education Instruction & Library | 34 (42.0%) | 47 (58.0%) |
| Arts, Media & Entertainment | 0 (0.0%) | 0 (0.0%) |
| Health Diagnosing & Treating | 0 (0.0%) | 0 (0.0%) |
| Health Technologists | 0 (0.0%) | 0 (0.0%) |
| Total (Category) | 34 (42.0%) | 47 (58.0%) |
| Total (Overall) | 163 (73.8%) | 58 (26.2%) |
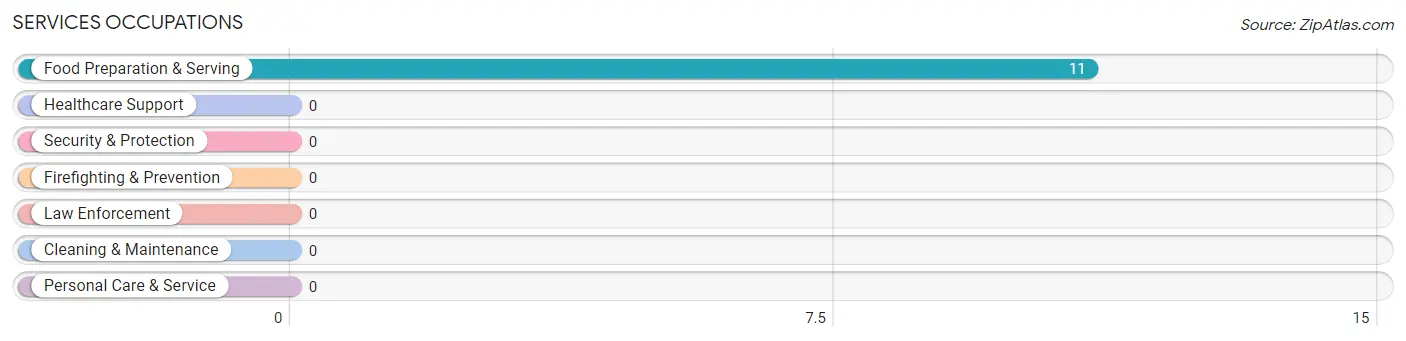
Services Occupations
The most common Services occupations in Sandia are , and Food Preparation & Serving (11 | 5.0%).
Services Occupations by Sex
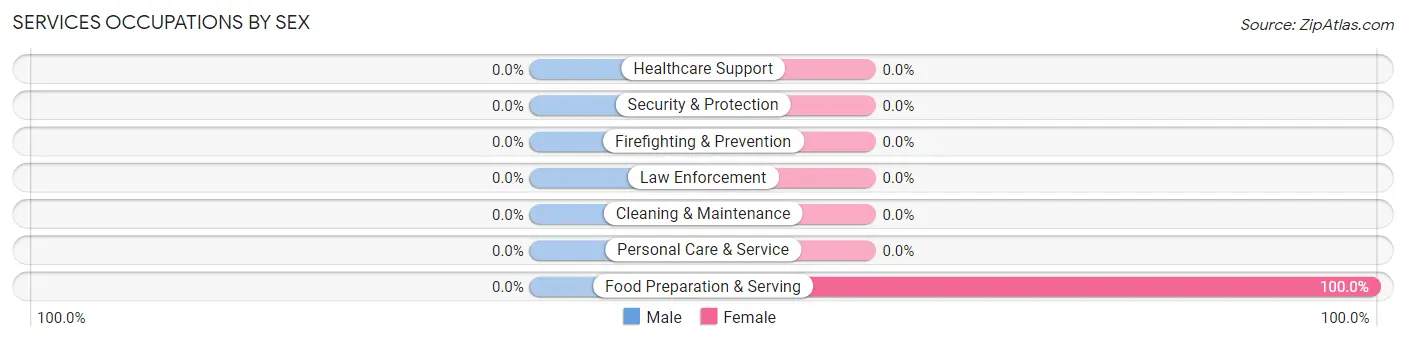
| Occupation | Male | Female |
| Healthcare Support | 0 (0.0%) | 0 (0.0%) |
| Security & Protection | 0 (0.0%) | 0 (0.0%) |
| Firefighting & Prevention | 0 (0.0%) | 0 (0.0%) |
| Law Enforcement | 0 (0.0%) | 0 (0.0%) |
| Food Preparation & Serving | 0 (0.0%) | 11 (100.0%) |
| Cleaning & Maintenance | 0 (0.0%) | 0 (0.0%) |
| Personal Care & Service | 0 (0.0%) | 0 (0.0%) |
| Total (Category) | 0 (0.0%) | 11 (100.0%) |
| Total (Overall) | 163 (73.8%) | 58 (26.2%) |
Sales and Office Occupations
Sales and Office Occupations by Sex
| Occupation | Male | Female |
| Sales & Related | 0 (0.0%) | 0 (0.0%) |
| Office & Administration | 0 (0.0%) | 0 (0.0%) |
| Total (Category) | 0 (0.0%) | 0 (0.0%) |
| Total (Overall) | 163 (73.8%) | 58 (26.2%) |
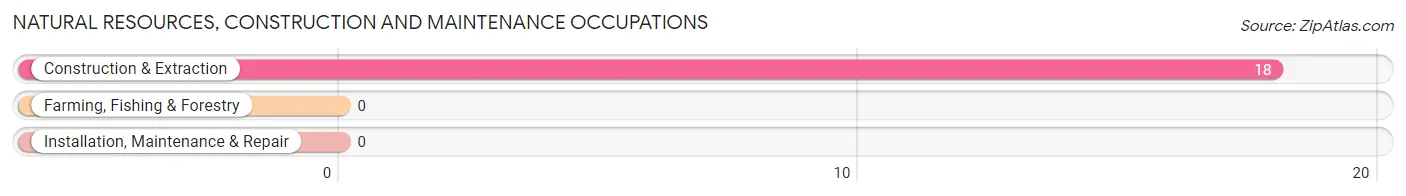
Natural Resources, Construction and Maintenance Occupations
The most common Natural Resources, Construction and Maintenance occupations in Sandia are , and Construction & Extraction (18 | 8.1%).
Natural Resources, Construction and Maintenance Occupations by Sex
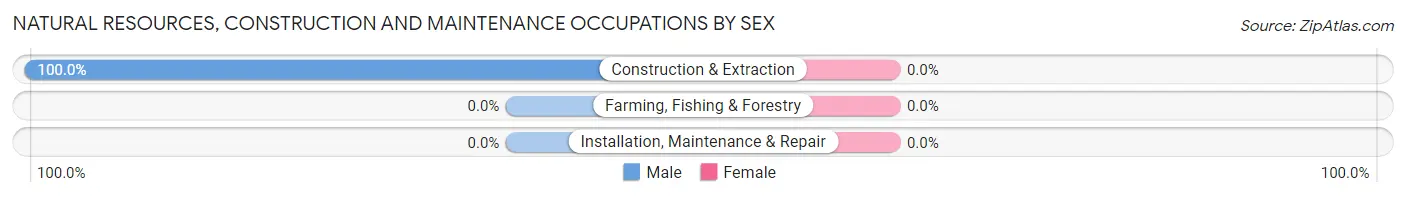
| Occupation | Male | Female |
| Farming, Fishing & Forestry | 0 (0.0%) | 0 (0.0%) |
| Construction & Extraction | 18 (100.0%) | 0 (0.0%) |
| Installation, Maintenance & Repair | 0 (0.0%) | 0 (0.0%) |
| Total (Category) | 18 (100.0%) | 0 (0.0%) |
| Total (Overall) | 163 (73.8%) | 58 (26.2%) |
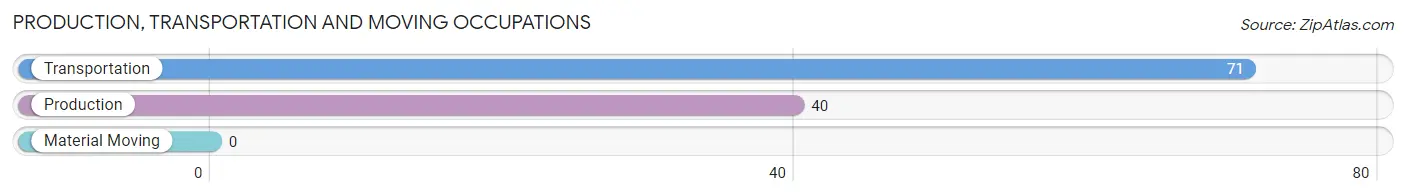
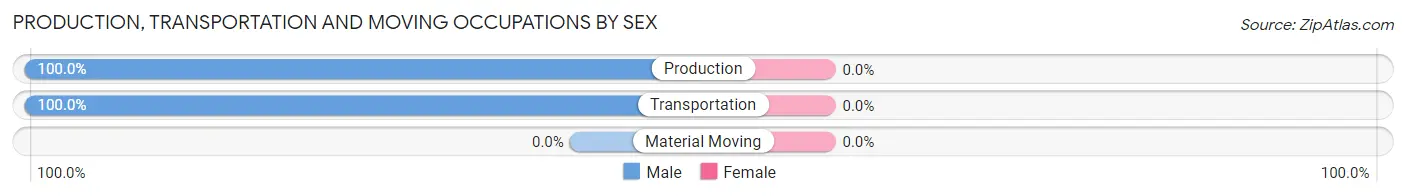
Production, Transportation and Moving Occupations
The most common Production, Transportation and Moving occupations in Sandia are Transportation (71 | 32.1%), and Production (40 | 18.1%).
Production, Transportation and Moving Occupations by Sex
| Occupation | Male | Female |
| Production | 40 (100.0%) | 0 (0.0%) |
| Transportation | 71 (100.0%) | 0 (0.0%) |
| Material Moving | 0 (0.0%) | 0 (0.0%) |
| Total (Category) | 111 (100.0%) | 0 (0.0%) |
| Total (Overall) | 163 (73.8%) | 58 (26.2%) |
Employment Industries by Sex in Sandia
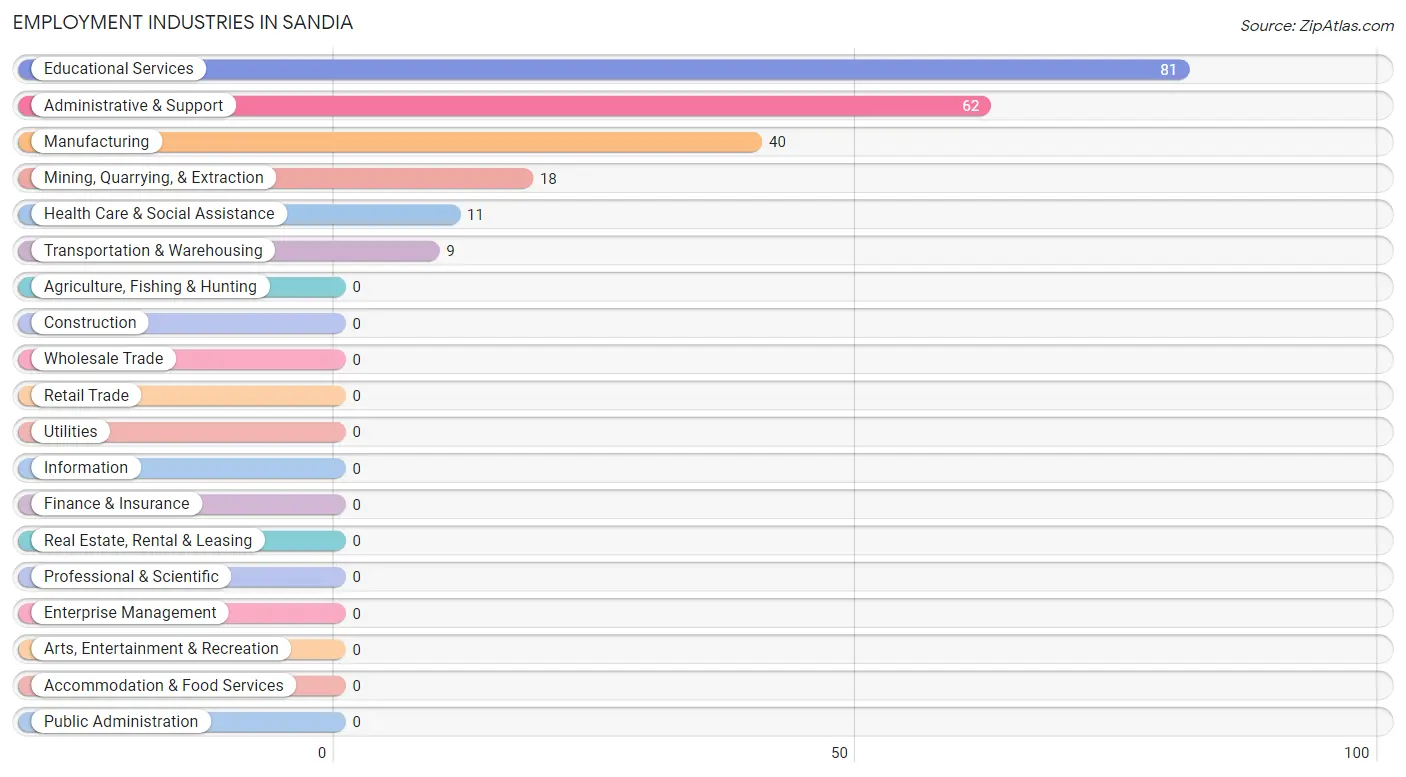
Employment Industries in Sandia
The major employment industries in Sandia include Educational Services (81 | 36.6%), Administrative & Support (62 | 28.1%), Manufacturing (40 | 18.1%), Mining, Quarrying, & Extraction (18 | 8.1%), and Health Care & Social Assistance (11 | 5.0%).
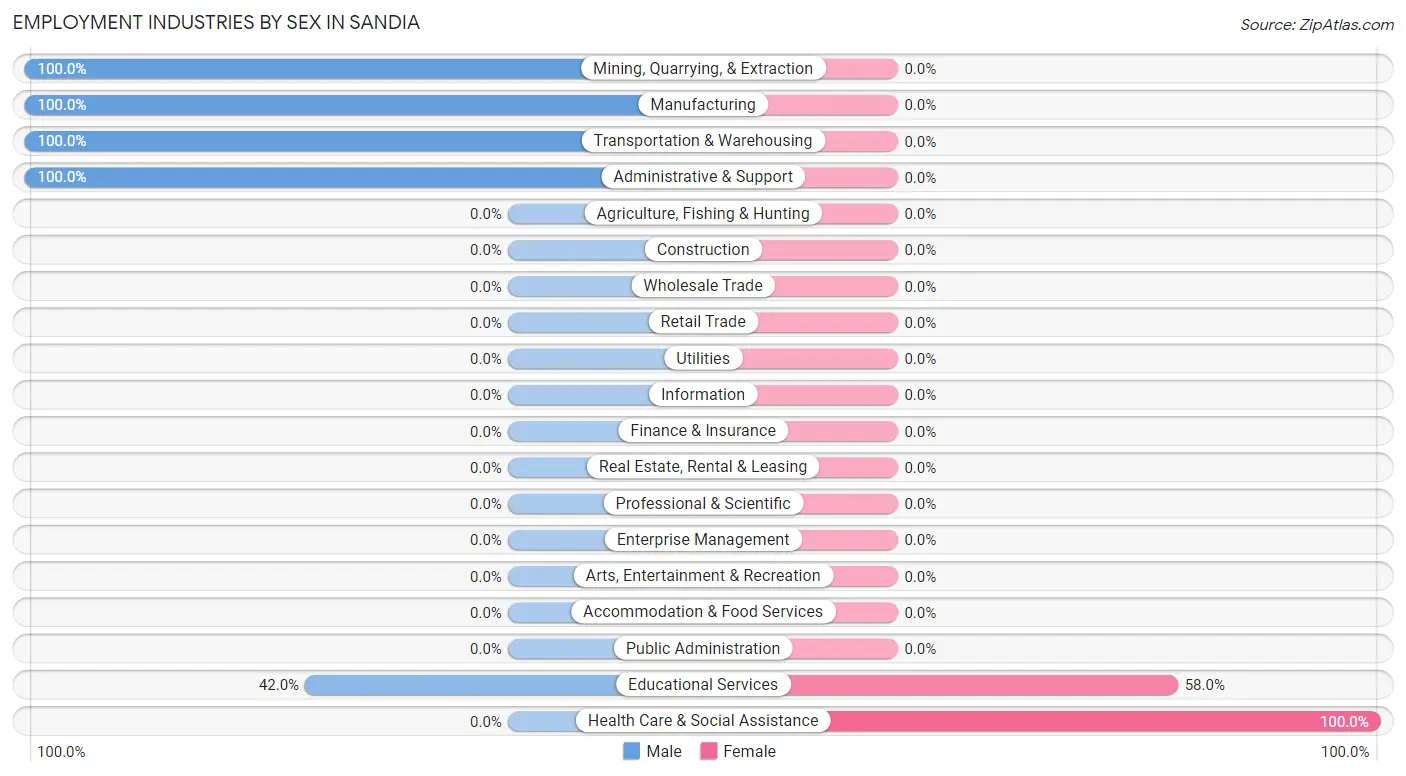
Employment Industries by Sex in Sandia
The Sandia industries that see more men than women are Mining, Quarrying, & Extraction (100.0%), Manufacturing (100.0%), and Transportation & Warehousing (100.0%), whereas the industries that tend to have a higher number of women are Health Care & Social Assistance (100.0%), and Educational Services (58.0%).
| Industry | Male | Female |
| Agriculture, Fishing & Hunting | 0 (0.0%) | 0 (0.0%) |
| Mining, Quarrying, & Extraction | 18 (100.0%) | 0 (0.0%) |
| Construction | 0 (0.0%) | 0 (0.0%) |
| Manufacturing | 40 (100.0%) | 0 (0.0%) |
| Wholesale Trade | 0 (0.0%) | 0 (0.0%) |
| Retail Trade | 0 (0.0%) | 0 (0.0%) |
| Transportation & Warehousing | 9 (100.0%) | 0 (0.0%) |
| Utilities | 0 (0.0%) | 0 (0.0%) |
| Information | 0 (0.0%) | 0 (0.0%) |
| Finance & Insurance | 0 (0.0%) | 0 (0.0%) |
| Real Estate, Rental & Leasing | 0 (0.0%) | 0 (0.0%) |
| Professional & Scientific | 0 (0.0%) | 0 (0.0%) |
| Enterprise Management | 0 (0.0%) | 0 (0.0%) |
| Administrative & Support | 62 (100.0%) | 0 (0.0%) |
| Educational Services | 34 (42.0%) | 47 (58.0%) |
| Health Care & Social Assistance | 0 (0.0%) | 11 (100.0%) |
| Arts, Entertainment & Recreation | 0 (0.0%) | 0 (0.0%) |
| Accommodation & Food Services | 0 (0.0%) | 0 (0.0%) |
| Public Administration | 0 (0.0%) | 0 (0.0%) |
| Total | 163 (73.8%) | 58 (26.2%) |
Education in Sandia
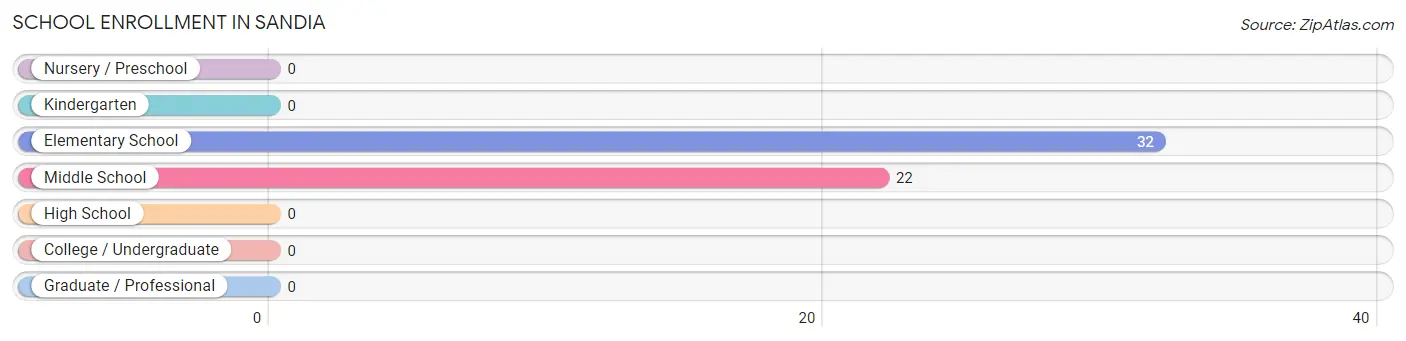
School Enrollment in Sandia
The most common levels of schooling among the 54 students in Sandia are elementary school (32 | 59.3%), and middle school (22 | 40.7%).
| School Level | # Students | % Students |
| Nursery / Preschool | 0 | 0.0% |
| Kindergarten | 0 | 0.0% |
| Elementary School | 32 | 59.3% |
| Middle School | 22 | 40.7% |
| High School | 0 | 0.0% |
| College / Undergraduate | 0 | 0.0% |
| Graduate / Professional | 0 | 0.0% |
| Total | 54 | 100.0% |
School Enrollment by Age by Funding Source in Sandia
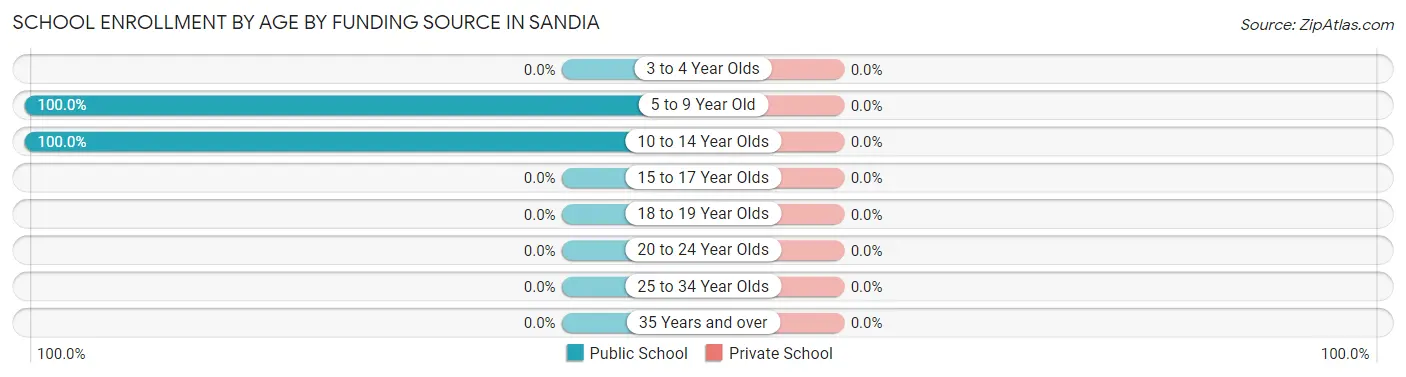
| Age Bracket | Public School | Private School |
| 3 to 4 Year Olds | 0 (0.0%) | 0 (0.0%) |
| 5 to 9 Year Old | 32 (100.0%) | 0 (0.0%) |
| 10 to 14 Year Olds | 22 (100.0%) | 0 (0.0%) |
| 15 to 17 Year Olds | 0 (0.0%) | 0 (0.0%) |
| 18 to 19 Year Olds | 0 (0.0%) | 0 (0.0%) |
| 20 to 24 Year Olds | 0 (0.0%) | 0 (0.0%) |
| 25 to 34 Year Olds | 0 (0.0%) | 0 (0.0%) |
| 35 Years and over | 0 (0.0%) | 0 (0.0%) |
| Total | 54 (100.0%) | 0 (0.0%) |
Educational Attainment by Field of Study in Sandia
Education (60 | 38.5%), bio, nature & agricultural (40 | 25.6%), literature & languages (34 | 21.8%), science & technology (11 | 7.0%), and liberal arts & history (11 | 7.0%) are the most common fields of study among 156 individuals in Sandia who have obtained a bachelor's degree or higher.
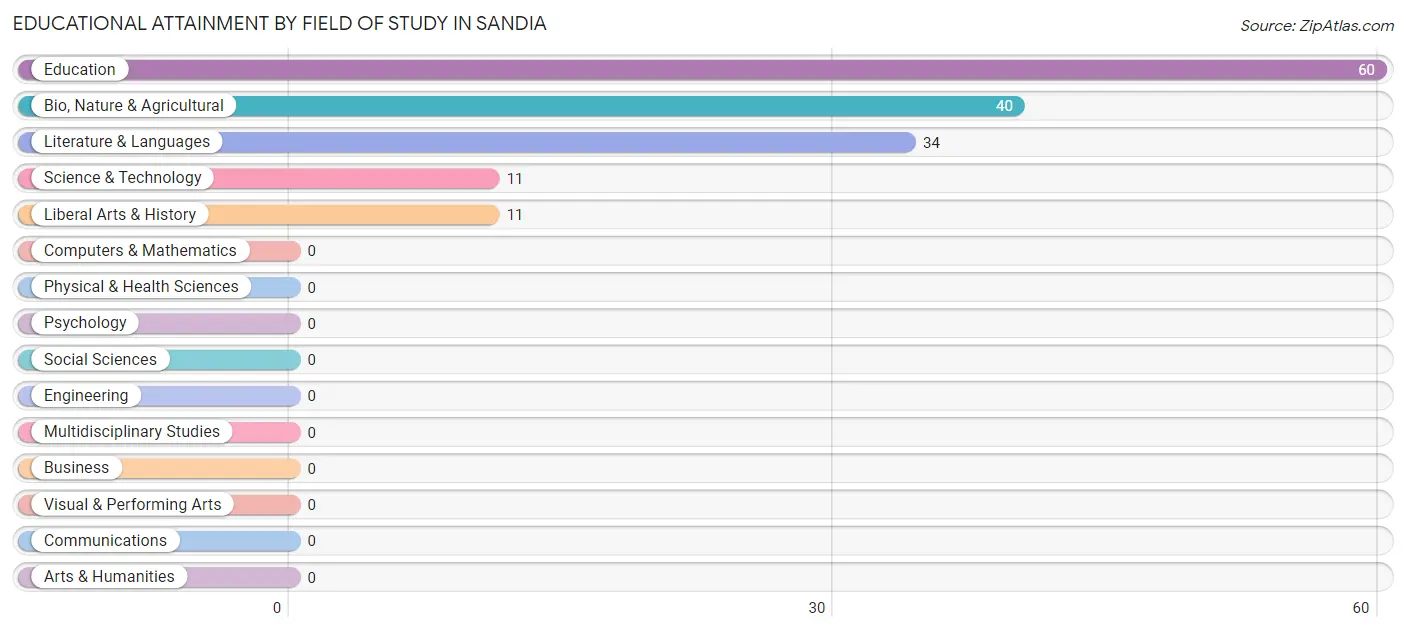
| Field of Study | # Graduates | % Graduates |
| Computers & Mathematics | 0 | 0.0% |
| Bio, Nature & Agricultural | 40 | 25.6% |
| Physical & Health Sciences | 0 | 0.0% |
| Psychology | 0 | 0.0% |
| Social Sciences | 0 | 0.0% |
| Engineering | 0 | 0.0% |
| Multidisciplinary Studies | 0 | 0.0% |
| Science & Technology | 11 | 7.0% |
| Business | 0 | 0.0% |
| Education | 60 | 38.5% |
| Literature & Languages | 34 | 21.8% |
| Liberal Arts & History | 11 | 7.0% |
| Visual & Performing Arts | 0 | 0.0% |
| Communications | 0 | 0.0% |
| Arts & Humanities | 0 | 0.0% |
| Total | 156 | 100.0% |
Transportation & Commute in Sandia
Vehicle Availability by Sex in Sandia
The most prevalent vehicle ownership categories in Sandia are males with 2 vehicles (105, accounting for 64.4%) and females with 2 vehicles (11, making up 181.0%).
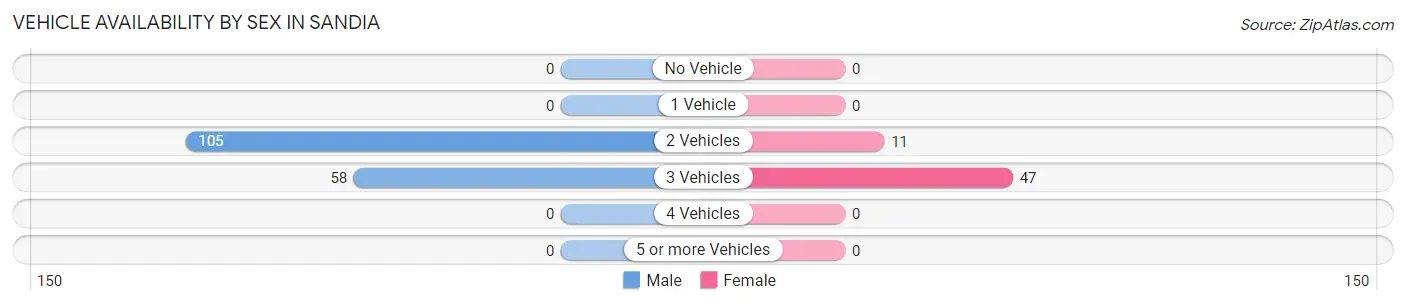
| Vehicles Available | Male | Female |
| No Vehicle | 0 (0.0%) | 0 (0.0%) |
| 1 Vehicle | 0 (0.0%) | 0 (0.0%) |
| 2 Vehicles | 105 (64.4%) | 11 (19.0%) |
| 3 Vehicles | 58 (35.6%) | 47 (81.0%) |
| 4 Vehicles | 0 (0.0%) | 0 (0.0%) |
| 5 or more Vehicles | 0 (0.0%) | 0 (0.0%) |
| Total | 163 (100.0%) | 58 (100.0%) |
Commute Time in Sandia
The most frequently occuring commute durations in Sandia are 30 to 34 minutes (80 commuters, 36.2%), 10 to 14 minutes (47 commuters, 21.3%), and 40 to 44 minutes (40 commuters, 18.1%).
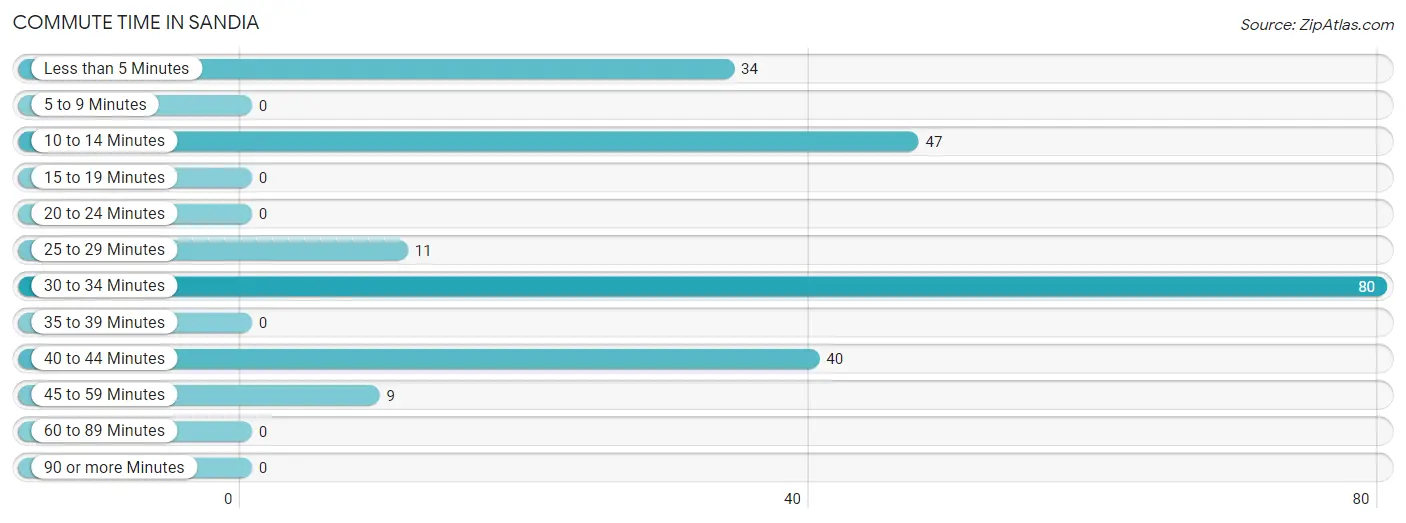
| Commute Time | # Commuters | % Commuters |
| Less than 5 Minutes | 34 | 15.4% |
| 5 to 9 Minutes | 0 | 0.0% |
| 10 to 14 Minutes | 47 | 21.3% |
| 15 to 19 Minutes | 0 | 0.0% |
| 20 to 24 Minutes | 0 | 0.0% |
| 25 to 29 Minutes | 11 | 5.0% |
| 30 to 34 Minutes | 80 | 36.2% |
| 35 to 39 Minutes | 0 | 0.0% |
| 40 to 44 Minutes | 40 | 18.1% |
| 45 to 59 Minutes | 9 | 4.1% |
| 60 to 89 Minutes | 0 | 0.0% |
| 90 or more Minutes | 0 | 0.0% |
Commute Time by Sex in Sandia
The most common commute times in Sandia are 30 to 34 minutes (80 commuters, 49.1%) for males and 10 to 14 minutes (47 commuters, 81.0%) for females.
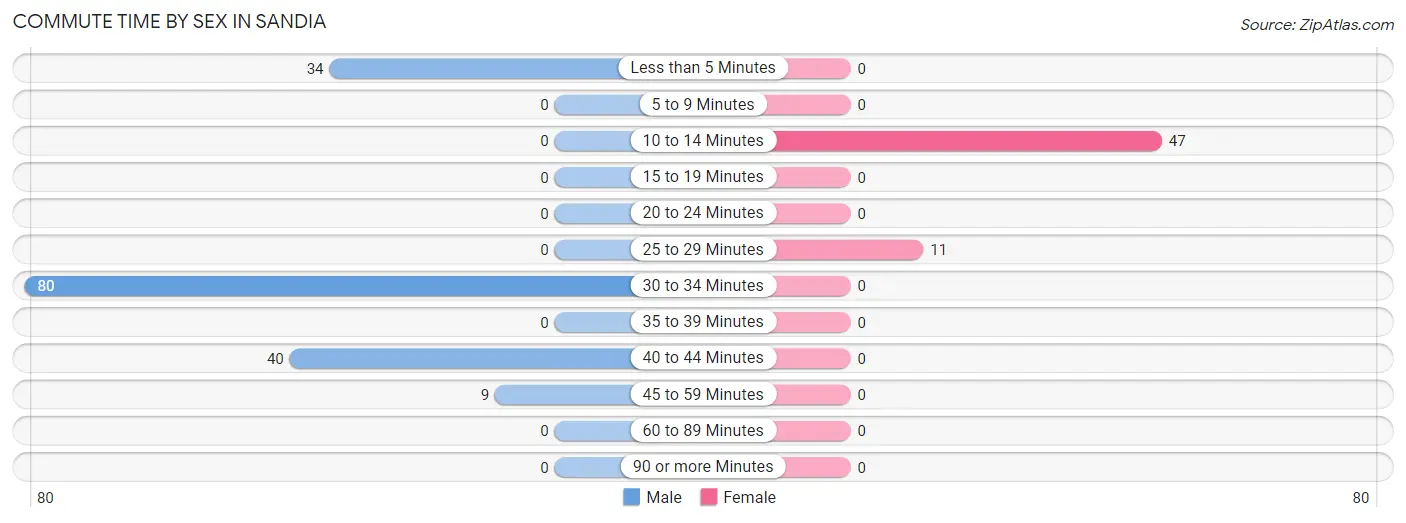
| Commute Time | Male | Female |
| Less than 5 Minutes | 34 (20.9%) | 0 (0.0%) |
| 5 to 9 Minutes | 0 (0.0%) | 0 (0.0%) |
| 10 to 14 Minutes | 0 (0.0%) | 47 (81.0%) |
| 15 to 19 Minutes | 0 (0.0%) | 0 (0.0%) |
| 20 to 24 Minutes | 0 (0.0%) | 0 (0.0%) |
| 25 to 29 Minutes | 0 (0.0%) | 11 (19.0%) |
| 30 to 34 Minutes | 80 (49.1%) | 0 (0.0%) |
| 35 to 39 Minutes | 0 (0.0%) | 0 (0.0%) |
| 40 to 44 Minutes | 40 (24.5%) | 0 (0.0%) |
| 45 to 59 Minutes | 9 (5.5%) | 0 (0.0%) |
| 60 to 89 Minutes | 0 (0.0%) | 0 (0.0%) |
| 90 or more Minutes | 0 (0.0%) | 0 (0.0%) |
Time of Departure to Work by Sex in Sandia
The most frequent times of departure to work in Sandia are 6:00 AM to 6:29 AM (62, 38.0%) for males and 7:00 AM to 7:29 AM (47, 81.0%) for females.
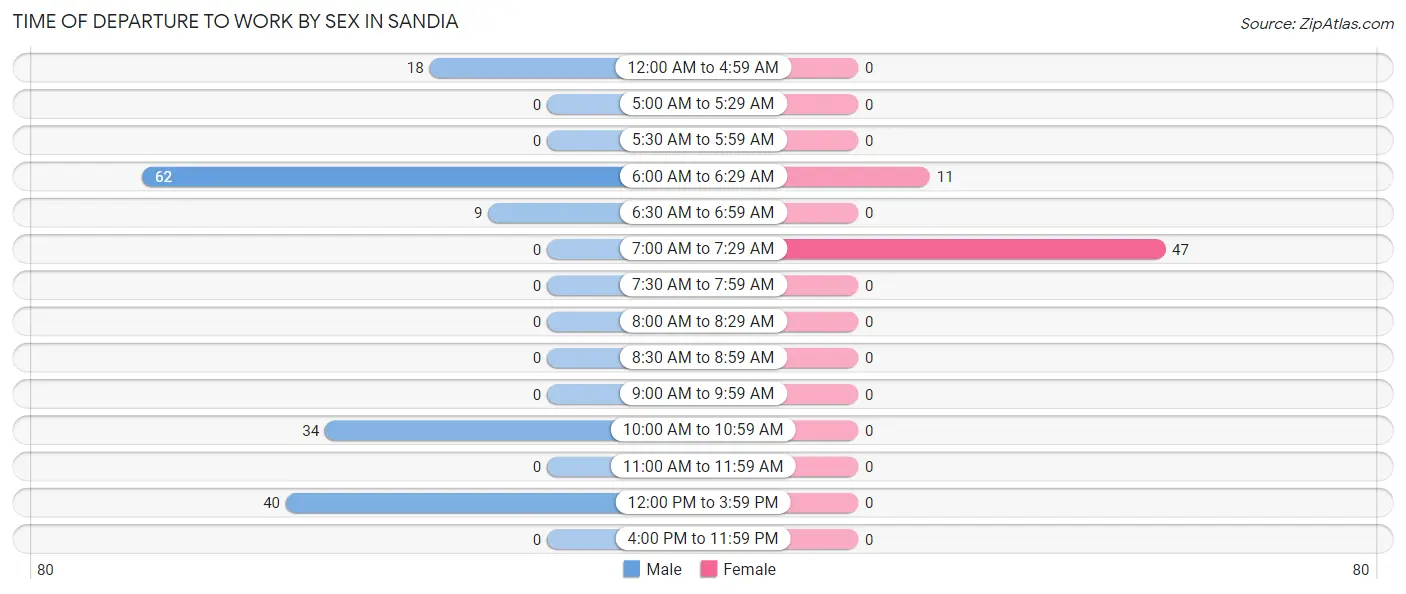
| Time of Departure | Male | Female |
| 12:00 AM to 4:59 AM | 18 (11.0%) | 0 (0.0%) |
| 5:00 AM to 5:29 AM | 0 (0.0%) | 0 (0.0%) |
| 5:30 AM to 5:59 AM | 0 (0.0%) | 0 (0.0%) |
| 6:00 AM to 6:29 AM | 62 (38.0%) | 11 (19.0%) |
| 6:30 AM to 6:59 AM | 9 (5.5%) | 0 (0.0%) |
| 7:00 AM to 7:29 AM | 0 (0.0%) | 47 (81.0%) |
| 7:30 AM to 7:59 AM | 0 (0.0%) | 0 (0.0%) |
| 8:00 AM to 8:29 AM | 0 (0.0%) | 0 (0.0%) |
| 8:30 AM to 8:59 AM | 0 (0.0%) | 0 (0.0%) |
| 9:00 AM to 9:59 AM | 0 (0.0%) | 0 (0.0%) |
| 10:00 AM to 10:59 AM | 34 (20.9%) | 0 (0.0%) |
| 11:00 AM to 11:59 AM | 0 (0.0%) | 0 (0.0%) |
| 12:00 PM to 3:59 PM | 40 (24.5%) | 0 (0.0%) |
| 4:00 PM to 11:59 PM | 0 (0.0%) | 0 (0.0%) |
| Total | 163 (100.0%) | 58 (100.0%) |
Housing Occupancy in Sandia
Occupancy by Ownership in Sandia
Of the total 169 dwellings in Sandia, owner-occupied units account for 135 (79.9%), while renter-occupied units make up 34 (20.1%).
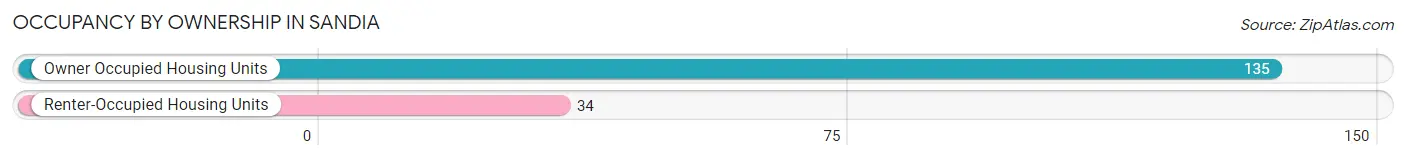
| Occupancy | # Housing Units | % Housing Units |
| Owner Occupied Housing Units | 135 | 79.9% |
| Renter-Occupied Housing Units | 34 | 20.1% |
| Total Occupied Housing Units | 169 | 100.0% |
Occupancy by Household Size in Sandia
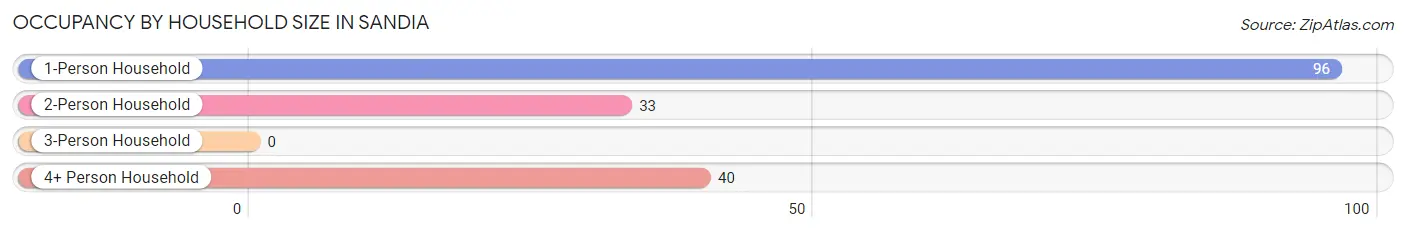
| Household Size | # Housing Units | % Housing Units |
| 1-Person Household | 96 | 56.8% |
| 2-Person Household | 33 | 19.5% |
| 3-Person Household | 0 | 0.0% |
| 4+ Person Household | 40 | 23.7% |
| Total Housing Units | 169 | 100.0% |
Occupancy by Ownership by Household Size in Sandia
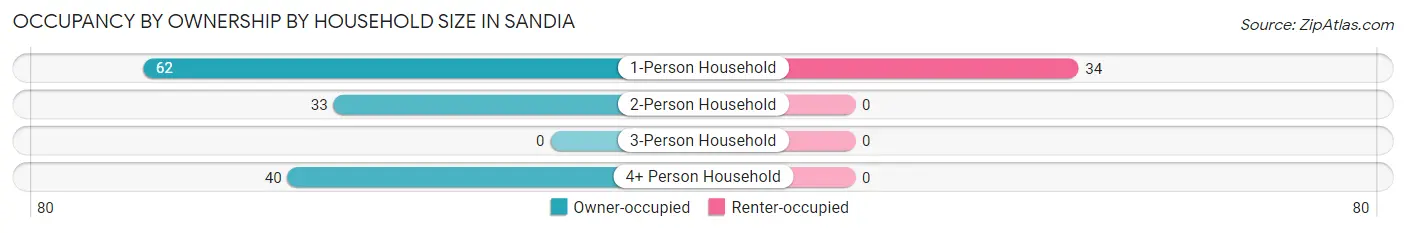
| Household Size | Owner-occupied | Renter-occupied |
| 1-Person Household | 62 (64.6%) | 34 (35.4%) |
| 2-Person Household | 33 (100.0%) | 0 (0.0%) |
| 3-Person Household | 0 (0.0%) | 0 (0.0%) |
| 4+ Person Household | 40 (100.0%) | 0 (0.0%) |
| Total Housing Units | 135 (79.9%) | 34 (20.1%) |
Occupancy by Educational Attainment in Sandia
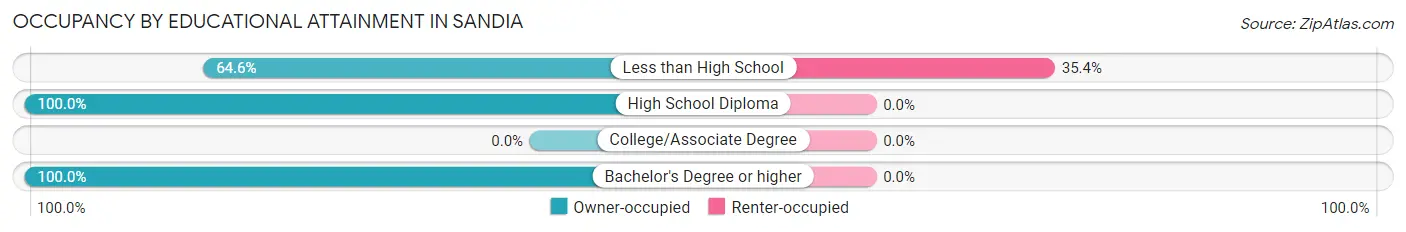
| Household Size | Owner-occupied | Renter-occupied |
| Less than High School | 62 (64.6%) | 34 (35.4%) |
| High School Diploma | 9 (100.0%) | 0 (0.0%) |
| College/Associate Degree | 0 (0.0%) | 0 (0.0%) |
| Bachelor's Degree or higher | 64 (100.0%) | 0 (0.0%) |
Occupancy by Age of Householder in Sandia
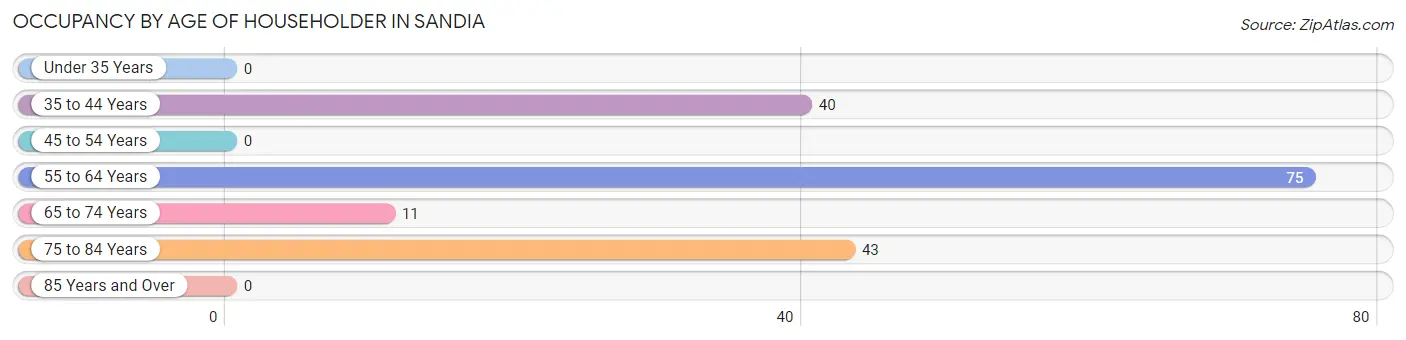
| Age Bracket | # Households | % Households |
| Under 35 Years | 0 | 0.0% |
| 35 to 44 Years | 40 | 23.7% |
| 45 to 54 Years | 0 | 0.0% |
| 55 to 64 Years | 75 | 44.4% |
| 65 to 74 Years | 11 | 6.5% |
| 75 to 84 Years | 43 | 25.4% |
| 85 Years and Over | 0 | 0.0% |
| Total | 169 | 100.0% |
Housing Finances in Sandia
Median Income by Occupancy in Sandia
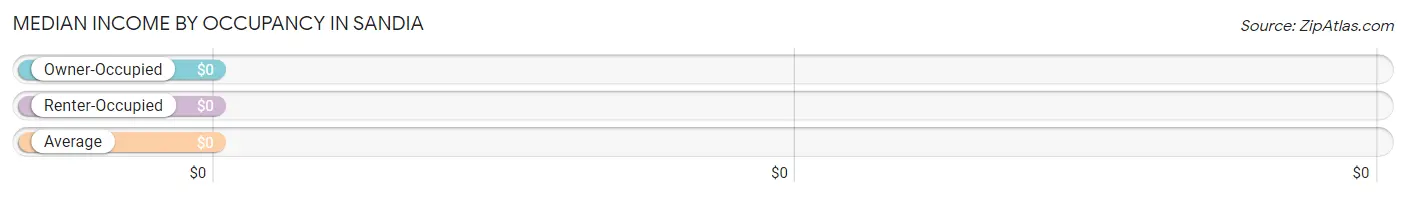
| Occupancy Type | # Households | Median Income |
| Owner-Occupied | 135 (79.9%) | $0 |
| Renter-Occupied | 34 (20.1%) | $0 |
| Average | 169 (100.0%) | $0 |
Occupancy by Householder Income Bracket in Sandia
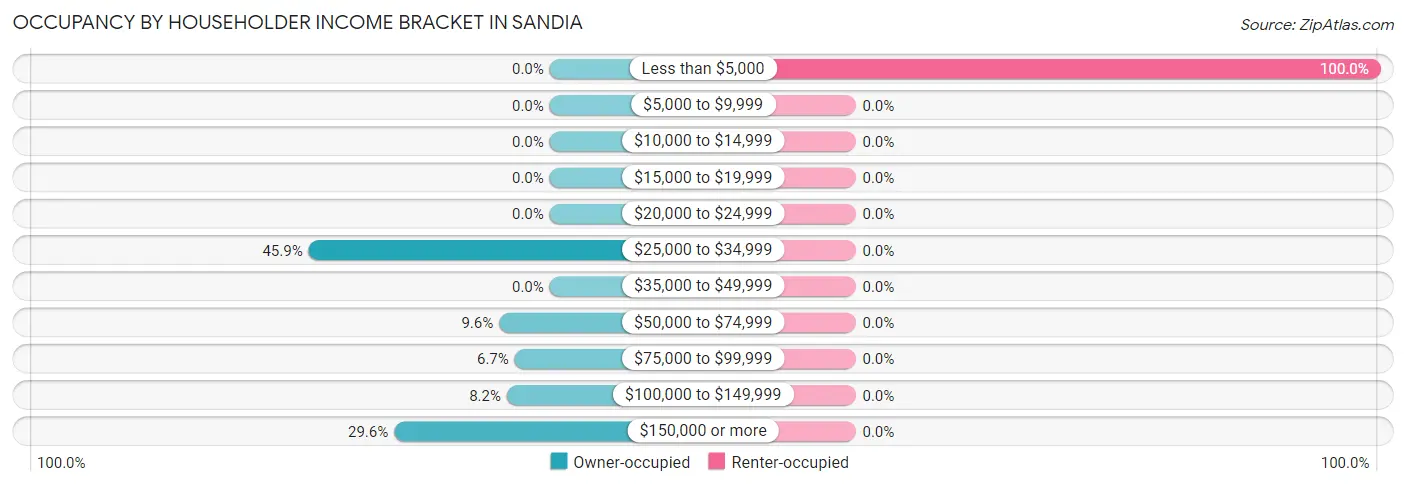
| Income Bracket | Owner-occupied | Renter-occupied |
| Less than $5,000 | 0 (0.0%) | 34 (100.0%) |
| $5,000 to $9,999 | 0 (0.0%) | 0 (0.0%) |
| $10,000 to $14,999 | 0 (0.0%) | 0 (0.0%) |
| $15,000 to $19,999 | 0 (0.0%) | 0 (0.0%) |
| $20,000 to $24,999 | 0 (0.0%) | 0 (0.0%) |
| $25,000 to $34,999 | 62 (45.9%) | 0 (0.0%) |
| $35,000 to $49,999 | 0 (0.0%) | 0 (0.0%) |
| $50,000 to $74,999 | 13 (9.6%) | 0 (0.0%) |
| $75,000 to $99,999 | 9 (6.7%) | 0 (0.0%) |
| $100,000 to $149,999 | 11 (8.2%) | 0 (0.0%) |
| $150,000 or more | 40 (29.6%) | 0 (0.0%) |
| Total | 135 (100.0%) | 34 (100.0%) |
Monthly Housing Cost Tiers in Sandia
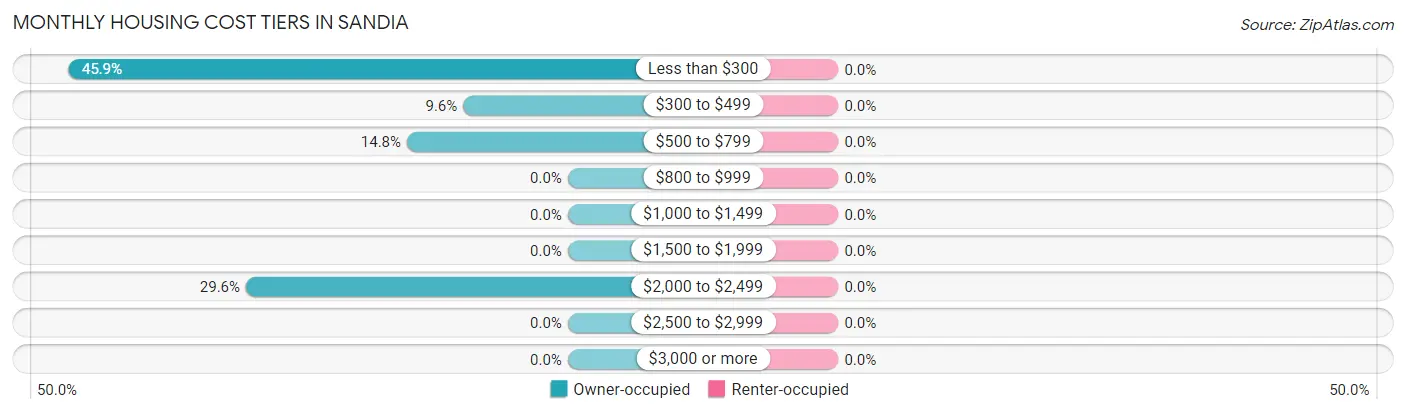
| Monthly Cost | Owner-occupied | Renter-occupied |
| Less than $300 | 62 (45.9%) | 0 (0.0%) |
| $300 to $499 | 13 (9.6%) | 0 (0.0%) |
| $500 to $799 | 20 (14.8%) | 0 (0.0%) |
| $800 to $999 | 0 (0.0%) | 0 (0.0%) |
| $1,000 to $1,499 | 0 (0.0%) | 0 (0.0%) |
| $1,500 to $1,999 | 0 (0.0%) | 0 (0.0%) |
| $2,000 to $2,499 | 40 (29.6%) | 0 (0.0%) |
| $2,500 to $2,999 | 0 (0.0%) | 0 (0.0%) |
| $3,000 or more | 0 (0.0%) | 0 (0.0%) |
| Total | 135 (100.0%) | 34 (100.0%) |
Physical Housing Characteristics in Sandia
Housing Structures in Sandia
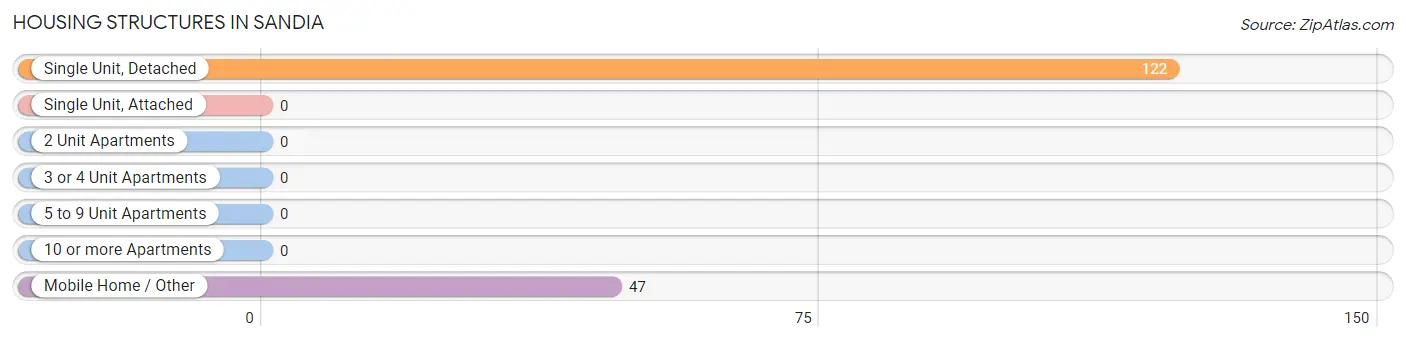
| Structure Type | # Housing Units | % Housing Units |
| Single Unit, Detached | 122 | 72.2% |
| Single Unit, Attached | 0 | 0.0% |
| 2 Unit Apartments | 0 | 0.0% |
| 3 or 4 Unit Apartments | 0 | 0.0% |
| 5 to 9 Unit Apartments | 0 | 0.0% |
| 10 or more Apartments | 0 | 0.0% |
| Mobile Home / Other | 47 | 27.8% |
| Total | 169 | 100.0% |
Housing Structures by Occupancy in Sandia
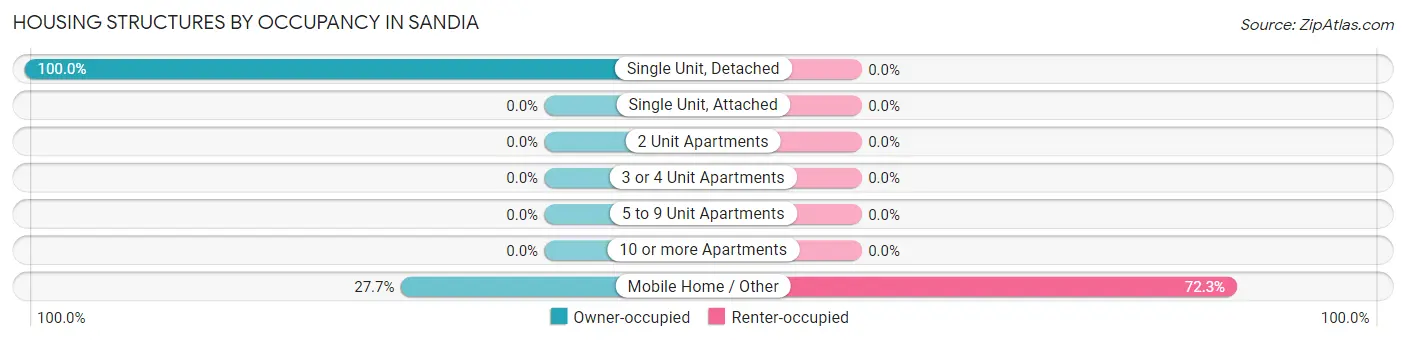
| Structure Type | Owner-occupied | Renter-occupied |
| Single Unit, Detached | 122 (100.0%) | 0 (0.0%) |
| Single Unit, Attached | 0 (0.0%) | 0 (0.0%) |
| 2 Unit Apartments | 0 (0.0%) | 0 (0.0%) |
| 3 or 4 Unit Apartments | 0 (0.0%) | 0 (0.0%) |
| 5 to 9 Unit Apartments | 0 (0.0%) | 0 (0.0%) |
| 10 or more Apartments | 0 (0.0%) | 0 (0.0%) |
| Mobile Home / Other | 13 (27.7%) | 34 (72.3%) |
| Total | 135 (79.9%) | 34 (20.1%) |
Housing Structures by Number of Rooms in Sandia
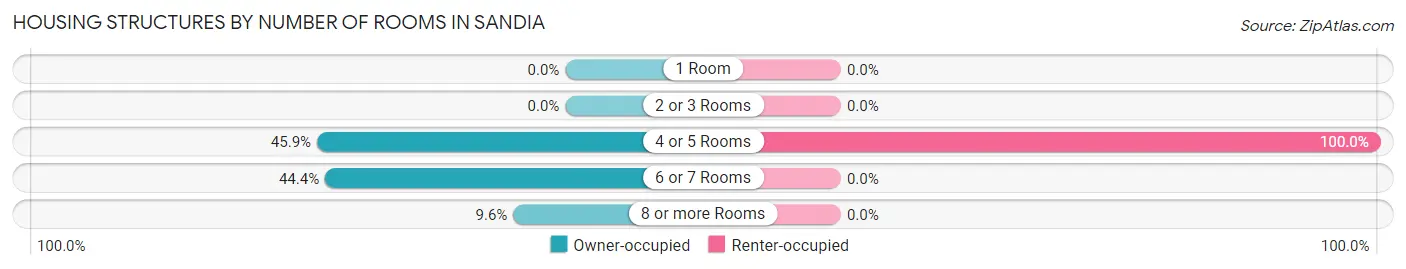
| Number of Rooms | Owner-occupied | Renter-occupied |
| 1 Room | 0 (0.0%) | 0 (0.0%) |
| 2 or 3 Rooms | 0 (0.0%) | 0 (0.0%) |
| 4 or 5 Rooms | 62 (45.9%) | 34 (100.0%) |
| 6 or 7 Rooms | 60 (44.4%) | 0 (0.0%) |
| 8 or more Rooms | 13 (9.6%) | 0 (0.0%) |
| Total | 135 (100.0%) | 34 (100.0%) |
Housing Structure by Heating Type in Sandia
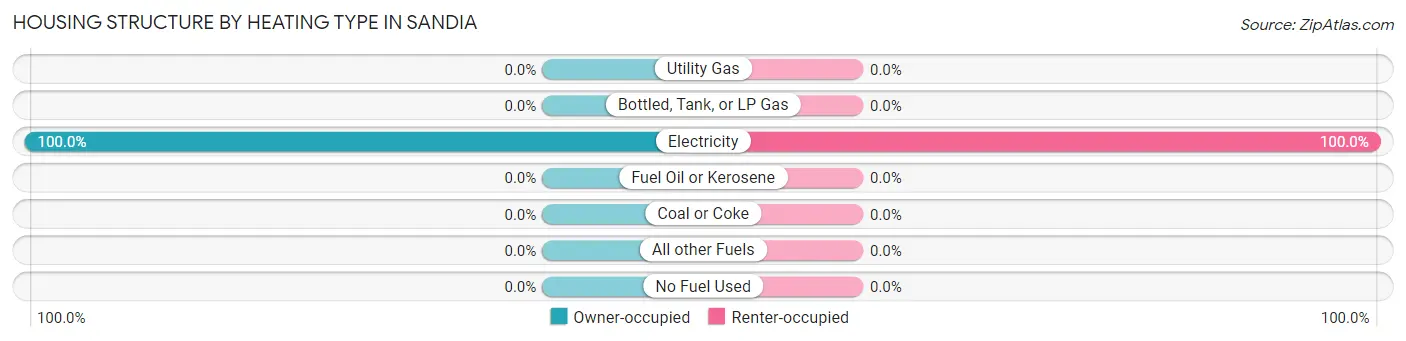
| Heating Type | Owner-occupied | Renter-occupied |
| Utility Gas | 0 (0.0%) | 0 (0.0%) |
| Bottled, Tank, or LP Gas | 0 (0.0%) | 0 (0.0%) |
| Electricity | 135 (100.0%) | 34 (100.0%) |
| Fuel Oil or Kerosene | 0 (0.0%) | 0 (0.0%) |
| Coal or Coke | 0 (0.0%) | 0 (0.0%) |
| All other Fuels | 0 (0.0%) | 0 (0.0%) |
| No Fuel Used | 0 (0.0%) | 0 (0.0%) |
| Total | 135 (100.0%) | 34 (100.0%) |
Household Vehicle Usage in Sandia
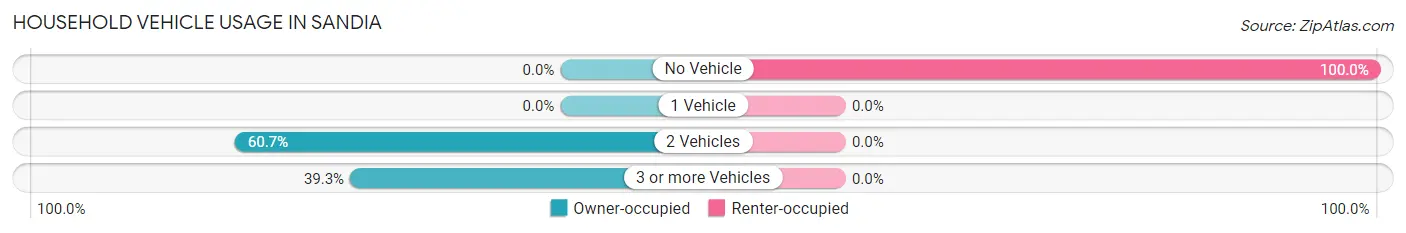
| Vehicles per Household | Owner-occupied | Renter-occupied |
| No Vehicle | 0 (0.0%) | 34 (100.0%) |
| 1 Vehicle | 0 (0.0%) | 0 (0.0%) |
| 2 Vehicles | 82 (60.7%) | 0 (0.0%) |
| 3 or more Vehicles | 53 (39.3%) | 0 (0.0%) |
| Total | 135 (100.0%) | 34 (100.0%) |
Real Estate & Mortgages in Sandia
Real Estate and Mortgage Overview in Sandia
| Characteristic | Without Mortgage | With Mortgage |
| Housing Units | 86 | 49 |
| Median Property Value | $46,900 | $0 |
| Median Household Income | - | - |
| Monthly Housing Costs | - | - |
| Real Estate Taxes | - | - |
Property Value by Mortgage Status in Sandia
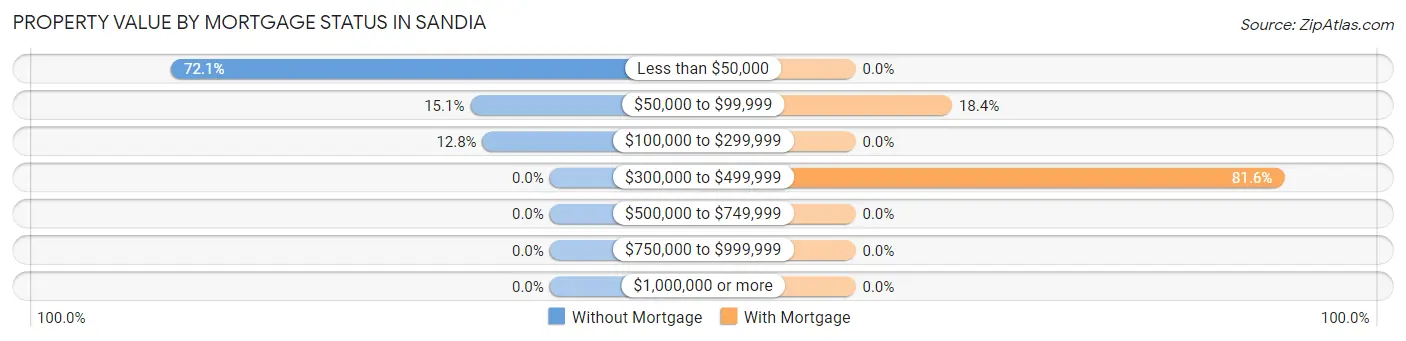
| Property Value | Without Mortgage | With Mortgage |
| Less than $50,000 | 62 (72.1%) | 0 (0.0%) |
| $50,000 to $99,999 | 13 (15.1%) | 9 (18.4%) |
| $100,000 to $299,999 | 11 (12.8%) | 0 (0.0%) |
| $300,000 to $499,999 | 0 (0.0%) | 40 (81.6%) |
| $500,000 to $749,999 | 0 (0.0%) | 0 (0.0%) |
| $750,000 to $999,999 | 0 (0.0%) | 0 (0.0%) |
| $1,000,000 or more | 0 (0.0%) | 0 (0.0%) |
| Total | 86 (100.0%) | 49 (100.0%) |
Household Income by Mortgage Status in Sandia
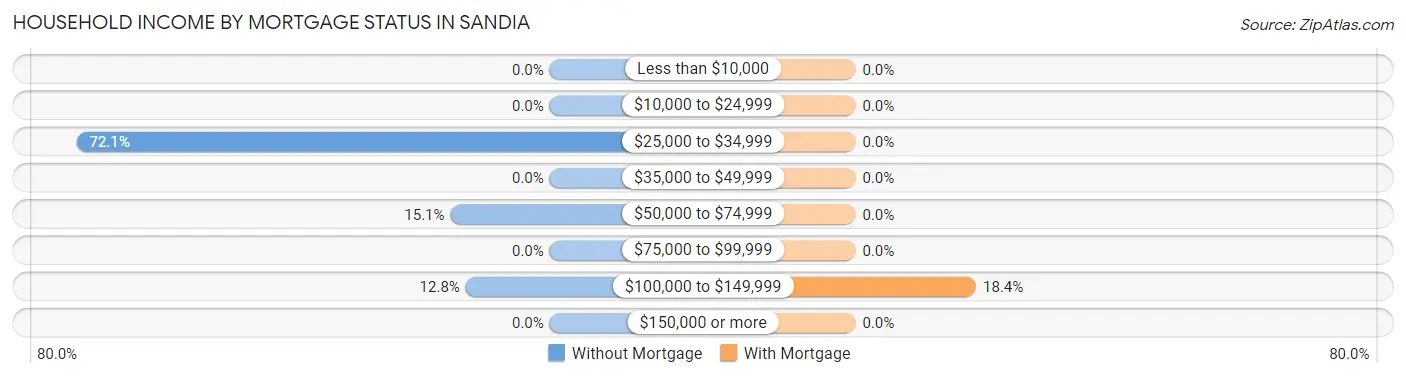
| Household Income | Without Mortgage | With Mortgage |
| Less than $10,000 | 0 (0.0%) | 0 (0.0%) |
| $10,000 to $24,999 | 0 (0.0%) | 0 (0.0%) |
| $25,000 to $34,999 | 62 (72.1%) | 0 (0.0%) |
| $35,000 to $49,999 | 0 (0.0%) | 0 (0.0%) |
| $50,000 to $74,999 | 13 (15.1%) | 0 (0.0%) |
| $75,000 to $99,999 | 0 (0.0%) | 0 (0.0%) |
| $100,000 to $149,999 | 11 (12.8%) | 9 (18.4%) |
| $150,000 or more | 0 (0.0%) | 0 (0.0%) |
| Total | 86 (100.0%) | 49 (100.0%) |
Property Value to Household Income Ratio in Sandia
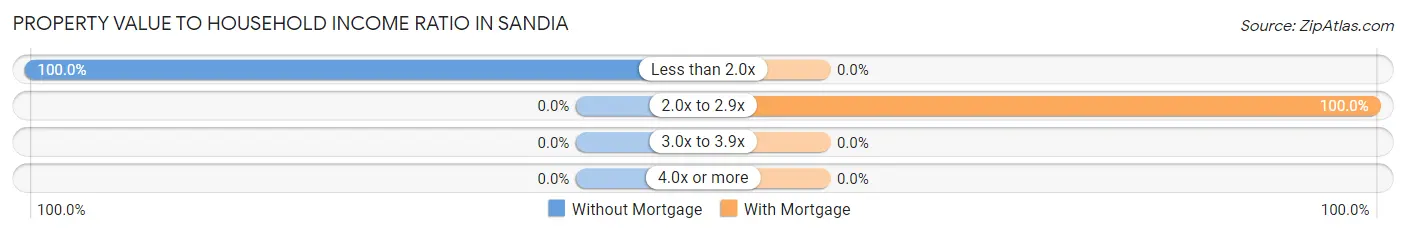
| Value-to-Income Ratio | Without Mortgage | With Mortgage |
| Less than 2.0x | 86 (100.0%) | 0 (0.0%) |
| 2.0x to 2.9x | 0 (0.0%) | 49 (100.0%) |
| 3.0x to 3.9x | 0 (0.0%) | 0 (0.0%) |
| 4.0x or more | 0 (0.0%) | 0 (0.0%) |
| Total | 86 (100.0%) | 49 (100.0%) |
Real Estate Taxes by Mortgage Status in Sandia
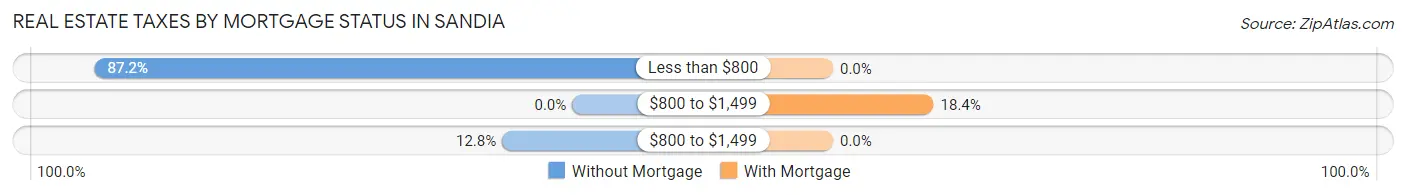
| Property Taxes | Without Mortgage | With Mortgage |
| Less than $800 | 75 (87.2%) | 0 (0.0%) |
| $800 to $1,499 | 0 (0.0%) | 9 (18.4%) |
| $800 to $1,499 | 11 (12.8%) | 0 (0.0%) |
| Total | 86 (100.0%) | 49 (100.0%) |
Health & Disability in Sandia
Health Insurance Coverage by Age in Sandia
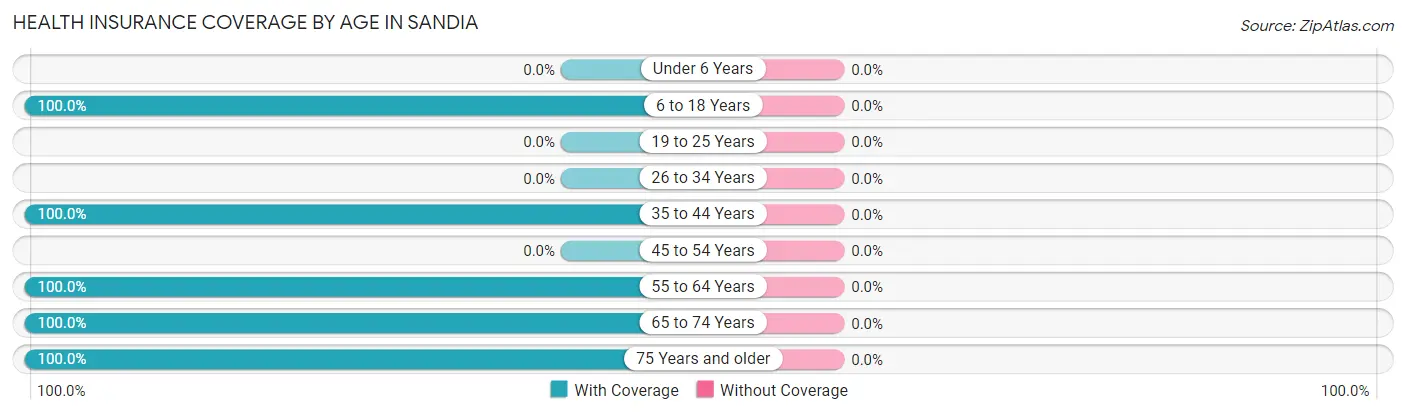
| Age Bracket | With Coverage | Without Coverage |
| Under 6 Years | 0 (0.0%) | 0 (0.0%) |
| 6 to 18 Years | 54 (100.0%) | 0 (0.0%) |
| 19 to 25 Years | 0 (0.0%) | 0 (0.0%) |
| 26 to 34 Years | 0 (0.0%) | 0 (0.0%) |
| 35 to 44 Years | 87 (100.0%) | 0 (0.0%) |
| 45 to 54 Years | 0 (0.0%) | 0 (0.0%) |
| 55 to 64 Years | 109 (100.0%) | 0 (0.0%) |
| 65 to 74 Years | 29 (100.0%) | 0 (0.0%) |
| 75 Years and older | 54 (100.0%) | 0 (0.0%) |
| Total | 333 (100.0%) | 0 (0.0%) |
Health Insurance Coverage by Citizenship Status in Sandia
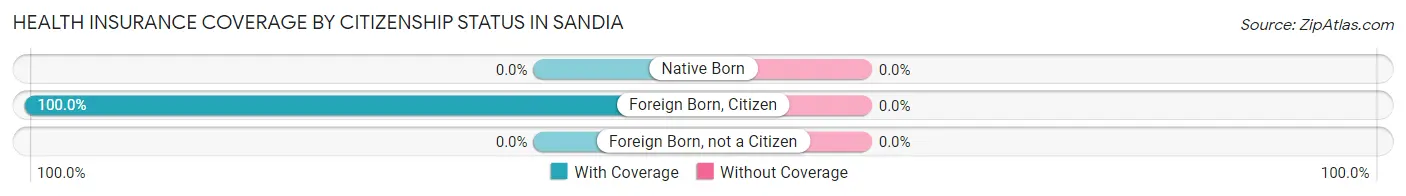
| Citizenship Status | With Coverage | Without Coverage |
| Native Born | 0 (0.0%) | 0 (0.0%) |
| Foreign Born, Citizen | 54 (100.0%) | 0 (0.0%) |
| Foreign Born, not a Citizen | 0 (0.0%) | 0 (0.0%) |
Health Insurance Coverage by Household Income in Sandia
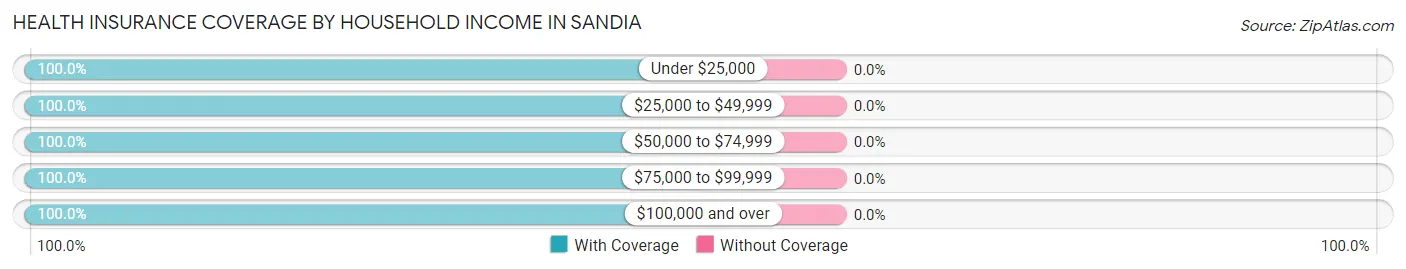
| Household Income | With Coverage | Without Coverage |
| Under $25,000 | 34 (100.0%) | 0 (0.0%) |
| $25,000 to $49,999 | 62 (100.0%) | 0 (0.0%) |
| $50,000 to $74,999 | 31 (100.0%) | 0 (0.0%) |
| $75,000 to $99,999 | 20 (100.0%) | 0 (0.0%) |
| $100,000 and over | 186 (100.0%) | 0 (0.0%) |
Public vs Private Health Insurance Coverage by Age in Sandia
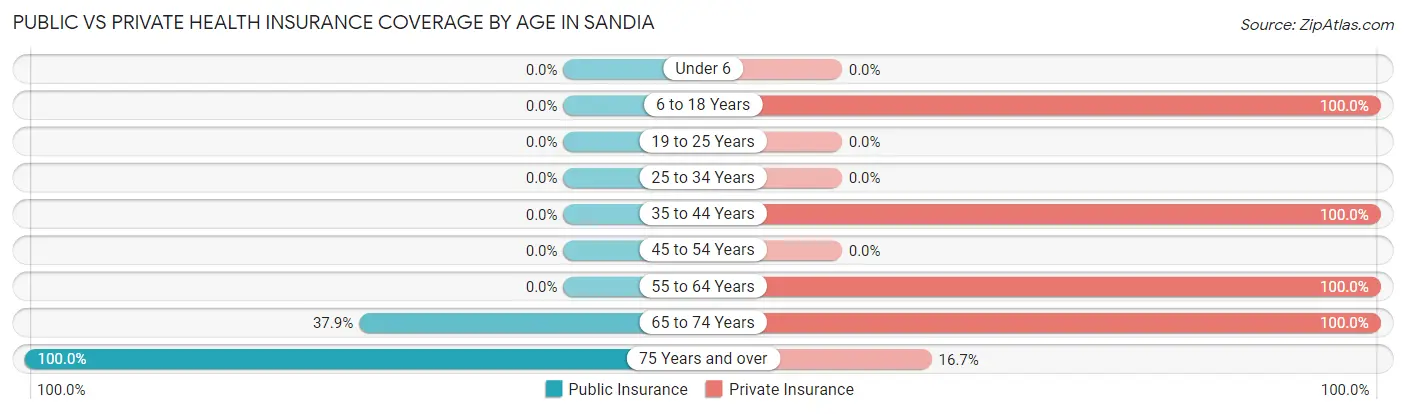
| Age Bracket | Public Insurance | Private Insurance |
| Under 6 | 0 (0.0%) | 0 (0.0%) |
| 6 to 18 Years | 0 (0.0%) | 54 (100.0%) |
| 19 to 25 Years | 0 (0.0%) | 0 (0.0%) |
| 25 to 34 Years | 0 (0.0%) | 0 (0.0%) |
| 35 to 44 Years | 0 (0.0%) | 87 (100.0%) |
| 45 to 54 Years | 0 (0.0%) | 0 (0.0%) |
| 55 to 64 Years | 0 (0.0%) | 109 (100.0%) |
| 65 to 74 Years | 11 (37.9%) | 29 (100.0%) |
| 75 Years and over | 54 (100.0%) | 9 (16.7%) |
| Total | 65 (19.5%) | 288 (86.5%) |
Disability Status by Sex by Age in Sandia
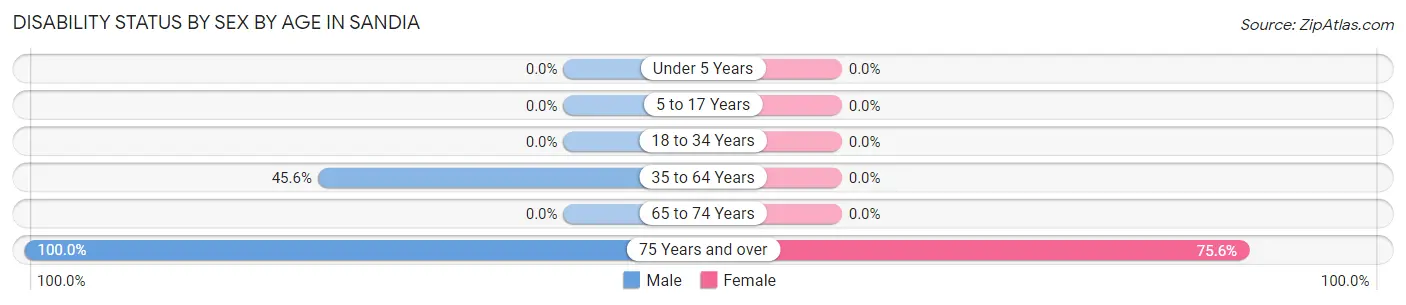
| Age Bracket | Male | Female |
| Under 5 Years | 0 (0.0%) | 0 (0.0%) |
| 5 to 17 Years | 0 (0.0%) | 0 (0.0%) |
| 18 to 34 Years | 0 (0.0%) | 0 (0.0%) |
| 35 to 64 Years | 62 (45.6%) | 0 (0.0%) |
| 65 to 74 Years | 0 (0.0%) | 0 (0.0%) |
| 75 Years and over | 9 (100.0%) | 34 (75.6%) |
Disability Class by Sex by Age in Sandia
Disability Class: Hearing Difficulty
| Age Bracket | Male | Female |
| Under 5 Years | 0 (0.0%) | 0 (0.0%) |
| 5 to 17 Years | 0 (0.0%) | 0 (0.0%) |
| 18 to 34 Years | 0 (0.0%) | 0 (0.0%) |
| 35 to 64 Years | 0 (0.0%) | 0 (0.0%) |
| 65 to 74 Years | 0 (0.0%) | 0 (0.0%) |
| 75 Years and over | 0 (0.0%) | 0 (0.0%) |
Disability Class: Vision Difficulty
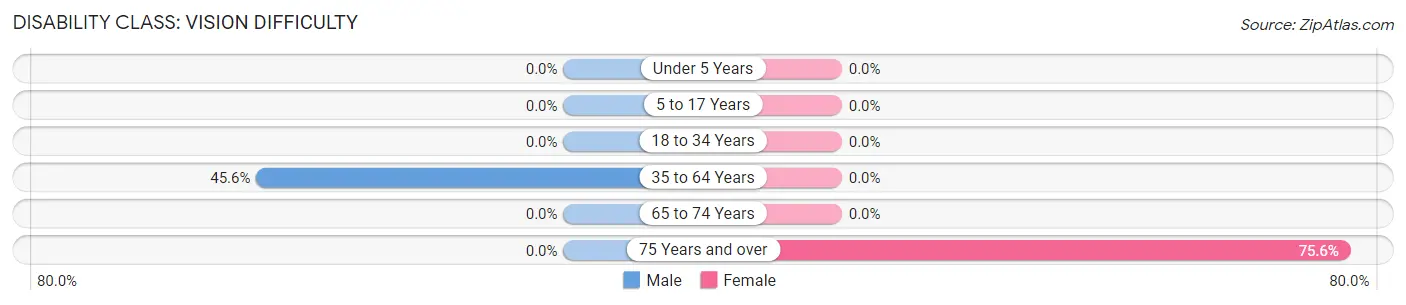
| Age Bracket | Male | Female |
| Under 5 Years | 0 (0.0%) | 0 (0.0%) |
| 5 to 17 Years | 0 (0.0%) | 0 (0.0%) |
| 18 to 34 Years | 0 (0.0%) | 0 (0.0%) |
| 35 to 64 Years | 62 (45.6%) | 0 (0.0%) |
| 65 to 74 Years | 0 (0.0%) | 0 (0.0%) |
| 75 Years and over | 0 (0.0%) | 34 (75.6%) |
Disability Class: Cognitive Difficulty
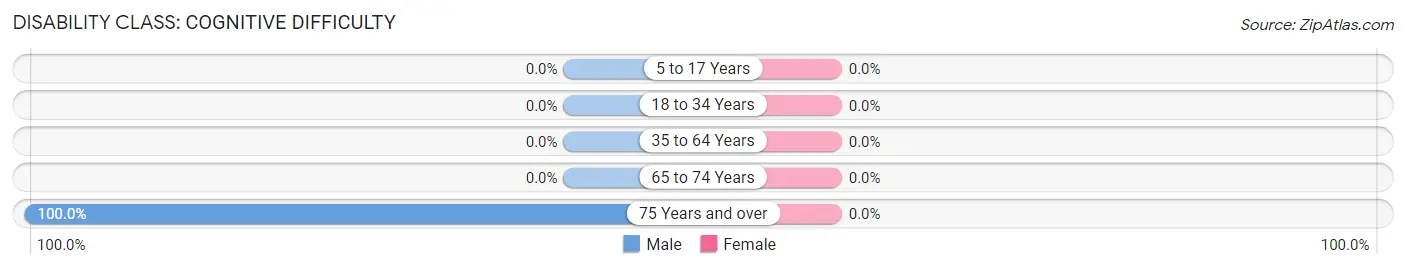
| Age Bracket | Male | Female |
| 5 to 17 Years | 0 (0.0%) | 0 (0.0%) |
| 18 to 34 Years | 0 (0.0%) | 0 (0.0%) |
| 35 to 64 Years | 0 (0.0%) | 0 (0.0%) |
| 65 to 74 Years | 0 (0.0%) | 0 (0.0%) |
| 75 Years and over | 9 (100.0%) | 0 (0.0%) |
Disability Class: Ambulatory Difficulty
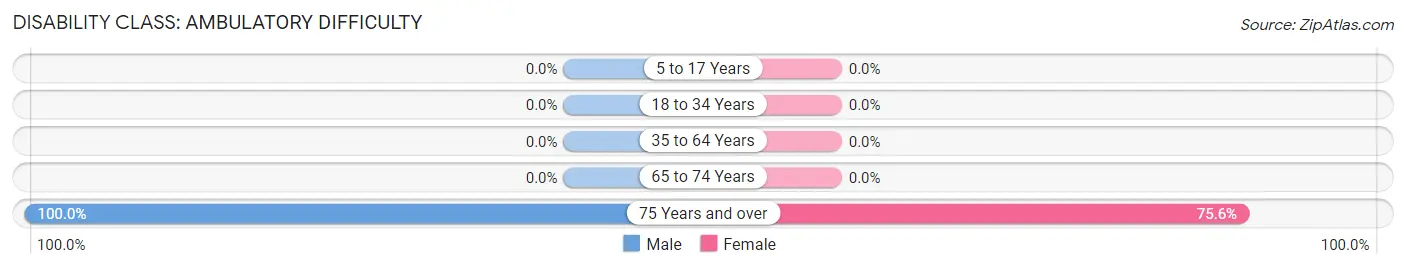
| Age Bracket | Male | Female |
| 5 to 17 Years | 0 (0.0%) | 0 (0.0%) |
| 18 to 34 Years | 0 (0.0%) | 0 (0.0%) |
| 35 to 64 Years | 0 (0.0%) | 0 (0.0%) |
| 65 to 74 Years | 0 (0.0%) | 0 (0.0%) |
| 75 Years and over | 9 (100.0%) | 34 (75.6%) |
Disability Class: Self-Care Difficulty
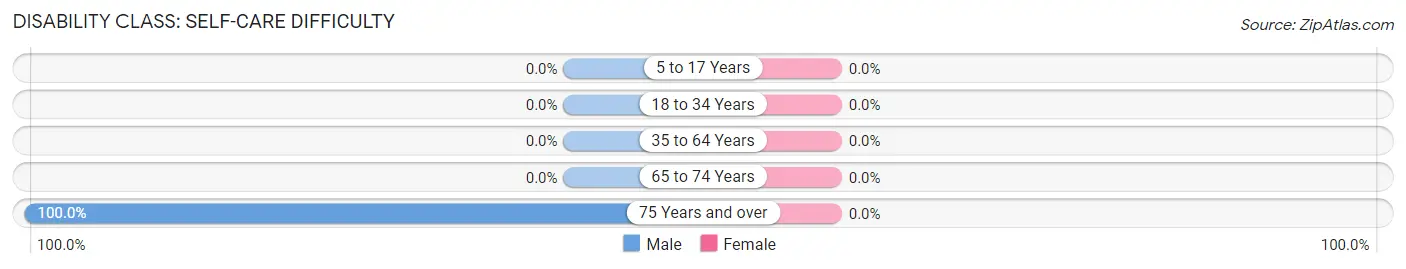
| Age Bracket | Male | Female |
| 5 to 17 Years | 0 (0.0%) | 0 (0.0%) |
| 18 to 34 Years | 0 (0.0%) | 0 (0.0%) |
| 35 to 64 Years | 0 (0.0%) | 0 (0.0%) |
| 65 to 74 Years | 0 (0.0%) | 0 (0.0%) |
| 75 Years and over | 9 (100.0%) | 0 (0.0%) |
Technology Access in Sandia
Computing Device Access in Sandia
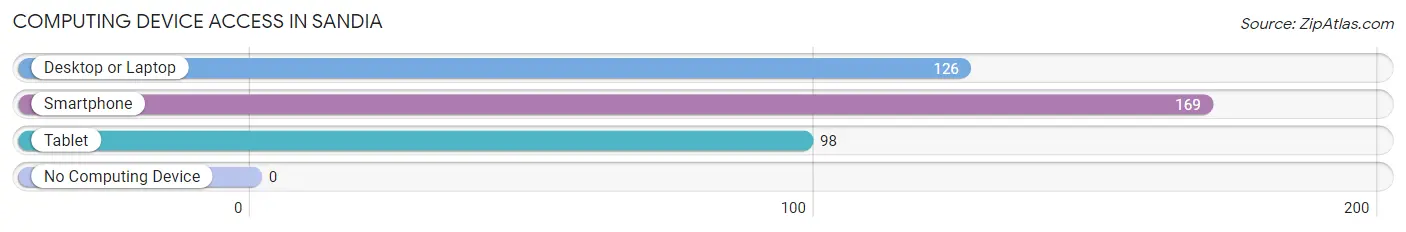
| Device Type | # Households | % Households |
| Desktop or Laptop | 126 | 74.6% |
| Smartphone | 169 | 100.0% |
| Tablet | 98 | 58.0% |
| No Computing Device | 0 | 0.0% |
| Total | 169 | 100.0% |
Internet Access in Sandia
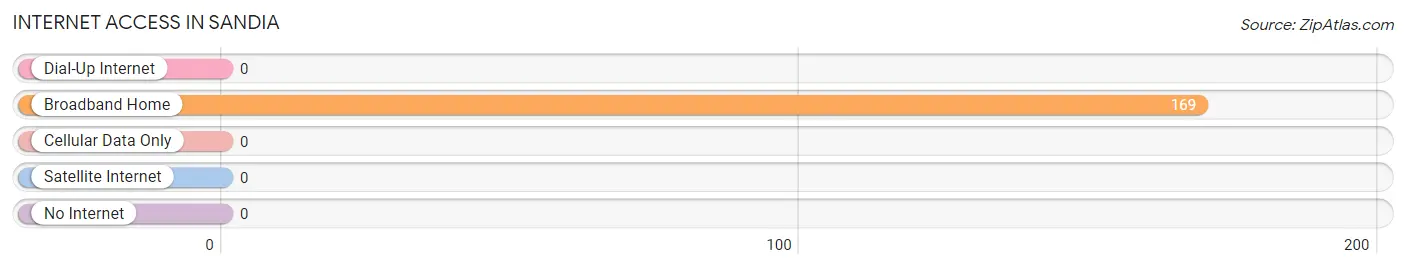
| Internet Type | # Households | % Households |
| Dial-Up Internet | 0 | 0.0% |
| Broadband Home | 169 | 100.0% |
| Cellular Data Only | 0 | 0.0% |
| Satellite Internet | 0 | 0.0% |
| No Internet | 0 | 0.0% |
| Total | 169 | 100.0% |
Sandia Summary
Sandia, Texas is a small town located in Jim Wells County, Texas. It is situated about 20 miles south of Alice, Texas and about 30 miles north of Corpus Christi. The population of Sandia was estimated to be 1,072 in 2019.
Geography
Sandia is located in the Coastal Plains region of Texas. The town is situated on the banks of the Nueces River, which is the longest river in Texas. The town is surrounded by flat terrain and is located in an area of low hills. The climate in Sandia is subtropical, with hot summers and mild winters.
History
Sandia was founded in 1883 by a group of settlers from Mexico. The town was named after the nearby Sandia Creek, which was named after the Spanish word for watermelon. The town was originally a farming community, and the main crops grown were cotton, corn, and sorghum.
In the early 1900s, Sandia began to grow as a railroad town. The San Antonio and Aransas Pass Railway built a line through the town, and the town became a stop on the line. The railroad brought new businesses and people to the town, and the population began to grow.
In the 1950s, Sandia began to experience a decline in population as people moved away to larger cities. The town was also affected by the Great Depression and the Dust Bowl. In the 1970s, the town began to experience a resurgence as people began to move back to the area.
Economy
The economy of Sandia is largely based on agriculture. The main crops grown in the area are cotton, corn, and sorghum. The town also has a few small businesses, including a grocery store, a hardware store, and a few restaurants.
Demographics
As of 2019, the population of Sandia was estimated to be 1,072. The racial makeup of the town was 94.2% White, 0.7% African American, 0.3% Native American, 0.2% Asian, and 4.6% from other races. The median household income in Sandia was $31,250, and the median age was 37.
Conclusion
Sandia, Texas is a small town located in Jim Wells County, Texas. It is situated on the banks of the Nueces River and is surrounded by flat terrain. The town was founded in 1883 by a group of settlers from Mexico and was originally a farming community. In the 1950s, the town began to experience a decline in population, but in the 1970s, the town began to experience a resurgence. The economy of Sandia is largely based on agriculture, and the main crops grown in the area are cotton, corn, and sorghum. The population of Sandia was estimated to be 1,072 in 2019.
Common Questions
What is Per Capita Income in Sandia?
Per Capita income in Sandia is $58,201.
What is the Median Family Income in Sandia?
Median Family Income in Sandia is $250,001.
What is Inequality or Gini Index in Sandia?
Inequality or Gini Index in Sandia is 0.58.
What is the Total Population of Sandia?
Total Population of Sandia is 333.
What is the Total Male Population of Sandia?
Total Male Population of Sandia is 185.
What is the Total Female Population of Sandia?
Total Female Population of Sandia is 148.
What is the Ratio of Males per 100 Females in Sandia?
There are 125.00 Males per 100 Females in Sandia.
What is the Ratio of Females per 100 Males in Sandia?
There are 80.00 Females per 100 Males in Sandia.
What is the Median Population Age in Sandia?
Median Population Age in Sandia is 57.4 Years.
What is the Average Family Size in Sandia
Average Family Size in Sandia is 3.4 People.
What is the Average Household Size in Sandia
Average Household Size in Sandia is 2.0 People.
How Large is the Labor Force in Sandia?
There are 221 People in the Labor Forcein in Sandia.
What is the Percentage of People in the Labor Force in Sandia?
79.2% of People are in the Labor Force in Sandia.