Browndell, TX Map & Demographics
Browndell Map
Browndell Overview
$14,314
PER CAPITA INCOME
$32,250
AVG FAMILY INCOME
$30,750
AVG HOUSEHOLD INCOME
0.38
INEQUALITY / GINI INDEX
88
TOTAL POPULATION
44
MALE POPULATION
44
FEMALE POPULATION
100.00
MALES / 100 FEMALES
100.00
FEMALES / 100 MALES
59.9
MEDIAN AGE
3.0
AVG FAMILY SIZE
2.5
AVG HOUSEHOLD SIZE
29
LABOR FORCE [ PEOPLE ]
34.5%
PERCENT IN LABOR FORCE
6.9%
UNEMPLOYMENT RATE
Income in Browndell
Income Overview in Browndell
Per Capita Income in Browndell is $14,314, while median incomes of families and households are $32,250 and $30,750 respectively.
| Characteristic | Number | Measure |
| Per Capita Income | 88 | $14,314 |
| Median Family Income | 23 | $32,250 |
| Mean Family Income | 23 | $39,739 |
| Median Household Income | 35 | $30,750 |
| Mean Household Income | 35 | $33,011 |
| Income Deficit | 23 | $0 |
| Wage / Income Gap (%) | 88 | 0.00% |
| Wage / Income Gap ($) | 88 | 100.00¢ per $1 |
| Gini / Inequality Index | 88 | 0.38 |
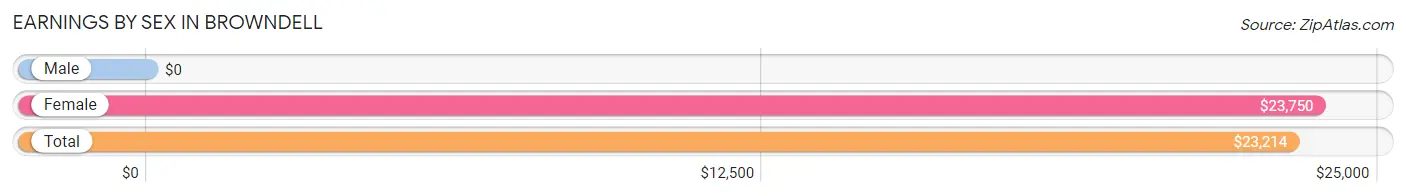
Earnings by Sex in Browndell
| Sex | Number | Average Earnings |
| Male | 21 (65.6%) | $0 |
| Female | 11 (34.4%) | $23,750 |
| Total | 32 (100.0%) | $23,214 |
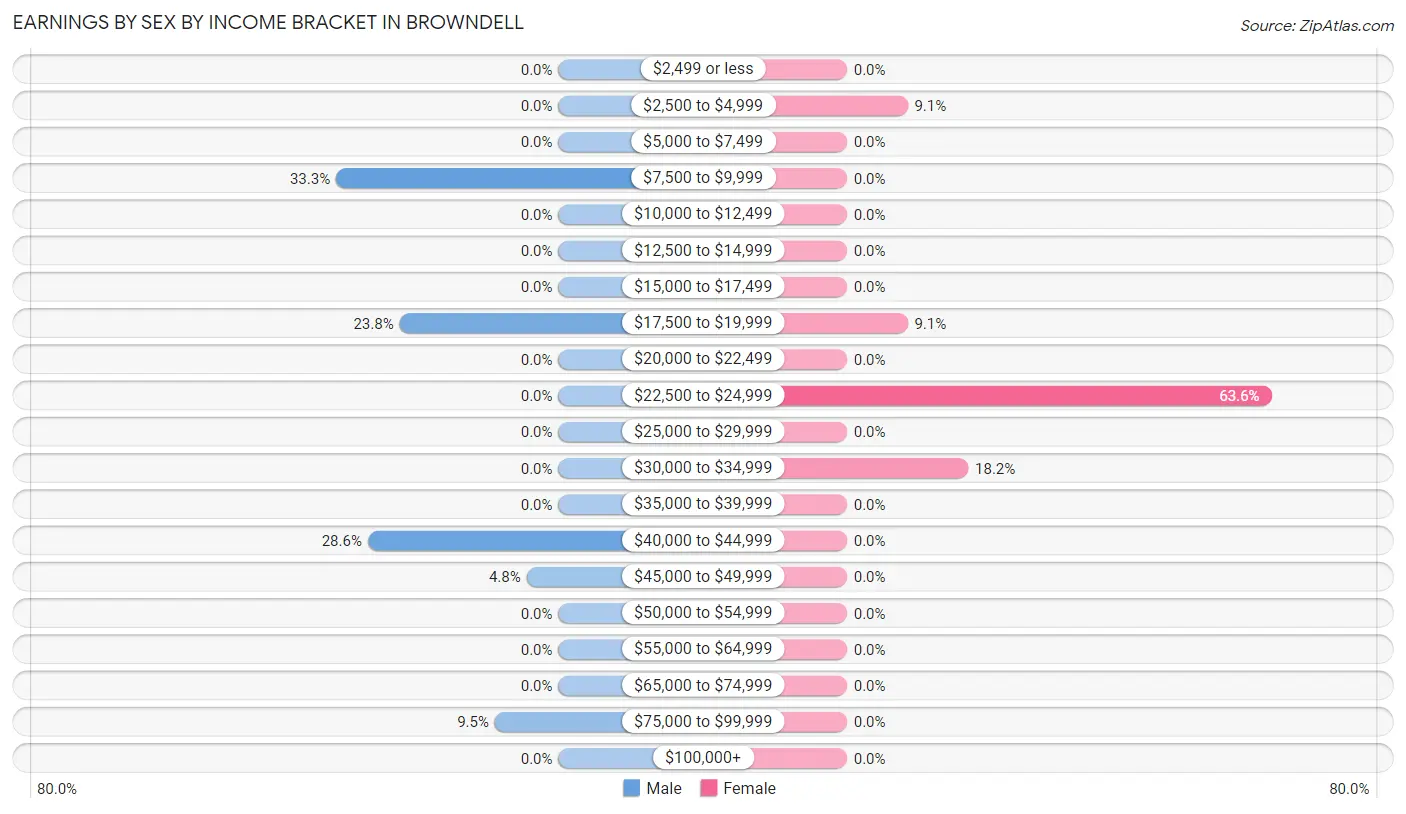
Earnings by Sex by Income Bracket in Browndell
The most common earnings brackets in Browndell are $7,500 to $9,999 for men (7 | 33.3%) and $22,500 to $24,999 for women (7 | 63.6%).
| Income | Male | Female |
| $2,499 or less | 0 (0.0%) | 0 (0.0%) |
| $2,500 to $4,999 | 0 (0.0%) | 1 (9.1%) |
| $5,000 to $7,499 | 0 (0.0%) | 0 (0.0%) |
| $7,500 to $9,999 | 7 (33.3%) | 0 (0.0%) |
| $10,000 to $12,499 | 0 (0.0%) | 0 (0.0%) |
| $12,500 to $14,999 | 0 (0.0%) | 0 (0.0%) |
| $15,000 to $17,499 | 0 (0.0%) | 0 (0.0%) |
| $17,500 to $19,999 | 5 (23.8%) | 1 (9.1%) |
| $20,000 to $22,499 | 0 (0.0%) | 0 (0.0%) |
| $22,500 to $24,999 | 0 (0.0%) | 7 (63.6%) |
| $25,000 to $29,999 | 0 (0.0%) | 0 (0.0%) |
| $30,000 to $34,999 | 0 (0.0%) | 2 (18.2%) |
| $35,000 to $39,999 | 0 (0.0%) | 0 (0.0%) |
| $40,000 to $44,999 | 6 (28.6%) | 0 (0.0%) |
| $45,000 to $49,999 | 1 (4.8%) | 0 (0.0%) |
| $50,000 to $54,999 | 0 (0.0%) | 0 (0.0%) |
| $55,000 to $64,999 | 0 (0.0%) | 0 (0.0%) |
| $65,000 to $74,999 | 0 (0.0%) | 0 (0.0%) |
| $75,000 to $99,999 | 2 (9.5%) | 0 (0.0%) |
| $100,000+ | 0 (0.0%) | 0 (0.0%) |
| Total | 21 (100.0%) | 11 (100.0%) |
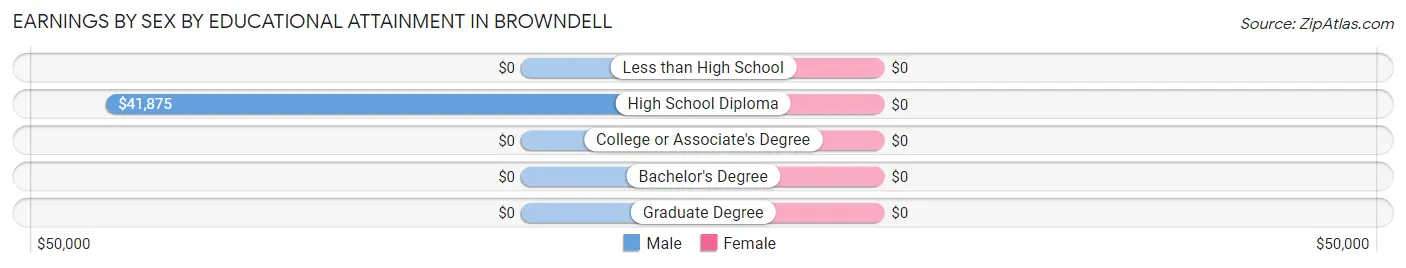
Earnings by Sex by Educational Attainment in Browndell
| Educational Attainment | Male Income | Female Income |
| Less than High School | - | - |
| High School Diploma | $41,875 | $0 |
| College or Associate's Degree | - | - |
| Bachelor's Degree | - | - |
| Graduate Degree | - | - |
| Total | - | - |
Family Income in Browndell
Family Income Brackets in Browndell
According to the Browndell family income data, there are 9 families falling into the $25,000 to $34,999 income range, which is the most common income bracket and makes up 39.1% of all families.
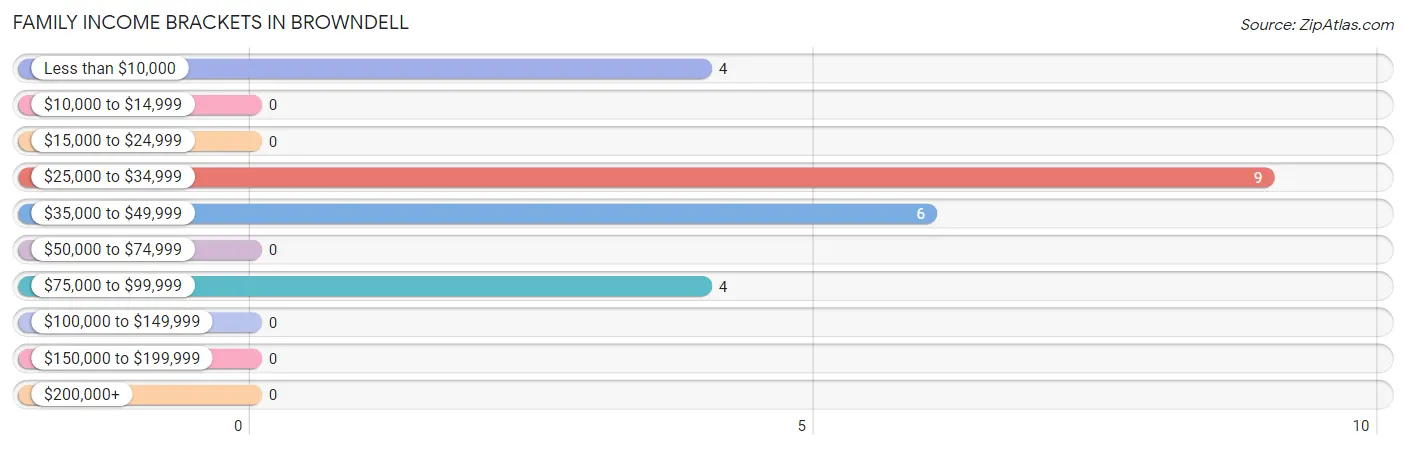
| Income Bracket | # Families | % Families |
| Less than $10,000 | 4 | 17.4% |
| $10,000 to $14,999 | 0 | 0.0% |
| $15,000 to $24,999 | 0 | 0.0% |
| $25,000 to $34,999 | 9 | 39.1% |
| $35,000 to $49,999 | 6 | 26.1% |
| $50,000 to $74,999 | 0 | 0.0% |
| $75,000 to $99,999 | 4 | 17.4% |
| $100,000 to $149,999 | 0 | 0.0% |
| $150,000 to $199,999 | 0 | 0.0% |
| $200,000+ | 0 | 0.0% |
Family Income by Famaliy Size in Browndell
3-person families (11 | 47.8%) account for the highest median family income in Browndell with $30,250 per family, while 3-person families (11 | 47.8%) have the highest median income of $10,083 per family member.
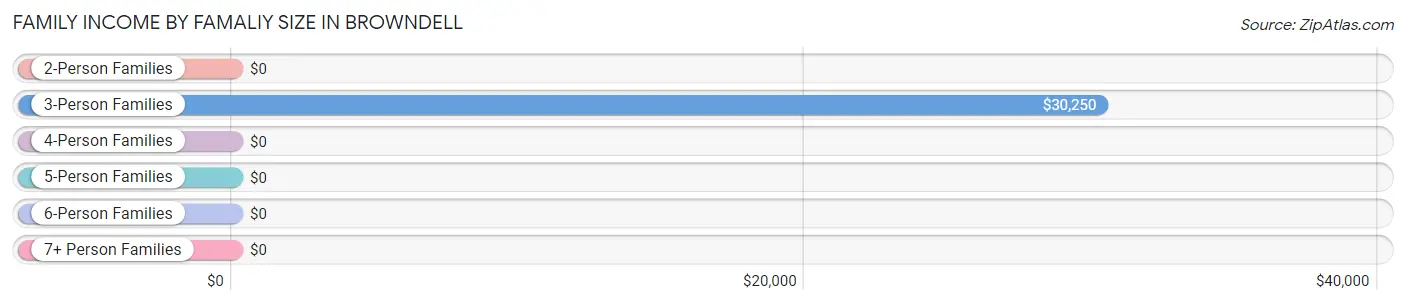
| Income Bracket | # Families | Median Income |
| 2-Person Families | 10 (43.5%) | $0 |
| 3-Person Families | 11 (47.8%) | $30,250 |
| 4-Person Families | 2 (8.7%) | $0 |
| 5-Person Families | 0 (0.0%) | $0 |
| 6-Person Families | 0 (0.0%) | $0 |
| 7+ Person Families | 0 (0.0%) | $0 |
| Total | 23 (100.0%) | $32,250 |
Family Income by Number of Earners in Browndell
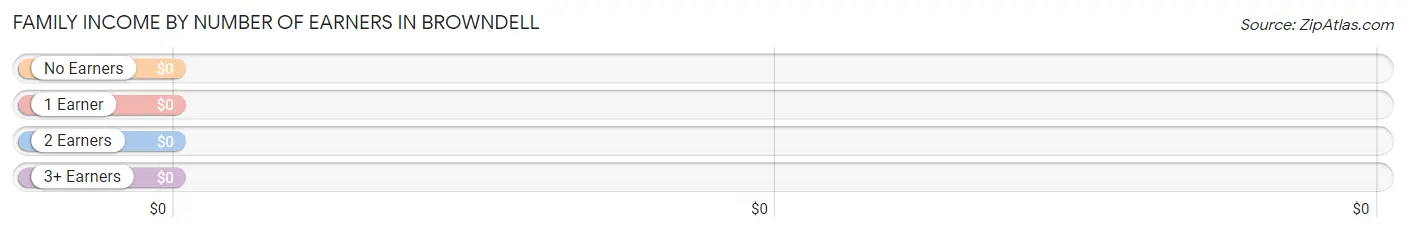
| Number of Earners | # Families | Median Income |
| No Earners | 6 (26.1%) | $0 |
| 1 Earner | 11 (47.8%) | $0 |
| 2 Earners | 6 (26.1%) | $0 |
| 3+ Earners | 0 (0.0%) | $0 |
| Total | 23 (100.0%) | $32,250 |
Household Income in Browndell
Household Income Brackets in Browndell
With 11 households falling in the category, the $25,000 to $34,999 income range is the most frequent in Browndell, accounting for 31.4% of all households.
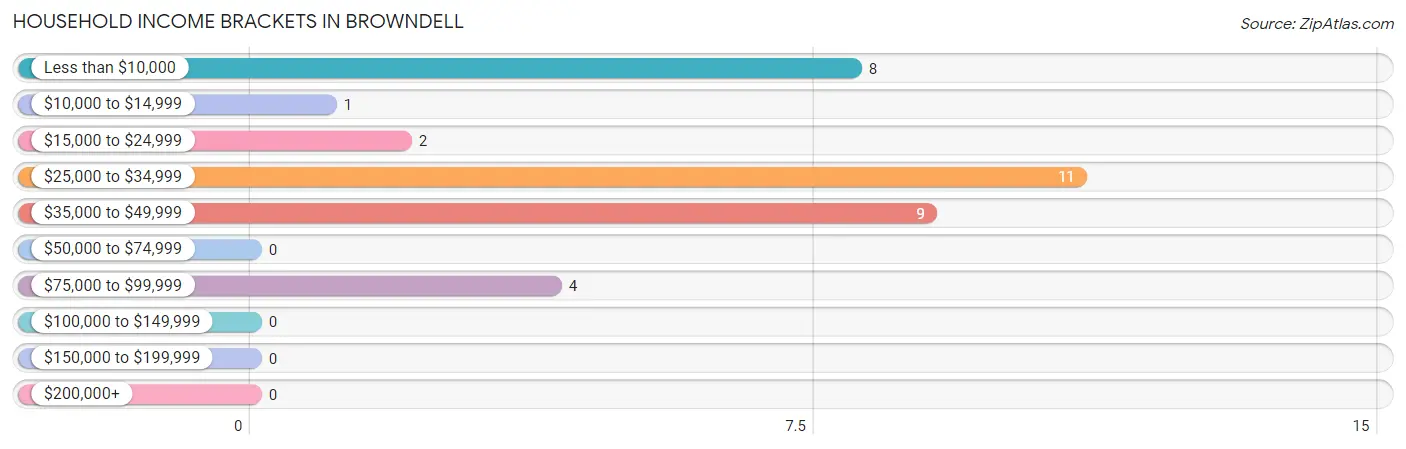
| Income Bracket | # Households | % Households |
| Less than $10,000 | 8 | 22.9% |
| $10,000 to $14,999 | 1 | 2.9% |
| $15,000 to $24,999 | 2 | 5.7% |
| $25,000 to $34,999 | 11 | 31.4% |
| $35,000 to $49,999 | 9 | 25.7% |
| $50,000 to $74,999 | 0 | 0.0% |
| $75,000 to $99,999 | 4 | 11.4% |
| $100,000 to $149,999 | 0 | 0.0% |
| $150,000 to $199,999 | 0 | 0.0% |
| $200,000+ | 0 | 0.0% |
Household Income by Householder Age in Browndell
The median household income in Browndell is $30,750, with the highest median household income of $82,500 found in the 45 to 64 years age bracket for the primary householder. A total of 6 households (17.1%) fall into this category. Meanwhile, the 15 to 24 years age bracket for the primary householder has the lowest median household income of $0, with 2 households (5.7%) in this group.
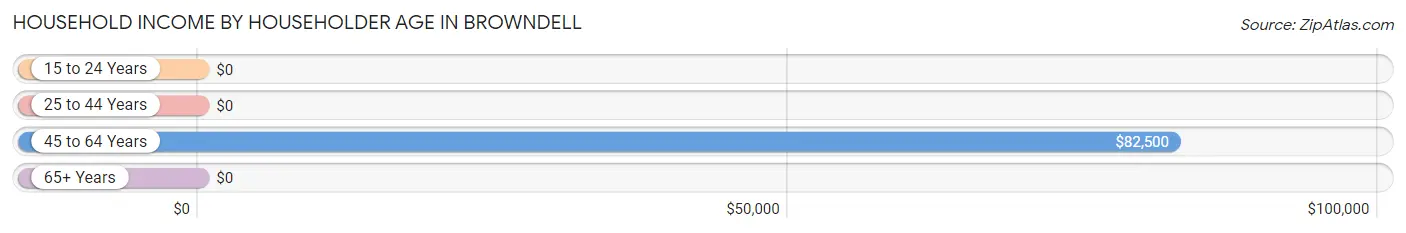
| Income Bracket | # Households | Median Income |
| 15 to 24 Years | 2 (5.7%) | $0 |
| 25 to 44 Years | 5 (14.3%) | $0 |
| 45 to 64 Years | 6 (17.1%) | $82,500 |
| 65+ Years | 22 (62.9%) | $0 |
| Total | 35 (100.0%) | $30,750 |
Poverty in Browndell
Income Below Poverty by Sex and Age in Browndell
With 36.4% poverty level for males and 31.8% for females among the residents of Browndell, 16 and 17 year old males and 16 and 17 year old females are the most vulnerable to poverty, with 2 males (100.0%) and 1 females (100.0%) in their respective age groups living below the poverty level.
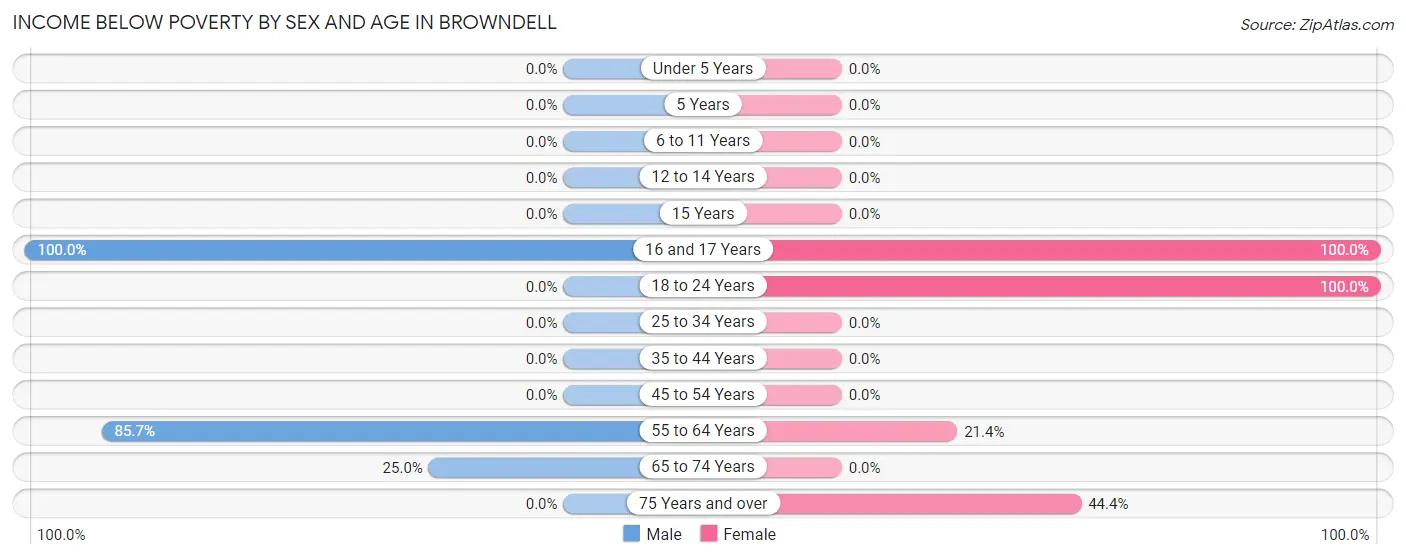
| Age Bracket | Male | Female |
| Under 5 Years | 0 (0.0%) | 0 (0.0%) |
| 5 Years | 0 (0.0%) | 0 (0.0%) |
| 6 to 11 Years | 0 (0.0%) | 0 (0.0%) |
| 12 to 14 Years | 0 (0.0%) | 0 (0.0%) |
| 15 Years | 0 (0.0%) | 0 (0.0%) |
| 16 and 17 Years | 2 (100.0%) | 1 (100.0%) |
| 18 to 24 Years | 0 (0.0%) | 2 (100.0%) |
| 25 to 34 Years | 0 (0.0%) | 0 (0.0%) |
| 35 to 44 Years | 0 (0.0%) | 0 (0.0%) |
| 45 to 54 Years | 0 (0.0%) | 0 (0.0%) |
| 55 to 64 Years | 12 (85.7%) | 3 (21.4%) |
| 65 to 74 Years | 2 (25.0%) | 0 (0.0%) |
| 75 Years and over | 0 (0.0%) | 8 (44.4%) |
| Total | 16 (36.4%) | 14 (31.8%) |
Income Above Poverty by Sex and Age in Browndell
According to the poverty statistics in Browndell, males aged 6 to 11 years and females aged 25 to 34 years are the age groups that are most secure financially, with 100.0% of males and 100.0% of females in these age groups living above the poverty line.
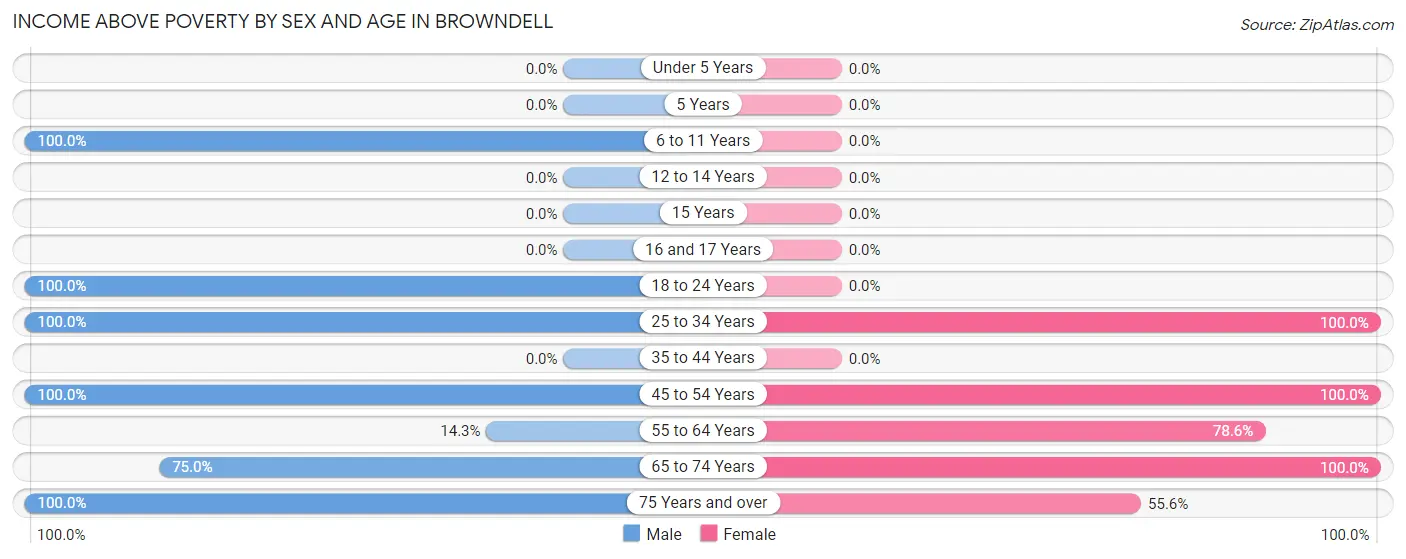
| Age Bracket | Male | Female |
| Under 5 Years | 0 (0.0%) | 0 (0.0%) |
| 5 Years | 0 (0.0%) | 0 (0.0%) |
| 6 to 11 Years | 4 (100.0%) | 0 (0.0%) |
| 12 to 14 Years | 0 (0.0%) | 0 (0.0%) |
| 15 Years | 0 (0.0%) | 0 (0.0%) |
| 16 and 17 Years | 0 (0.0%) | 0 (0.0%) |
| 18 to 24 Years | 5 (100.0%) | 0 (0.0%) |
| 25 to 34 Years | 5 (100.0%) | 4 (100.0%) |
| 35 to 44 Years | 0 (0.0%) | 0 (0.0%) |
| 45 to 54 Years | 5 (100.0%) | 4 (100.0%) |
| 55 to 64 Years | 2 (14.3%) | 11 (78.6%) |
| 65 to 74 Years | 6 (75.0%) | 1 (100.0%) |
| 75 Years and over | 1 (100.0%) | 10 (55.6%) |
| Total | 28 (63.6%) | 30 (68.2%) |
Income Below Poverty Among Married-Couple Families in Browndell
The poverty statistics for married-couple families in Browndell show that 11.1% or 2 of the total 18 families live below the poverty line. Families with 1 or 2 children have the highest poverty rate of 28.6%, comprising of 2 families. On the other hand, families with no children have the lowest poverty rate of 0.0%, which includes 0 families.
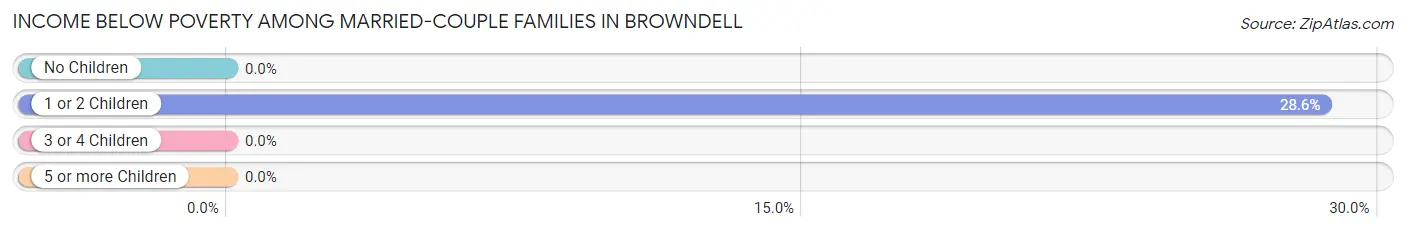
| Children | Above Poverty | Below Poverty |
| No Children | 11 (100.0%) | 0 (0.0%) |
| 1 or 2 Children | 5 (71.4%) | 2 (28.6%) |
| 3 or 4 Children | 0 (0.0%) | 0 (0.0%) |
| 5 or more Children | 0 (0.0%) | 0 (0.0%) |
| Total | 16 (88.9%) | 2 (11.1%) |
Income Below Poverty Among Single-Parent Households in Browndell
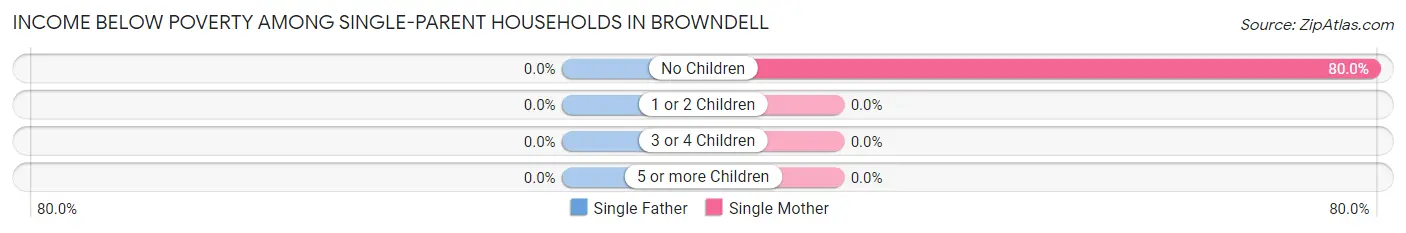
| Children | Single Father | Single Mother |
| No Children | 0 (0.0%) | 4 (80.0%) |
| 1 or 2 Children | 0 (0.0%) | 0 (0.0%) |
| 3 or 4 Children | 0 (0.0%) | 0 (0.0%) |
| 5 or more Children | 0 (0.0%) | 0 (0.0%) |
| Total | 0 (0.0%) | 4 (80.0%) |
Income Below Poverty Among Married-Couple vs Single-Parent Households in Browndell
The poverty data for Browndell shows that 2 of the married-couple family households (11.1%) and 4 of the single-parent households (80.0%) are living below the poverty level. Within the married-couple family households, those with 1 or 2 children have the highest poverty rate, with 2 households (28.6%) falling below the poverty line. Among the single-parent households, those with no children have the highest poverty rate, with 4 household (80.0%) living below poverty.
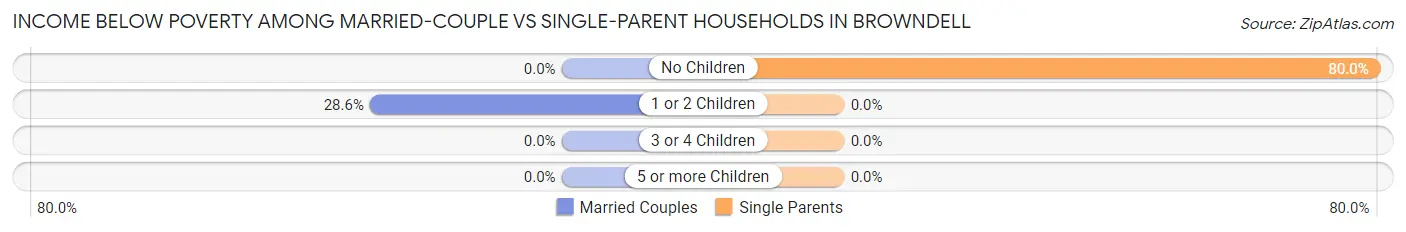
| Children | Married-Couple Families | Single-Parent Households |
| No Children | 0 (0.0%) | 4 (80.0%) |
| 1 or 2 Children | 2 (28.6%) | 0 (0.0%) |
| 3 or 4 Children | 0 (0.0%) | 0 (0.0%) |
| 5 or more Children | 0 (0.0%) | 0 (0.0%) |
| Total | 2 (11.1%) | 4 (80.0%) |
Race in Browndell
The most populous races in Browndell are White / Caucasian (51 | 58.0%), and Black / African American (37 | 42.0%).
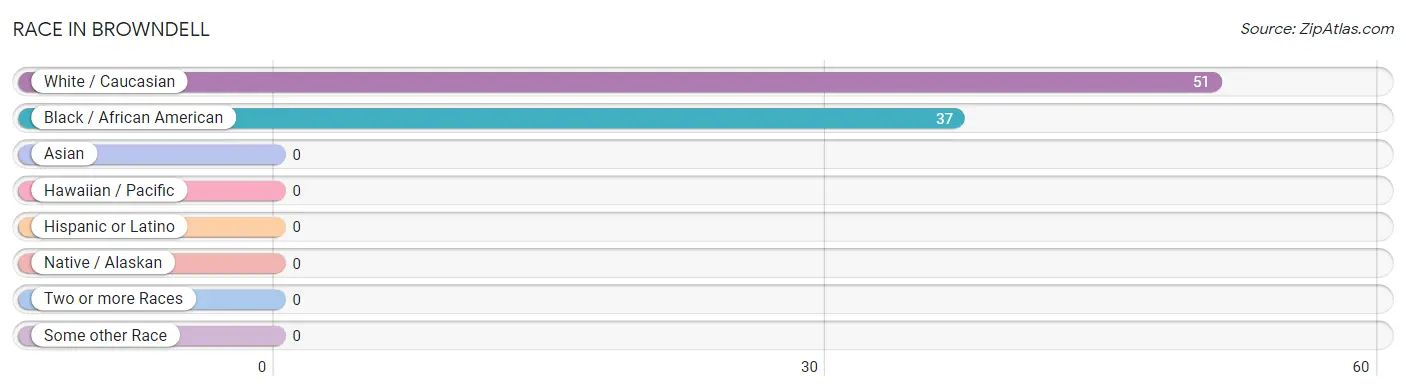
| Race | # Population | % Population |
| Asian | 0 | 0.0% |
| Black / African American | 37 | 42.0% |
| Hawaiian / Pacific | 0 | 0.0% |
| Hispanic or Latino | 0 | 0.0% |
| Native / Alaskan | 0 | 0.0% |
| White / Caucasian | 51 | 58.0% |
| Two or more Races | 0 | 0.0% |
| Some other Race | 0 | 0.0% |
| Total | 88 | 100.0% |
Ancestry in Browndell
The most populous ancestries reported in Browndell are American (22 | 25.0%), German (4 | 4.5%), Irish (4 | 4.5%), and English (1 | 1.1%), together accounting for 35.2% of all Browndell residents.
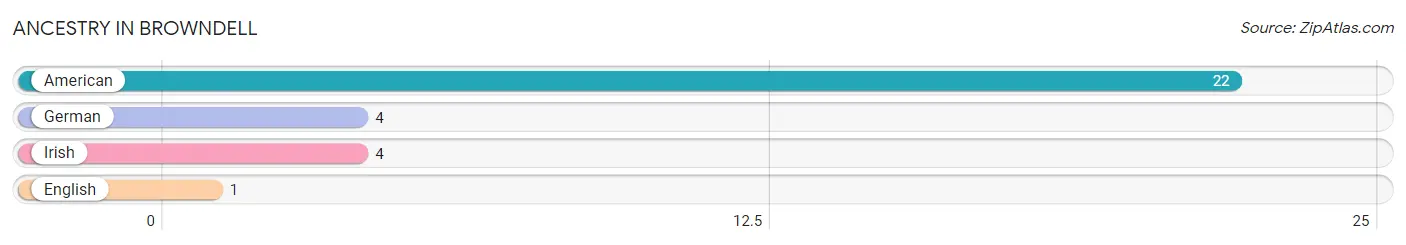
| Ancestry | # Population | % Population |
| American | 22 | 25.0% |
| English | 1 | 1.1% |
| German | 4 | 4.5% |
| Irish | 4 | 4.5% | View All 4 Rows |
Immigrants in Browndell

| Immigration Origin | # Population | % Population | View All 0 Rows |
Sex and Age in Browndell
Sex and Age in Browndell
The most populous age groups in Browndell are 55 to 59 Years (8 | 18.2%) for men and 60 to 64 Years (9 | 20.4%) for women.
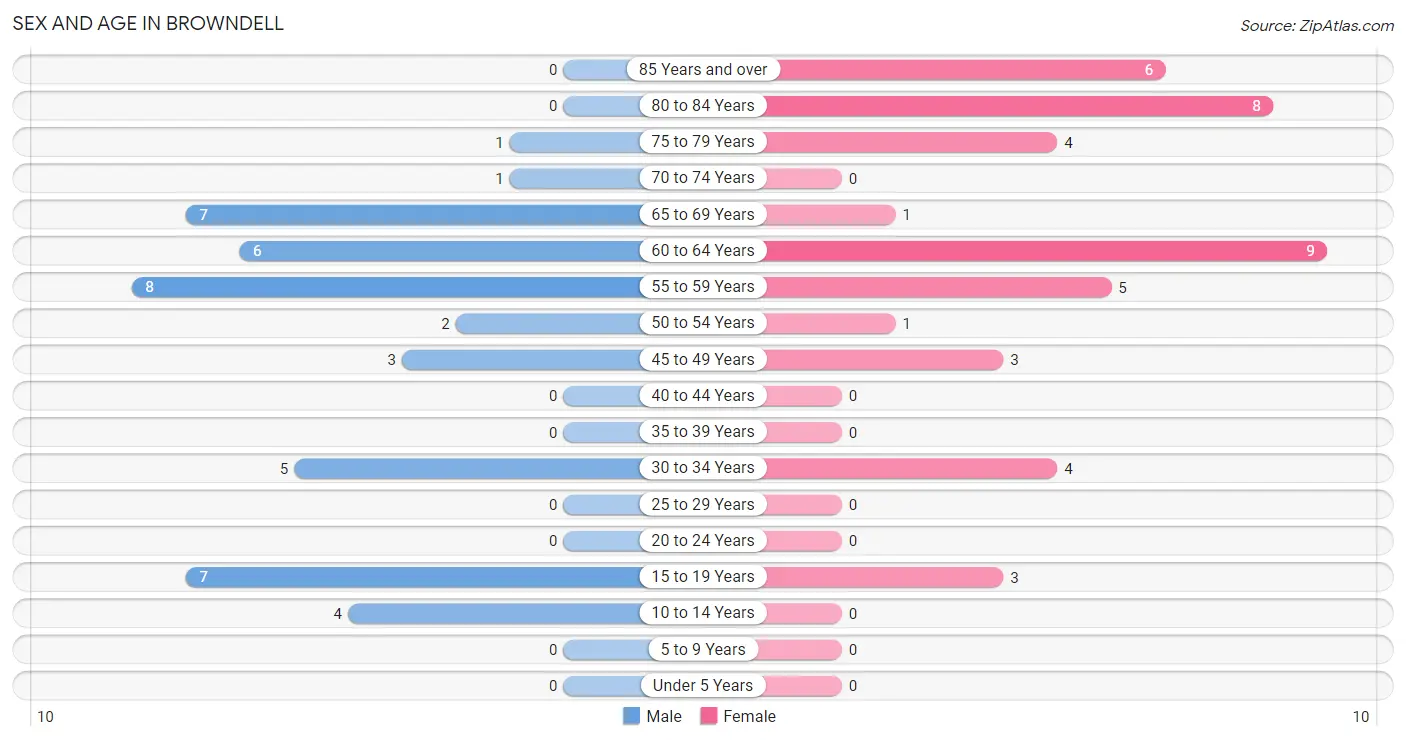
| Age Bracket | Male | Female |
| Under 5 Years | 0 (0.0%) | 0 (0.0%) |
| 5 to 9 Years | 0 (0.0%) | 0 (0.0%) |
| 10 to 14 Years | 4 (9.1%) | 0 (0.0%) |
| 15 to 19 Years | 7 (15.9%) | 3 (6.8%) |
| 20 to 24 Years | 0 (0.0%) | 0 (0.0%) |
| 25 to 29 Years | 0 (0.0%) | 0 (0.0%) |
| 30 to 34 Years | 5 (11.4%) | 4 (9.1%) |
| 35 to 39 Years | 0 (0.0%) | 0 (0.0%) |
| 40 to 44 Years | 0 (0.0%) | 0 (0.0%) |
| 45 to 49 Years | 3 (6.8%) | 3 (6.8%) |
| 50 to 54 Years | 2 (4.5%) | 1 (2.3%) |
| 55 to 59 Years | 8 (18.2%) | 5 (11.4%) |
| 60 to 64 Years | 6 (13.6%) | 9 (20.4%) |
| 65 to 69 Years | 7 (15.9%) | 1 (2.3%) |
| 70 to 74 Years | 1 (2.3%) | 0 (0.0%) |
| 75 to 79 Years | 1 (2.3%) | 4 (9.1%) |
| 80 to 84 Years | 0 (0.0%) | 8 (18.2%) |
| 85 Years and over | 0 (0.0%) | 6 (13.6%) |
| Total | 44 (100.0%) | 44 (100.0%) |
Families and Households in Browndell
Median Family Size in Browndell
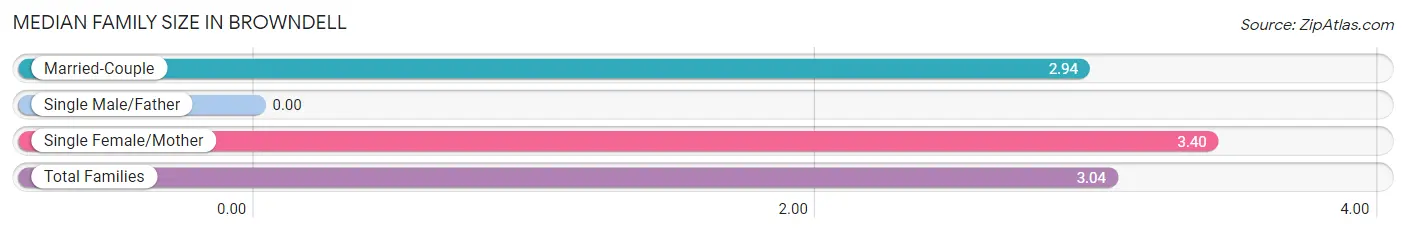
| Family Type | # Families | Family Size |
| Married-Couple | 18 (78.3%) | 2.94 |
| Single Male/Father | 0 (0.0%) | - |
| Single Female/Mother | 5 (21.7%) | 3.40 |
| Total Families | 23 (100.0%) | 3.04 |
Median Household Size in Browndell
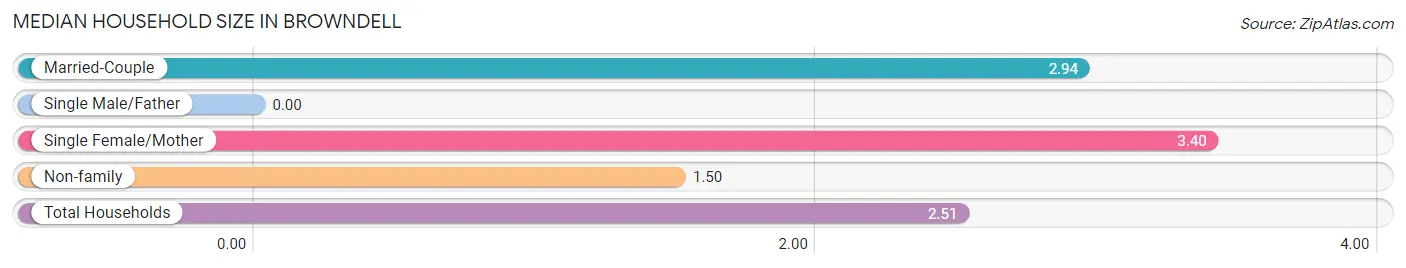
| Household Type | # Households | Household Size |
| Married-Couple | 18 (51.4%) | 2.94 |
| Single Male/Father | 0 (0.0%) | - |
| Single Female/Mother | 5 (14.3%) | 3.40 |
| Non-family | 12 (34.3%) | 1.50 |
| Total Households | 35 (100.0%) | 2.51 |
Household Size by Marriage Status in Browndell
Out of a total of 35 households in Browndell, 23 (65.7%) are family households, while 12 (34.3%) are nonfamily households. The most numerous type of family households are 3-person households, comprising 11, and the most common type of nonfamily households are 1-person households, comprising 10.
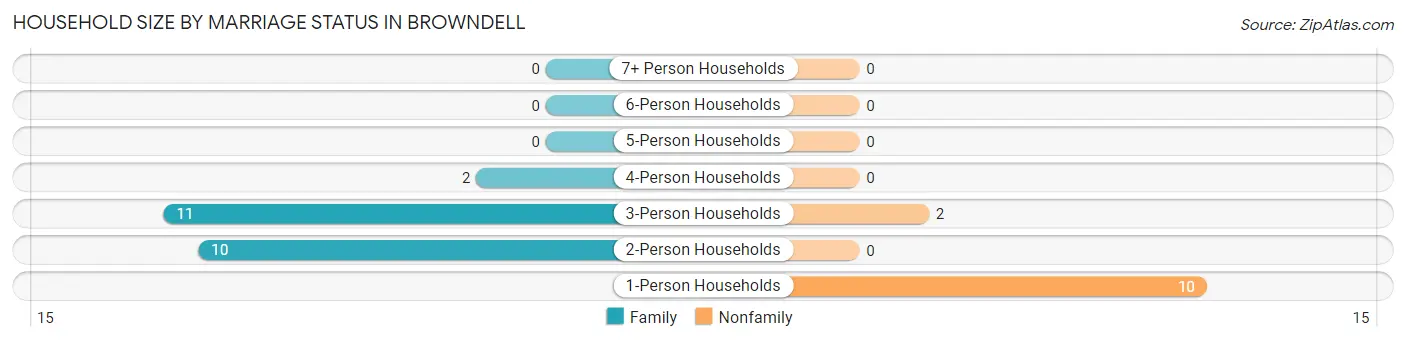
| Household Size | Family Households | Nonfamily Households |
| 1-Person Households | - | 10 (28.6%) |
| 2-Person Households | 10 (28.6%) | 0 (0.0%) |
| 3-Person Households | 11 (31.4%) | 2 (5.7%) |
| 4-Person Households | 2 (5.7%) | 0 (0.0%) |
| 5-Person Households | 0 (0.0%) | 0 (0.0%) |
| 6-Person Households | 0 (0.0%) | 0 (0.0%) |
| 7+ Person Households | 0 (0.0%) | 0 (0.0%) |
| Total | 23 (65.7%) | 12 (34.3%) |
Female Fertility in Browndell
Fertility by Age in Browndell
Average fertility rate in Browndell is 200.0 births per 1,000 women. Women in the age bracket of 15 to 19 years have the highest fertility rate with 667.0 births per 1,000 women. Women in the age bracket of 15 to 19 years acount for 100.0% of all women with births.
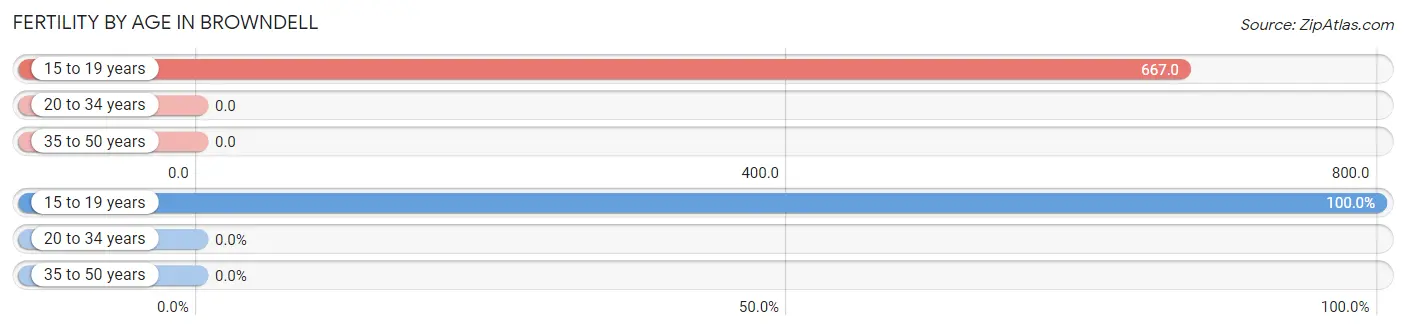
| Age Bracket | Women with Births | Births / 1,000 Women |
| 15 to 19 years | 2 (100.0%) | 667.0 |
| 20 to 34 years | 0 (0.0%) | 0.0 |
| 35 to 50 years | 0 (0.0%) | 0.0 |
| Total | 2 (100.0%) | 200.0 |
Fertility by Age by Marriage Status in Browndell
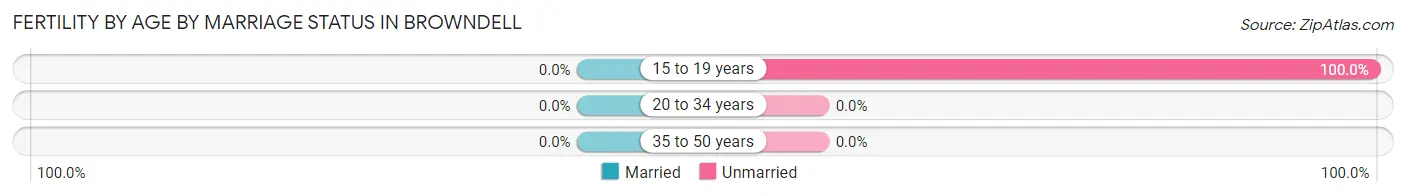
| Age Bracket | Married | Unmarried |
| 15 to 19 years | 0 (0.0%) | 2 (100.0%) |
| 20 to 34 years | 0 (0.0%) | 0 (0.0%) |
| 35 to 50 years | 0 (0.0%) | 0 (0.0%) |
| Total | 0 (0.0%) | 2 (100.0%) |
Fertility by Education in Browndell
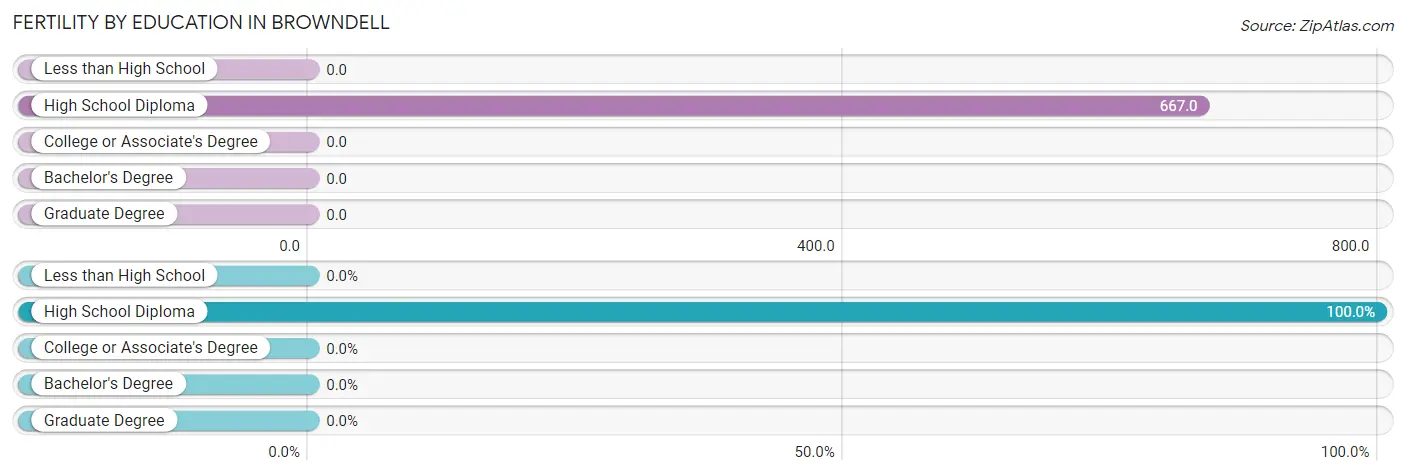
| Educational Attainment | Women with Births | Births / 1,000 Women |
| Less than High School | 0 (0.0%) | 0.0 |
| High School Diploma | 2 (100.0%) | 667.0 |
| College or Associate's Degree | 0 (0.0%) | 0.0 |
| Bachelor's Degree | 0 (0.0%) | 0.0 |
| Graduate Degree | 0 (0.0%) | 0.0 |
| Total | 2 (100.0%) | 200.0 |
Fertility by Education by Marriage Status in Browndell
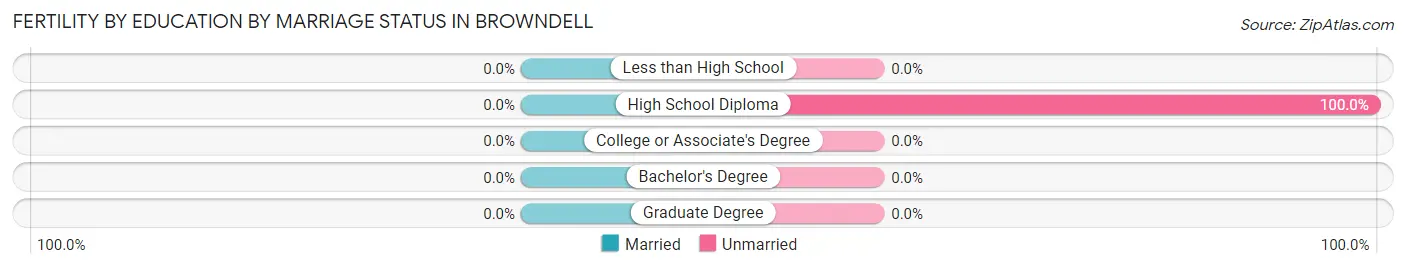
| Educational Attainment | Married | Unmarried |
| Less than High School | 0 (0.0%) | 0 (0.0%) |
| High School Diploma | 0 (0.0%) | 2 (100.0%) |
| College or Associate's Degree | 0 (0.0%) | 0 (0.0%) |
| Bachelor's Degree | 0 (0.0%) | 0 (0.0%) |
| Graduate Degree | 0 (0.0%) | 0 (0.0%) |
| Total | 0 (0.0%) | 2 (100.0%) |
Employment Characteristics in Browndell
Employment by Class of Employer in Browndell
Among the 27 employed individuals in Browndell, private company employees (20 | 74.1%), not-for-profit organizations (5 | 18.5%), and local government employees (2 | 7.4%) make up the most common classes of employment.
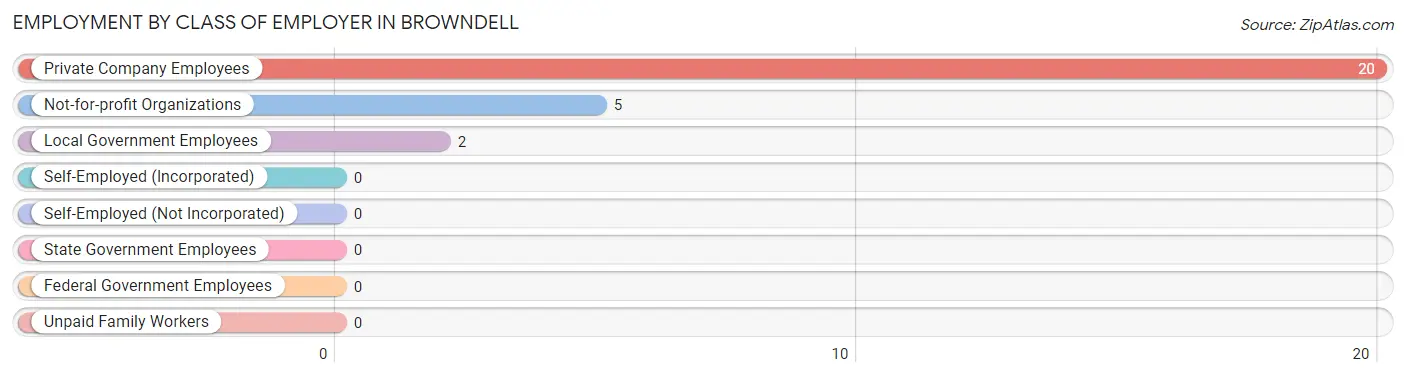
| Employer Class | # Employees | % Employees |
| Private Company Employees | 20 | 74.1% |
| Self-Employed (Incorporated) | 0 | 0.0% |
| Self-Employed (Not Incorporated) | 0 | 0.0% |
| Not-for-profit Organizations | 5 | 18.5% |
| Local Government Employees | 2 | 7.4% |
| State Government Employees | 0 | 0.0% |
| Federal Government Employees | 0 | 0.0% |
| Unpaid Family Workers | 0 | 0.0% |
| Total | 27 | 100.0% |
Employment Status by Age in Browndell
According to the labor force statistics for Browndell, out of the total population over 16 years of age (84), 34.5% or 29 individuals are in the labor force, with 6.9% or 2 of them unemployed. The age group with the highest labor force participation rate is 30 to 34 years, with 100.0% or 9 individuals in the labor force. Within the labor force, the 55 to 59 years age range has the highest percentage of unemployed individuals, with 66.7% or 2 of them being unemployed.
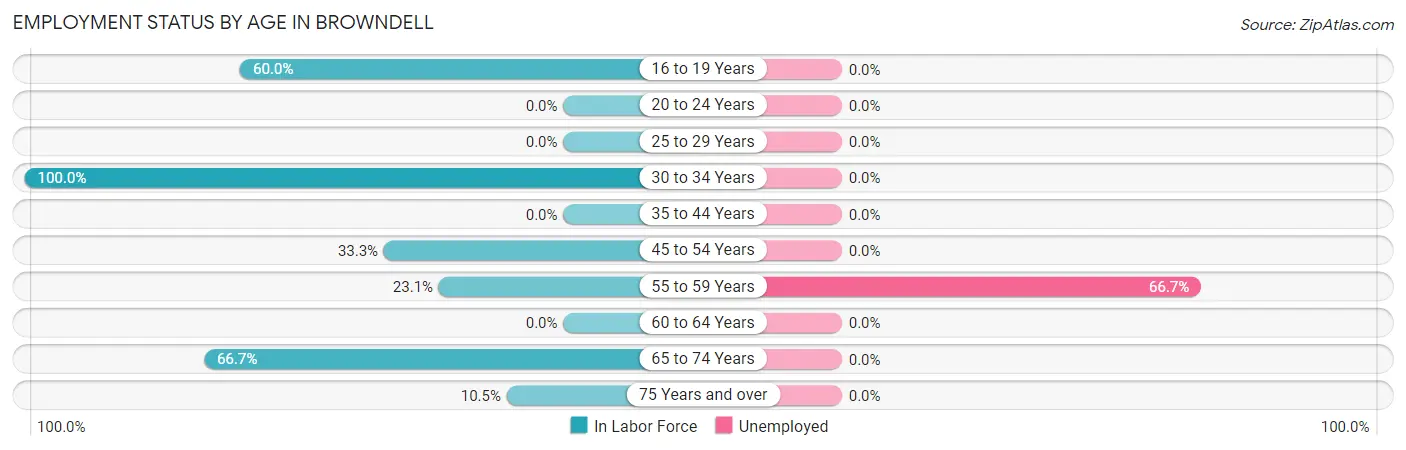
| Age Bracket | In Labor Force | Unemployed |
| 16 to 19 Years | 6 (60.0%) | 0 (0.0%) |
| 20 to 24 Years | 0 (0.0%) | 0 (0.0%) |
| 25 to 29 Years | 0 (0.0%) | 0 (0.0%) |
| 30 to 34 Years | 9 (100.0%) | 0 (0.0%) |
| 35 to 44 Years | 0 (0.0%) | 0 (0.0%) |
| 45 to 54 Years | 3 (33.3%) | 0 (0.0%) |
| 55 to 59 Years | 3 (23.1%) | 2 (66.7%) |
| 60 to 64 Years | 0 (0.0%) | 0 (0.0%) |
| 65 to 74 Years | 6 (66.7%) | 0 (0.0%) |
| 75 Years and over | 2 (10.5%) | 0 (0.0%) |
| Total | 29 (34.5%) | 2 (6.9%) |
Employment Status by Educational Attainment in Browndell
According to labor force statistics for Browndell, 32.6% of individuals (15) out of the total population between 25 and 64 years of age (46) are in the labor force, with 13.3% or 2 of them being unemployed. The group with the highest labor force participation rate are those with the educational attainment of less than high school, with 66.7% or 10 individuals in the labor force. Within the labor force, individuals with college / associate degree education have the highest percentage of unemployment, with 100.0% or 2 of them being unemployed.
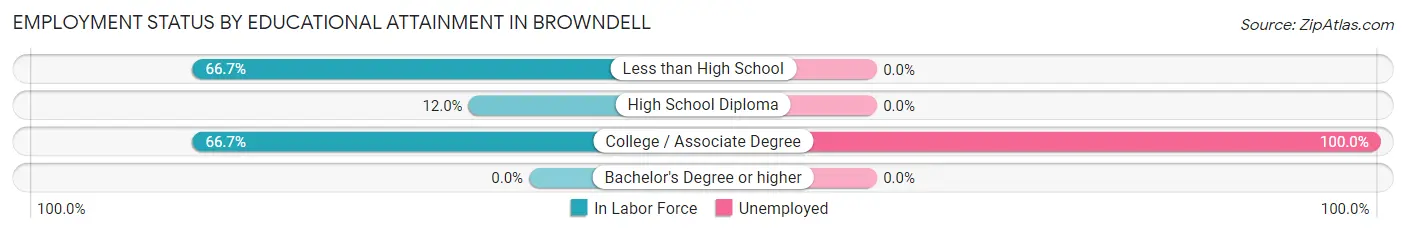
| Educational Attainment | In Labor Force | Unemployed |
| Less than High School | 10 (66.7%) | 0 (0.0%) |
| High School Diploma | 3 (12.0%) | 0 (0.0%) |
| College / Associate Degree | 2 (66.7%) | 3 (100.0%) |
| Bachelor's Degree or higher | 0 (0.0%) | 0 (0.0%) |
| Total | 15 (32.6%) | 6 (13.3%) |
Employment Occupations by Sex in Browndell
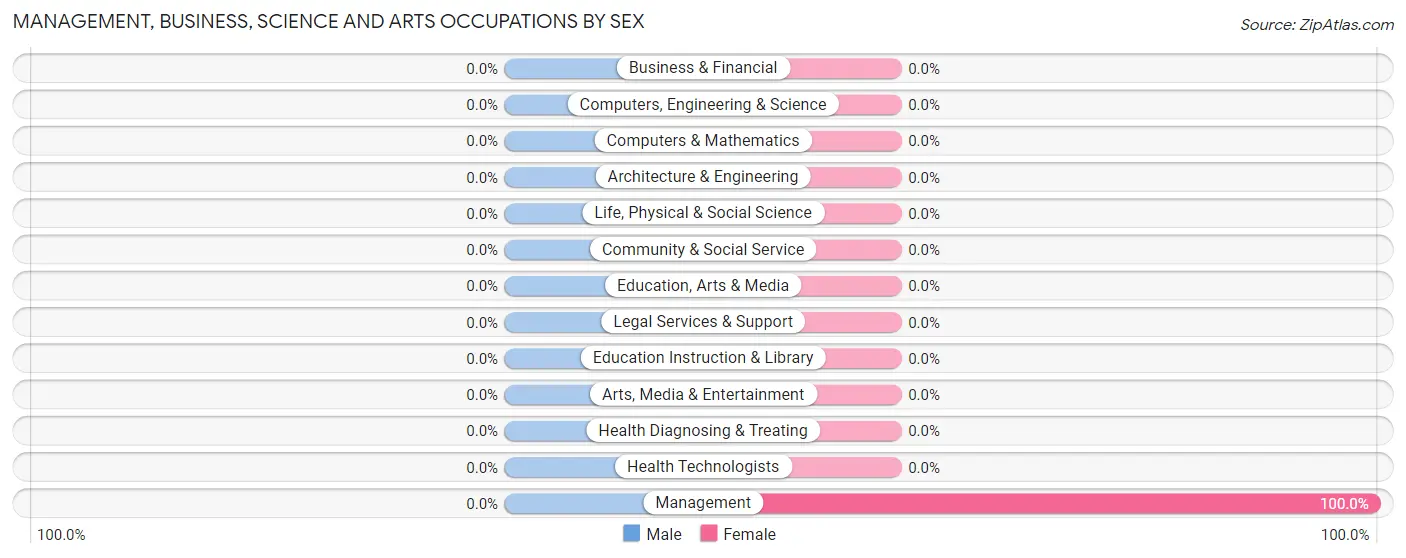
Management, Business, Science and Arts Occupations
The most common Management, Business, Science and Arts occupations in Browndell are , and Management (4 | 14.8%).
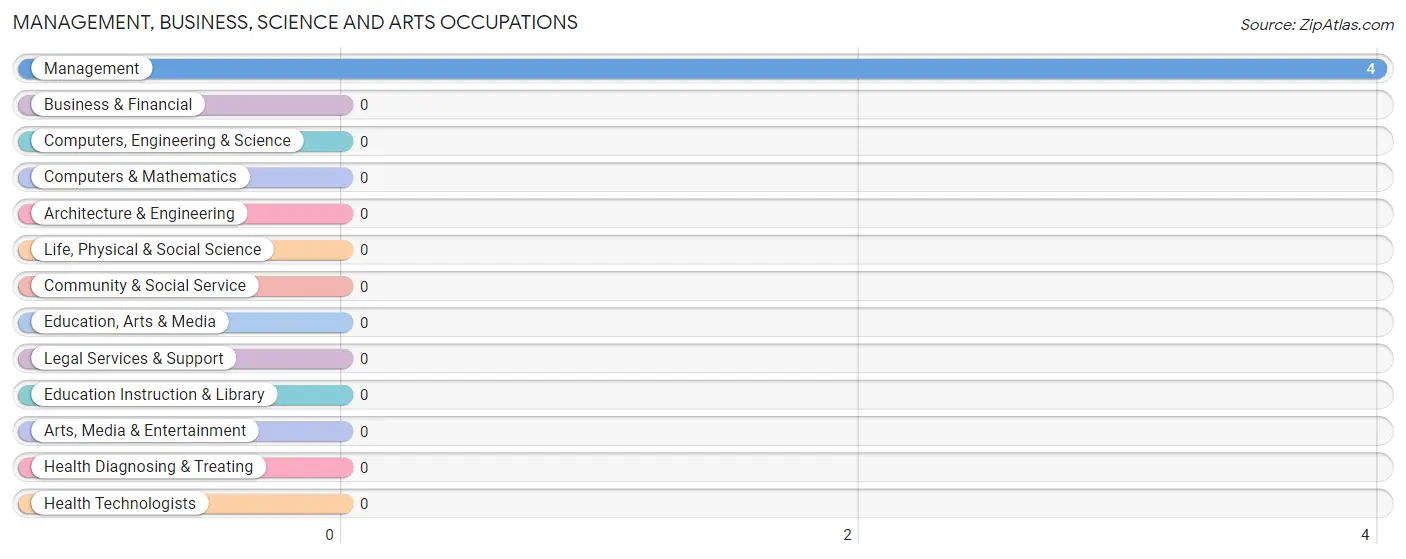
Management, Business, Science and Arts Occupations by Sex
| Occupation | Male | Female |
| Management | 0 (0.0%) | 4 (100.0%) |
| Business & Financial | 0 (0.0%) | 0 (0.0%) |
| Computers, Engineering & Science | 0 (0.0%) | 0 (0.0%) |
| Computers & Mathematics | 0 (0.0%) | 0 (0.0%) |
| Architecture & Engineering | 0 (0.0%) | 0 (0.0%) |
| Life, Physical & Social Science | 0 (0.0%) | 0 (0.0%) |
| Community & Social Service | 0 (0.0%) | 0 (0.0%) |
| Education, Arts & Media | 0 (0.0%) | 0 (0.0%) |
| Legal Services & Support | 0 (0.0%) | 0 (0.0%) |
| Education Instruction & Library | 0 (0.0%) | 0 (0.0%) |
| Arts, Media & Entertainment | 0 (0.0%) | 0 (0.0%) |
| Health Diagnosing & Treating | 0 (0.0%) | 0 (0.0%) |
| Health Technologists | 0 (0.0%) | 0 (0.0%) |
| Total (Category) | 0 (0.0%) | 4 (100.0%) |
| Total (Overall) | 19 (70.4%) | 8 (29.6%) |
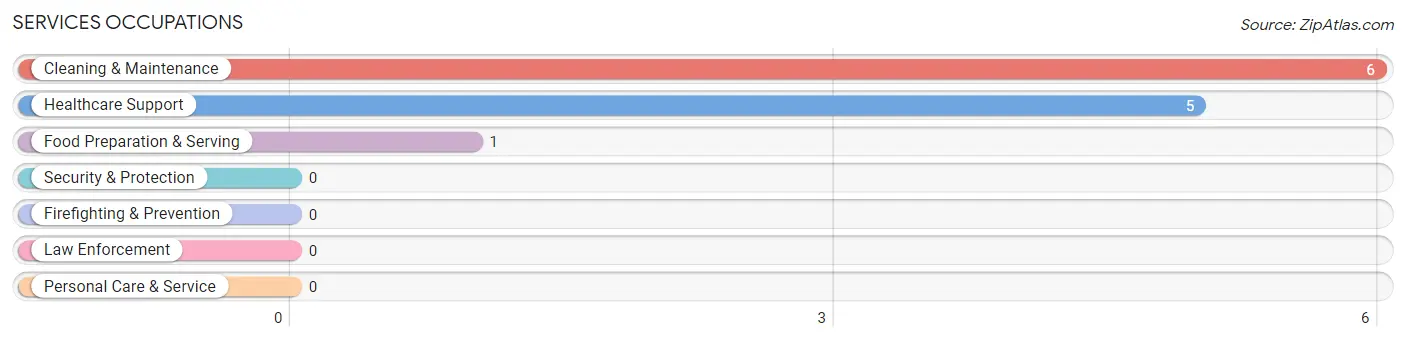
Services Occupations
The most common Services occupations in Browndell are Cleaning & Maintenance (6 | 22.2%), Healthcare Support (5 | 18.5%), and Food Preparation & Serving (1 | 3.7%).
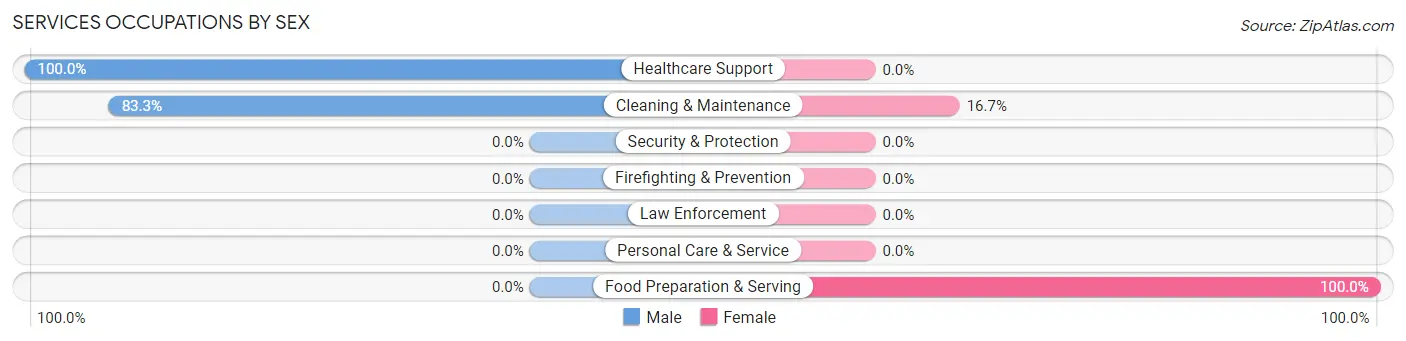
Services Occupations by Sex
Within the Services occupations in Browndell, the most male-oriented occupations are Healthcare Support (100.0%), and Cleaning & Maintenance (83.3%), while the most female-oriented occupations are Food Preparation & Serving (100.0%), and Cleaning & Maintenance (16.7%).
| Occupation | Male | Female |
| Healthcare Support | 5 (100.0%) | 0 (0.0%) |
| Security & Protection | 0 (0.0%) | 0 (0.0%) |
| Firefighting & Prevention | 0 (0.0%) | 0 (0.0%) |
| Law Enforcement | 0 (0.0%) | 0 (0.0%) |
| Food Preparation & Serving | 0 (0.0%) | 1 (100.0%) |
| Cleaning & Maintenance | 5 (83.3%) | 1 (16.7%) |
| Personal Care & Service | 0 (0.0%) | 0 (0.0%) |
| Total (Category) | 10 (83.3%) | 2 (16.7%) |
| Total (Overall) | 19 (70.4%) | 8 (29.6%) |
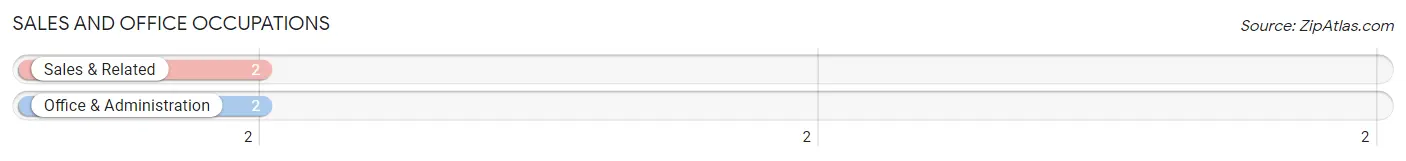
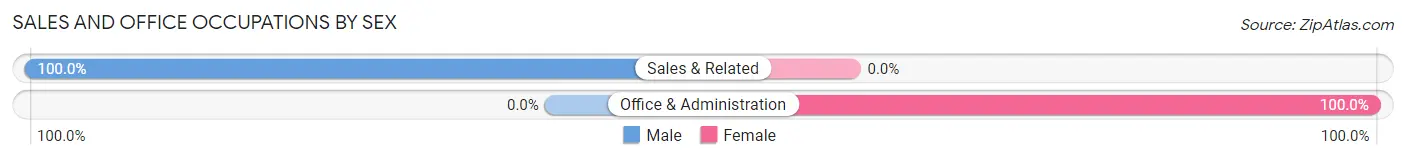
Sales and Office Occupations
The most common Sales and Office occupations in Browndell are Sales & Related (2 | 7.4%), and Office & Administration (2 | 7.4%).
Sales and Office Occupations by Sex
| Occupation | Male | Female |
| Sales & Related | 2 (100.0%) | 0 (0.0%) |
| Office & Administration | 0 (0.0%) | 2 (100.0%) |
| Total (Category) | 2 (50.0%) | 2 (50.0%) |
| Total (Overall) | 19 (70.4%) | 8 (29.6%) |
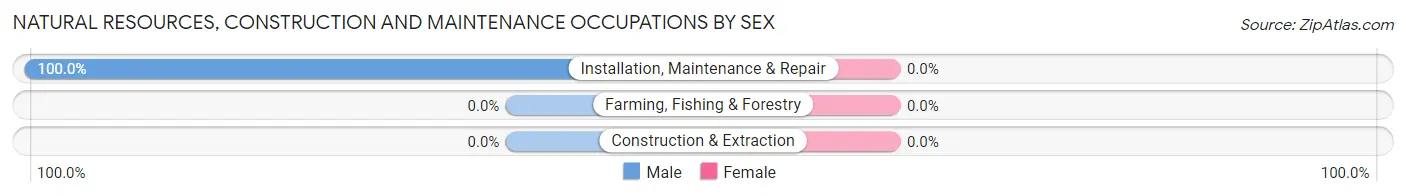
Natural Resources, Construction and Maintenance Occupations
The most common Natural Resources, Construction and Maintenance occupations in Browndell are , and Installation, Maintenance & Repair (1 | 3.7%).
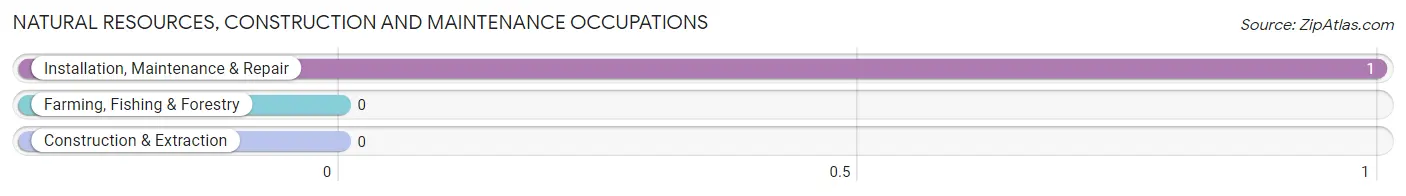
Natural Resources, Construction and Maintenance Occupations by Sex
| Occupation | Male | Female |
| Farming, Fishing & Forestry | 0 (0.0%) | 0 (0.0%) |
| Construction & Extraction | 0 (0.0%) | 0 (0.0%) |
| Installation, Maintenance & Repair | 1 (100.0%) | 0 (0.0%) |
| Total (Category) | 1 (100.0%) | 0 (0.0%) |
| Total (Overall) | 19 (70.4%) | 8 (29.6%) |
Production, Transportation and Moving Occupations
The most common Production, Transportation and Moving occupations in Browndell are , and Transportation (6 | 22.2%).
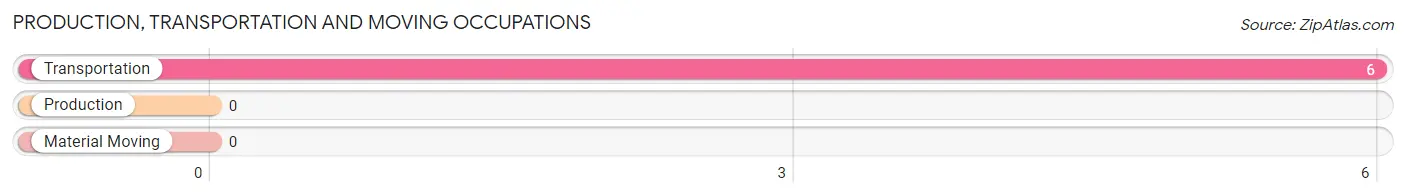
Production, Transportation and Moving Occupations by Sex
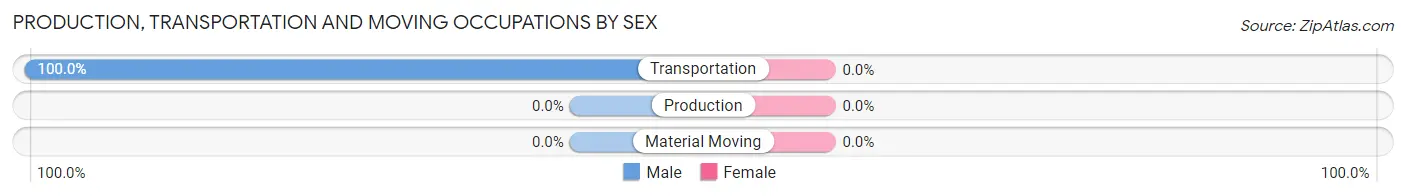
| Occupation | Male | Female |
| Production | 0 (0.0%) | 0 (0.0%) |
| Transportation | 6 (100.0%) | 0 (0.0%) |
| Material Moving | 0 (0.0%) | 0 (0.0%) |
| Total (Category) | 6 (100.0%) | 0 (0.0%) |
| Total (Overall) | 19 (70.4%) | 8 (29.6%) |
Employment Industries by Sex in Browndell
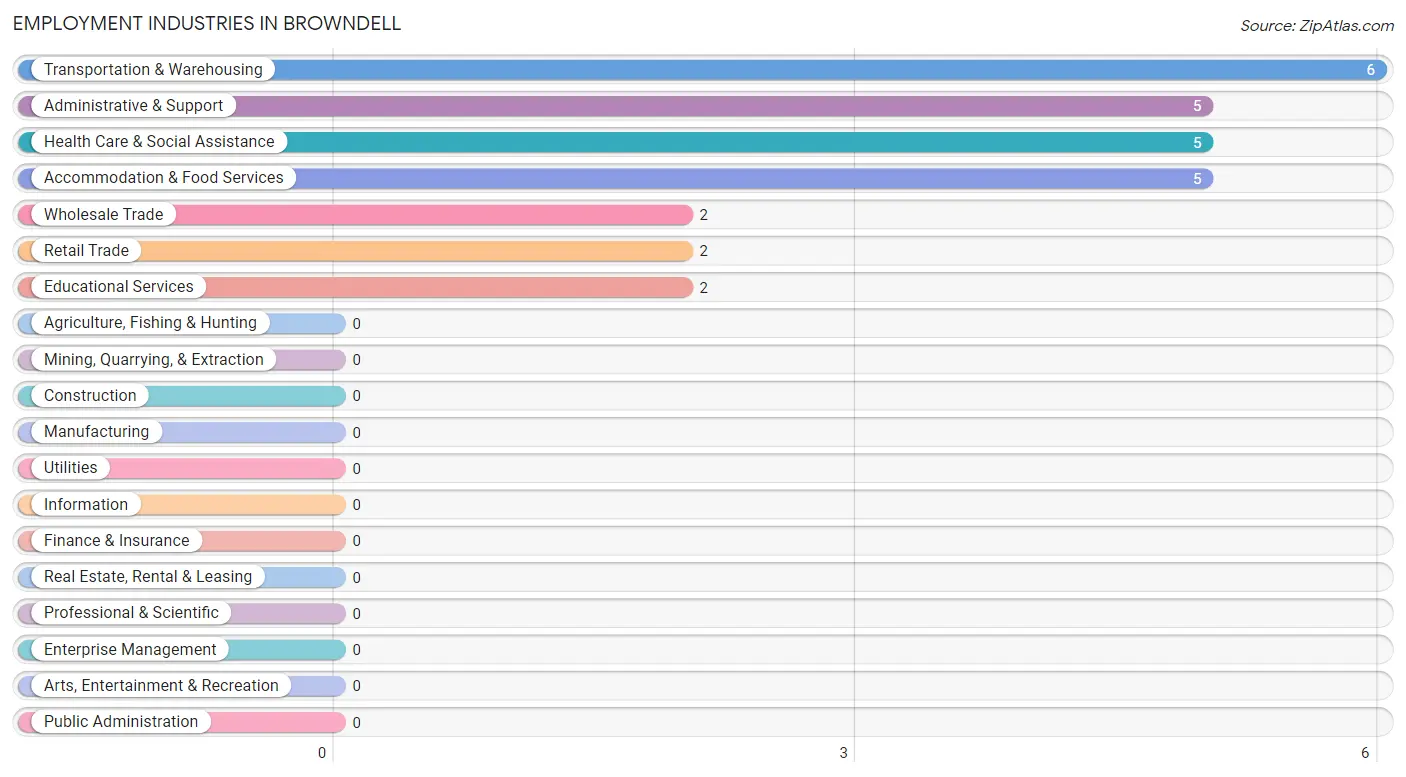
Employment Industries in Browndell
The major employment industries in Browndell include Transportation & Warehousing (6 | 22.2%), Administrative & Support (5 | 18.5%), Health Care & Social Assistance (5 | 18.5%), Accommodation & Food Services (5 | 18.5%), and Wholesale Trade (2 | 7.4%).
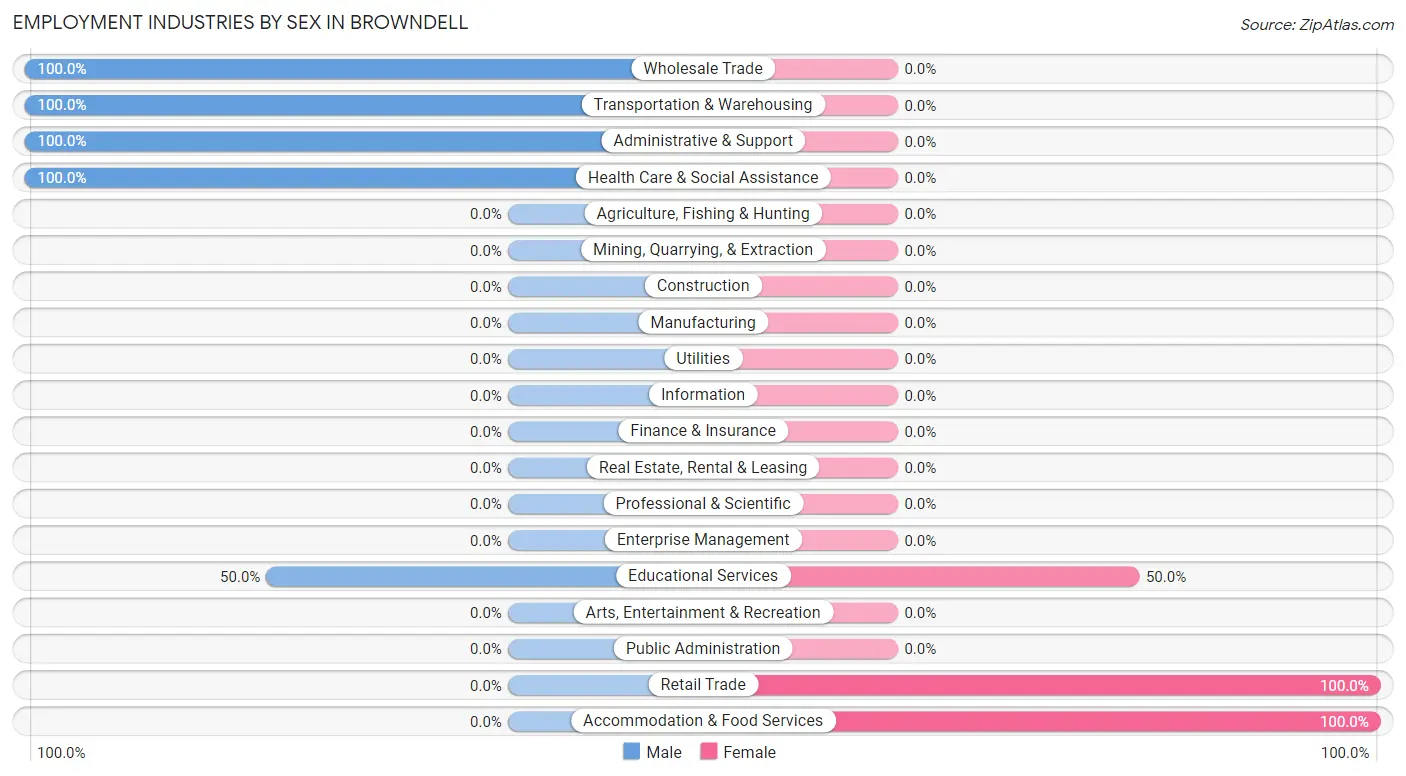
Employment Industries by Sex in Browndell
The Browndell industries that see more men than women are Wholesale Trade (100.0%), Transportation & Warehousing (100.0%), and Administrative & Support (100.0%), whereas the industries that tend to have a higher number of women are Retail Trade (100.0%), Accommodation & Food Services (100.0%), and Educational Services (50.0%).
| Industry | Male | Female |
| Agriculture, Fishing & Hunting | 0 (0.0%) | 0 (0.0%) |
| Mining, Quarrying, & Extraction | 0 (0.0%) | 0 (0.0%) |
| Construction | 0 (0.0%) | 0 (0.0%) |
| Manufacturing | 0 (0.0%) | 0 (0.0%) |
| Wholesale Trade | 2 (100.0%) | 0 (0.0%) |
| Retail Trade | 0 (0.0%) | 2 (100.0%) |
| Transportation & Warehousing | 6 (100.0%) | 0 (0.0%) |
| Utilities | 0 (0.0%) | 0 (0.0%) |
| Information | 0 (0.0%) | 0 (0.0%) |
| Finance & Insurance | 0 (0.0%) | 0 (0.0%) |
| Real Estate, Rental & Leasing | 0 (0.0%) | 0 (0.0%) |
| Professional & Scientific | 0 (0.0%) | 0 (0.0%) |
| Enterprise Management | 0 (0.0%) | 0 (0.0%) |
| Administrative & Support | 5 (100.0%) | 0 (0.0%) |
| Educational Services | 1 (50.0%) | 1 (50.0%) |
| Health Care & Social Assistance | 5 (100.0%) | 0 (0.0%) |
| Arts, Entertainment & Recreation | 0 (0.0%) | 0 (0.0%) |
| Accommodation & Food Services | 0 (0.0%) | 5 (100.0%) |
| Public Administration | 0 (0.0%) | 0 (0.0%) |
| Total | 19 (70.4%) | 8 (29.6%) |
Education in Browndell
School Enrollment in Browndell
The most common levels of schooling among the 6 students in Browndell are elementary school (4 | 66.7%), and high school (2 | 33.3%).
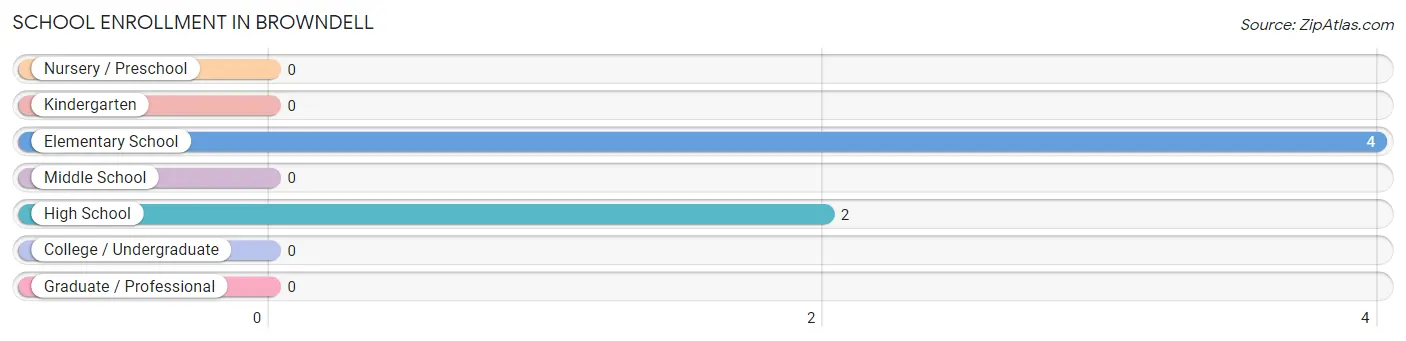
| School Level | # Students | % Students |
| Nursery / Preschool | 0 | 0.0% |
| Kindergarten | 0 | 0.0% |
| Elementary School | 4 | 66.7% |
| Middle School | 0 | 0.0% |
| High School | 2 | 33.3% |
| College / Undergraduate | 0 | 0.0% |
| Graduate / Professional | 0 | 0.0% |
| Total | 6 | 100.0% |
School Enrollment by Age by Funding Source in Browndell
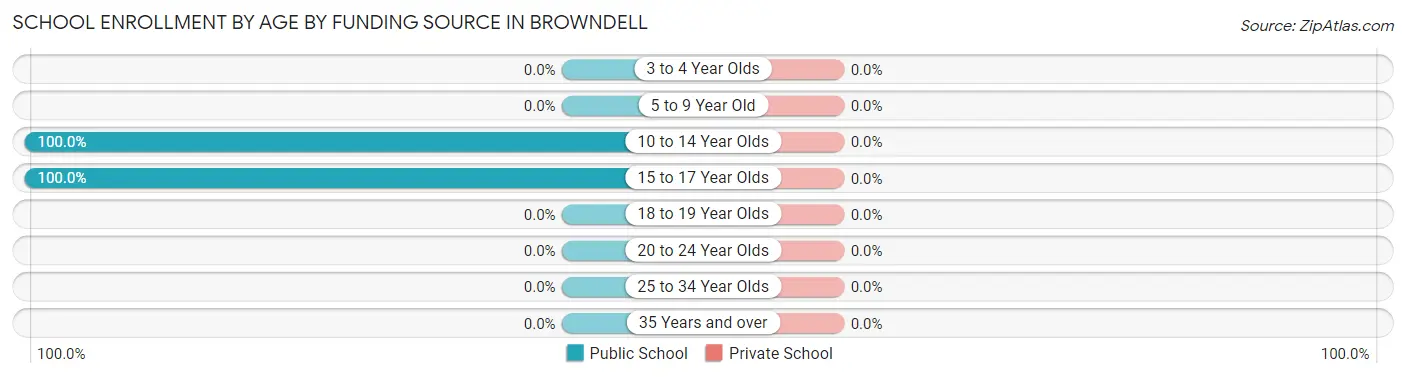
| Age Bracket | Public School | Private School |
| 3 to 4 Year Olds | 0 (0.0%) | 0 (0.0%) |
| 5 to 9 Year Old | 0 (0.0%) | 0 (0.0%) |
| 10 to 14 Year Olds | 4 (100.0%) | 0 (0.0%) |
| 15 to 17 Year Olds | 2 (100.0%) | 0 (0.0%) |
| 18 to 19 Year Olds | 0 (0.0%) | 0 (0.0%) |
| 20 to 24 Year Olds | 0 (0.0%) | 0 (0.0%) |
| 25 to 34 Year Olds | 0 (0.0%) | 0 (0.0%) |
| 35 Years and over | 0 (0.0%) | 0 (0.0%) |
| Total | 6 (100.0%) | 0 (0.0%) |
Educational Attainment by Field of Study in Browndell
Computers & mathematics (3 | 50.0%), and arts & humanities (3 | 50.0%) are the most common fields of study among 6 individuals in Browndell who have obtained a bachelor's degree or higher.
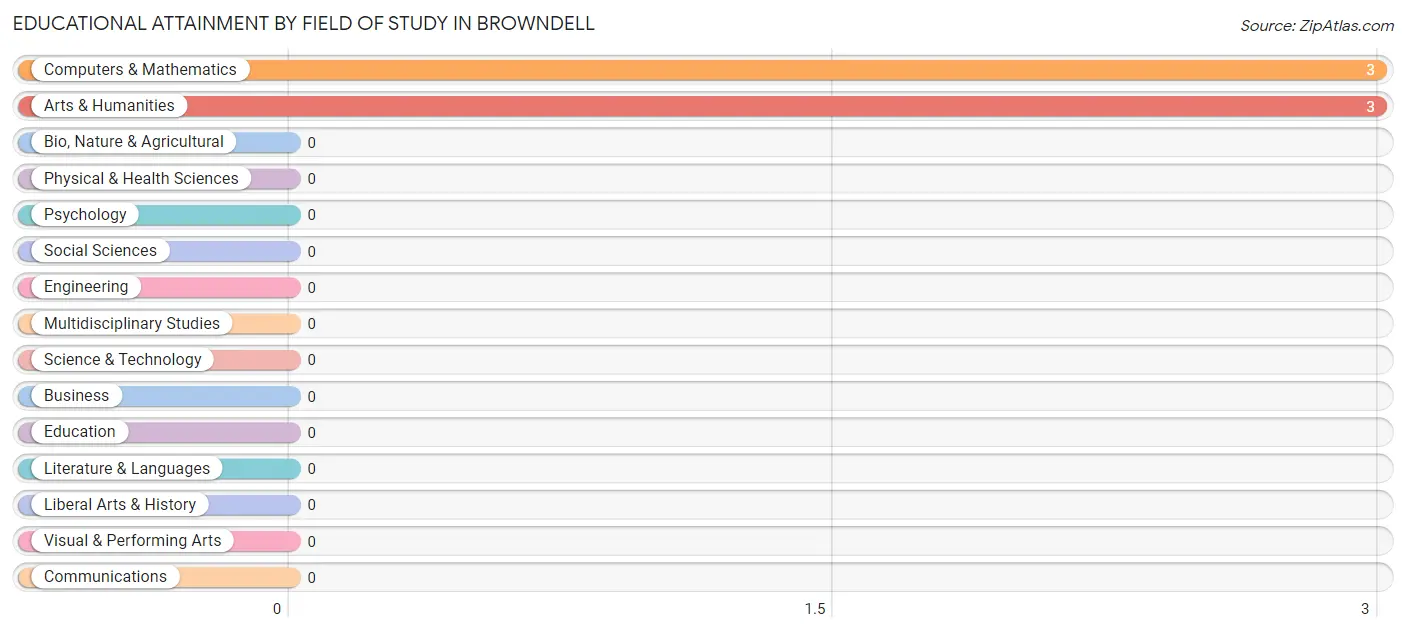
| Field of Study | # Graduates | % Graduates |
| Computers & Mathematics | 3 | 50.0% |
| Bio, Nature & Agricultural | 0 | 0.0% |
| Physical & Health Sciences | 0 | 0.0% |
| Psychology | 0 | 0.0% |
| Social Sciences | 0 | 0.0% |
| Engineering | 0 | 0.0% |
| Multidisciplinary Studies | 0 | 0.0% |
| Science & Technology | 0 | 0.0% |
| Business | 0 | 0.0% |
| Education | 0 | 0.0% |
| Literature & Languages | 0 | 0.0% |
| Liberal Arts & History | 0 | 0.0% |
| Visual & Performing Arts | 0 | 0.0% |
| Communications | 0 | 0.0% |
| Arts & Humanities | 3 | 50.0% |
| Total | 6 | 100.0% |
Transportation & Commute in Browndell
Vehicle Availability by Sex in Browndell
The most prevalent vehicle ownership categories in Browndell are males with 2 vehicles (19, accounting for 100.0%) and females with 2 vehicles (6, making up 237.5%).
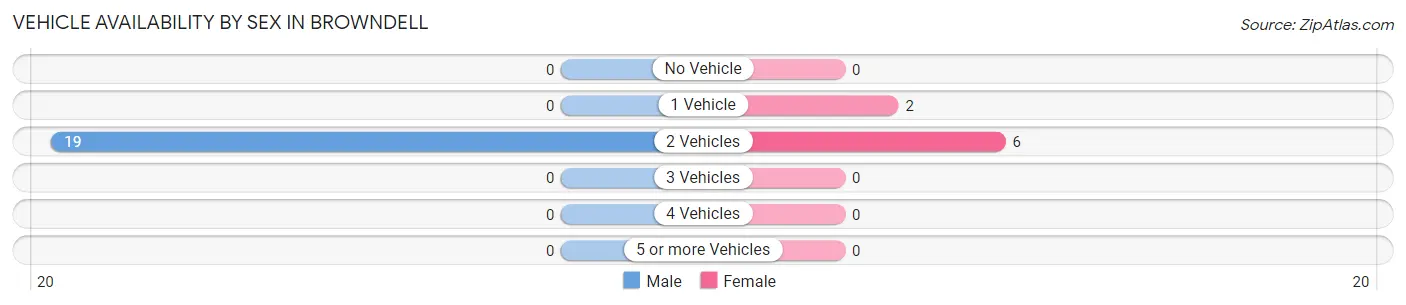
| Vehicles Available | Male | Female |
| No Vehicle | 0 (0.0%) | 0 (0.0%) |
| 1 Vehicle | 0 (0.0%) | 2 (25.0%) |
| 2 Vehicles | 19 (100.0%) | 6 (75.0%) |
| 3 Vehicles | 0 (0.0%) | 0 (0.0%) |
| 4 Vehicles | 0 (0.0%) | 0 (0.0%) |
| 5 or more Vehicles | 0 (0.0%) | 0 (0.0%) |
| Total | 19 (100.0%) | 8 (100.0%) |
Commute Time in Browndell
The most frequently occuring commute durations in Browndell are 30 to 34 minutes (6 commuters, 30.0%), 90 or more minutes (5 commuters, 25.0%), and 60 to 89 minutes (4 commuters, 20.0%).
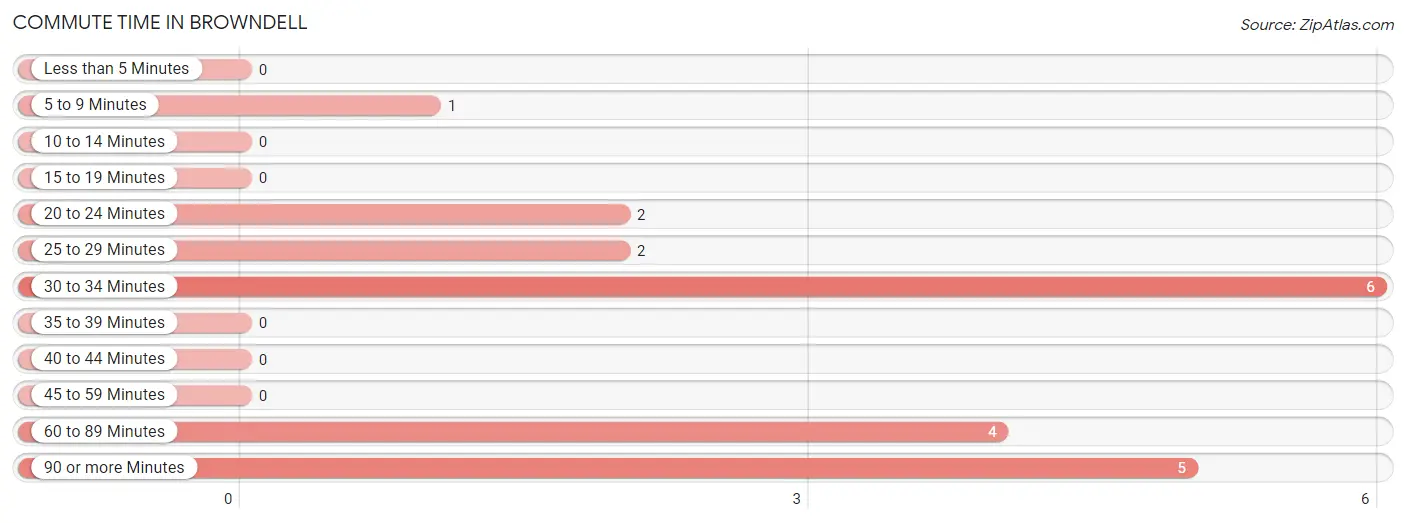
| Commute Time | # Commuters | % Commuters |
| Less than 5 Minutes | 0 | 0.0% |
| 5 to 9 Minutes | 1 | 5.0% |
| 10 to 14 Minutes | 0 | 0.0% |
| 15 to 19 Minutes | 0 | 0.0% |
| 20 to 24 Minutes | 2 | 10.0% |
| 25 to 29 Minutes | 2 | 10.0% |
| 30 to 34 Minutes | 6 | 30.0% |
| 35 to 39 Minutes | 0 | 0.0% |
| 40 to 44 Minutes | 0 | 0.0% |
| 45 to 59 Minutes | 0 | 0.0% |
| 60 to 89 Minutes | 4 | 20.0% |
| 90 or more Minutes | 5 | 25.0% |
Commute Time by Sex in Browndell
The most common commute times in Browndell are 30 to 34 minutes (6 commuters, 50.0%) for males and 60 to 89 minutes (4 commuters, 50.0%) for females.
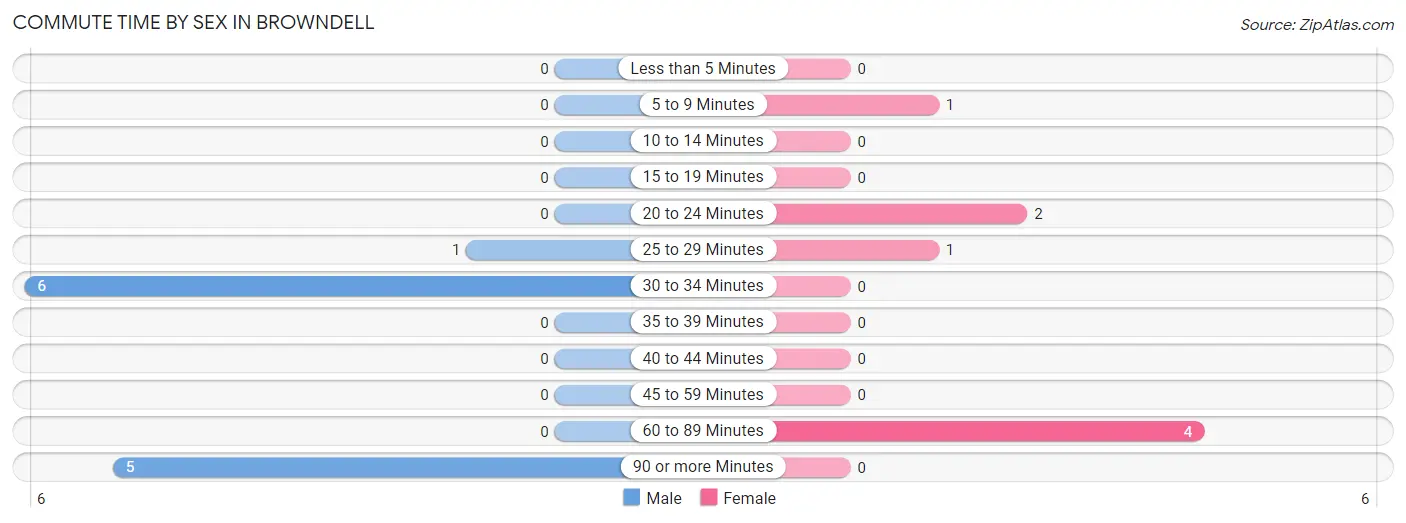
| Commute Time | Male | Female |
| Less than 5 Minutes | 0 (0.0%) | 0 (0.0%) |
| 5 to 9 Minutes | 0 (0.0%) | 1 (12.5%) |
| 10 to 14 Minutes | 0 (0.0%) | 0 (0.0%) |
| 15 to 19 Minutes | 0 (0.0%) | 0 (0.0%) |
| 20 to 24 Minutes | 0 (0.0%) | 2 (25.0%) |
| 25 to 29 Minutes | 1 (8.3%) | 1 (12.5%) |
| 30 to 34 Minutes | 6 (50.0%) | 0 (0.0%) |
| 35 to 39 Minutes | 0 (0.0%) | 0 (0.0%) |
| 40 to 44 Minutes | 0 (0.0%) | 0 (0.0%) |
| 45 to 59 Minutes | 0 (0.0%) | 0 (0.0%) |
| 60 to 89 Minutes | 0 (0.0%) | 4 (50.0%) |
| 90 or more Minutes | 5 (41.7%) | 0 (0.0%) |
Time of Departure to Work by Sex in Browndell
The most frequent times of departure to work in Browndell are 6:00 AM to 6:29 AM (11, 91.7%) for males and 10:00 AM to 10:59 AM (4, 50.0%) for females.
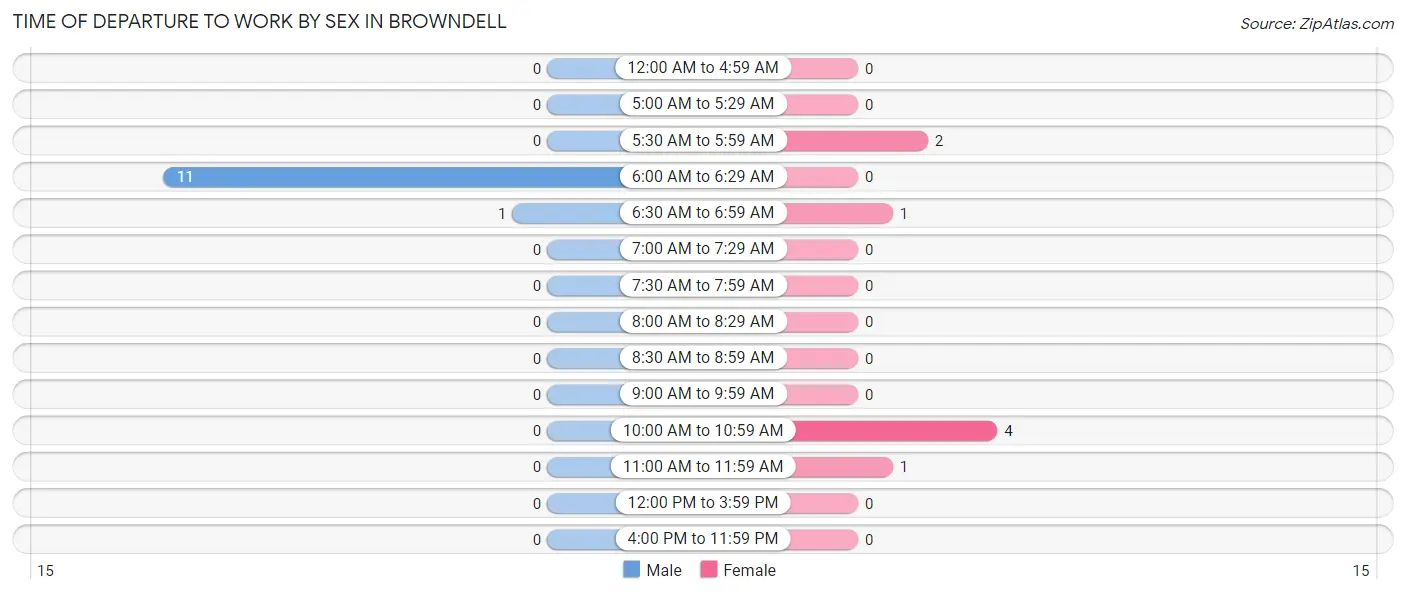
| Time of Departure | Male | Female |
| 12:00 AM to 4:59 AM | 0 (0.0%) | 0 (0.0%) |
| 5:00 AM to 5:29 AM | 0 (0.0%) | 0 (0.0%) |
| 5:30 AM to 5:59 AM | 0 (0.0%) | 2 (25.0%) |
| 6:00 AM to 6:29 AM | 11 (91.7%) | 0 (0.0%) |
| 6:30 AM to 6:59 AM | 1 (8.3%) | 1 (12.5%) |
| 7:00 AM to 7:29 AM | 0 (0.0%) | 0 (0.0%) |
| 7:30 AM to 7:59 AM | 0 (0.0%) | 0 (0.0%) |
| 8:00 AM to 8:29 AM | 0 (0.0%) | 0 (0.0%) |
| 8:30 AM to 8:59 AM | 0 (0.0%) | 0 (0.0%) |
| 9:00 AM to 9:59 AM | 0 (0.0%) | 0 (0.0%) |
| 10:00 AM to 10:59 AM | 0 (0.0%) | 4 (50.0%) |
| 11:00 AM to 11:59 AM | 0 (0.0%) | 1 (12.5%) |
| 12:00 PM to 3:59 PM | 0 (0.0%) | 0 (0.0%) |
| 4:00 PM to 11:59 PM | 0 (0.0%) | 0 (0.0%) |
| Total | 12 (100.0%) | 8 (100.0%) |
Housing Occupancy in Browndell
Occupancy by Ownership in Browndell
Of the total 35 dwellings in Browndell, owner-occupied units account for 33 (94.3%), while renter-occupied units make up 2 (5.7%).
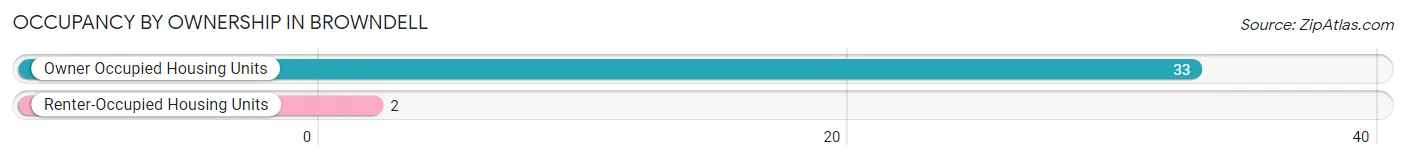
| Occupancy | # Housing Units | % Housing Units |
| Owner Occupied Housing Units | 33 | 94.3% |
| Renter-Occupied Housing Units | 2 | 5.7% |
| Total Occupied Housing Units | 35 | 100.0% |
Occupancy by Household Size in Browndell
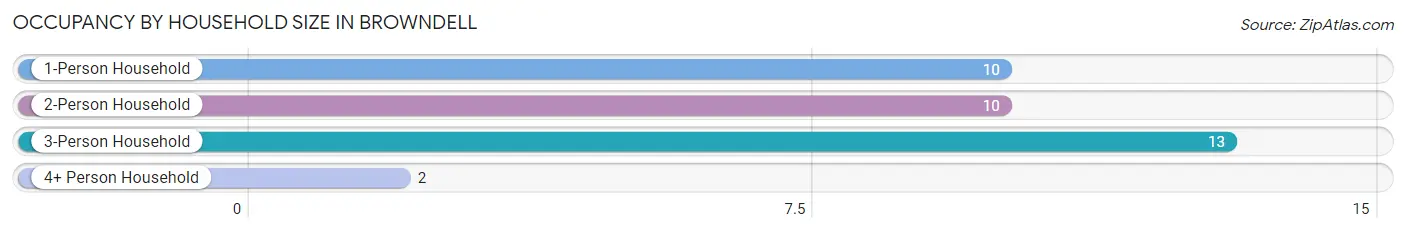
| Household Size | # Housing Units | % Housing Units |
| 1-Person Household | 10 | 28.6% |
| 2-Person Household | 10 | 28.6% |
| 3-Person Household | 13 | 37.1% |
| 4+ Person Household | 2 | 5.7% |
| Total Housing Units | 35 | 100.0% |
Occupancy by Ownership by Household Size in Browndell
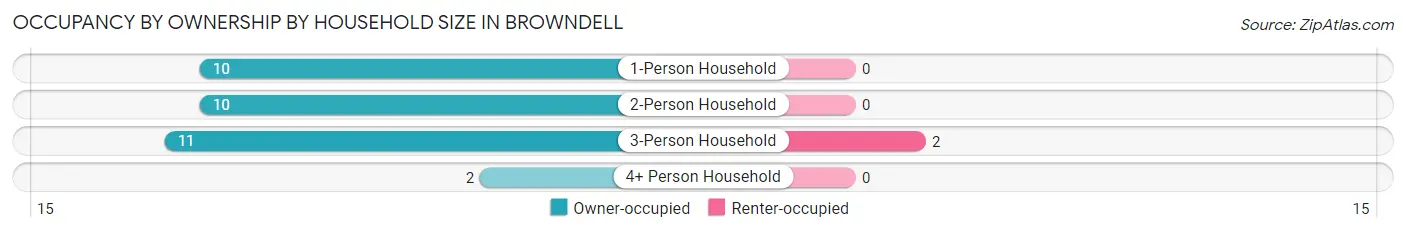
| Household Size | Owner-occupied | Renter-occupied |
| 1-Person Household | 10 (100.0%) | 0 (0.0%) |
| 2-Person Household | 10 (100.0%) | 0 (0.0%) |
| 3-Person Household | 11 (84.6%) | 2 (15.4%) |
| 4+ Person Household | 2 (100.0%) | 0 (0.0%) |
| Total Housing Units | 33 (94.3%) | 2 (5.7%) |
Occupancy by Educational Attainment in Browndell
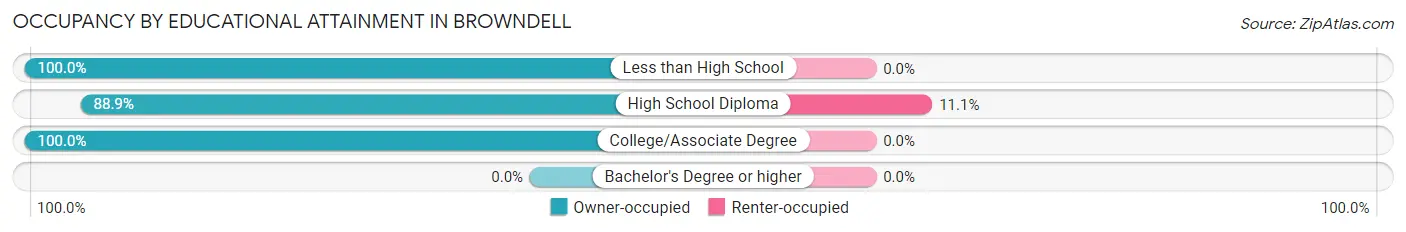
| Household Size | Owner-occupied | Renter-occupied |
| Less than High School | 12 (100.0%) | 0 (0.0%) |
| High School Diploma | 16 (88.9%) | 2 (11.1%) |
| College/Associate Degree | 5 (100.0%) | 0 (0.0%) |
| Bachelor's Degree or higher | 0 (0.0%) | 0 (0.0%) |
Occupancy by Age of Householder in Browndell
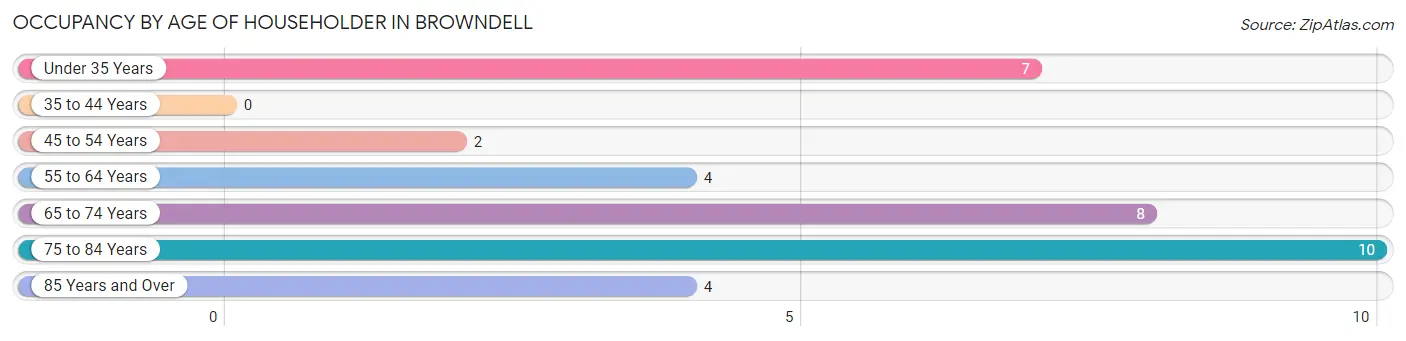
| Age Bracket | # Households | % Households |
| Under 35 Years | 7 | 20.0% |
| 35 to 44 Years | 0 | 0.0% |
| 45 to 54 Years | 2 | 5.7% |
| 55 to 64 Years | 4 | 11.4% |
| 65 to 74 Years | 8 | 22.9% |
| 75 to 84 Years | 10 | 28.6% |
| 85 Years and Over | 4 | 11.4% |
| Total | 35 | 100.0% |
Housing Finances in Browndell
Median Income by Occupancy in Browndell
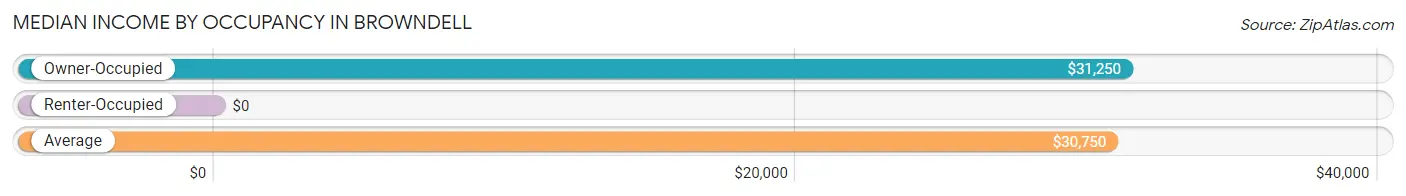
| Occupancy Type | # Households | Median Income |
| Owner-Occupied | 33 (94.3%) | $31,250 |
| Renter-Occupied | 2 (5.7%) | $0 |
| Average | 35 (100.0%) | $30,750 |
Occupancy by Householder Income Bracket in Browndell
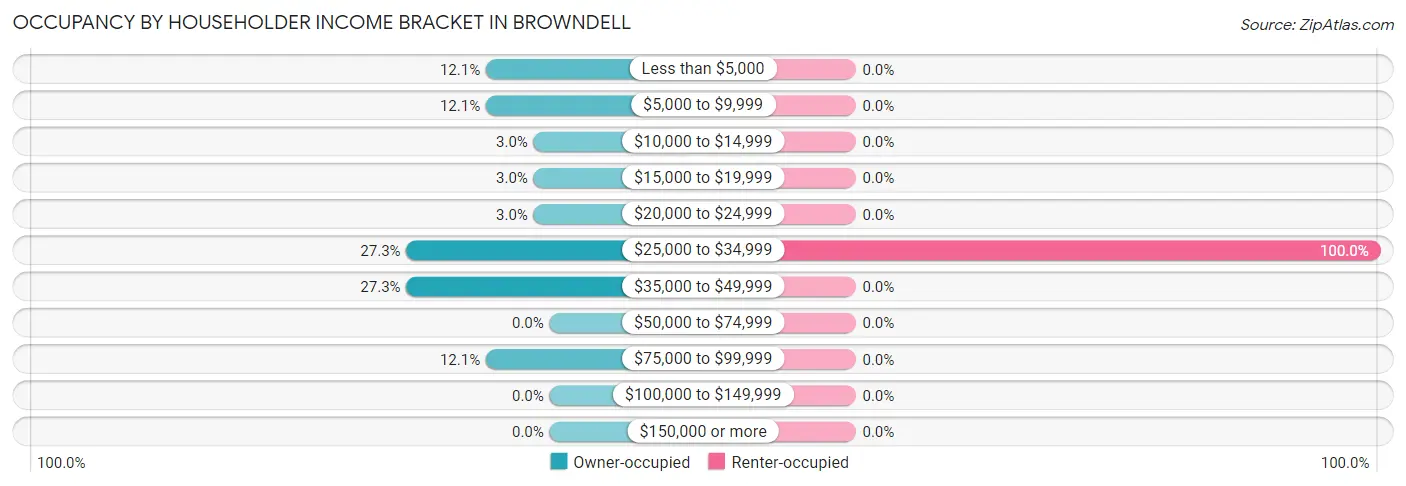
| Income Bracket | Owner-occupied | Renter-occupied |
| Less than $5,000 | 4 (12.1%) | 0 (0.0%) |
| $5,000 to $9,999 | 4 (12.1%) | 0 (0.0%) |
| $10,000 to $14,999 | 1 (3.0%) | 0 (0.0%) |
| $15,000 to $19,999 | 1 (3.0%) | 0 (0.0%) |
| $20,000 to $24,999 | 1 (3.0%) | 0 (0.0%) |
| $25,000 to $34,999 | 9 (27.3%) | 2 (100.0%) |
| $35,000 to $49,999 | 9 (27.3%) | 0 (0.0%) |
| $50,000 to $74,999 | 0 (0.0%) | 0 (0.0%) |
| $75,000 to $99,999 | 4 (12.1%) | 0 (0.0%) |
| $100,000 to $149,999 | 0 (0.0%) | 0 (0.0%) |
| $150,000 or more | 0 (0.0%) | 0 (0.0%) |
| Total | 33 (100.0%) | 2 (100.0%) |
Monthly Housing Cost Tiers in Browndell
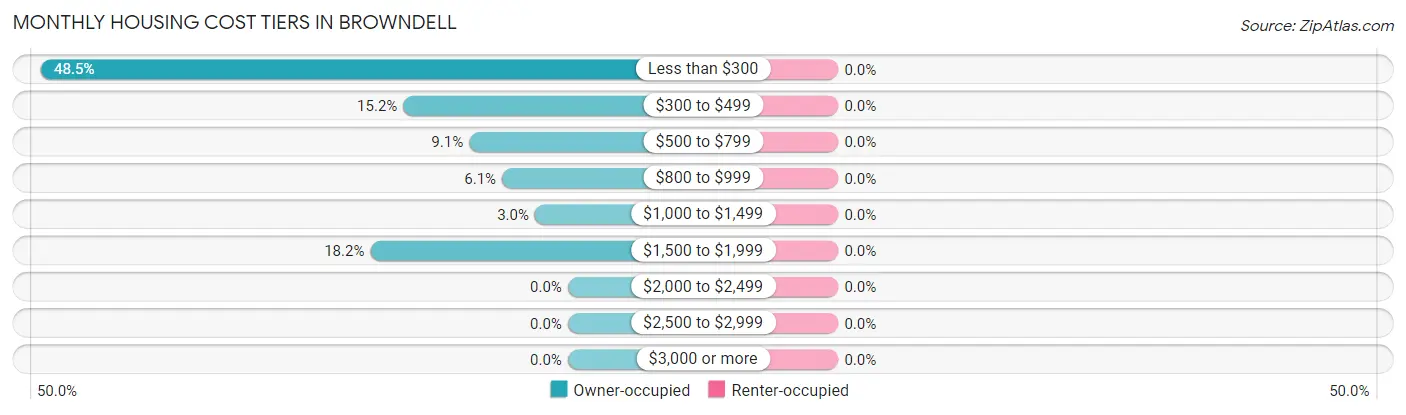
| Monthly Cost | Owner-occupied | Renter-occupied |
| Less than $300 | 16 (48.5%) | 0 (0.0%) |
| $300 to $499 | 5 (15.1%) | 0 (0.0%) |
| $500 to $799 | 3 (9.1%) | 0 (0.0%) |
| $800 to $999 | 2 (6.1%) | 0 (0.0%) |
| $1,000 to $1,499 | 1 (3.0%) | 0 (0.0%) |
| $1,500 to $1,999 | 6 (18.2%) | 0 (0.0%) |
| $2,000 to $2,499 | 0 (0.0%) | 0 (0.0%) |
| $2,500 to $2,999 | 0 (0.0%) | 0 (0.0%) |
| $3,000 or more | 0 (0.0%) | 0 (0.0%) |
| Total | 33 (100.0%) | 2 (100.0%) |
Physical Housing Characteristics in Browndell
Housing Structures in Browndell
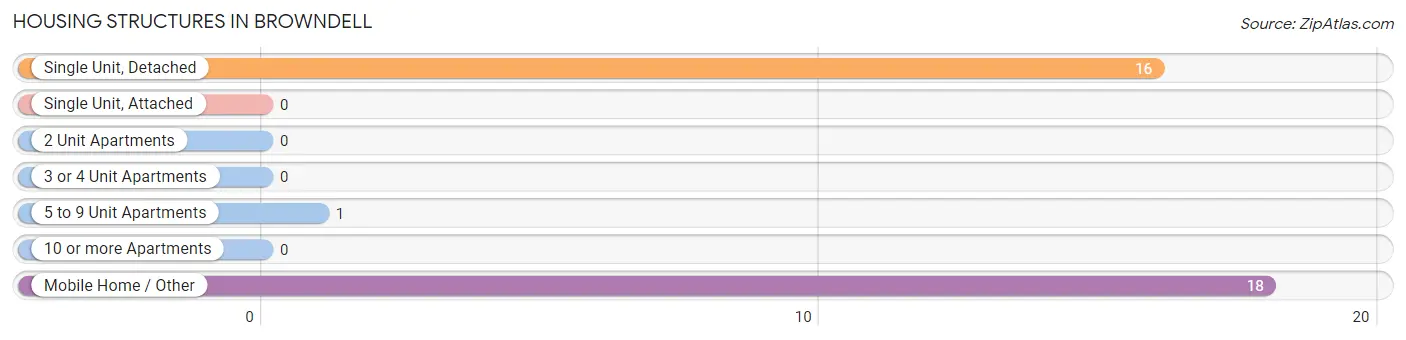
| Structure Type | # Housing Units | % Housing Units |
| Single Unit, Detached | 16 | 45.7% |
| Single Unit, Attached | 0 | 0.0% |
| 2 Unit Apartments | 0 | 0.0% |
| 3 or 4 Unit Apartments | 0 | 0.0% |
| 5 to 9 Unit Apartments | 1 | 2.9% |
| 10 or more Apartments | 0 | 0.0% |
| Mobile Home / Other | 18 | 51.4% |
| Total | 35 | 100.0% |
Housing Structures by Occupancy in Browndell
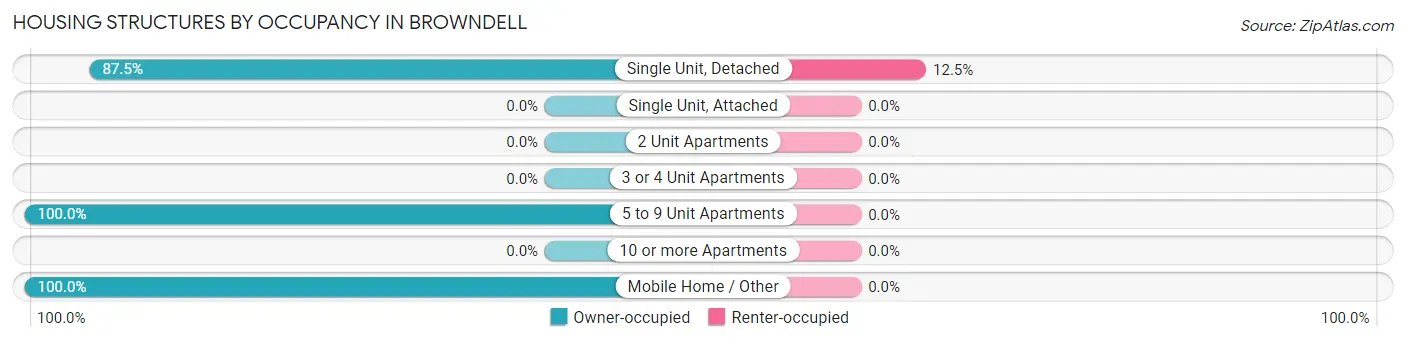
| Structure Type | Owner-occupied | Renter-occupied |
| Single Unit, Detached | 14 (87.5%) | 2 (12.5%) |
| Single Unit, Attached | 0 (0.0%) | 0 (0.0%) |
| 2 Unit Apartments | 0 (0.0%) | 0 (0.0%) |
| 3 or 4 Unit Apartments | 0 (0.0%) | 0 (0.0%) |
| 5 to 9 Unit Apartments | 1 (100.0%) | 0 (0.0%) |
| 10 or more Apartments | 0 (0.0%) | 0 (0.0%) |
| Mobile Home / Other | 18 (100.0%) | 0 (0.0%) |
| Total | 33 (94.3%) | 2 (5.7%) |
Housing Structures by Number of Rooms in Browndell
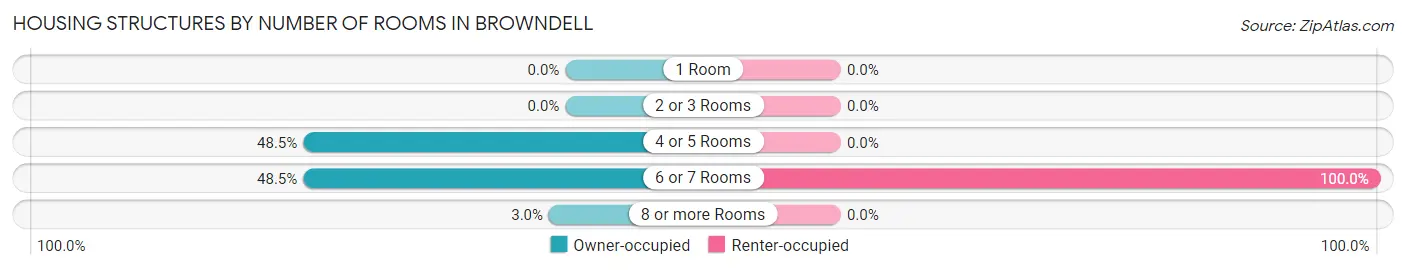
| Number of Rooms | Owner-occupied | Renter-occupied |
| 1 Room | 0 (0.0%) | 0 (0.0%) |
| 2 or 3 Rooms | 0 (0.0%) | 0 (0.0%) |
| 4 or 5 Rooms | 16 (48.5%) | 0 (0.0%) |
| 6 or 7 Rooms | 16 (48.5%) | 2 (100.0%) |
| 8 or more Rooms | 1 (3.0%) | 0 (0.0%) |
| Total | 33 (100.0%) | 2 (100.0%) |
Housing Structure by Heating Type in Browndell
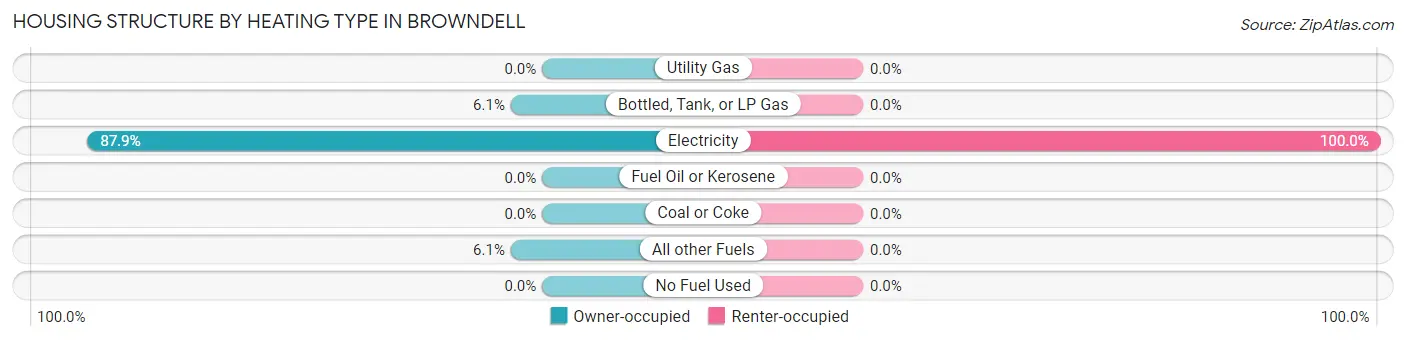
| Heating Type | Owner-occupied | Renter-occupied |
| Utility Gas | 0 (0.0%) | 0 (0.0%) |
| Bottled, Tank, or LP Gas | 2 (6.1%) | 0 (0.0%) |
| Electricity | 29 (87.9%) | 2 (100.0%) |
| Fuel Oil or Kerosene | 0 (0.0%) | 0 (0.0%) |
| Coal or Coke | 0 (0.0%) | 0 (0.0%) |
| All other Fuels | 2 (6.1%) | 0 (0.0%) |
| No Fuel Used | 0 (0.0%) | 0 (0.0%) |
| Total | 33 (100.0%) | 2 (100.0%) |
Household Vehicle Usage in Browndell
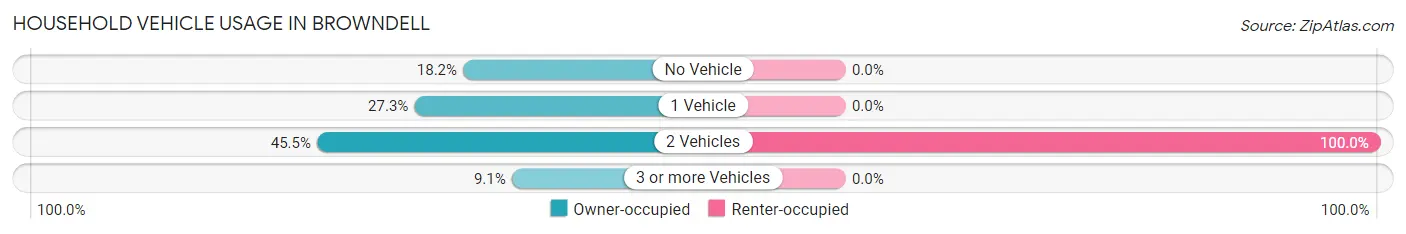
| Vehicles per Household | Owner-occupied | Renter-occupied |
| No Vehicle | 6 (18.2%) | 0 (0.0%) |
| 1 Vehicle | 9 (27.3%) | 0 (0.0%) |
| 2 Vehicles | 15 (45.5%) | 2 (100.0%) |
| 3 or more Vehicles | 3 (9.1%) | 0 (0.0%) |
| Total | 33 (100.0%) | 2 (100.0%) |
Real Estate & Mortgages in Browndell
Real Estate and Mortgage Overview in Browndell
| Characteristic | Without Mortgage | With Mortgage |
| Housing Units | 23 | 10 |
| Median Property Value | - | - |
| Median Household Income | $28,125 | $0 |
| Monthly Housing Costs | $198 | $0 |
| Real Estate Taxes | $199 | $0 |
Property Value by Mortgage Status in Browndell
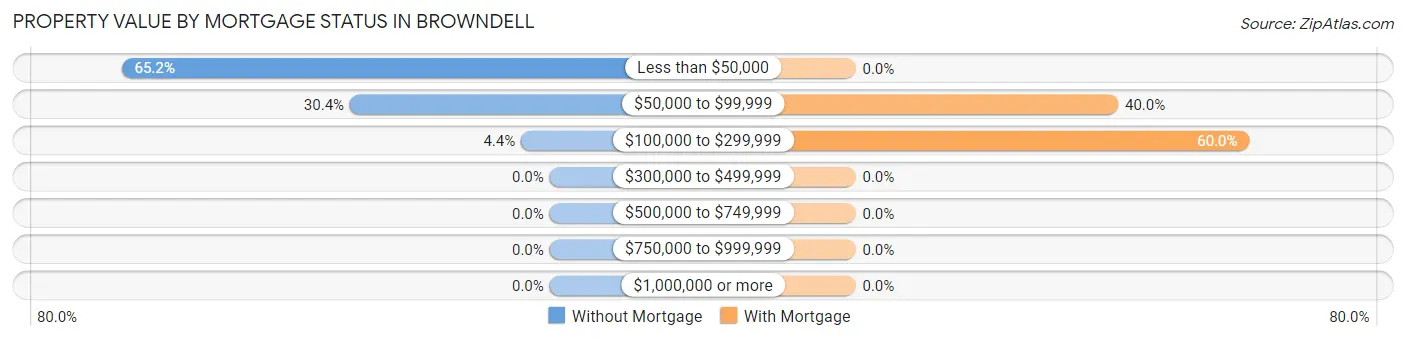
| Property Value | Without Mortgage | With Mortgage |
| Less than $50,000 | 15 (65.2%) | 0 (0.0%) |
| $50,000 to $99,999 | 7 (30.4%) | 4 (40.0%) |
| $100,000 to $299,999 | 1 (4.3%) | 6 (60.0%) |
| $300,000 to $499,999 | 0 (0.0%) | 0 (0.0%) |
| $500,000 to $749,999 | 0 (0.0%) | 0 (0.0%) |
| $750,000 to $999,999 | 0 (0.0%) | 0 (0.0%) |
| $1,000,000 or more | 0 (0.0%) | 0 (0.0%) |
| Total | 23 (100.0%) | 10 (100.0%) |
Household Income by Mortgage Status in Browndell
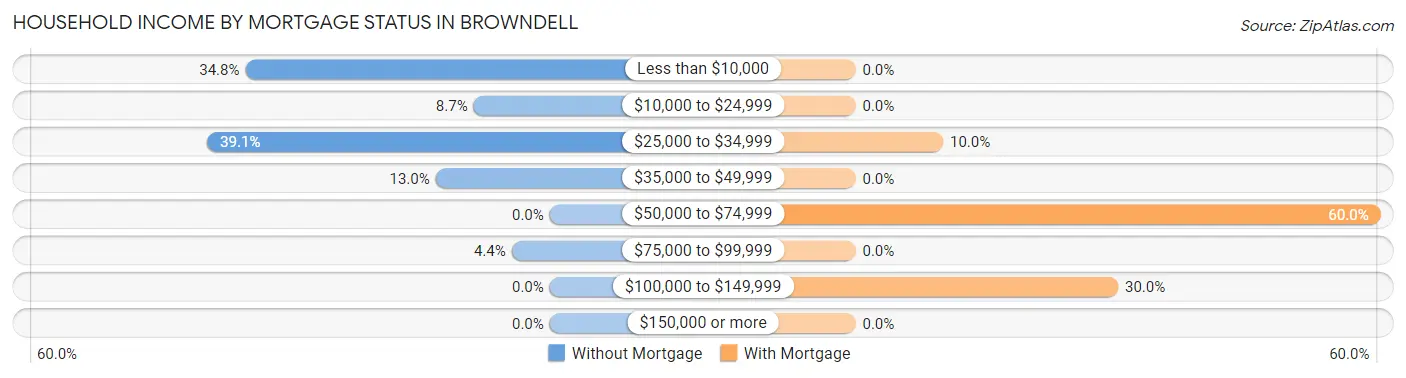
| Household Income | Without Mortgage | With Mortgage |
| Less than $10,000 | 8 (34.8%) | 0 (0.0%) |
| $10,000 to $24,999 | 2 (8.7%) | 0 (0.0%) |
| $25,000 to $34,999 | 9 (39.1%) | 1 (10.0%) |
| $35,000 to $49,999 | 3 (13.0%) | 0 (0.0%) |
| $50,000 to $74,999 | 0 (0.0%) | 6 (60.0%) |
| $75,000 to $99,999 | 1 (4.3%) | 0 (0.0%) |
| $100,000 to $149,999 | 0 (0.0%) | 3 (30.0%) |
| $150,000 or more | 0 (0.0%) | 0 (0.0%) |
| Total | 23 (100.0%) | 10 (100.0%) |
Property Value to Household Income Ratio in Browndell
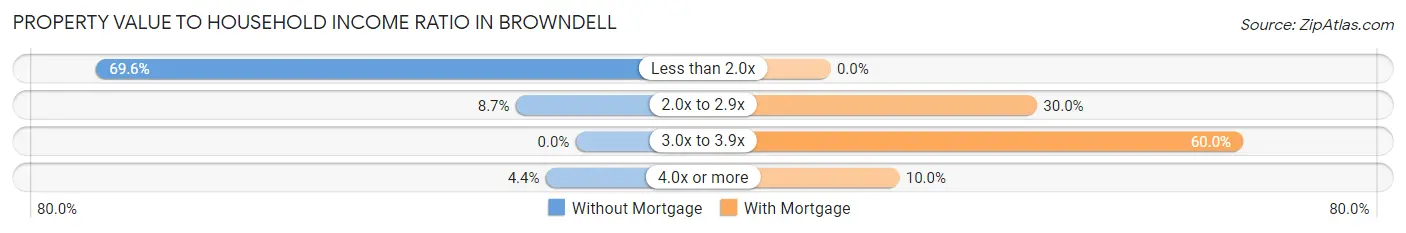
| Value-to-Income Ratio | Without Mortgage | With Mortgage |
| Less than 2.0x | 16 (69.6%) | 0 (0.0%) |
| 2.0x to 2.9x | 2 (8.7%) | 3 (30.0%) |
| 3.0x to 3.9x | 0 (0.0%) | 6 (60.0%) |
| 4.0x or more | 1 (4.3%) | 1 (10.0%) |
| Total | 23 (100.0%) | 10 (100.0%) |
Real Estate Taxes by Mortgage Status in Browndell
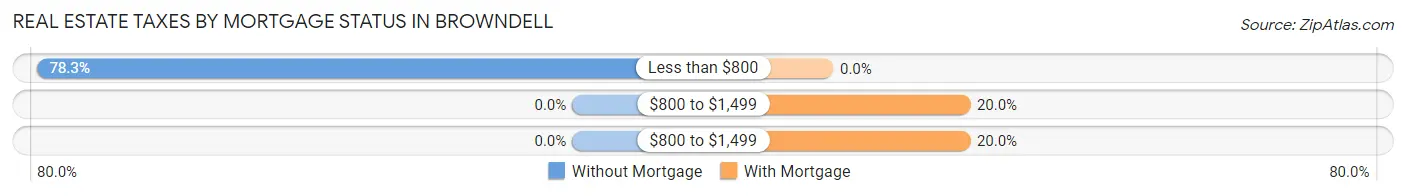
| Property Taxes | Without Mortgage | With Mortgage |
| Less than $800 | 18 (78.3%) | 0 (0.0%) |
| $800 to $1,499 | 0 (0.0%) | 2 (20.0%) |
| $800 to $1,499 | 0 (0.0%) | 2 (20.0%) |
| Total | 23 (100.0%) | 10 (100.0%) |
Health & Disability in Browndell
Health Insurance Coverage by Age in Browndell
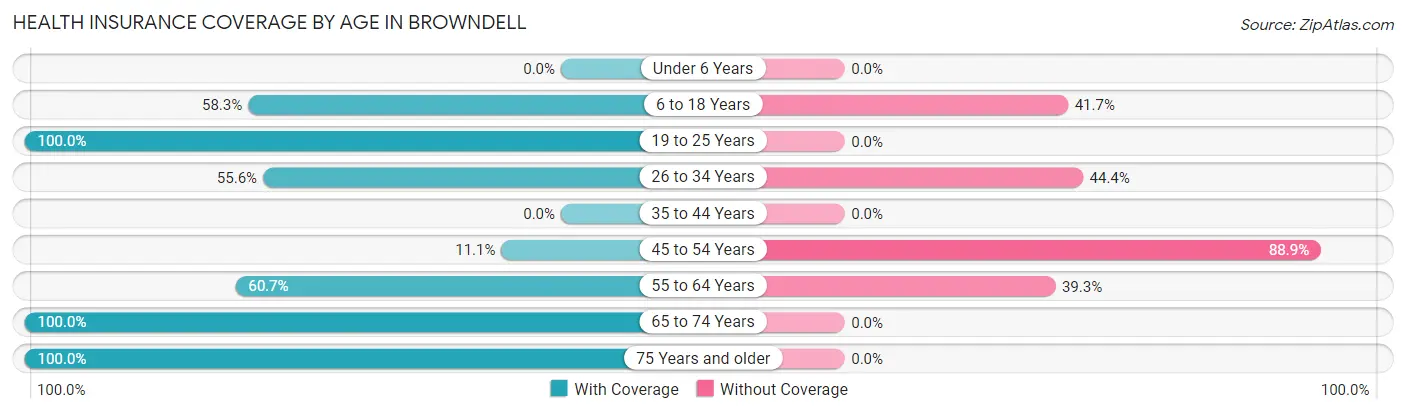
| Age Bracket | With Coverage | Without Coverage |
| Under 6 Years | 0 (0.0%) | 0 (0.0%) |
| 6 to 18 Years | 7 (58.3%) | 5 (41.7%) |
| 19 to 25 Years | 2 (100.0%) | 0 (0.0%) |
| 26 to 34 Years | 5 (55.6%) | 4 (44.4%) |
| 35 to 44 Years | 0 (0.0%) | 0 (0.0%) |
| 45 to 54 Years | 1 (11.1%) | 8 (88.9%) |
| 55 to 64 Years | 17 (60.7%) | 11 (39.3%) |
| 65 to 74 Years | 9 (100.0%) | 0 (0.0%) |
| 75 Years and older | 19 (100.0%) | 0 (0.0%) |
| Total | 60 (68.2%) | 28 (31.8%) |
Health Insurance Coverage by Citizenship Status in Browndell
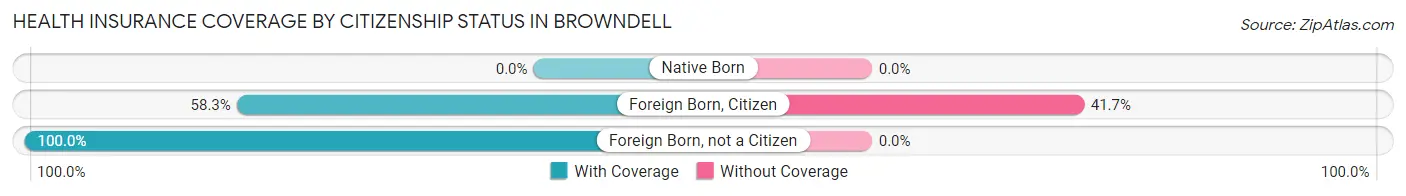
| Citizenship Status | With Coverage | Without Coverage |
| Native Born | 0 (0.0%) | 0 (0.0%) |
| Foreign Born, Citizen | 7 (58.3%) | 5 (41.7%) |
| Foreign Born, not a Citizen | 2 (100.0%) | 0 (0.0%) |
Health Insurance Coverage by Household Income in Browndell
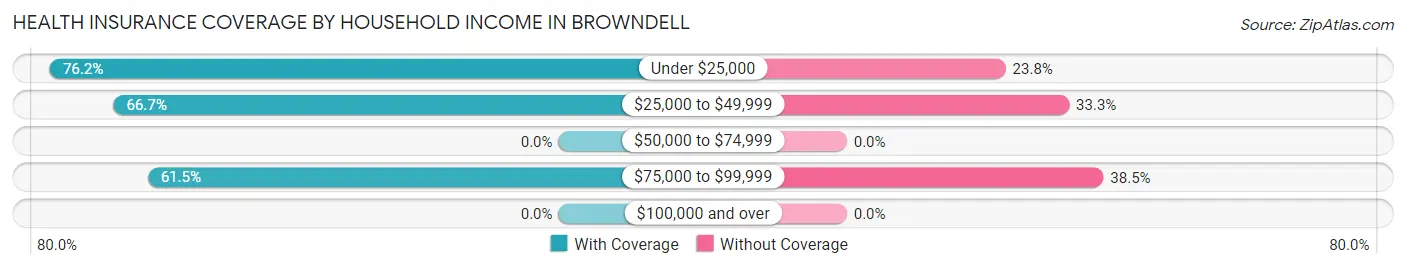
| Household Income | With Coverage | Without Coverage |
| Under $25,000 | 16 (76.2%) | 5 (23.8%) |
| $25,000 to $49,999 | 36 (66.7%) | 18 (33.3%) |
| $50,000 to $74,999 | 0 (0.0%) | 0 (0.0%) |
| $75,000 to $99,999 | 8 (61.5%) | 5 (38.5%) |
| $100,000 and over | 0 (0.0%) | 0 (0.0%) |
Public vs Private Health Insurance Coverage by Age in Browndell
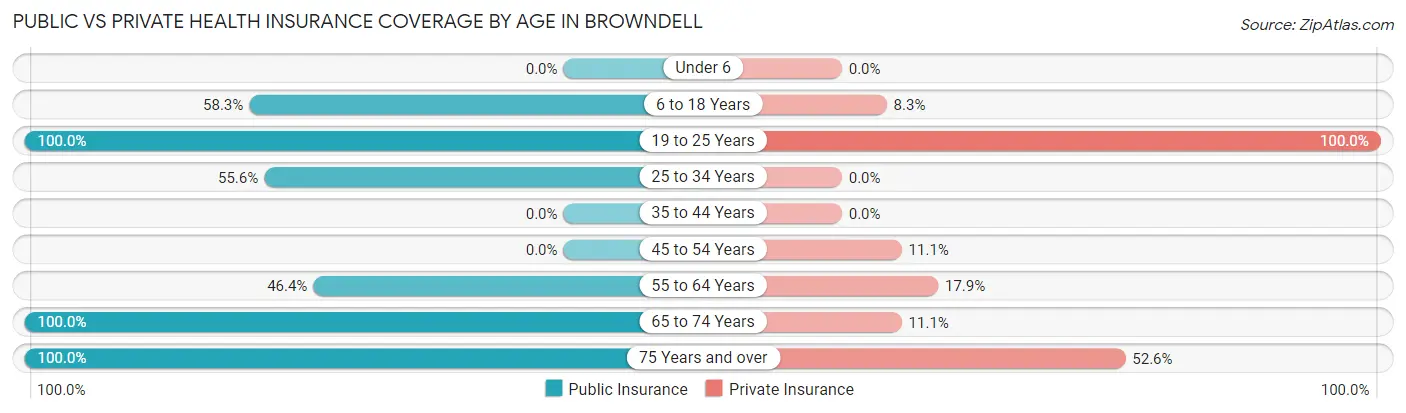
| Age Bracket | Public Insurance | Private Insurance |
| Under 6 | 0 (0.0%) | 0 (0.0%) |
| 6 to 18 Years | 7 (58.3%) | 1 (8.3%) |
| 19 to 25 Years | 2 (100.0%) | 2 (100.0%) |
| 25 to 34 Years | 5 (55.6%) | 0 (0.0%) |
| 35 to 44 Years | 0 (0.0%) | 0 (0.0%) |
| 45 to 54 Years | 0 (0.0%) | 1 (11.1%) |
| 55 to 64 Years | 13 (46.4%) | 5 (17.9%) |
| 65 to 74 Years | 9 (100.0%) | 1 (11.1%) |
| 75 Years and over | 19 (100.0%) | 10 (52.6%) |
| Total | 55 (62.5%) | 20 (22.7%) |
Disability Status by Sex by Age in Browndell
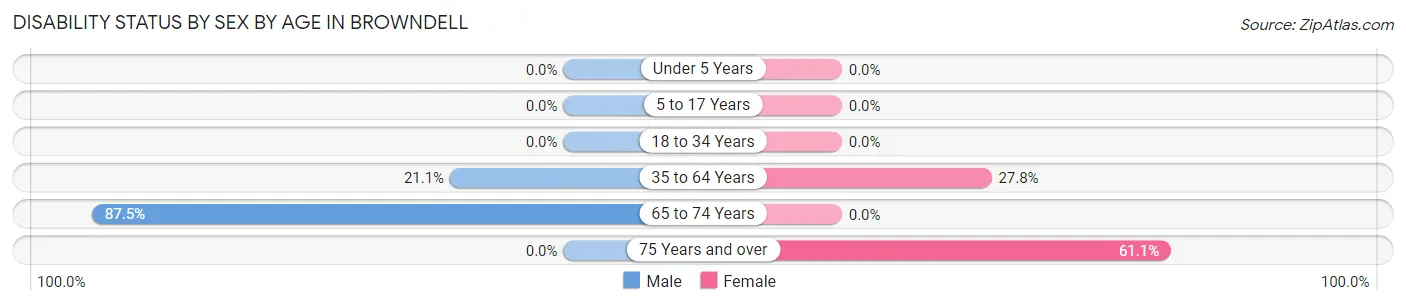
| Age Bracket | Male | Female |
| Under 5 Years | 0 (0.0%) | 0 (0.0%) |
| 5 to 17 Years | 0 (0.0%) | 0 (0.0%) |
| 18 to 34 Years | 0 (0.0%) | 0 (0.0%) |
| 35 to 64 Years | 4 (21.0%) | 5 (27.8%) |
| 65 to 74 Years | 7 (87.5%) | 0 (0.0%) |
| 75 Years and over | 0 (0.0%) | 11 (61.1%) |
Disability Class by Sex by Age in Browndell
Disability Class: Hearing Difficulty
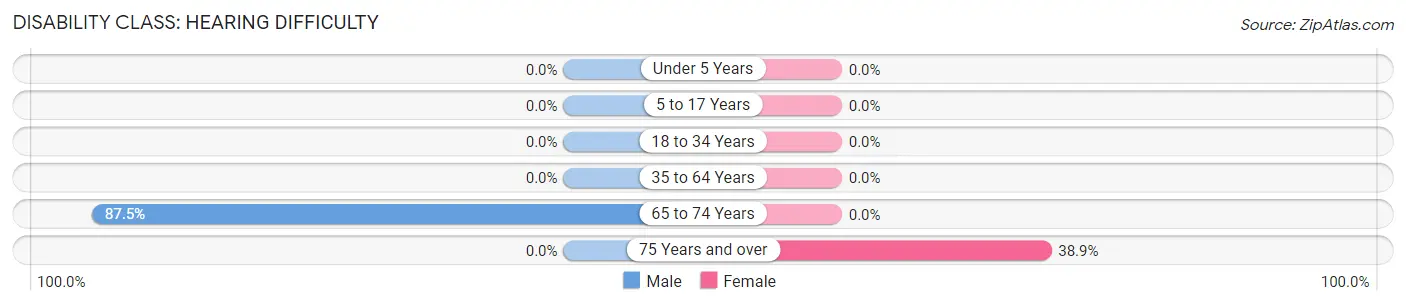
| Age Bracket | Male | Female |
| Under 5 Years | 0 (0.0%) | 0 (0.0%) |
| 5 to 17 Years | 0 (0.0%) | 0 (0.0%) |
| 18 to 34 Years | 0 (0.0%) | 0 (0.0%) |
| 35 to 64 Years | 0 (0.0%) | 0 (0.0%) |
| 65 to 74 Years | 7 (87.5%) | 0 (0.0%) |
| 75 Years and over | 0 (0.0%) | 7 (38.9%) |
Disability Class: Vision Difficulty
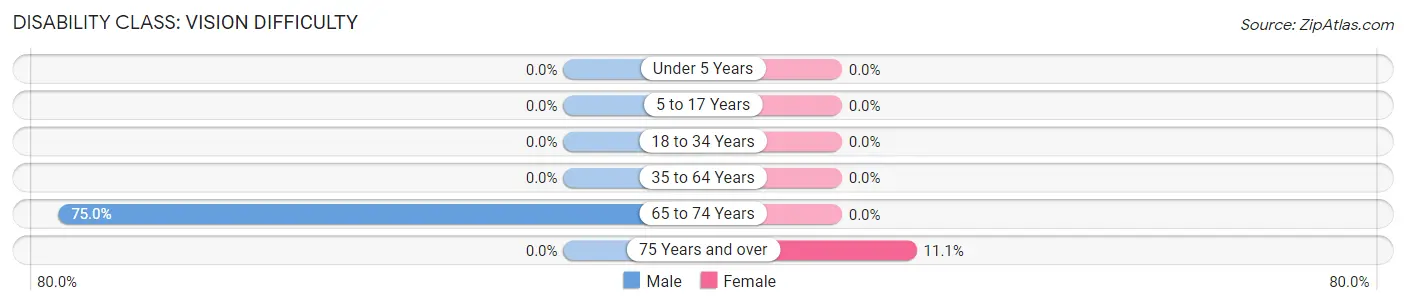
| Age Bracket | Male | Female |
| Under 5 Years | 0 (0.0%) | 0 (0.0%) |
| 5 to 17 Years | 0 (0.0%) | 0 (0.0%) |
| 18 to 34 Years | 0 (0.0%) | 0 (0.0%) |
| 35 to 64 Years | 0 (0.0%) | 0 (0.0%) |
| 65 to 74 Years | 6 (75.0%) | 0 (0.0%) |
| 75 Years and over | 0 (0.0%) | 2 (11.1%) |
Disability Class: Cognitive Difficulty
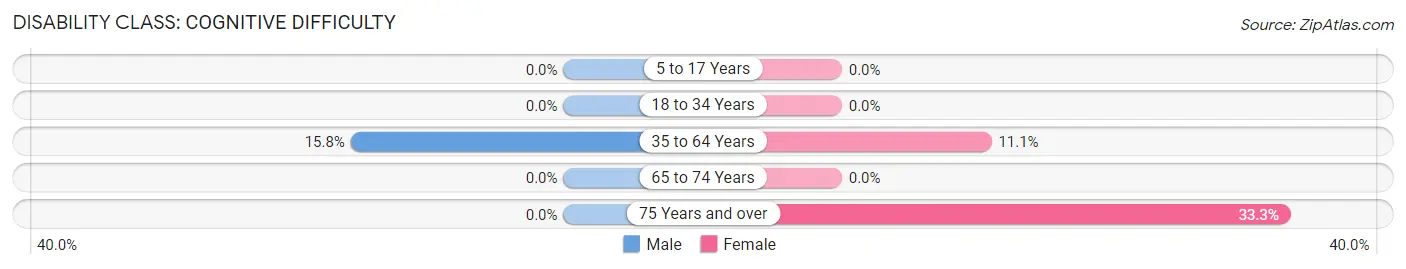
| Age Bracket | Male | Female |
| 5 to 17 Years | 0 (0.0%) | 0 (0.0%) |
| 18 to 34 Years | 0 (0.0%) | 0 (0.0%) |
| 35 to 64 Years | 3 (15.8%) | 2 (11.1%) |
| 65 to 74 Years | 0 (0.0%) | 0 (0.0%) |
| 75 Years and over | 0 (0.0%) | 6 (33.3%) |
Disability Class: Ambulatory Difficulty
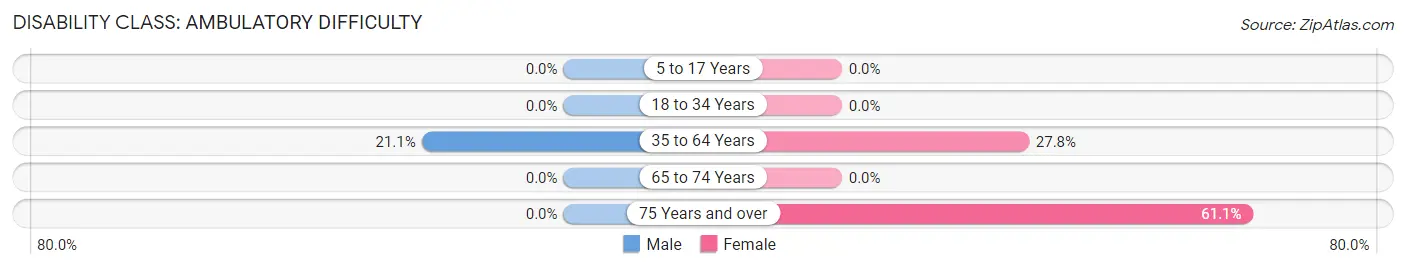
| Age Bracket | Male | Female |
| 5 to 17 Years | 0 (0.0%) | 0 (0.0%) |
| 18 to 34 Years | 0 (0.0%) | 0 (0.0%) |
| 35 to 64 Years | 4 (21.0%) | 5 (27.8%) |
| 65 to 74 Years | 0 (0.0%) | 0 (0.0%) |
| 75 Years and over | 0 (0.0%) | 11 (61.1%) |
Disability Class: Self-Care Difficulty
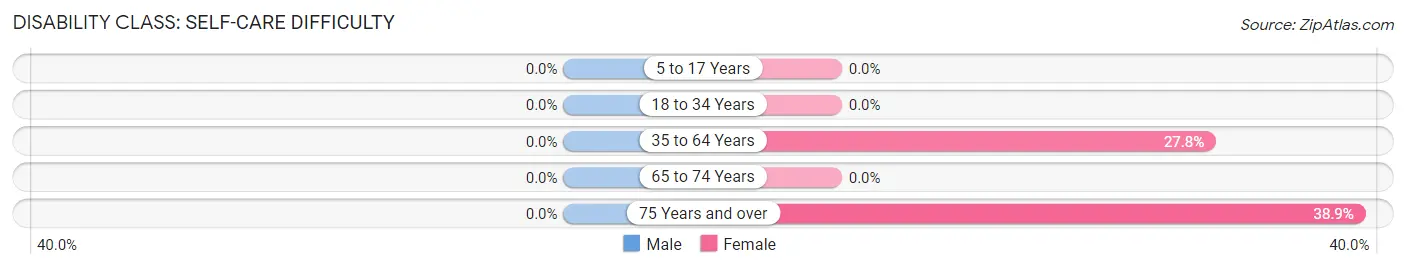
| Age Bracket | Male | Female |
| 5 to 17 Years | 0 (0.0%) | 0 (0.0%) |
| 18 to 34 Years | 0 (0.0%) | 0 (0.0%) |
| 35 to 64 Years | 0 (0.0%) | 5 (27.8%) |
| 65 to 74 Years | 0 (0.0%) | 0 (0.0%) |
| 75 Years and over | 0 (0.0%) | 7 (38.9%) |
Technology Access in Browndell
Computing Device Access in Browndell
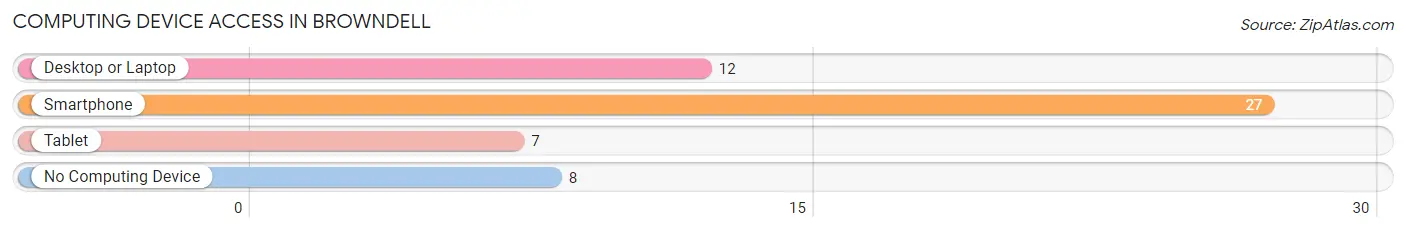
| Device Type | # Households | % Households |
| Desktop or Laptop | 12 | 34.3% |
| Smartphone | 27 | 77.1% |
| Tablet | 7 | 20.0% |
| No Computing Device | 8 | 22.9% |
| Total | 35 | 100.0% |
Internet Access in Browndell
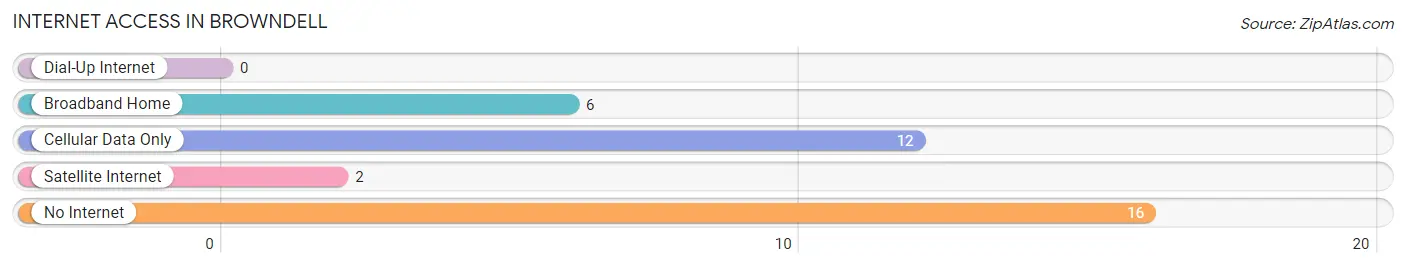
| Internet Type | # Households | % Households |
| Dial-Up Internet | 0 | 0.0% |
| Broadband Home | 6 | 17.1% |
| Cellular Data Only | 12 | 34.3% |
| Satellite Internet | 2 | 5.7% |
| No Internet | 16 | 45.7% |
| Total | 35 | 100.0% |
Browndell Summary
Brownsville, Texas is a city located in Cameron County, Texas, United States. It is the county seat of Cameron County and the sixteenth-largest city in the state of Texas. The city is located on the southernmost tip of Texas, on the northern bank of the Rio Grande, directly north and across the border from Matamoros, Tamaulipas, Mexico. As of the 2010 census, the city had a population of 183,046, making it the tenth-most populous city in the state of Texas.
History
The area now known as Brownsville was founded in 1765 by Don José de Escandón y Helguera, a Spanish nobleman from Galicia, Spain. The city was named after Major Jacob Brown, who fought and died while leading troops during the Battle of Palo Alto on May 8, 1846. The city was officially incorporated in 1848.
In 1853, Brownsville became the county seat of Cameron County. During the American Civil War, Brownsville was occupied by Union forces from 1862 to 1865. In 1864, the Union Army established Fort Brown, which served as a base of operations for the Union Army during the war.
Geography
Brownsville is located at the southernmost tip of Texas, on the northern bank of the Rio Grande, directly north and across the border from Matamoros, Tamaulipas, Mexico. The city has an area of 77.5 square miles (200.6 km2), of which 77.2 square miles (200.0 km2) is land and 0.3 square miles (0.7 km2) (0.39%) is water.
Economy
Brownsville is a major port of entry and a trade center for South Texas. The city's economy is largely based on international trade, manufacturing, and tourism. The Port of Brownsville is the largest port in the state of Texas and the fourth-largest port in the United States. The city is also home to a number of manufacturing plants, including a steel mill, an aluminum plant, and a paper mill.
The city is also a major tourist destination, with attractions such as the Gladys Porter Zoo, the Historic Brownsville Museum, and the Sabal Palm Audubon Center.
Demographics
As of the 2010 census, the city had a population of 183,046, making it the tenth-most populous city in the state of Texas. The racial makeup of the city was 77.2% White, 0.7% African American, 0.5% Native American, 0.7% Asian, 0.1% Pacific Islander, 19.2% from other races, and 2.1% from two or more races. Hispanic or Latino of any race were 92.9% of the population.
The median income for a household in the city was $30,735, and the median income for a family was $36,095. The per capita income for the city was $15,890. About 24.2% of families and 28.5% of the population were below the poverty line, including 39.3% of those under age 18 and 24.0% of those age 65 or over.
Common Questions
What is Per Capita Income in Browndell?
Per Capita income in Browndell is $14,314.
What is the Median Family Income in Browndell?
Median Family Income in Browndell is $32,250.
What is the Median Household income in Browndell?
Median Household Income in Browndell is $30,750.
What is Inequality or Gini Index in Browndell?
Inequality or Gini Index in Browndell is 0.38.
What is the Total Population of Browndell?
Total Population of Browndell is 88.
What is the Total Male Population of Browndell?
Total Male Population of Browndell is 44.
What is the Total Female Population of Browndell?
Total Female Population of Browndell is 44.
What is the Ratio of Males per 100 Females in Browndell?
There are 100.00 Males per 100 Females in Browndell.
What is the Ratio of Females per 100 Males in Browndell?
There are 100.00 Females per 100 Males in Browndell.
What is the Median Population Age in Browndell?
Median Population Age in Browndell is 59.9 Years.
What is the Average Family Size in Browndell
Average Family Size in Browndell is 3.0 People.
What is the Average Household Size in Browndell
Average Household Size in Browndell is 2.5 People.
How Large is the Labor Force in Browndell?
There are 29 People in the Labor Forcein in Browndell.
What is the Percentage of People in the Labor Force in Browndell?
34.5% of People are in the Labor Force in Browndell.
What is the Unemployment Rate in Browndell?
Unemployment Rate in Browndell is 6.9%.