Adamsville, TN Map & Demographics
Adamsville Map
Adamsville Overview
$24,411
PER CAPITA INCOME
$58,242
AVG FAMILY INCOME
$48,571
AVG HOUSEHOLD INCOME
25.9%
WAGE / INCOME GAP [ % ]
74.1¢/ $1
WAGE / INCOME GAP [ $ ]
0.50
INEQUALITY / GINI INDEX
2,334
TOTAL POPULATION
1,193
MALE POPULATION
1,141
FEMALE POPULATION
104.56
MALES / 100 FEMALES
95.64
FEMALES / 100 MALES
34.7
MEDIAN AGE
3.4
AVG FAMILY SIZE
2.8
AVG HOUSEHOLD SIZE
871
LABOR FORCE [ PEOPLE ]
50.6%
PERCENT IN LABOR FORCE
6.1%
UNEMPLOYMENT RATE
Adamsville Zip Codes
Adamsville Area Codes
Income in Adamsville
Income Overview in Adamsville
Per Capita Income in Adamsville is $24,411, while median incomes of families and households are $58,242 and $48,571 respectively.
| Characteristic | Number | Measure |
| Per Capita Income | 2,334 | $24,411 |
| Median Family Income | 531 | $58,242 |
| Mean Family Income | 531 | $79,809 |
| Median Household Income | 788 | $48,571 |
| Mean Household Income | 788 | $66,331 |
| Income Deficit | 531 | $0 |
| Wage / Income Gap (%) | 2,334 | 25.92% |
| Wage / Income Gap ($) | 2,334 | 74.08¢ per $1 |
| Gini / Inequality Index | 2,334 | 0.50 |
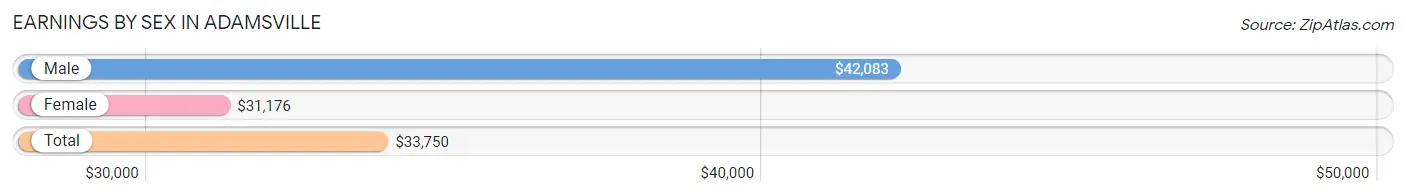
Earnings by Sex in Adamsville
Average Earnings in Adamsville are $33,750, $42,083 for men and $31,176 for women, a difference of 25.9%.
| Sex | Number | Average Earnings |
| Male | 524 (55.2%) | $42,083 |
| Female | 426 (44.8%) | $31,176 |
| Total | 950 (100.0%) | $33,750 |
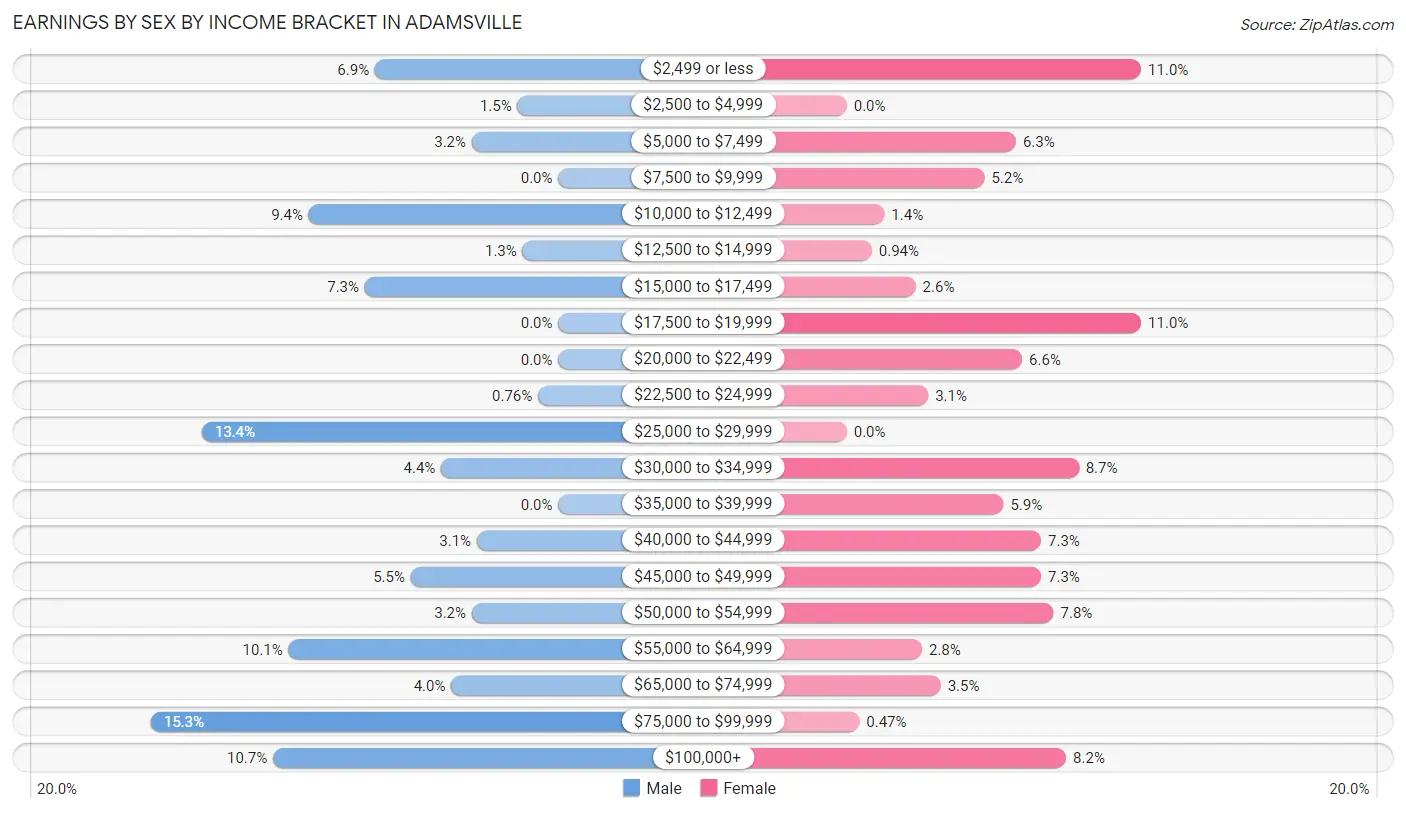
Earnings by Sex by Income Bracket in Adamsville
The most common earnings brackets in Adamsville are $75,000 to $99,999 for men (80 | 15.3%) and $2,499 or less for women (47 | 11.0%).
| Income | Male | Female |
| $2,499 or less | 36 (6.9%) | 47 (11.0%) |
| $2,500 to $4,999 | 8 (1.5%) | 0 (0.0%) |
| $5,000 to $7,499 | 17 (3.2%) | 27 (6.3%) |
| $7,500 to $9,999 | 0 (0.0%) | 22 (5.2%) |
| $10,000 to $12,499 | 49 (9.3%) | 6 (1.4%) |
| $12,500 to $14,999 | 7 (1.3%) | 4 (0.9%) |
| $15,000 to $17,499 | 38 (7.2%) | 11 (2.6%) |
| $17,500 to $19,999 | 0 (0.0%) | 47 (11.0%) |
| $20,000 to $22,499 | 0 (0.0%) | 28 (6.6%) |
| $22,500 to $24,999 | 4 (0.8%) | 13 (3.0%) |
| $25,000 to $29,999 | 70 (13.4%) | 0 (0.0%) |
| $30,000 to $34,999 | 23 (4.4%) | 37 (8.7%) |
| $35,000 to $39,999 | 0 (0.0%) | 25 (5.9%) |
| $40,000 to $44,999 | 16 (3.0%) | 31 (7.3%) |
| $45,000 to $49,999 | 29 (5.5%) | 31 (7.3%) |
| $50,000 to $54,999 | 17 (3.2%) | 33 (7.7%) |
| $55,000 to $64,999 | 53 (10.1%) | 12 (2.8%) |
| $65,000 to $74,999 | 21 (4.0%) | 15 (3.5%) |
| $75,000 to $99,999 | 80 (15.3%) | 2 (0.5%) |
| $100,000+ | 56 (10.7%) | 35 (8.2%) |
| Total | 524 (100.0%) | 426 (100.0%) |
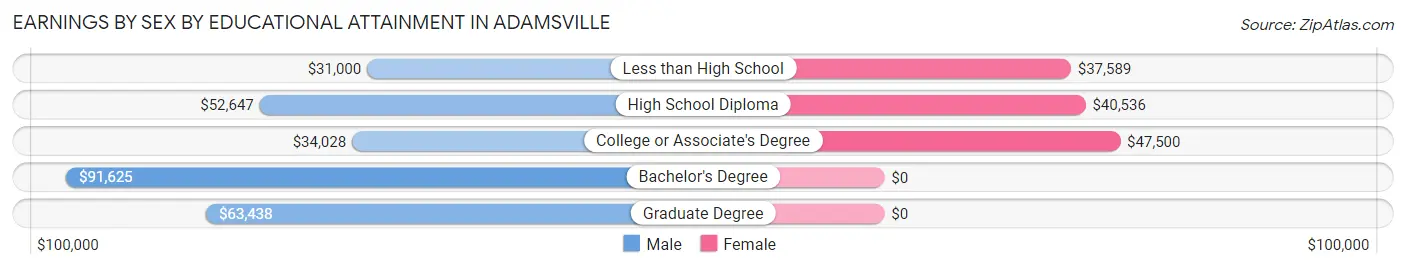
Earnings by Sex by Educational Attainment in Adamsville
Average earnings in Adamsville are $47,350 for men and $41,008 for women, a difference of 13.4%. Men with an educational attainment of bachelor's degree enjoy the highest average annual earnings of $91,625, while those with less than high school education earn the least with $31,000. Women with an educational attainment of college or associate's degree earn the most with the average annual earnings of $47,500, while those with less than high school education have the smallest earnings of $37,589.
| Educational Attainment | Male Income | Female Income |
| Less than High School | $31,000 | $37,589 |
| High School Diploma | $52,647 | $40,536 |
| College or Associate's Degree | $34,028 | $47,500 |
| Bachelor's Degree | $91,625 | $0 |
| Graduate Degree | $63,438 | $0 |
| Total | $47,350 | $41,008 |
Family Income in Adamsville
Family Income Brackets in Adamsville
According to the Adamsville family income data, there are 163 families falling into the $50,000 to $74,999 income range, which is the most common income bracket and makes up 30.7% of all families. Conversely, the $150,000 to $199,999 income bracket is the least frequent group with only 9 families (1.7%) belonging to this category.
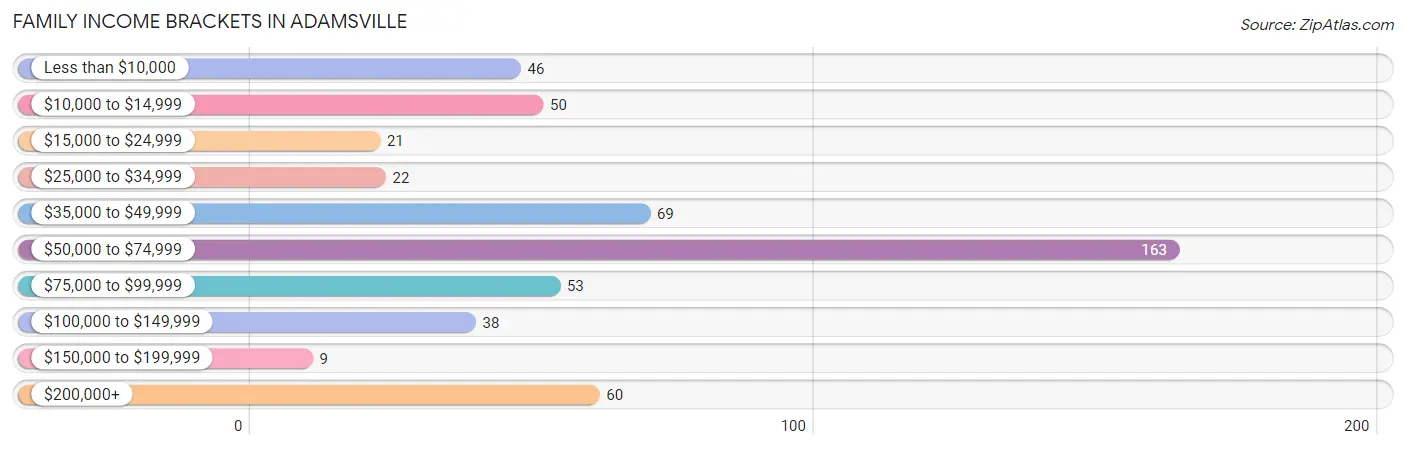
| Income Bracket | # Families | % Families |
| Less than $10,000 | 46 | 8.7% |
| $10,000 to $14,999 | 50 | 9.4% |
| $15,000 to $24,999 | 21 | 4.0% |
| $25,000 to $34,999 | 22 | 4.1% |
| $35,000 to $49,999 | 69 | 13.0% |
| $50,000 to $74,999 | 163 | 30.7% |
| $75,000 to $99,999 | 53 | 10.0% |
| $100,000 to $149,999 | 38 | 7.2% |
| $150,000 to $199,999 | 9 | 1.7% |
| $200,000+ | 60 | 11.3% |
Family Income by Famaliy Size in Adamsville
4-person families (96 | 18.1%) account for the highest median family income in Adamsville with $64,625 per family, while 2-person families (266 | 50.1%) have the highest median income of $26,324 per family member.
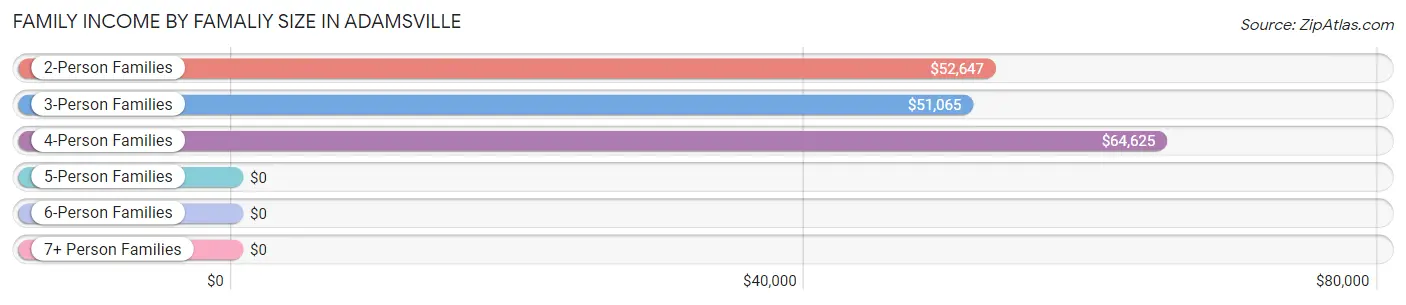
| Income Bracket | # Families | Median Income |
| 2-Person Families | 266 (50.1%) | $52,647 |
| 3-Person Families | 91 (17.1%) | $51,065 |
| 4-Person Families | 96 (18.1%) | $64,625 |
| 5-Person Families | 46 (8.7%) | $0 |
| 6-Person Families | 32 (6.0%) | $0 |
| 7+ Person Families | 0 (0.0%) | $0 |
| Total | 531 (100.0%) | $58,242 |
Family Income by Number of Earners in Adamsville
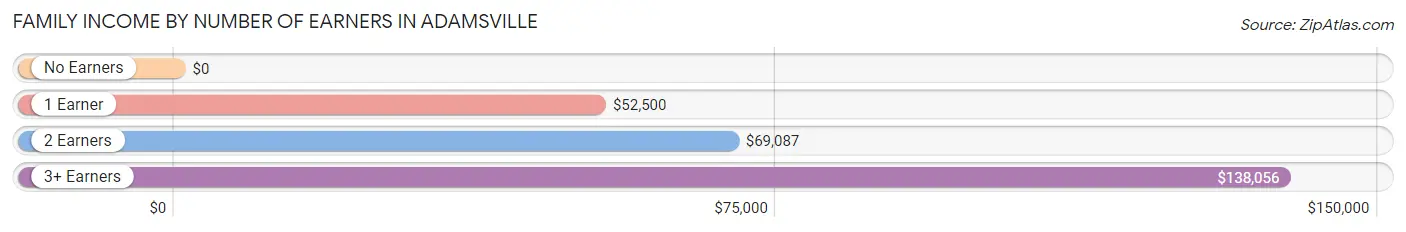
| Number of Earners | # Families | Median Income |
| No Earners | 120 (22.6%) | $0 |
| 1 Earner | 182 (34.3%) | $52,500 |
| 2 Earners | 163 (30.7%) | $69,087 |
| 3+ Earners | 66 (12.4%) | $138,056 |
| Total | 531 (100.0%) | $58,242 |
Household Income in Adamsville
Household Income Brackets in Adamsville
With 203 households falling in the category, the $50,000 to $74,999 income range is the most frequent in Adamsville, accounting for 25.8% of all households. In contrast, only 9 households (1.1%) fall into the $150,000 to $199,999 income bracket, making it the least populous group.
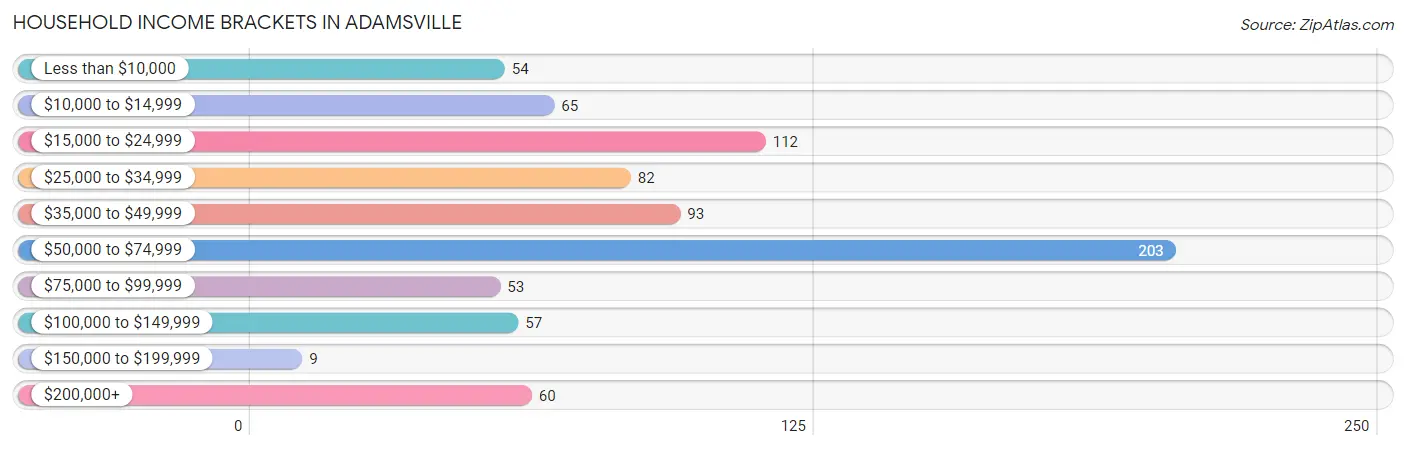
| Income Bracket | # Households | % Households |
| Less than $10,000 | 54 | 6.9% |
| $10,000 to $14,999 | 65 | 8.2% |
| $15,000 to $24,999 | 112 | 14.2% |
| $25,000 to $34,999 | 82 | 10.4% |
| $35,000 to $49,999 | 93 | 11.8% |
| $50,000 to $74,999 | 203 | 25.8% |
| $75,000 to $99,999 | 53 | 6.7% |
| $100,000 to $149,999 | 57 | 7.2% |
| $150,000 to $199,999 | 9 | 1.1% |
| $200,000+ | 60 | 7.6% |
Household Income by Householder Age in Adamsville
The median household income in Adamsville is $48,571, with the highest median household income of $62,760 found in the 45 to 64 years age bracket for the primary householder. A total of 241 households (30.6%) fall into this category. Meanwhile, the 15 to 24 years age bracket for the primary householder has the lowest median household income of $0, with 44 households (5.6%) in this group.
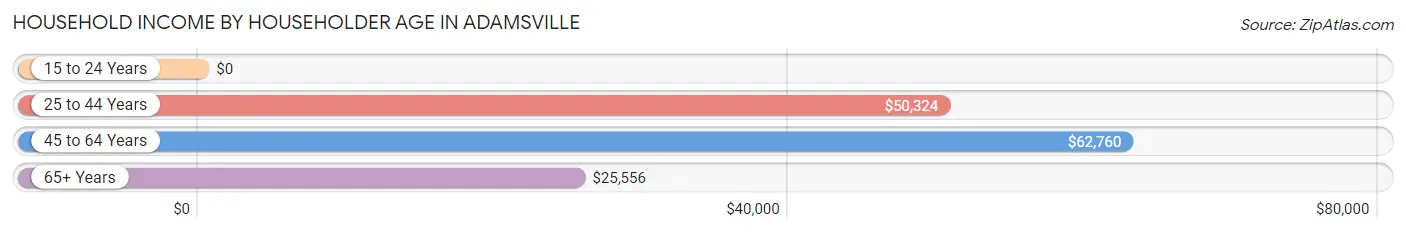
| Income Bracket | # Households | Median Income |
| 15 to 24 Years | 44 (5.6%) | $0 |
| 25 to 44 Years | 229 (29.1%) | $50,324 |
| 45 to 64 Years | 241 (30.6%) | $62,760 |
| 65+ Years | 274 (34.8%) | $25,556 |
| Total | 788 (100.0%) | $48,571 |
Poverty in Adamsville
Income Below Poverty by Sex and Age in Adamsville
With 15.4% poverty level for males and 27.2% for females among the residents of Adamsville, 6 to 11 year old males and 15 year old females are the most vulnerable to poverty, with 59 males (48.8%) and 17 females (70.8%) in their respective age groups living below the poverty level.
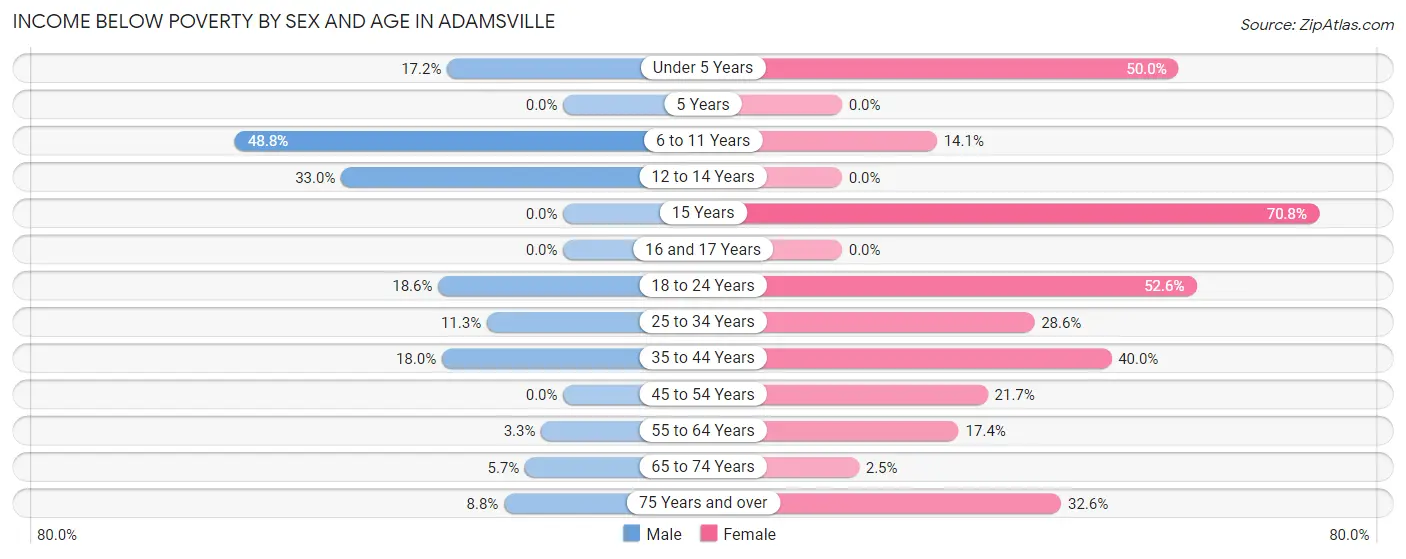
| Age Bracket | Male | Female |
| Under 5 Years | 10 (17.2%) | 33 (50.0%) |
| 5 Years | 0 (0.0%) | 0 (0.0%) |
| 6 to 11 Years | 59 (48.8%) | 11 (14.1%) |
| 12 to 14 Years | 31 (33.0%) | 0 (0.0%) |
| 15 Years | 0 (0.0%) | 17 (70.8%) |
| 16 and 17 Years | 0 (0.0%) | 0 (0.0%) |
| 18 to 24 Years | 26 (18.6%) | 80 (52.6%) |
| 25 to 34 Years | 11 (11.3%) | 26 (28.6%) |
| 35 to 44 Years | 20 (18.0%) | 50 (40.0%) |
| 45 to 54 Years | 0 (0.0%) | 21 (21.6%) |
| 55 to 64 Years | 4 (3.3%) | 17 (17.3%) |
| 65 to 74 Years | 5 (5.7%) | 3 (2.5%) |
| 75 Years and over | 8 (8.8%) | 28 (32.6%) |
| Total | 174 (15.4%) | 286 (27.2%) |
Income Above Poverty by Sex and Age in Adamsville
According to the poverty statistics in Adamsville, males aged 15 years and females aged 5 years are the age groups that are most secure financially, with 100.0% of males and 100.0% of females in these age groups living above the poverty line.
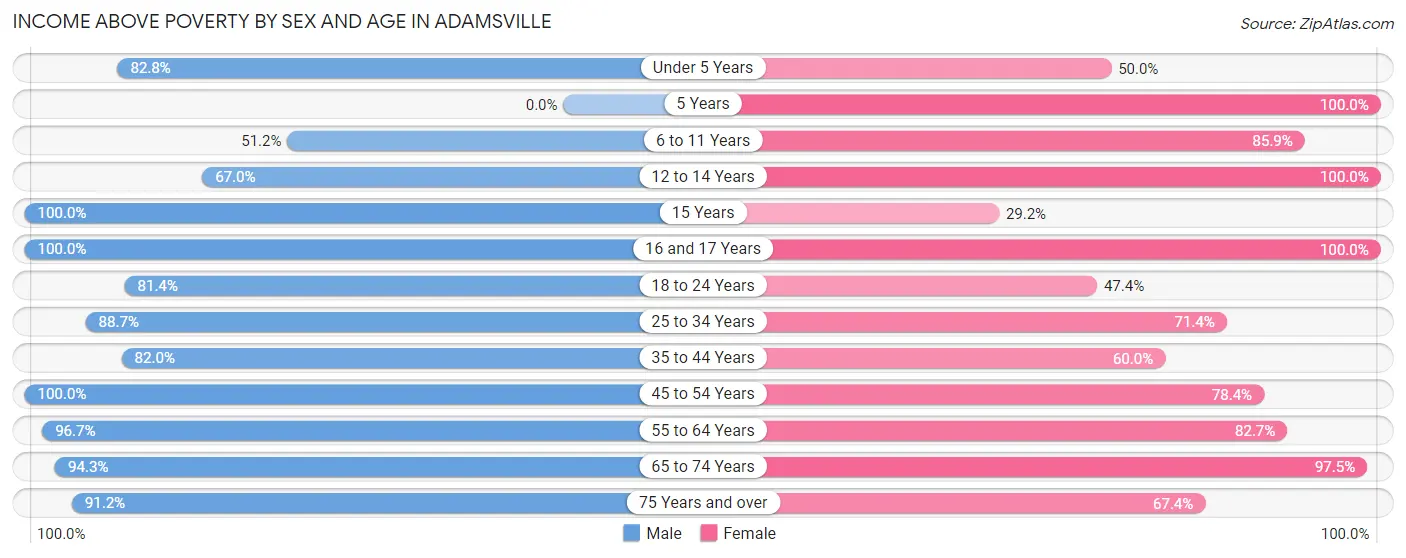
| Age Bracket | Male | Female |
| Under 5 Years | 48 (82.8%) | 33 (50.0%) |
| 5 Years | 0 (0.0%) | 19 (100.0%) |
| 6 to 11 Years | 62 (51.2%) | 67 (85.9%) |
| 12 to 14 Years | 63 (67.0%) | 84 (100.0%) |
| 15 Years | 24 (100.0%) | 7 (29.2%) |
| 16 and 17 Years | 69 (100.0%) | 14 (100.0%) |
| 18 to 24 Years | 114 (81.4%) | 72 (47.4%) |
| 25 to 34 Years | 86 (88.7%) | 65 (71.4%) |
| 35 to 44 Years | 91 (82.0%) | 75 (60.0%) |
| 45 to 54 Years | 114 (100.0%) | 76 (78.3%) |
| 55 to 64 Years | 118 (96.7%) | 81 (82.7%) |
| 65 to 74 Years | 83 (94.3%) | 116 (97.5%) |
| 75 Years and over | 83 (91.2%) | 58 (67.4%) |
| Total | 955 (84.6%) | 767 (72.8%) |
Income Below Poverty Among Married-Couple Families in Adamsville
The poverty statistics for married-couple families in Adamsville show that 12.2% or 45 of the total 369 families live below the poverty line. Families with 1 or 2 children have the highest poverty rate of 19.2%, comprising of 25 families. On the other hand, families with no children have the lowest poverty rate of 6.1%, which includes 11 families.
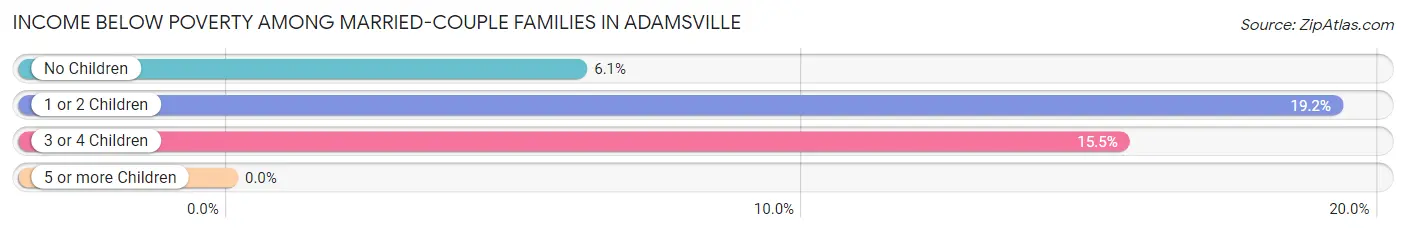
| Children | Above Poverty | Below Poverty |
| No Children | 170 (93.9%) | 11 (6.1%) |
| 1 or 2 Children | 105 (80.8%) | 25 (19.2%) |
| 3 or 4 Children | 49 (84.5%) | 9 (15.5%) |
| 5 or more Children | 0 (0.0%) | 0 (0.0%) |
| Total | 324 (87.8%) | 45 (12.2%) |
Income Below Poverty Among Single-Parent Households in Adamsville
According to the poverty data in Adamsville, 14.3% or 5 single-father households and 43.3% or 55 single-mother households are living below the poverty line. Among single-father households, those with 1 or 2 children have the highest poverty rate, with 5 households (22.7%) experiencing poverty. Likewise, among single-mother households, those with 3 or 4 children have the highest poverty rate, with 8 households (100.0%) falling below the poverty line.
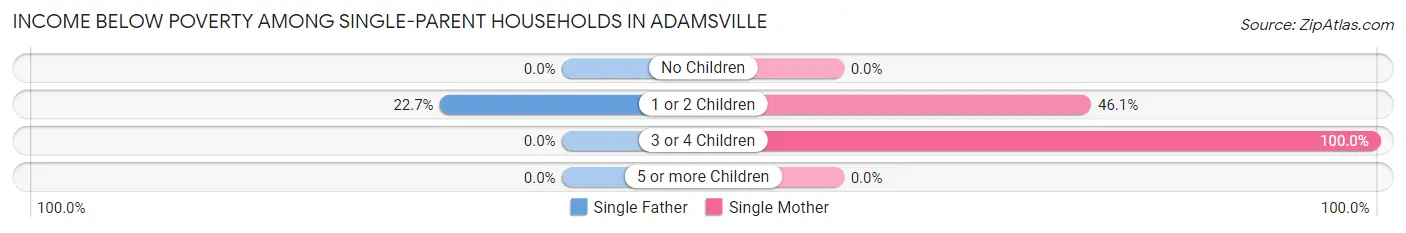
| Children | Single Father | Single Mother |
| No Children | 0 (0.0%) | 0 (0.0%) |
| 1 or 2 Children | 5 (22.7%) | 47 (46.1%) |
| 3 or 4 Children | 0 (0.0%) | 8 (100.0%) |
| 5 or more Children | 0 (0.0%) | 0 (0.0%) |
| Total | 5 (14.3%) | 55 (43.3%) |
Income Below Poverty Among Married-Couple vs Single-Parent Households in Adamsville
The poverty data for Adamsville shows that 45 of the married-couple family households (12.2%) and 60 of the single-parent households (37.0%) are living below the poverty level. Within the married-couple family households, those with 1 or 2 children have the highest poverty rate, with 25 households (19.2%) falling below the poverty line. Among the single-parent households, those with 3 or 4 children have the highest poverty rate, with 8 household (100.0%) living below poverty.
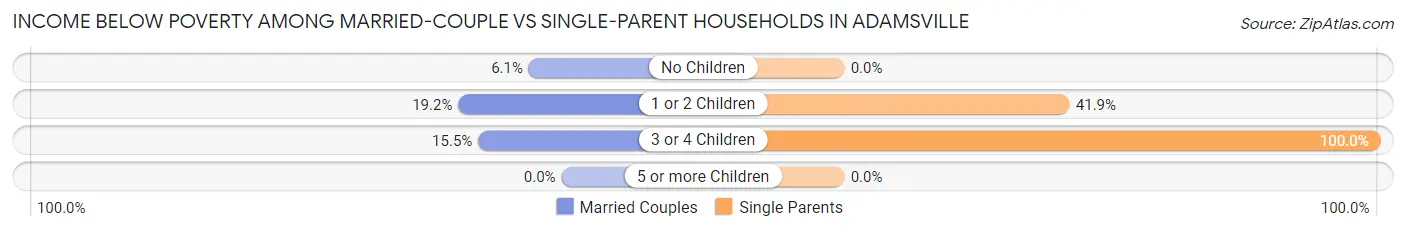
| Children | Married-Couple Families | Single-Parent Households |
| No Children | 11 (6.1%) | 0 (0.0%) |
| 1 or 2 Children | 25 (19.2%) | 52 (41.9%) |
| 3 or 4 Children | 9 (15.5%) | 8 (100.0%) |
| 5 or more Children | 0 (0.0%) | 0 (0.0%) |
| Total | 45 (12.2%) | 60 (37.0%) |
Race in Adamsville
The most populous races in Adamsville are White / Caucasian (2,303 | 98.7%), Two or more Races (18 | 0.8%), and Native / Alaskan (13 | 0.6%).
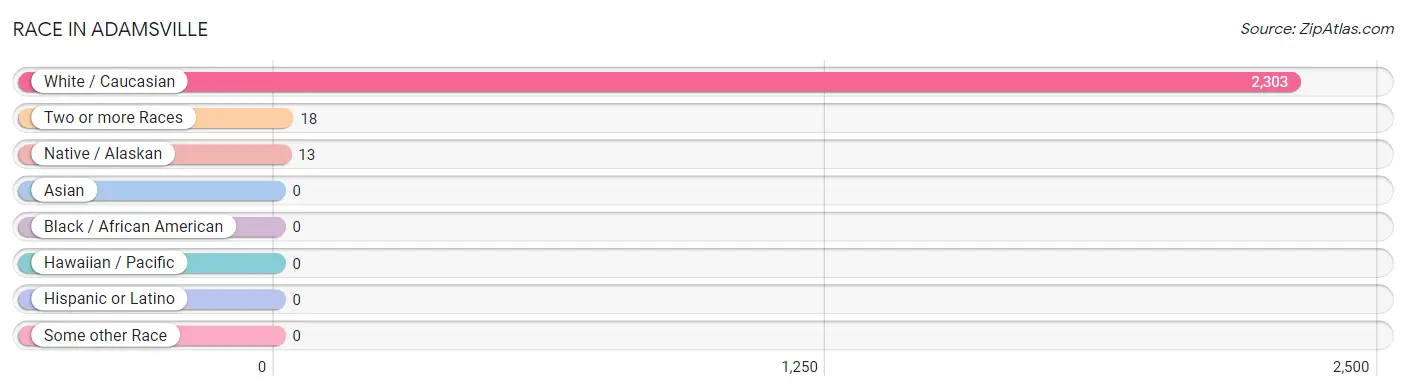
| Race | # Population | % Population |
| Asian | 0 | 0.0% |
| Black / African American | 0 | 0.0% |
| Hawaiian / Pacific | 0 | 0.0% |
| Hispanic or Latino | 0 | 0.0% |
| Native / Alaskan | 13 | 0.6% |
| White / Caucasian | 2,303 | 98.7% |
| Two or more Races | 18 | 0.8% |
| Some other Race | 0 | 0.0% |
| Total | 2,334 | 100.0% |
Ancestry in Adamsville
The most populous ancestries reported in Adamsville are English (311 | 13.3%), Irish (279 | 11.9%), American (247 | 10.6%), German (178 | 7.6%), and Hungarian (35 | 1.5%), together accounting for 45.0% of all Adamsville residents.
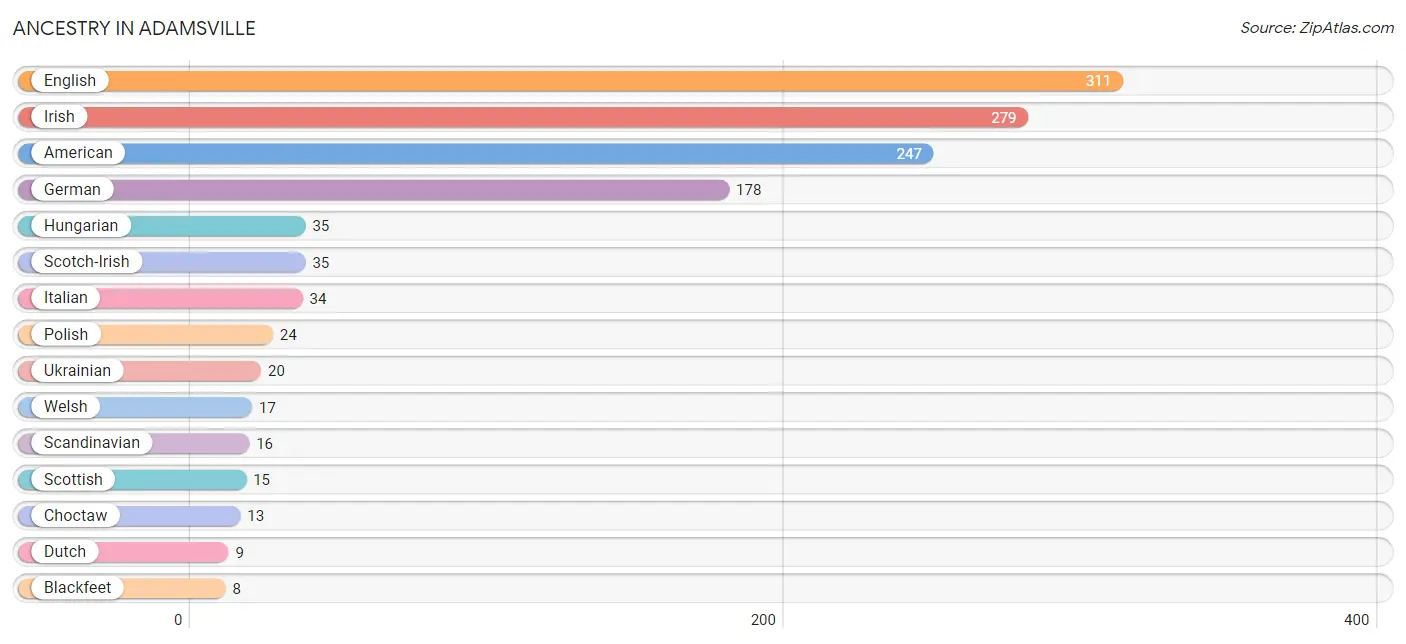
| Ancestry | # Population | % Population |
| American | 247 | 10.6% |
| Blackfeet | 8 | 0.3% |
| Choctaw | 13 | 0.6% |
| Dutch | 9 | 0.4% |
| English | 311 | 13.3% |
| French Canadian | 3 | 0.1% |
| German | 178 | 7.6% |
| Hungarian | 35 | 1.5% |
| Irish | 279 | 11.9% |
| Italian | 34 | 1.5% |
| Polish | 24 | 1.0% |
| Scandinavian | 16 | 0.7% |
| Scotch-Irish | 35 | 1.5% |
| Scottish | 15 | 0.6% |
| Ukrainian | 20 | 0.9% |
| Welsh | 17 | 0.7% | View All 16 Rows |
Immigrants in Adamsville

| Immigration Origin | # Population | % Population | View All 0 Rows |
Sex and Age in Adamsville
Sex and Age in Adamsville
The most populous age groups in Adamsville are 10 to 14 Years (174 | 14.6%) for men and 20 to 24 Years (126 | 11.0%) for women.
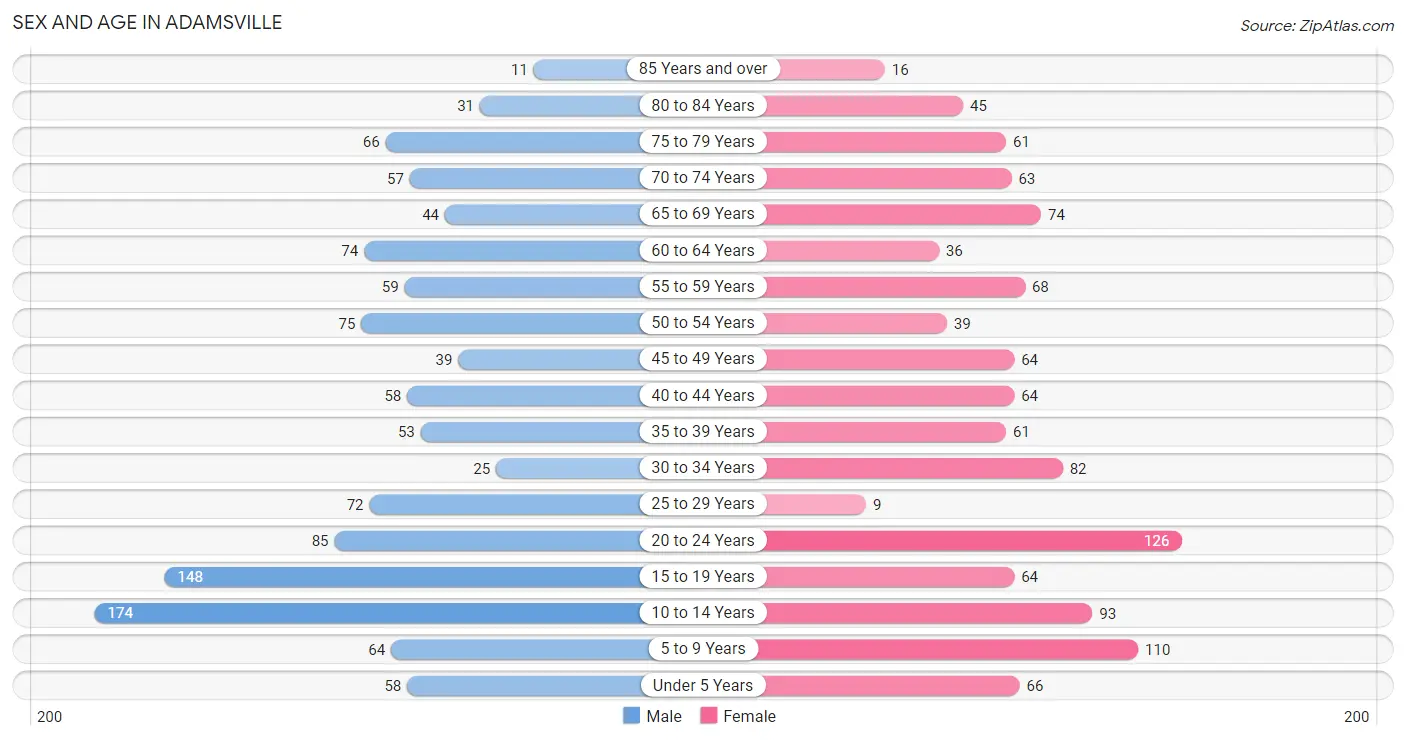
| Age Bracket | Male | Female |
| Under 5 Years | 58 (4.9%) | 66 (5.8%) |
| 5 to 9 Years | 64 (5.4%) | 110 (9.6%) |
| 10 to 14 Years | 174 (14.6%) | 93 (8.2%) |
| 15 to 19 Years | 148 (12.4%) | 64 (5.6%) |
| 20 to 24 Years | 85 (7.1%) | 126 (11.0%) |
| 25 to 29 Years | 72 (6.0%) | 9 (0.8%) |
| 30 to 34 Years | 25 (2.1%) | 82 (7.2%) |
| 35 to 39 Years | 53 (4.4%) | 61 (5.3%) |
| 40 to 44 Years | 58 (4.9%) | 64 (5.6%) |
| 45 to 49 Years | 39 (3.3%) | 64 (5.6%) |
| 50 to 54 Years | 75 (6.3%) | 39 (3.4%) |
| 55 to 59 Years | 59 (5.0%) | 68 (6.0%) |
| 60 to 64 Years | 74 (6.2%) | 36 (3.2%) |
| 65 to 69 Years | 44 (3.7%) | 74 (6.5%) |
| 70 to 74 Years | 57 (4.8%) | 63 (5.5%) |
| 75 to 79 Years | 66 (5.5%) | 61 (5.3%) |
| 80 to 84 Years | 31 (2.6%) | 45 (3.9%) |
| 85 Years and over | 11 (0.9%) | 16 (1.4%) |
| Total | 1,193 (100.0%) | 1,141 (100.0%) |
Families and Households in Adamsville
Median Family Size in Adamsville
The median family size in Adamsville is 3.36 persons per family, with married-couple families (369 | 69.5%) accounting for the largest median family size of 3.54 persons per family. On the other hand, single male/father families (35 | 6.6%) represent the smallest median family size with 2.80 persons per family.
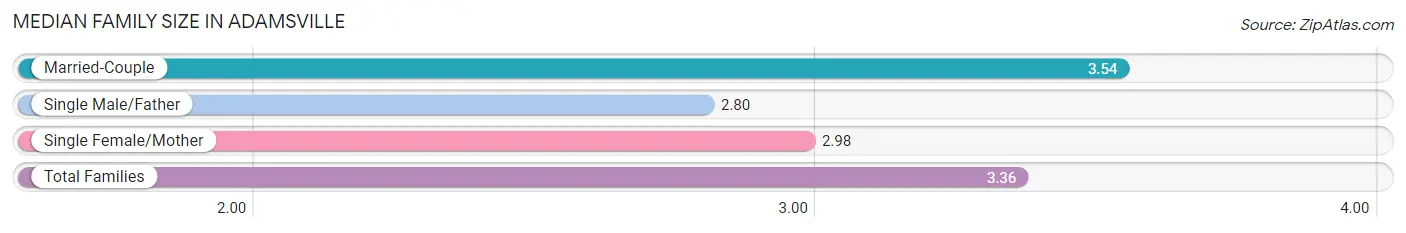
| Family Type | # Families | Family Size |
| Married-Couple | 369 (69.5%) | 3.54 |
| Single Male/Father | 35 (6.6%) | 2.80 |
| Single Female/Mother | 127 (23.9%) | 2.98 |
| Total Families | 531 (100.0%) | 3.36 |
Median Household Size in Adamsville
The median household size in Adamsville is 2.83 persons per household, with married-couple households (369 | 46.8%) accounting for the largest median household size of 3.54 persons per household. non-family households (257 | 32.6%) represent the smallest median household size with 1.56 persons per household.
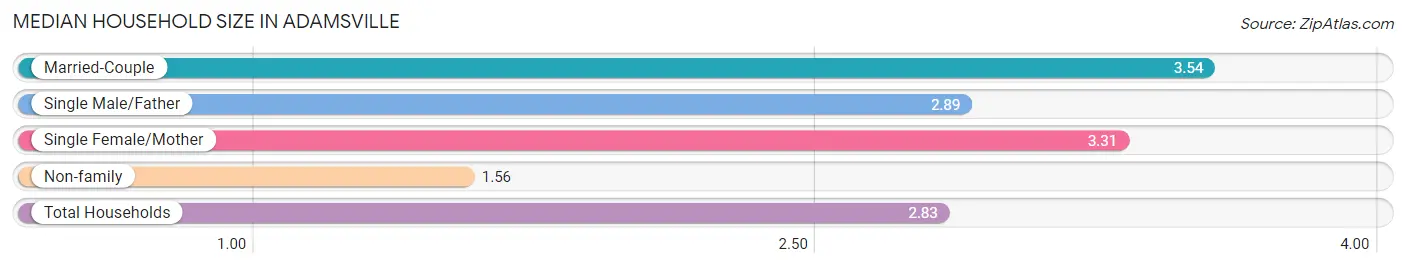
| Household Type | # Households | Household Size |
| Married-Couple | 369 (46.8%) | 3.54 |
| Single Male/Father | 35 (4.4%) | 2.89 |
| Single Female/Mother | 127 (16.1%) | 3.31 |
| Non-family | 257 (32.6%) | 1.56 |
| Total Households | 788 (100.0%) | 2.83 |
Household Size by Marriage Status in Adamsville
Out of a total of 788 households in Adamsville, 531 (67.4%) are family households, while 257 (32.6%) are nonfamily households. The most numerous type of family households are 2-person households, comprising 232, and the most common type of nonfamily households are 1-person households, comprising 227.
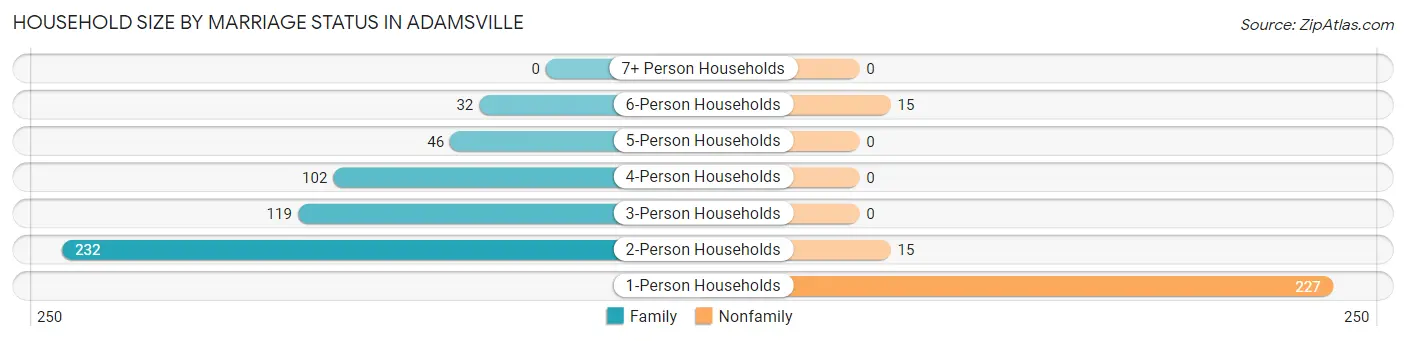
| Household Size | Family Households | Nonfamily Households |
| 1-Person Households | - | 227 (28.8%) |
| 2-Person Households | 232 (29.4%) | 15 (1.9%) |
| 3-Person Households | 119 (15.1%) | 0 (0.0%) |
| 4-Person Households | 102 (12.9%) | 0 (0.0%) |
| 5-Person Households | 46 (5.8%) | 0 (0.0%) |
| 6-Person Households | 32 (4.1%) | 15 (1.9%) |
| 7+ Person Households | 0 (0.0%) | 0 (0.0%) |
| Total | 531 (67.4%) | 257 (32.6%) |
Female Fertility in Adamsville
Fertility by Age in Adamsville
Average fertility rate in Adamsville is 66.0 births per 1,000 women. Women in the age bracket of 20 to 34 years have the highest fertility rate with 147.0 births per 1,000 women. Women in the age bracket of 20 to 34 years acount for 100.0% of all women with births.
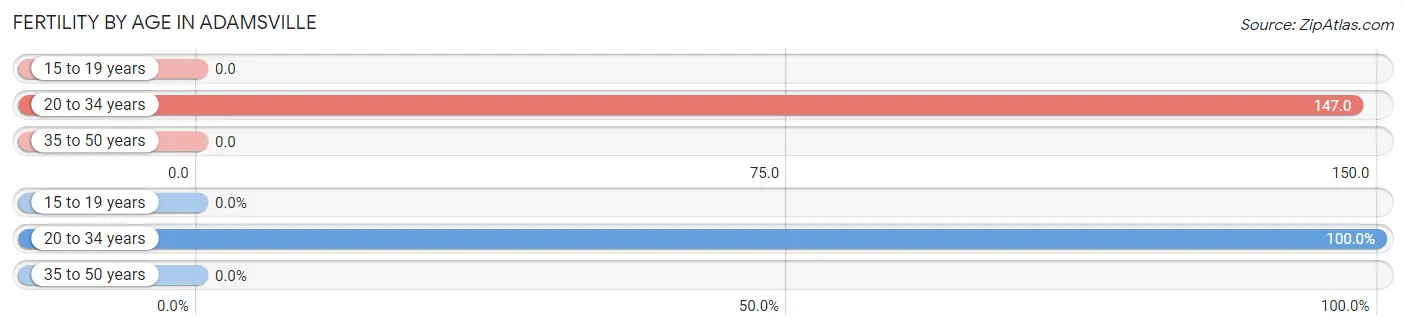
| Age Bracket | Women with Births | Births / 1,000 Women |
| 15 to 19 years | 0 (0.0%) | 0.0 |
| 20 to 34 years | 32 (100.0%) | 147.0 |
| 35 to 50 years | 0 (0.0%) | 0.0 |
| Total | 32 (100.0%) | 66.0 |
Fertility by Age by Marriage Status in Adamsville
40.6% of women with births (32) in Adamsville are married. The highest percentage of unmarried women with births falls into 20 to 34 years age bracket with 59.4% of them unmarried at the time of birth, while the lowest percentage of unmarried women with births belong to 20 to 34 years age bracket with 59.4% of them unmarried.
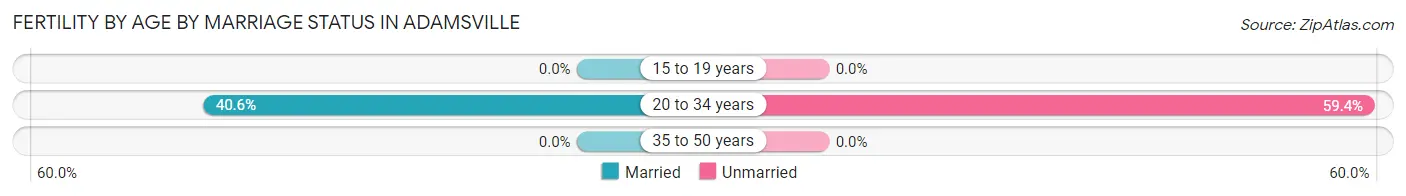
| Age Bracket | Married | Unmarried |
| 15 to 19 years | 0 (0.0%) | 0 (0.0%) |
| 20 to 34 years | 13 (40.6%) | 19 (59.4%) |
| 35 to 50 years | 0 (0.0%) | 0 (0.0%) |
| Total | 13 (40.6%) | 19 (59.4%) |
Fertility by Education in Adamsville
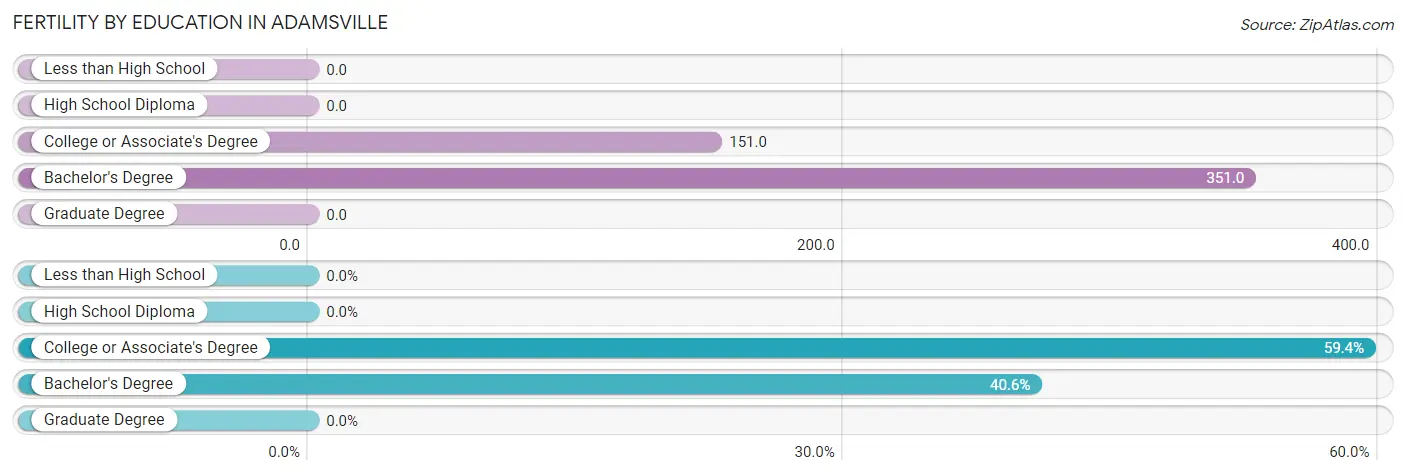
| Educational Attainment | Women with Births | Births / 1,000 Women |
| Less than High School | 0 (0.0%) | 0.0 |
| High School Diploma | 0 (0.0%) | 0.0 |
| College or Associate's Degree | 19 (59.4%) | 151.0 |
| Bachelor's Degree | 13 (40.6%) | 351.0 |
| Graduate Degree | 0 (0.0%) | 0.0 |
| Total | 32 (100.0%) | 66.0 |
Fertility by Education by Marriage Status in Adamsville
59.4% of women with births in Adamsville are unmarried. Women with the educational attainment of bachelor's degree are most likely to be married with 100.0% of them married at childbirth, while women with the educational attainment of college or associate's degree are least likely to be married with 100.0% of them unmarried at childbirth.
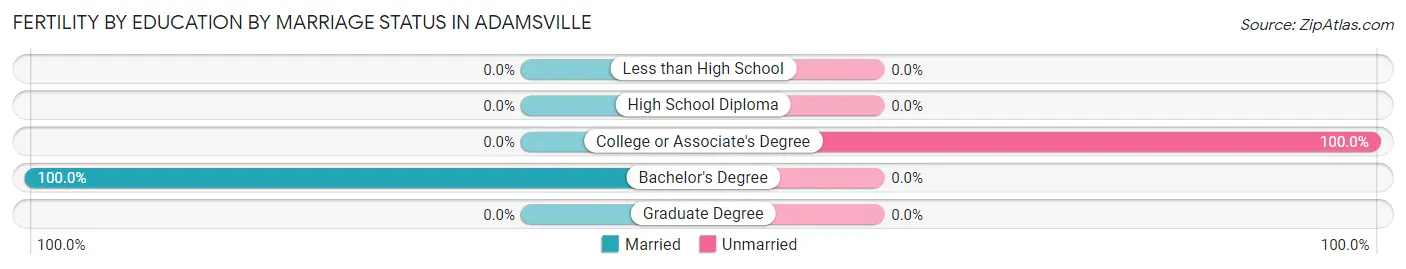
| Educational Attainment | Married | Unmarried |
| Less than High School | 0 (0.0%) | 0 (0.0%) |
| High School Diploma | 0 (0.0%) | 0 (0.0%) |
| College or Associate's Degree | 0 (0.0%) | 19 (100.0%) |
| Bachelor's Degree | 13 (100.0%) | 0 (0.0%) |
| Graduate Degree | 0 (0.0%) | 0 (0.0%) |
| Total | 13 (40.6%) | 19 (59.4%) |
Employment Characteristics in Adamsville
Employment by Class of Employer in Adamsville
Among the 805 employed individuals in Adamsville, private company employees (587 | 72.9%), local government employees (69 | 8.6%), and self-employed (not incorporated) (49 | 6.1%) make up the most common classes of employment.
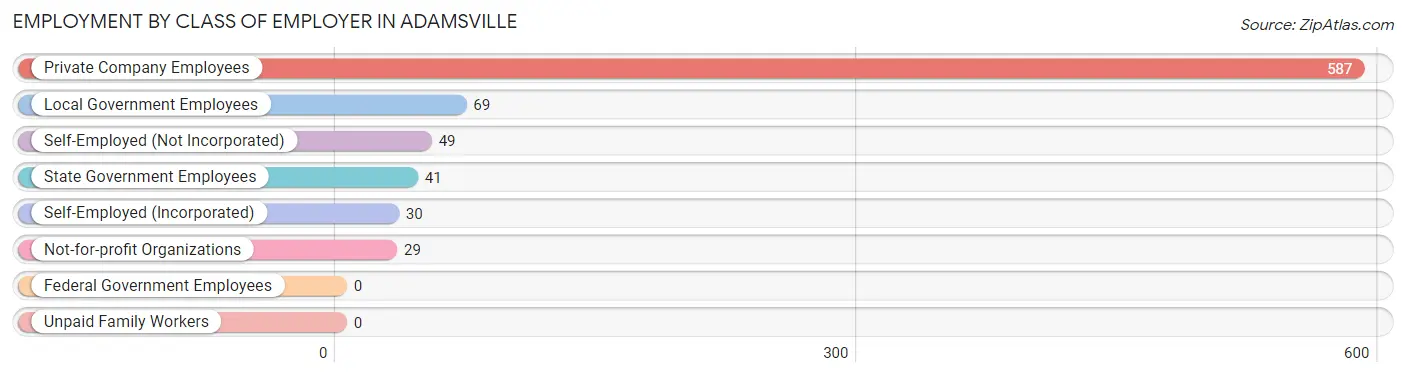
| Employer Class | # Employees | % Employees |
| Private Company Employees | 587 | 72.9% |
| Self-Employed (Incorporated) | 30 | 3.7% |
| Self-Employed (Not Incorporated) | 49 | 6.1% |
| Not-for-profit Organizations | 29 | 3.6% |
| Local Government Employees | 69 | 8.6% |
| State Government Employees | 41 | 5.1% |
| Federal Government Employees | 0 | 0.0% |
| Unpaid Family Workers | 0 | 0.0% |
| Total | 805 | 100.0% |
Employment Status by Age in Adamsville
According to the labor force statistics for Adamsville, out of the total population over 16 years of age (1,721), 50.6% or 871 individuals are in the labor force, with 6.1% or 53 of them unemployed. The age group with the highest labor force participation rate is 25 to 29 years, with 88.9% or 72 individuals in the labor force. Within the labor force, the 30 to 34 years age range has the highest percentage of unemployed individuals, with 17.7% or 14 of them being unemployed.
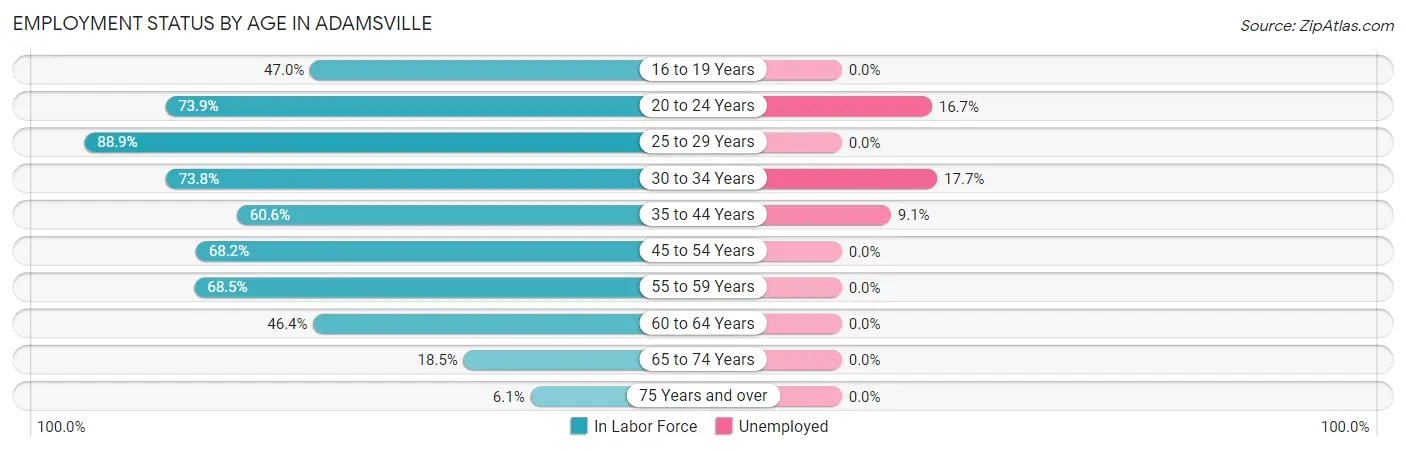
| Age Bracket | In Labor Force | Unemployed |
| 16 to 19 Years | 77 (47.0%) | 0 (0.0%) |
| 20 to 24 Years | 156 (73.9%) | 26 (16.7%) |
| 25 to 29 Years | 72 (88.9%) | 0 (0.0%) |
| 30 to 34 Years | 79 (73.8%) | 14 (17.7%) |
| 35 to 44 Years | 143 (60.6%) | 13 (9.1%) |
| 45 to 54 Years | 148 (68.2%) | 0 (0.0%) |
| 55 to 59 Years | 87 (68.5%) | 0 (0.0%) |
| 60 to 64 Years | 51 (46.4%) | 0 (0.0%) |
| 65 to 74 Years | 44 (18.5%) | 0 (0.0%) |
| 75 Years and over | 14 (6.1%) | 0 (0.0%) |
| Total | 871 (50.6%) | 53 (6.1%) |
Employment Status by Educational Attainment in Adamsville
According to labor force statistics for Adamsville, 66.1% of individuals (580) out of the total population between 25 and 64 years of age (878) are in the labor force, with 4.7% or 27 of them being unemployed. The group with the highest labor force participation rate are those with the educational attainment of college / associate degree, with 73.7% or 241 individuals in the labor force. Within the labor force, individuals with bachelor's degree or higher education have the highest percentage of unemployment, with 17.3% or 14 of them being unemployed.
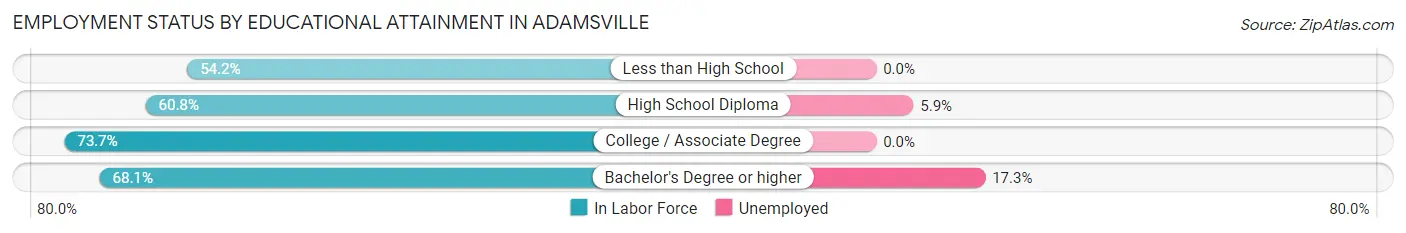
| Educational Attainment | In Labor Force | Unemployed |
| Less than High School | 39 (54.2%) | 0 (0.0%) |
| High School Diploma | 219 (60.8%) | 21 (5.9%) |
| College / Associate Degree | 241 (73.7%) | 0 (0.0%) |
| Bachelor's Degree or higher | 81 (68.1%) | 21 (17.3%) |
| Total | 580 (66.1%) | 41 (4.7%) |
Employment Occupations by Sex in Adamsville
Management, Business, Science and Arts Occupations
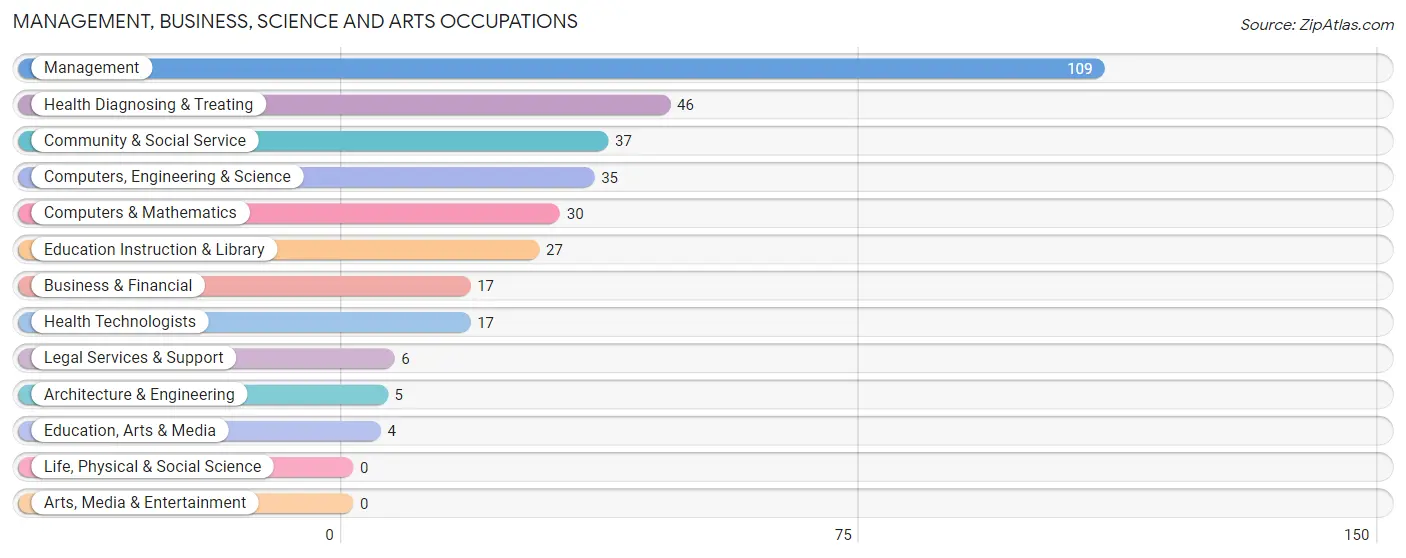
The most common Management, Business, Science and Arts occupations in Adamsville are Management (109 | 13.3%), Health Diagnosing & Treating (46 | 5.6%), Community & Social Service (37 | 4.5%), Computers, Engineering & Science (35 | 4.3%), and Computers & Mathematics (30 | 3.7%).
Management, Business, Science and Arts Occupations by Sex
Within the Management, Business, Science and Arts occupations in Adamsville, the most male-oriented occupations are Architecture & Engineering (100.0%), Education, Arts & Media (100.0%), and Computers, Engineering & Science (82.9%), while the most female-oriented occupations are Business & Financial (100.0%), Legal Services & Support (100.0%), and Health Diagnosing & Treating (89.1%).
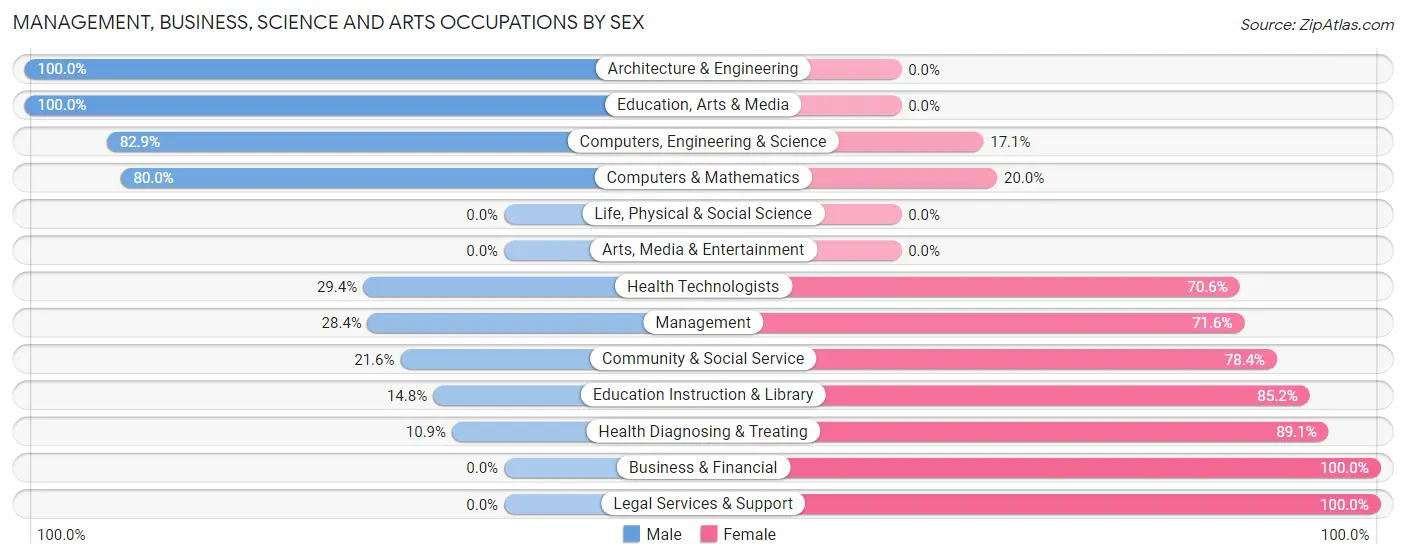
| Occupation | Male | Female |
| Management | 31 (28.4%) | 78 (71.6%) |
| Business & Financial | 0 (0.0%) | 17 (100.0%) |
| Computers, Engineering & Science | 29 (82.9%) | 6 (17.1%) |
| Computers & Mathematics | 24 (80.0%) | 6 (20.0%) |
| Architecture & Engineering | 5 (100.0%) | 0 (0.0%) |
| Life, Physical & Social Science | 0 (0.0%) | 0 (0.0%) |
| Community & Social Service | 8 (21.6%) | 29 (78.4%) |
| Education, Arts & Media | 4 (100.0%) | 0 (0.0%) |
| Legal Services & Support | 0 (0.0%) | 6 (100.0%) |
| Education Instruction & Library | 4 (14.8%) | 23 (85.2%) |
| Arts, Media & Entertainment | 0 (0.0%) | 0 (0.0%) |
| Health Diagnosing & Treating | 5 (10.9%) | 41 (89.1%) |
| Health Technologists | 5 (29.4%) | 12 (70.6%) |
| Total (Category) | 73 (29.9%) | 171 (70.1%) |
| Total (Overall) | 457 (55.9%) | 361 (44.1%) |
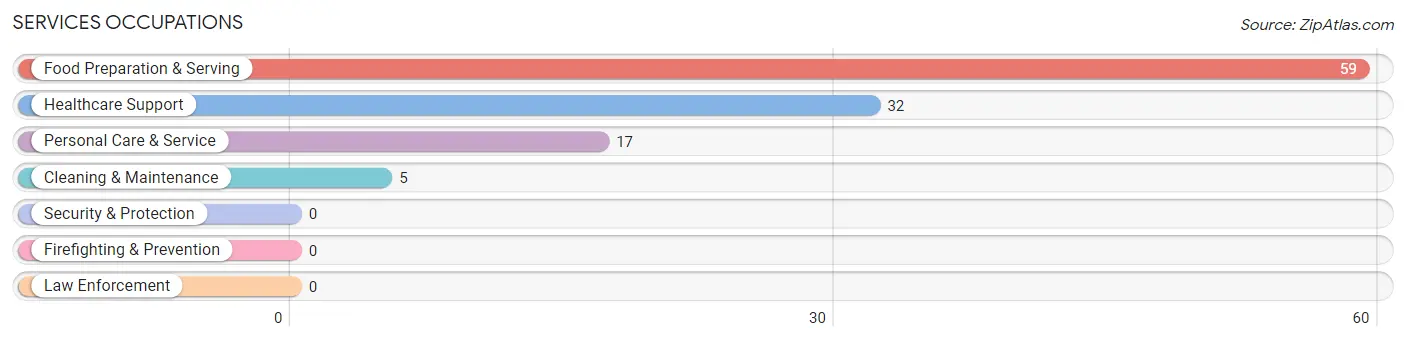
Services Occupations
The most common Services occupations in Adamsville are Food Preparation & Serving (59 | 7.2%), Healthcare Support (32 | 3.9%), Personal Care & Service (17 | 2.1%), and Cleaning & Maintenance (5 | 0.6%).
Services Occupations by Sex
Within the Services occupations in Adamsville, the most male-oriented occupations are Cleaning & Maintenance (100.0%), Personal Care & Service (100.0%), and Food Preparation & Serving (20.3%), while the most female-oriented occupations are Healthcare Support (100.0%), and Food Preparation & Serving (79.7%).
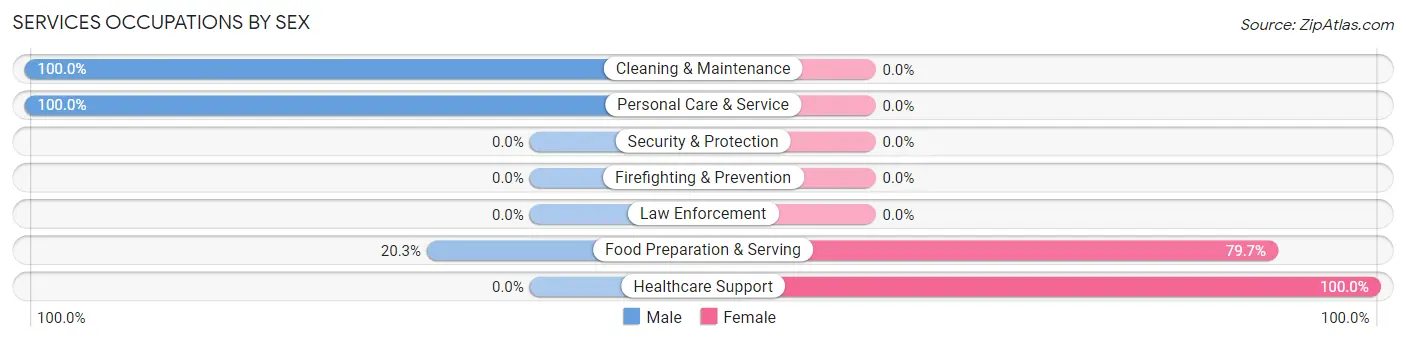
| Occupation | Male | Female |
| Healthcare Support | 0 (0.0%) | 32 (100.0%) |
| Security & Protection | 0 (0.0%) | 0 (0.0%) |
| Firefighting & Prevention | 0 (0.0%) | 0 (0.0%) |
| Law Enforcement | 0 (0.0%) | 0 (0.0%) |
| Food Preparation & Serving | 12 (20.3%) | 47 (79.7%) |
| Cleaning & Maintenance | 5 (100.0%) | 0 (0.0%) |
| Personal Care & Service | 17 (100.0%) | 0 (0.0%) |
| Total (Category) | 34 (30.1%) | 79 (69.9%) |
| Total (Overall) | 457 (55.9%) | 361 (44.1%) |
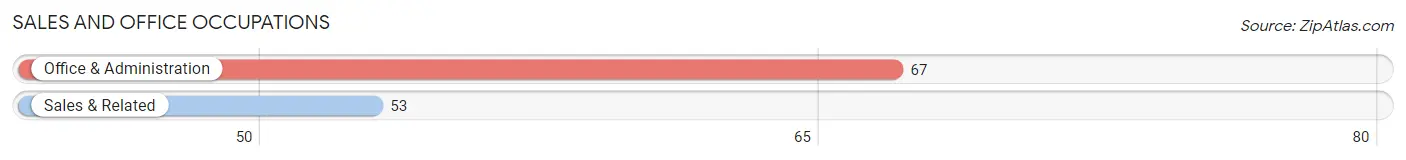
Sales and Office Occupations
The most common Sales and Office occupations in Adamsville are Office & Administration (67 | 8.2%), and Sales & Related (53 | 6.5%).
Sales and Office Occupations by Sex

| Occupation | Male | Female |
| Sales & Related | 16 (30.2%) | 37 (69.8%) |
| Office & Administration | 31 (46.3%) | 36 (53.7%) |
| Total (Category) | 47 (39.2%) | 73 (60.8%) |
| Total (Overall) | 457 (55.9%) | 361 (44.1%) |
Natural Resources, Construction and Maintenance Occupations
The most common Natural Resources, Construction and Maintenance occupations in Adamsville are Construction & Extraction (48 | 5.9%), and Installation, Maintenance & Repair (41 | 5.0%).
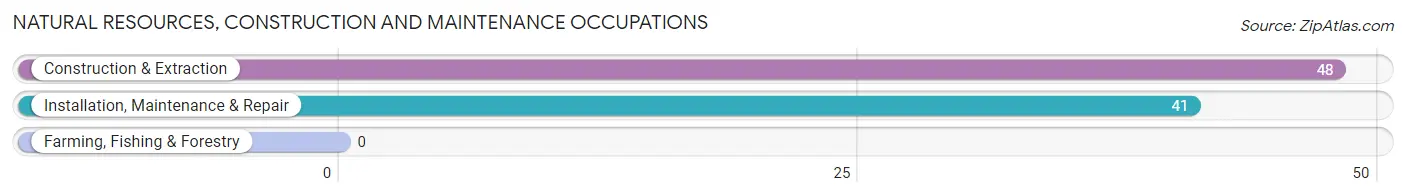
Natural Resources, Construction and Maintenance Occupations by Sex

| Occupation | Male | Female |
| Farming, Fishing & Forestry | 0 (0.0%) | 0 (0.0%) |
| Construction & Extraction | 48 (100.0%) | 0 (0.0%) |
| Installation, Maintenance & Repair | 41 (100.0%) | 0 (0.0%) |
| Total (Category) | 89 (100.0%) | 0 (0.0%) |
| Total (Overall) | 457 (55.9%) | 361 (44.1%) |
Production, Transportation and Moving Occupations
The most common Production, Transportation and Moving occupations in Adamsville are Production (129 | 15.8%), Material Moving (68 | 8.3%), and Transportation (55 | 6.7%).
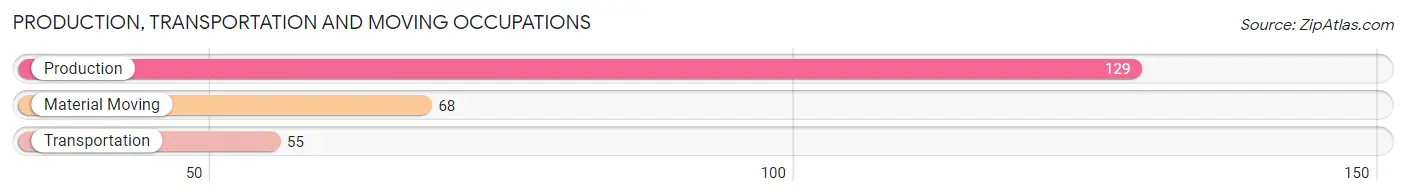
Production, Transportation and Moving Occupations by Sex
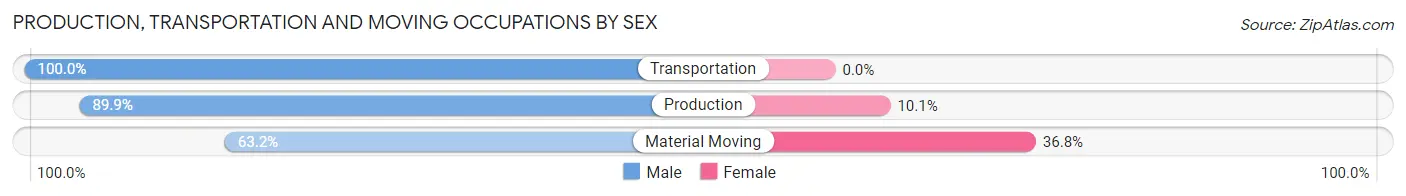
| Occupation | Male | Female |
| Production | 116 (89.9%) | 13 (10.1%) |
| Transportation | 55 (100.0%) | 0 (0.0%) |
| Material Moving | 43 (63.2%) | 25 (36.8%) |
| Total (Category) | 214 (84.9%) | 38 (15.1%) |
| Total (Overall) | 457 (55.9%) | 361 (44.1%) |
Employment Industries by Sex in Adamsville
Employment Industries in Adamsville
The major employment industries in Adamsville include Manufacturing (199 | 24.3%), Retail Trade (130 | 15.9%), Health Care & Social Assistance (112 | 13.7%), Public Administration (60 | 7.3%), and Accommodation & Food Services (52 | 6.4%).
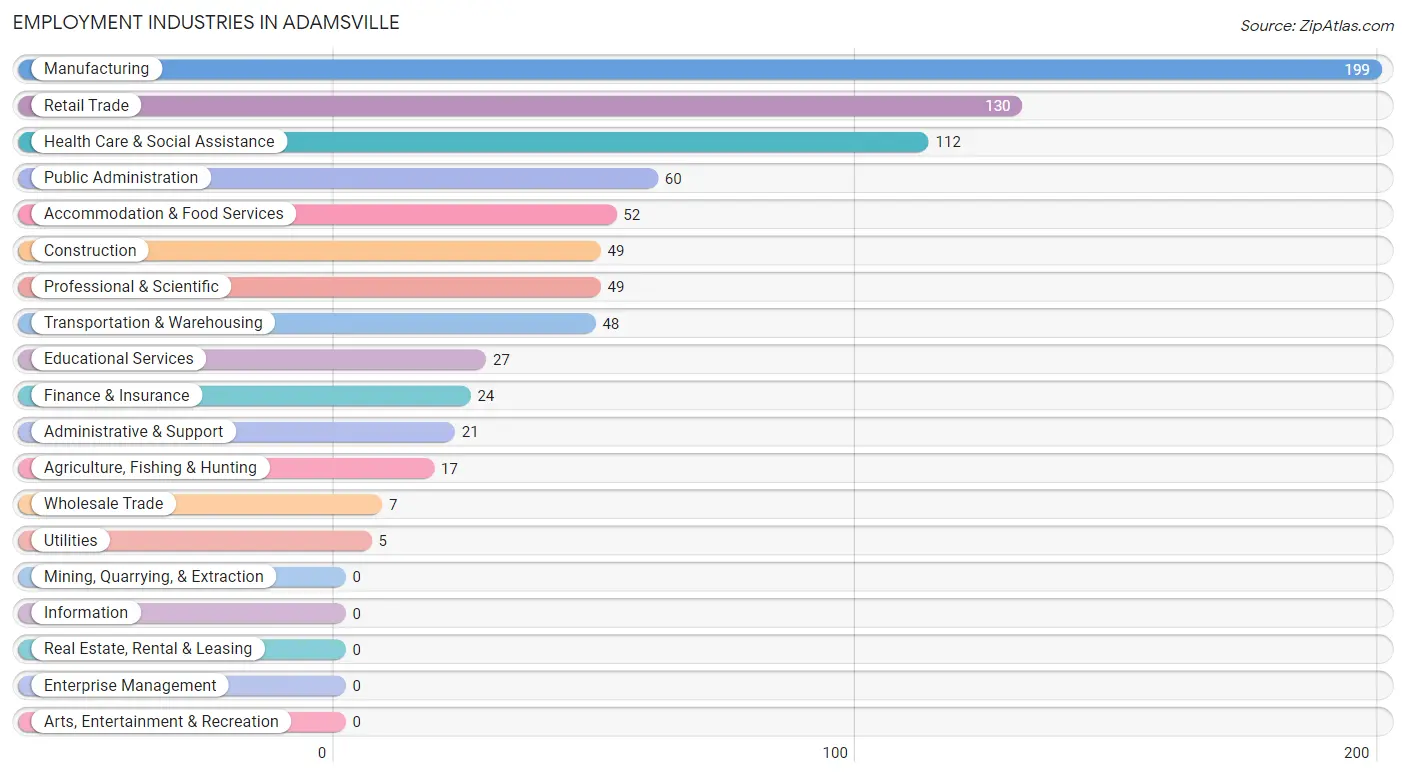
Employment Industries by Sex in Adamsville
The Adamsville industries that see more men than women are Agriculture, Fishing & Hunting (100.0%), Construction (100.0%), and Wholesale Trade (100.0%), whereas the industries that tend to have a higher number of women are Educational Services (85.2%), Professional & Scientific (83.7%), and Administrative & Support (80.9%).
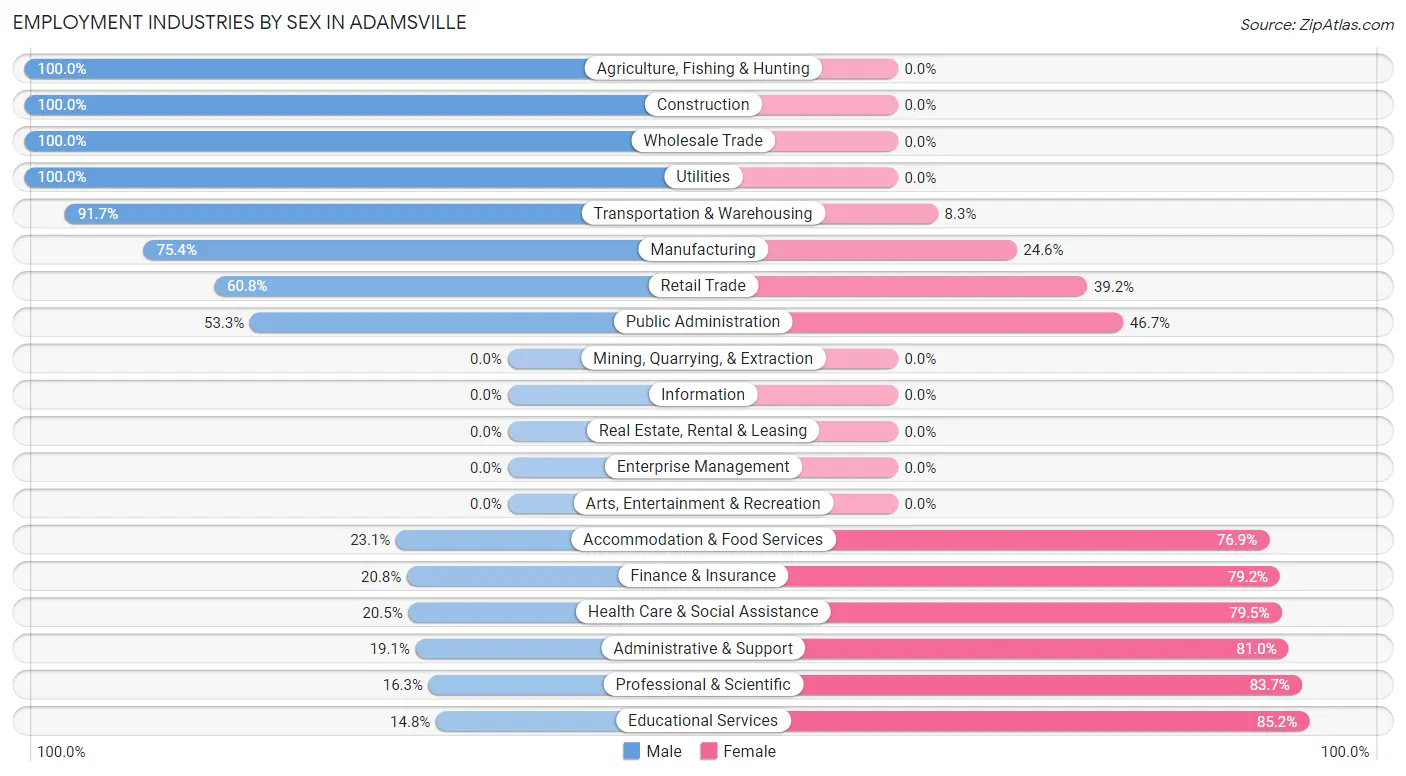
| Industry | Male | Female |
| Agriculture, Fishing & Hunting | 17 (100.0%) | 0 (0.0%) |
| Mining, Quarrying, & Extraction | 0 (0.0%) | 0 (0.0%) |
| Construction | 49 (100.0%) | 0 (0.0%) |
| Manufacturing | 150 (75.4%) | 49 (24.6%) |
| Wholesale Trade | 7 (100.0%) | 0 (0.0%) |
| Retail Trade | 79 (60.8%) | 51 (39.2%) |
| Transportation & Warehousing | 44 (91.7%) | 4 (8.3%) |
| Utilities | 5 (100.0%) | 0 (0.0%) |
| Information | 0 (0.0%) | 0 (0.0%) |
| Finance & Insurance | 5 (20.8%) | 19 (79.2%) |
| Real Estate, Rental & Leasing | 0 (0.0%) | 0 (0.0%) |
| Professional & Scientific | 8 (16.3%) | 41 (83.7%) |
| Enterprise Management | 0 (0.0%) | 0 (0.0%) |
| Administrative & Support | 4 (19.1%) | 17 (80.9%) |
| Educational Services | 4 (14.8%) | 23 (85.2%) |
| Health Care & Social Assistance | 23 (20.5%) | 89 (79.5%) |
| Arts, Entertainment & Recreation | 0 (0.0%) | 0 (0.0%) |
| Accommodation & Food Services | 12 (23.1%) | 40 (76.9%) |
| Public Administration | 32 (53.3%) | 28 (46.7%) |
| Total | 457 (55.9%) | 361 (44.1%) |
Education in Adamsville
School Enrollment in Adamsville
The most common levels of schooling among the 662 students in Adamsville are middle school (247 | 37.3%), elementary school (169 | 25.5%), and high school (144 | 21.7%).
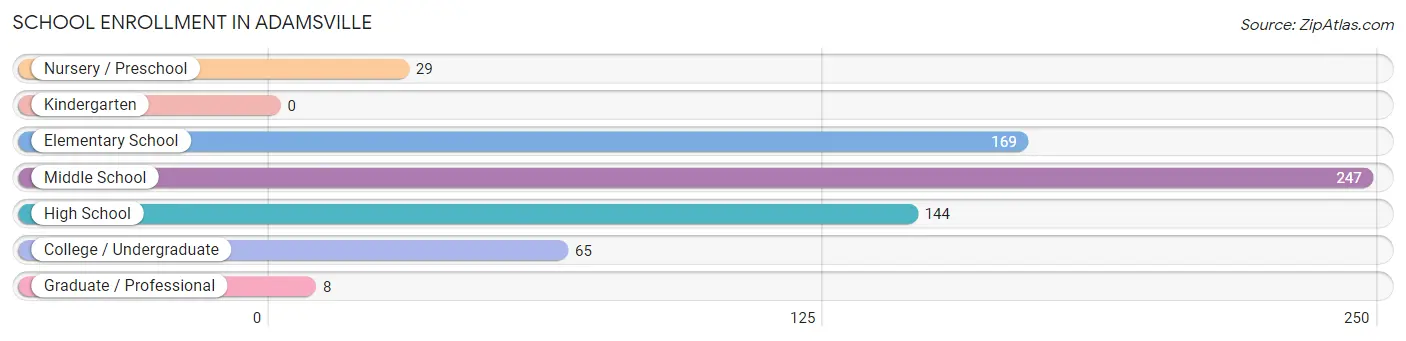
| School Level | # Students | % Students |
| Nursery / Preschool | 29 | 4.4% |
| Kindergarten | 0 | 0.0% |
| Elementary School | 169 | 25.5% |
| Middle School | 247 | 37.3% |
| High School | 144 | 21.7% |
| College / Undergraduate | 65 | 9.8% |
| Graduate / Professional | 8 | 1.2% |
| Total | 662 | 100.0% |
School Enrollment by Age by Funding Source in Adamsville
Out of a total of 662 students who are enrolled in schools in Adamsville, 101 (15.3%) attend a private institution, while the remaining 561 (84.7%) are enrolled in public schools. The age group of 25 to 34 year olds has the highest likelihood of being enrolled in private schools, with 16 (48.5% in the age bracket) enrolled. Conversely, the age group of 3 to 4 year olds has the lowest likelihood of being enrolled in a private school, with 10 (100.0% in the age bracket) attending a public institution.
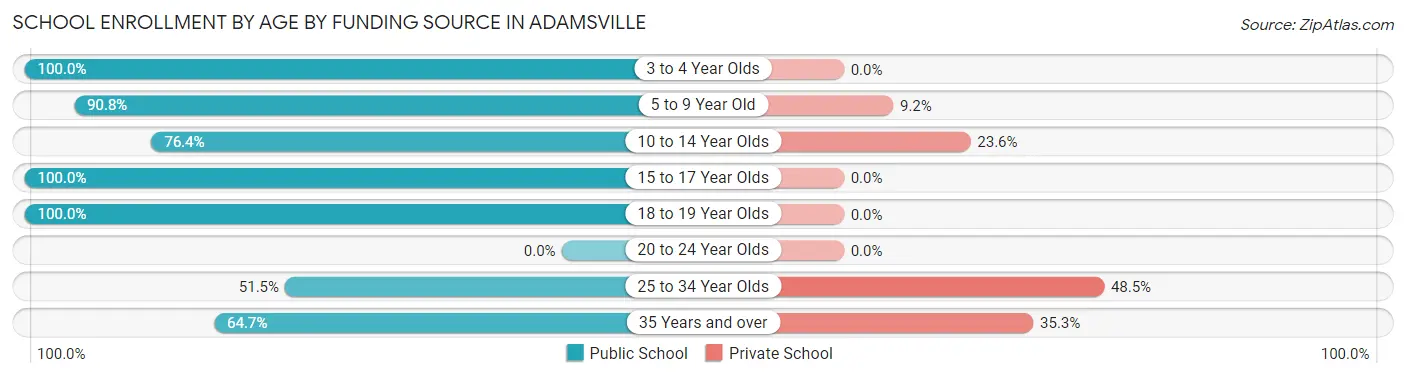
| Age Bracket | Public School | Private School |
| 3 to 4 Year Olds | 10 (100.0%) | 0 (0.0%) |
| 5 to 9 Year Old | 158 (90.8%) | 16 (9.2%) |
| 10 to 14 Year Olds | 204 (76.4%) | 63 (23.6%) |
| 15 to 17 Year Olds | 131 (100.0%) | 0 (0.0%) |
| 18 to 19 Year Olds | 30 (100.0%) | 0 (0.0%) |
| 20 to 24 Year Olds | 0 (0.0%) | 0 (0.0%) |
| 25 to 34 Year Olds | 17 (51.5%) | 16 (48.5%) |
| 35 Years and over | 11 (64.7%) | 6 (35.3%) |
| Total | 561 (84.7%) | 101 (15.3%) |
Educational Attainment by Field of Study in Adamsville
Business (51 | 34.5%), education (18 | 12.2%), science & technology (17 | 11.5%), arts & humanities (17 | 11.5%), and communications (13 | 8.8%) are the most common fields of study among 148 individuals in Adamsville who have obtained a bachelor's degree or higher.
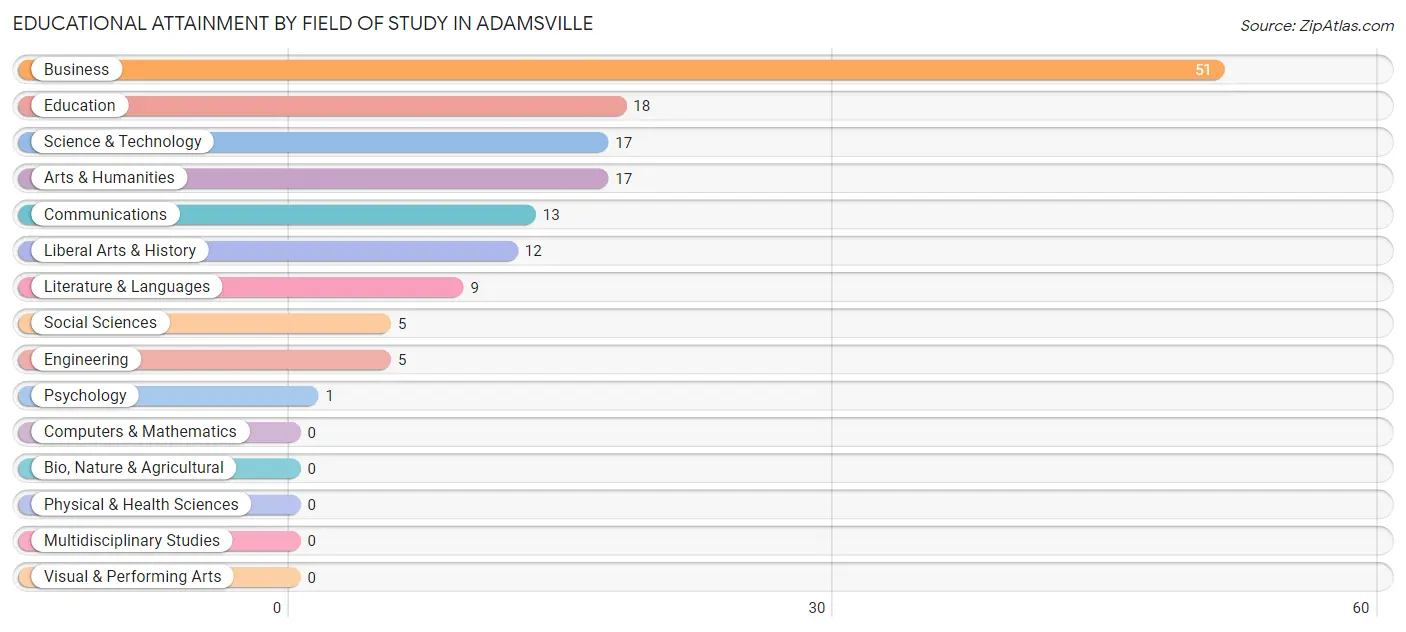
| Field of Study | # Graduates | % Graduates |
| Computers & Mathematics | 0 | 0.0% |
| Bio, Nature & Agricultural | 0 | 0.0% |
| Physical & Health Sciences | 0 | 0.0% |
| Psychology | 1 | 0.7% |
| Social Sciences | 5 | 3.4% |
| Engineering | 5 | 3.4% |
| Multidisciplinary Studies | 0 | 0.0% |
| Science & Technology | 17 | 11.5% |
| Business | 51 | 34.5% |
| Education | 18 | 12.2% |
| Literature & Languages | 9 | 6.1% |
| Liberal Arts & History | 12 | 8.1% |
| Visual & Performing Arts | 0 | 0.0% |
| Communications | 13 | 8.8% |
| Arts & Humanities | 17 | 11.5% |
| Total | 148 | 100.0% |
Transportation & Commute in Adamsville
Vehicle Availability by Sex in Adamsville
The most prevalent vehicle ownership categories in Adamsville are males with 2 vehicles (172, accounting for 38.5%) and females with 2 vehicles (134, making up 48.0%).
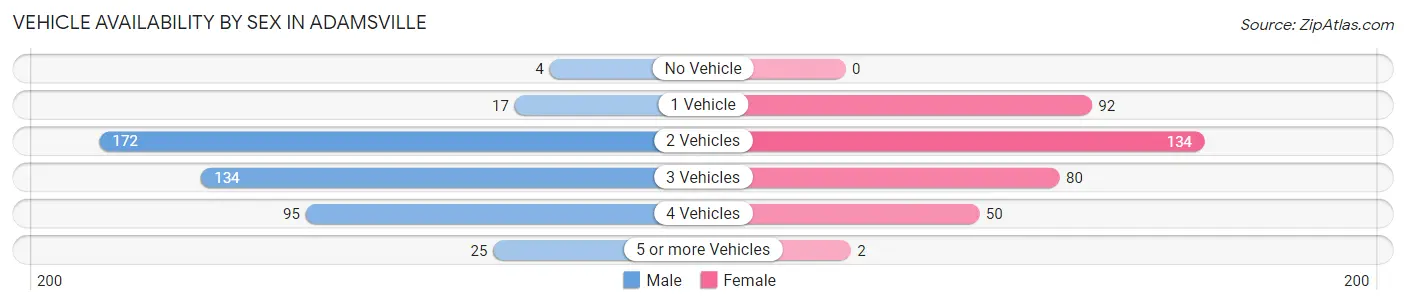
| Vehicles Available | Male | Female |
| No Vehicle | 4 (0.9%) | 0 (0.0%) |
| 1 Vehicle | 17 (3.8%) | 92 (25.7%) |
| 2 Vehicles | 172 (38.5%) | 134 (37.4%) |
| 3 Vehicles | 134 (30.0%) | 80 (22.4%) |
| 4 Vehicles | 95 (21.2%) | 50 (14.0%) |
| 5 or more Vehicles | 25 (5.6%) | 2 (0.6%) |
| Total | 447 (100.0%) | 358 (100.0%) |
Commute Time in Adamsville
The most frequently occuring commute durations in Adamsville are 20 to 24 minutes (134 commuters, 17.3%), 10 to 14 minutes (112 commuters, 14.4%), and 5 to 9 minutes (110 commuters, 14.2%).
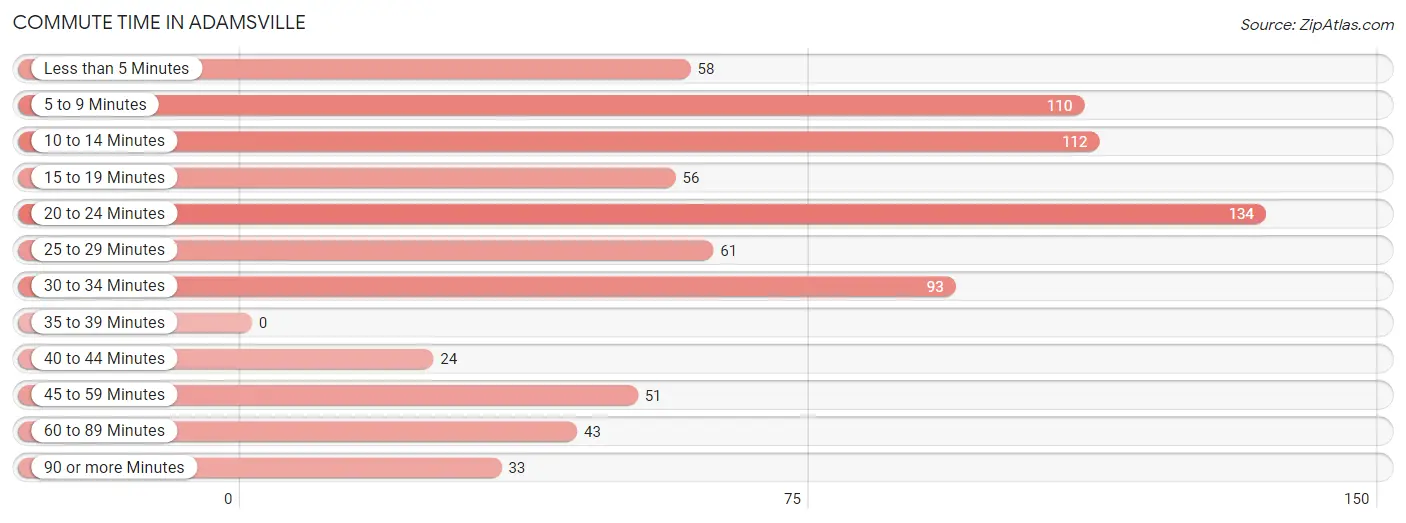
| Commute Time | # Commuters | % Commuters |
| Less than 5 Minutes | 58 | 7.5% |
| 5 to 9 Minutes | 110 | 14.2% |
| 10 to 14 Minutes | 112 | 14.4% |
| 15 to 19 Minutes | 56 | 7.2% |
| 20 to 24 Minutes | 134 | 17.3% |
| 25 to 29 Minutes | 61 | 7.9% |
| 30 to 34 Minutes | 93 | 12.0% |
| 35 to 39 Minutes | 0 | 0.0% |
| 40 to 44 Minutes | 24 | 3.1% |
| 45 to 59 Minutes | 51 | 6.6% |
| 60 to 89 Minutes | 43 | 5.6% |
| 90 or more Minutes | 33 | 4.3% |
Commute Time by Sex in Adamsville
The most common commute times in Adamsville are 10 to 14 minutes (112 commuters, 26.1%) for males and 20 to 24 minutes (99 commuters, 28.7%) for females.
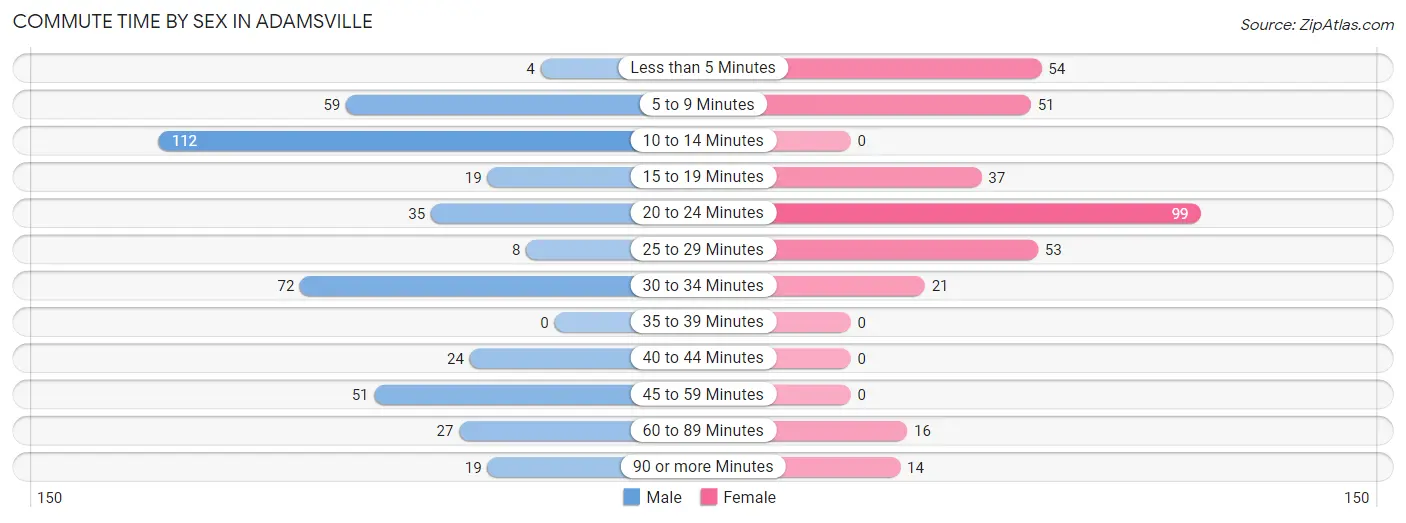
| Commute Time | Male | Female |
| Less than 5 Minutes | 4 (0.9%) | 54 (15.7%) |
| 5 to 9 Minutes | 59 (13.7%) | 51 (14.8%) |
| 10 to 14 Minutes | 112 (26.1%) | 0 (0.0%) |
| 15 to 19 Minutes | 19 (4.4%) | 37 (10.7%) |
| 20 to 24 Minutes | 35 (8.1%) | 99 (28.7%) |
| 25 to 29 Minutes | 8 (1.9%) | 53 (15.4%) |
| 30 to 34 Minutes | 72 (16.7%) | 21 (6.1%) |
| 35 to 39 Minutes | 0 (0.0%) | 0 (0.0%) |
| 40 to 44 Minutes | 24 (5.6%) | 0 (0.0%) |
| 45 to 59 Minutes | 51 (11.9%) | 0 (0.0%) |
| 60 to 89 Minutes | 27 (6.3%) | 16 (4.6%) |
| 90 or more Minutes | 19 (4.4%) | 14 (4.1%) |
Time of Departure to Work by Sex in Adamsville
The most frequent times of departure to work in Adamsville are 6:30 AM to 6:59 AM (83, 19.3%) for males and 7:30 AM to 7:59 AM (85, 24.6%) for females.
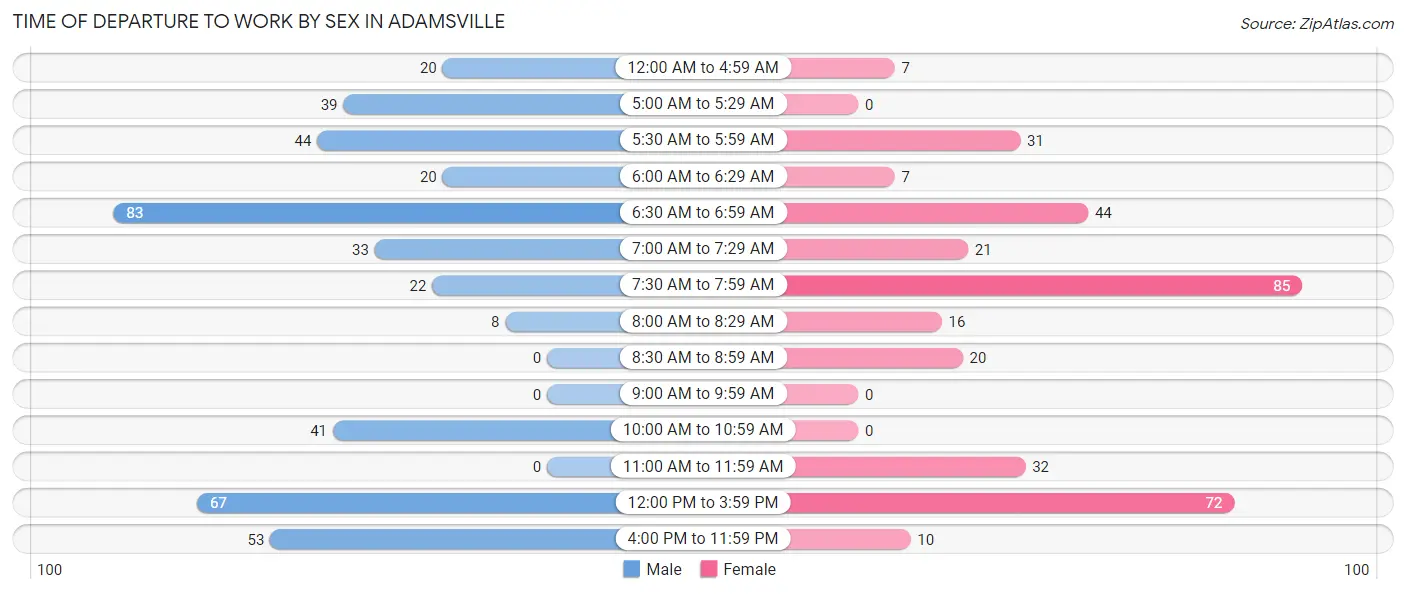
| Time of Departure | Male | Female |
| 12:00 AM to 4:59 AM | 20 (4.6%) | 7 (2.0%) |
| 5:00 AM to 5:29 AM | 39 (9.1%) | 0 (0.0%) |
| 5:30 AM to 5:59 AM | 44 (10.2%) | 31 (9.0%) |
| 6:00 AM to 6:29 AM | 20 (4.6%) | 7 (2.0%) |
| 6:30 AM to 6:59 AM | 83 (19.3%) | 44 (12.8%) |
| 7:00 AM to 7:29 AM | 33 (7.7%) | 21 (6.1%) |
| 7:30 AM to 7:59 AM | 22 (5.1%) | 85 (24.6%) |
| 8:00 AM to 8:29 AM | 8 (1.9%) | 16 (4.6%) |
| 8:30 AM to 8:59 AM | 0 (0.0%) | 20 (5.8%) |
| 9:00 AM to 9:59 AM | 0 (0.0%) | 0 (0.0%) |
| 10:00 AM to 10:59 AM | 41 (9.5%) | 0 (0.0%) |
| 11:00 AM to 11:59 AM | 0 (0.0%) | 32 (9.3%) |
| 12:00 PM to 3:59 PM | 67 (15.6%) | 72 (20.9%) |
| 4:00 PM to 11:59 PM | 53 (12.3%) | 10 (2.9%) |
| Total | 430 (100.0%) | 345 (100.0%) |
Housing Occupancy in Adamsville
Occupancy by Ownership in Adamsville
Of the total 788 dwellings in Adamsville, owner-occupied units account for 510 (64.7%), while renter-occupied units make up 278 (35.3%).
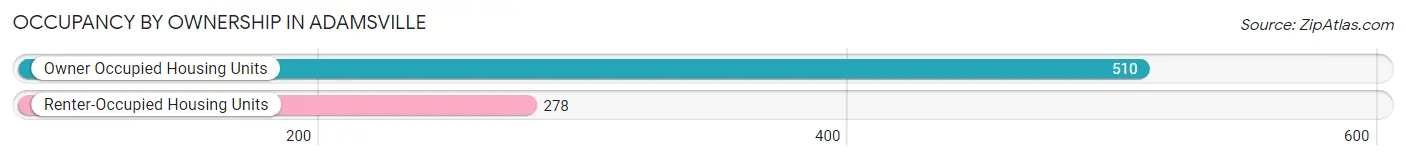
| Occupancy | # Housing Units | % Housing Units |
| Owner Occupied Housing Units | 510 | 64.7% |
| Renter-Occupied Housing Units | 278 | 35.3% |
| Total Occupied Housing Units | 788 | 100.0% |
Occupancy by Household Size in Adamsville
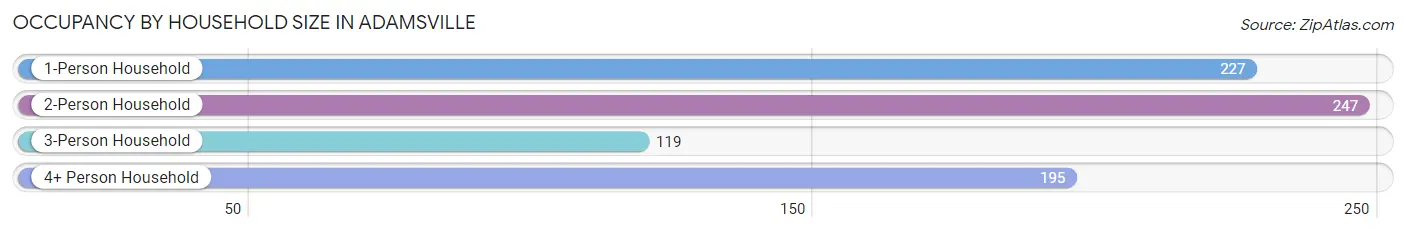
| Household Size | # Housing Units | % Housing Units |
| 1-Person Household | 227 | 28.8% |
| 2-Person Household | 247 | 31.4% |
| 3-Person Household | 119 | 15.1% |
| 4+ Person Household | 195 | 24.7% |
| Total Housing Units | 788 | 100.0% |
Occupancy by Ownership by Household Size in Adamsville
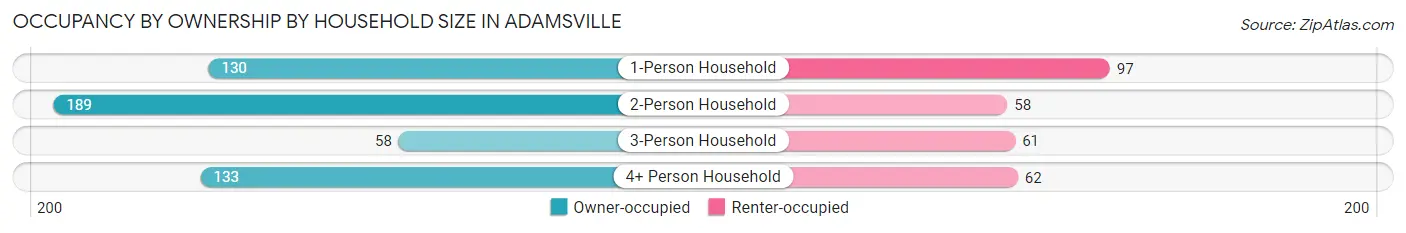
| Household Size | Owner-occupied | Renter-occupied |
| 1-Person Household | 130 (57.3%) | 97 (42.7%) |
| 2-Person Household | 189 (76.5%) | 58 (23.5%) |
| 3-Person Household | 58 (48.7%) | 61 (51.3%) |
| 4+ Person Household | 133 (68.2%) | 62 (31.8%) |
| Total Housing Units | 510 (64.7%) | 278 (35.3%) |
Occupancy by Educational Attainment in Adamsville
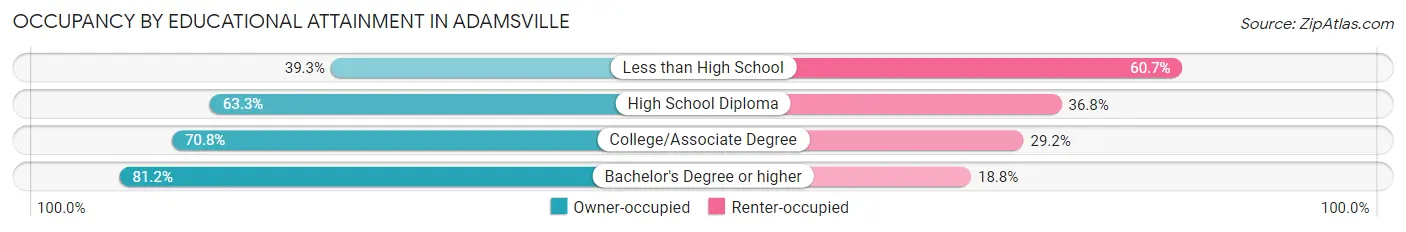
| Household Size | Owner-occupied | Renter-occupied |
| Less than High School | 33 (39.3%) | 51 (60.7%) |
| High School Diploma | 253 (63.2%) | 147 (36.7%) |
| College/Associate Degree | 155 (70.8%) | 64 (29.2%) |
| Bachelor's Degree or higher | 69 (81.2%) | 16 (18.8%) |
Occupancy by Age of Householder in Adamsville
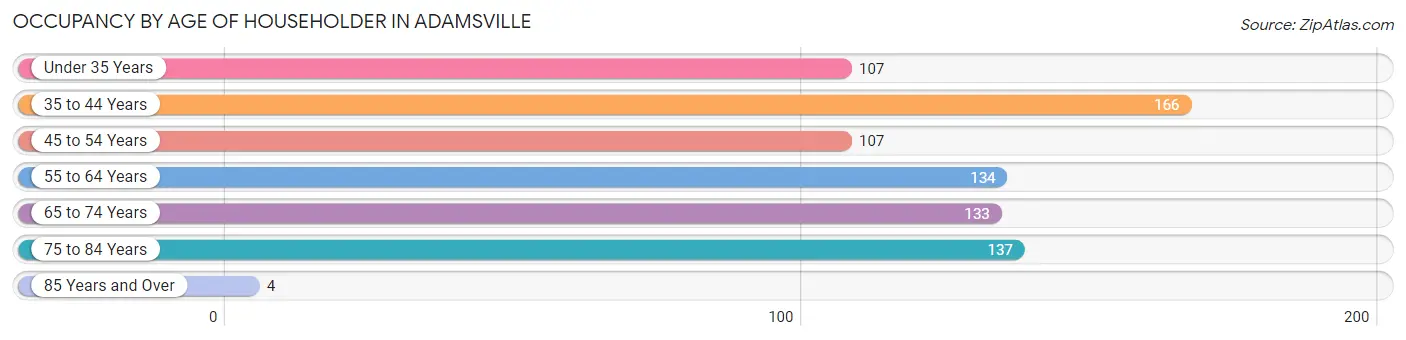
| Age Bracket | # Households | % Households |
| Under 35 Years | 107 | 13.6% |
| 35 to 44 Years | 166 | 21.1% |
| 45 to 54 Years | 107 | 13.6% |
| 55 to 64 Years | 134 | 17.0% |
| 65 to 74 Years | 133 | 16.9% |
| 75 to 84 Years | 137 | 17.4% |
| 85 Years and Over | 4 | 0.5% |
| Total | 788 | 100.0% |
Housing Finances in Adamsville
Median Income by Occupancy in Adamsville
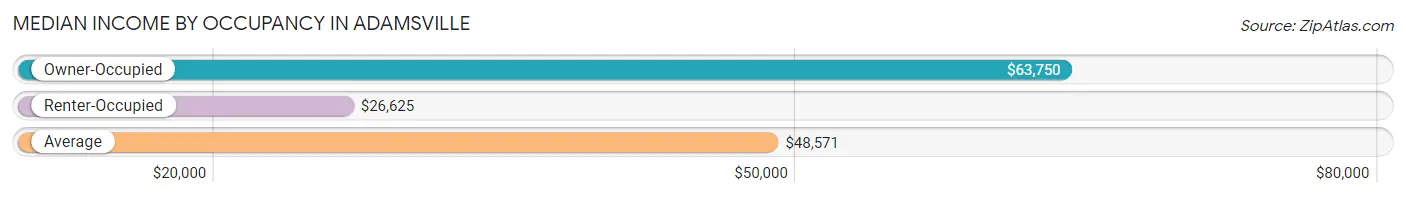
| Occupancy Type | # Households | Median Income |
| Owner-Occupied | 510 (64.7%) | $63,750 |
| Renter-Occupied | 278 (35.3%) | $26,625 |
| Average | 788 (100.0%) | $48,571 |
Occupancy by Householder Income Bracket in Adamsville
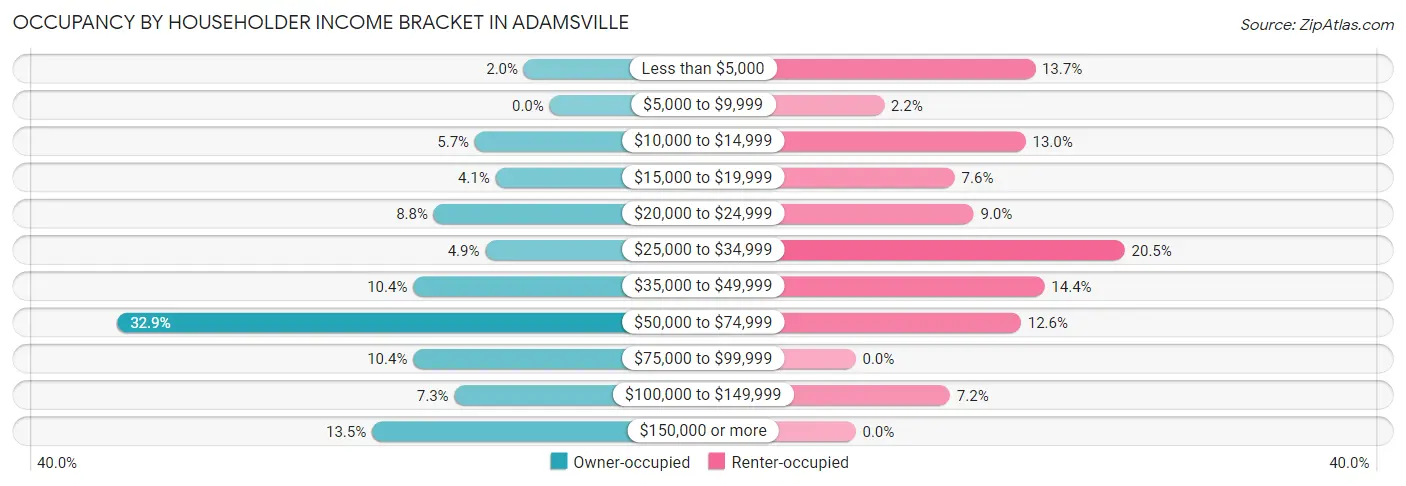
| Income Bracket | Owner-occupied | Renter-occupied |
| Less than $5,000 | 10 (2.0%) | 38 (13.7%) |
| $5,000 to $9,999 | 0 (0.0%) | 6 (2.2%) |
| $10,000 to $14,999 | 29 (5.7%) | 36 (13.0%) |
| $15,000 to $19,999 | 21 (4.1%) | 21 (7.5%) |
| $20,000 to $24,999 | 45 (8.8%) | 25 (9.0%) |
| $25,000 to $34,999 | 25 (4.9%) | 57 (20.5%) |
| $35,000 to $49,999 | 53 (10.4%) | 40 (14.4%) |
| $50,000 to $74,999 | 168 (32.9%) | 35 (12.6%) |
| $75,000 to $99,999 | 53 (10.4%) | 0 (0.0%) |
| $100,000 to $149,999 | 37 (7.2%) | 20 (7.2%) |
| $150,000 or more | 69 (13.5%) | 0 (0.0%) |
| Total | 510 (100.0%) | 278 (100.0%) |
Monthly Housing Cost Tiers in Adamsville
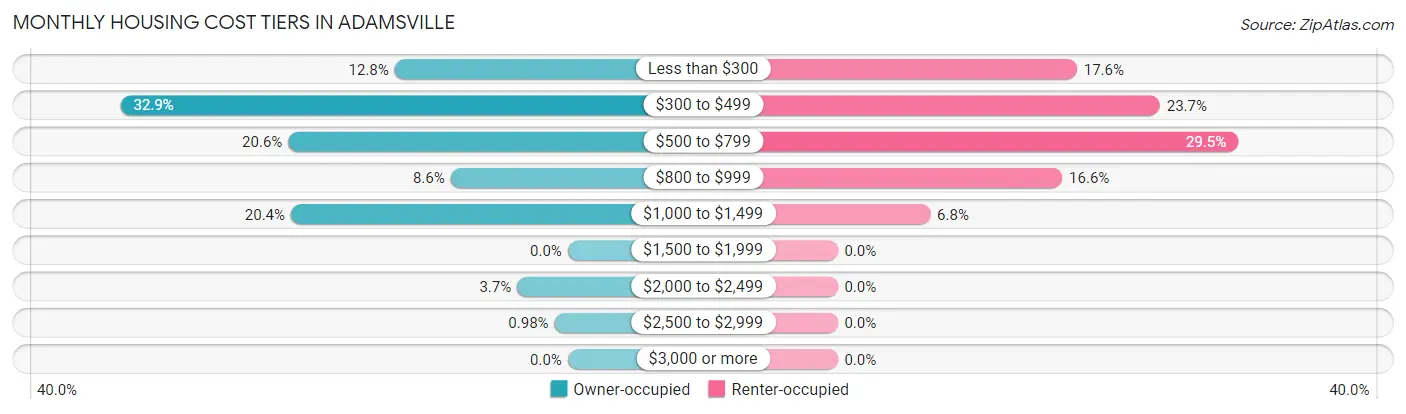
| Monthly Cost | Owner-occupied | Renter-occupied |
| Less than $300 | 65 (12.8%) | 49 (17.6%) |
| $300 to $499 | 168 (32.9%) | 66 (23.7%) |
| $500 to $799 | 105 (20.6%) | 82 (29.5%) |
| $800 to $999 | 44 (8.6%) | 46 (16.6%) |
| $1,000 to $1,499 | 104 (20.4%) | 19 (6.8%) |
| $1,500 to $1,999 | 0 (0.0%) | 0 (0.0%) |
| $2,000 to $2,499 | 19 (3.7%) | 0 (0.0%) |
| $2,500 to $2,999 | 5 (1.0%) | 0 (0.0%) |
| $3,000 or more | 0 (0.0%) | 0 (0.0%) |
| Total | 510 (100.0%) | 278 (100.0%) |
Physical Housing Characteristics in Adamsville
Housing Structures in Adamsville
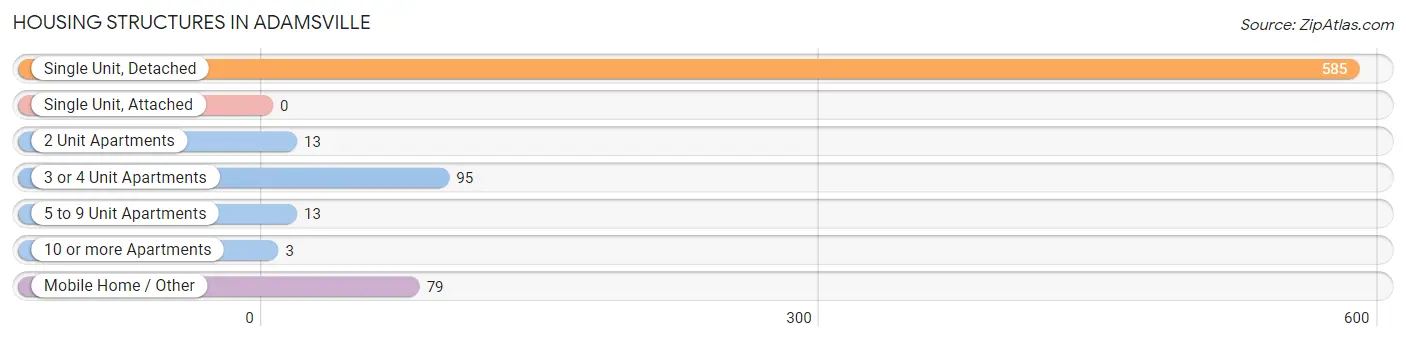
| Structure Type | # Housing Units | % Housing Units |
| Single Unit, Detached | 585 | 74.2% |
| Single Unit, Attached | 0 | 0.0% |
| 2 Unit Apartments | 13 | 1.7% |
| 3 or 4 Unit Apartments | 95 | 12.1% |
| 5 to 9 Unit Apartments | 13 | 1.7% |
| 10 or more Apartments | 3 | 0.4% |
| Mobile Home / Other | 79 | 10.0% |
| Total | 788 | 100.0% |
Housing Structures by Occupancy in Adamsville
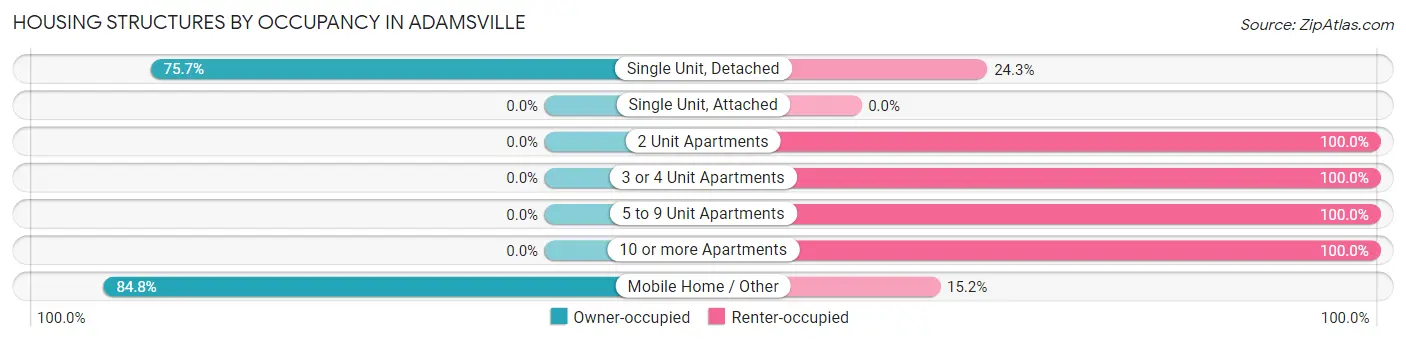
| Structure Type | Owner-occupied | Renter-occupied |
| Single Unit, Detached | 443 (75.7%) | 142 (24.3%) |
| Single Unit, Attached | 0 (0.0%) | 0 (0.0%) |
| 2 Unit Apartments | 0 (0.0%) | 13 (100.0%) |
| 3 or 4 Unit Apartments | 0 (0.0%) | 95 (100.0%) |
| 5 to 9 Unit Apartments | 0 (0.0%) | 13 (100.0%) |
| 10 or more Apartments | 0 (0.0%) | 3 (100.0%) |
| Mobile Home / Other | 67 (84.8%) | 12 (15.2%) |
| Total | 510 (64.7%) | 278 (35.3%) |
Housing Structures by Number of Rooms in Adamsville
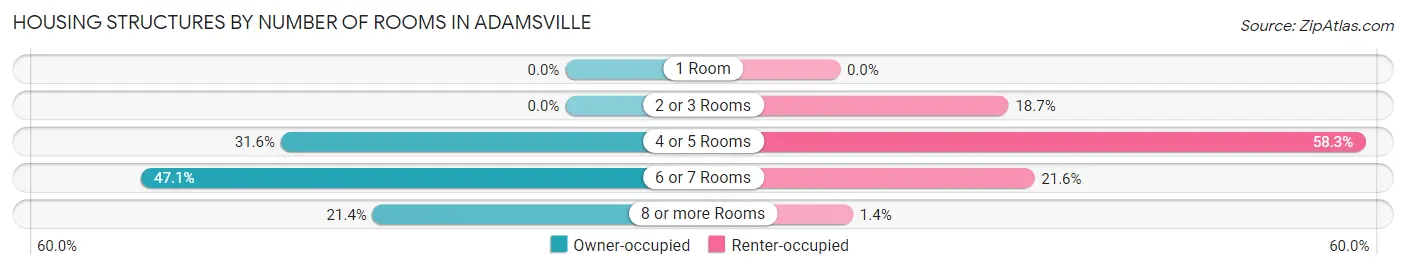
| Number of Rooms | Owner-occupied | Renter-occupied |
| 1 Room | 0 (0.0%) | 0 (0.0%) |
| 2 or 3 Rooms | 0 (0.0%) | 52 (18.7%) |
| 4 or 5 Rooms | 161 (31.6%) | 162 (58.3%) |
| 6 or 7 Rooms | 240 (47.1%) | 60 (21.6%) |
| 8 or more Rooms | 109 (21.4%) | 4 (1.4%) |
| Total | 510 (100.0%) | 278 (100.0%) |
Housing Structure by Heating Type in Adamsville
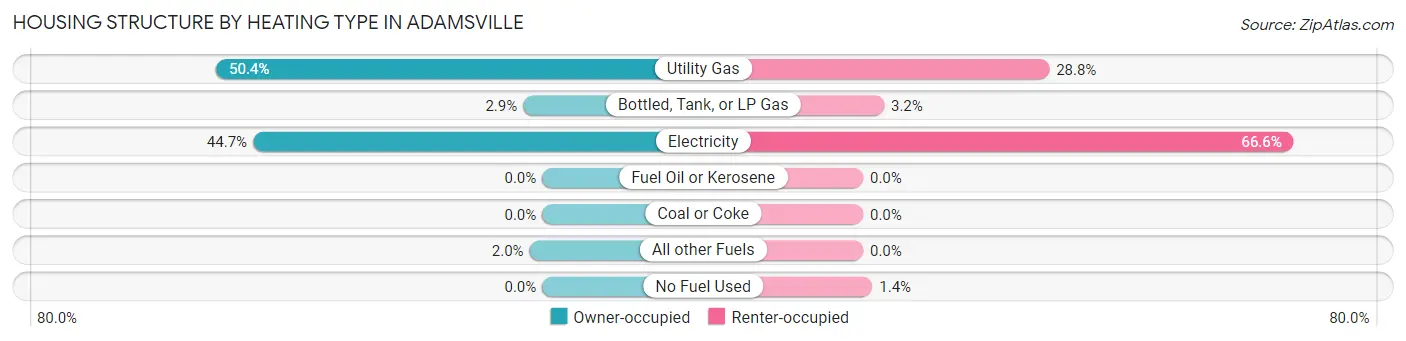
| Heating Type | Owner-occupied | Renter-occupied |
| Utility Gas | 257 (50.4%) | 80 (28.8%) |
| Bottled, Tank, or LP Gas | 15 (2.9%) | 9 (3.2%) |
| Electricity | 228 (44.7%) | 185 (66.5%) |
| Fuel Oil or Kerosene | 0 (0.0%) | 0 (0.0%) |
| Coal or Coke | 0 (0.0%) | 0 (0.0%) |
| All other Fuels | 10 (2.0%) | 0 (0.0%) |
| No Fuel Used | 0 (0.0%) | 4 (1.4%) |
| Total | 510 (100.0%) | 278 (100.0%) |
Household Vehicle Usage in Adamsville
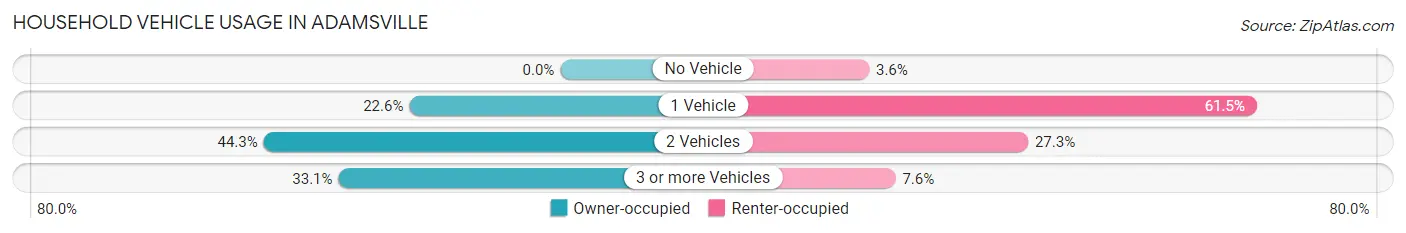
| Vehicles per Household | Owner-occupied | Renter-occupied |
| No Vehicle | 0 (0.0%) | 10 (3.6%) |
| 1 Vehicle | 115 (22.6%) | 171 (61.5%) |
| 2 Vehicles | 226 (44.3%) | 76 (27.3%) |
| 3 or more Vehicles | 169 (33.1%) | 21 (7.5%) |
| Total | 510 (100.0%) | 278 (100.0%) |
Real Estate & Mortgages in Adamsville
Real Estate and Mortgage Overview in Adamsville
| Characteristic | Without Mortgage | With Mortgage |
| Housing Units | 296 | 214 |
| Median Property Value | $105,800 | $127,000 |
| Median Household Income | $64,569 | $25 |
| Monthly Housing Costs | $376 | $0 |
| Real Estate Taxes | $651 | $12 |
Property Value by Mortgage Status in Adamsville
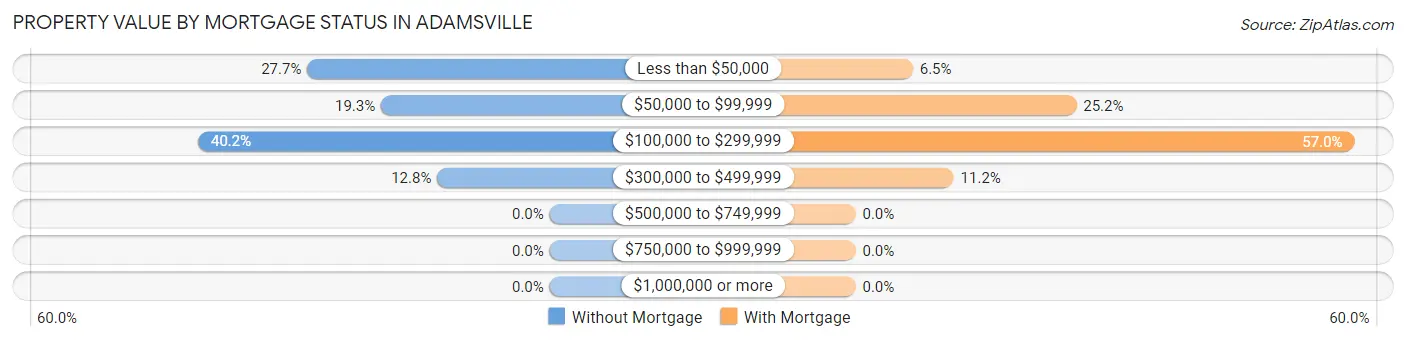
| Property Value | Without Mortgage | With Mortgage |
| Less than $50,000 | 82 (27.7%) | 14 (6.5%) |
| $50,000 to $99,999 | 57 (19.3%) | 54 (25.2%) |
| $100,000 to $299,999 | 119 (40.2%) | 122 (57.0%) |
| $300,000 to $499,999 | 38 (12.8%) | 24 (11.2%) |
| $500,000 to $749,999 | 0 (0.0%) | 0 (0.0%) |
| $750,000 to $999,999 | 0 (0.0%) | 0 (0.0%) |
| $1,000,000 or more | 0 (0.0%) | 0 (0.0%) |
| Total | 296 (100.0%) | 214 (100.0%) |
Household Income by Mortgage Status in Adamsville
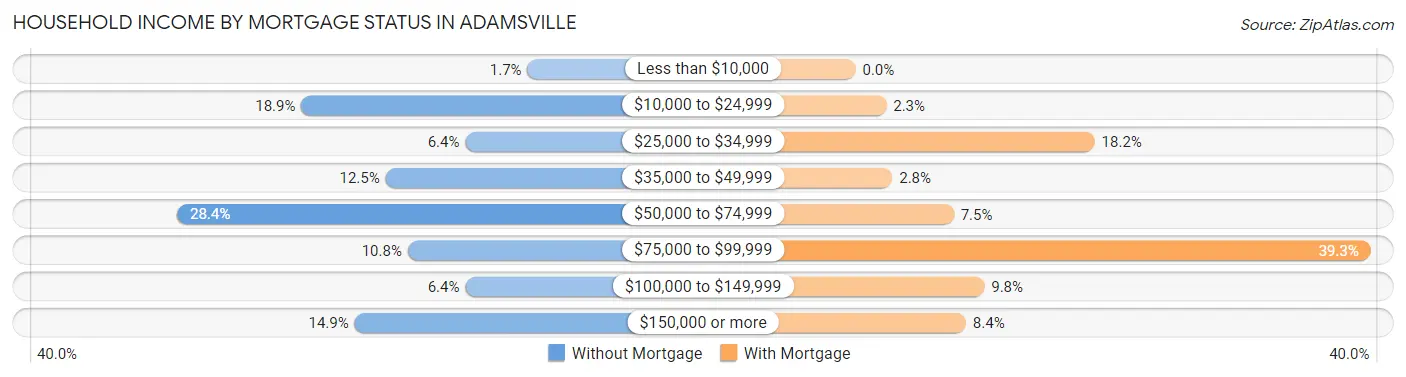
| Household Income | Without Mortgage | With Mortgage |
| Less than $10,000 | 5 (1.7%) | 0 (0.0%) |
| $10,000 to $24,999 | 56 (18.9%) | 5 (2.3%) |
| $25,000 to $34,999 | 19 (6.4%) | 39 (18.2%) |
| $35,000 to $49,999 | 37 (12.5%) | 6 (2.8%) |
| $50,000 to $74,999 | 84 (28.4%) | 16 (7.5%) |
| $75,000 to $99,999 | 32 (10.8%) | 84 (39.3%) |
| $100,000 to $149,999 | 19 (6.4%) | 21 (9.8%) |
| $150,000 or more | 44 (14.9%) | 18 (8.4%) |
| Total | 296 (100.0%) | 214 (100.0%) |
Property Value to Household Income Ratio in Adamsville
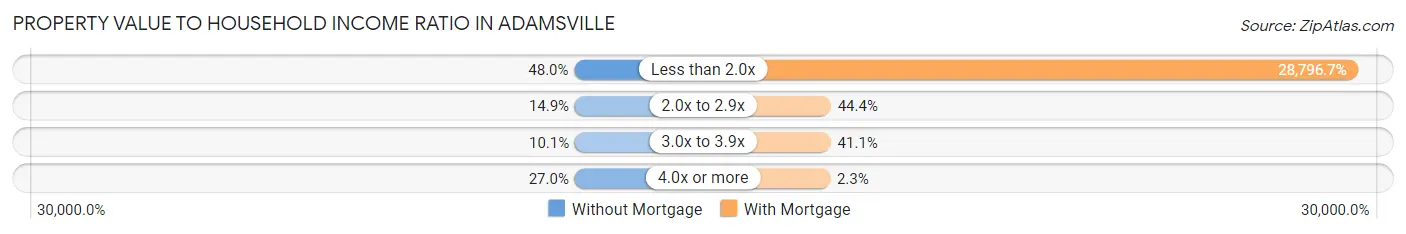
| Value-to-Income Ratio | Without Mortgage | With Mortgage |
| Less than 2.0x | 142 (48.0%) | 61,625 (28,796.7%) |
| 2.0x to 2.9x | 44 (14.9%) | 95 (44.4%) |
| 3.0x to 3.9x | 30 (10.1%) | 88 (41.1%) |
| 4.0x or more | 80 (27.0%) | 5 (2.3%) |
| Total | 296 (100.0%) | 214 (100.0%) |
Real Estate Taxes by Mortgage Status in Adamsville
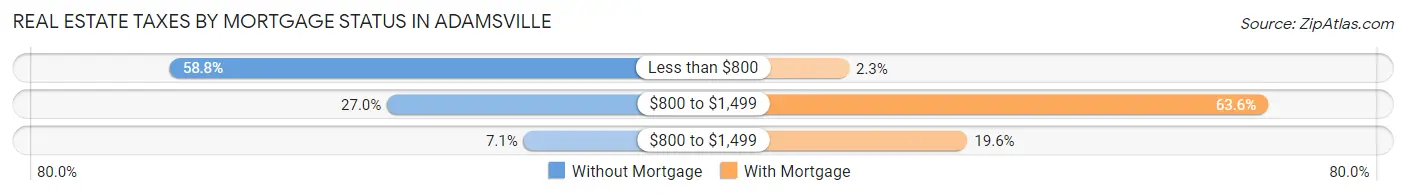
| Property Taxes | Without Mortgage | With Mortgage |
| Less than $800 | 174 (58.8%) | 5 (2.3%) |
| $800 to $1,499 | 80 (27.0%) | 136 (63.5%) |
| $800 to $1,499 | 21 (7.1%) | 42 (19.6%) |
| Total | 296 (100.0%) | 214 (100.0%) |
Health & Disability in Adamsville
Health Insurance Coverage by Age in Adamsville
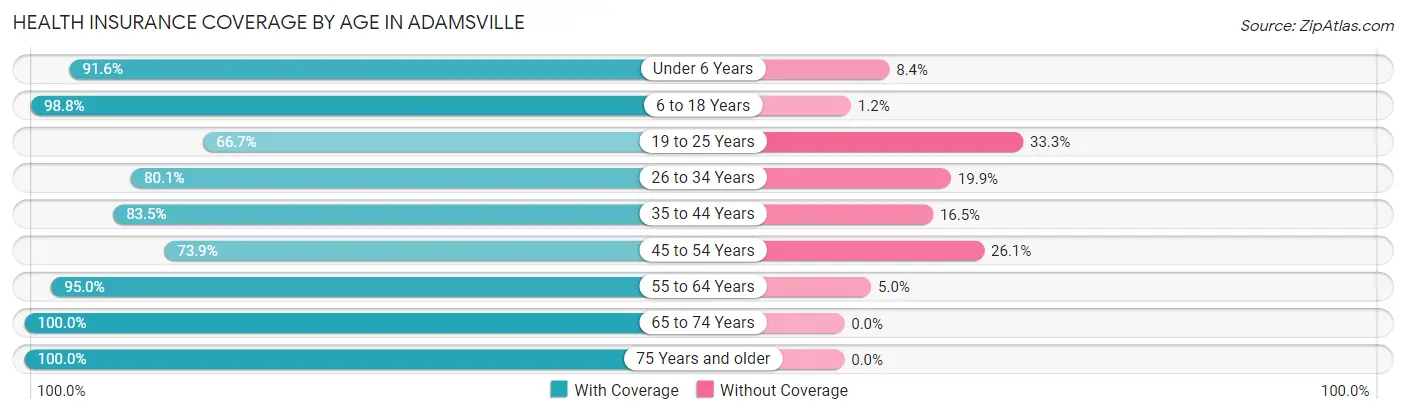
| Age Bracket | With Coverage | Without Coverage |
| Under 6 Years | 131 (91.6%) | 12 (8.4%) |
| 6 to 18 Years | 562 (98.8%) | 7 (1.2%) |
| 19 to 25 Years | 202 (66.7%) | 101 (33.3%) |
| 26 to 34 Years | 129 (80.1%) | 32 (19.9%) |
| 35 to 44 Years | 197 (83.5%) | 39 (16.5%) |
| 45 to 54 Years | 156 (73.9%) | 55 (26.1%) |
| 55 to 64 Years | 209 (95.0%) | 11 (5.0%) |
| 65 to 74 Years | 207 (100.0%) | 0 (0.0%) |
| 75 Years and older | 177 (100.0%) | 0 (0.0%) |
| Total | 1,970 (88.5%) | 257 (11.5%) |
Health Insurance Coverage by Citizenship Status in Adamsville
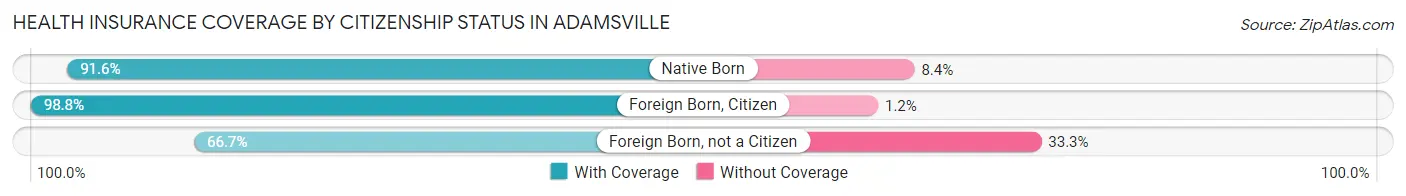
| Citizenship Status | With Coverage | Without Coverage |
| Native Born | 131 (91.6%) | 12 (8.4%) |
| Foreign Born, Citizen | 562 (98.8%) | 7 (1.2%) |
| Foreign Born, not a Citizen | 202 (66.7%) | 101 (33.3%) |
Health Insurance Coverage by Household Income in Adamsville
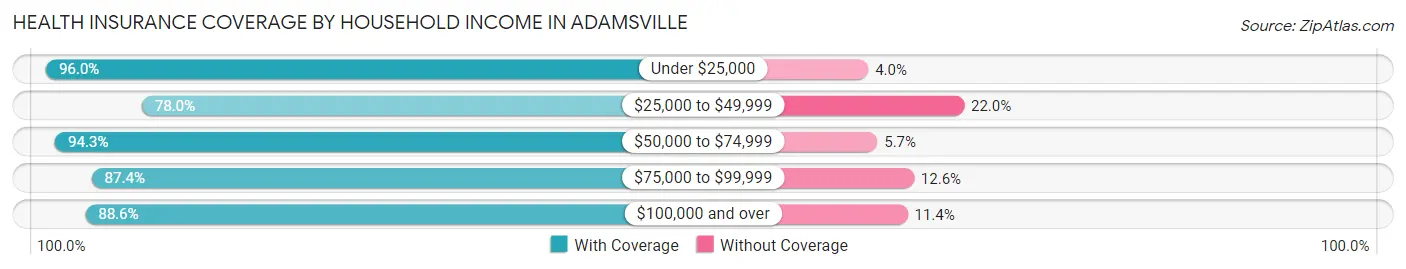
| Household Income | With Coverage | Without Coverage |
| Under $25,000 | 407 (96.0%) | 17 (4.0%) |
| $25,000 to $49,999 | 455 (78.0%) | 128 (22.0%) |
| $50,000 to $74,999 | 479 (94.3%) | 29 (5.7%) |
| $75,000 to $99,999 | 146 (87.4%) | 21 (12.6%) |
| $100,000 and over | 483 (88.6%) | 62 (11.4%) |
Public vs Private Health Insurance Coverage by Age in Adamsville
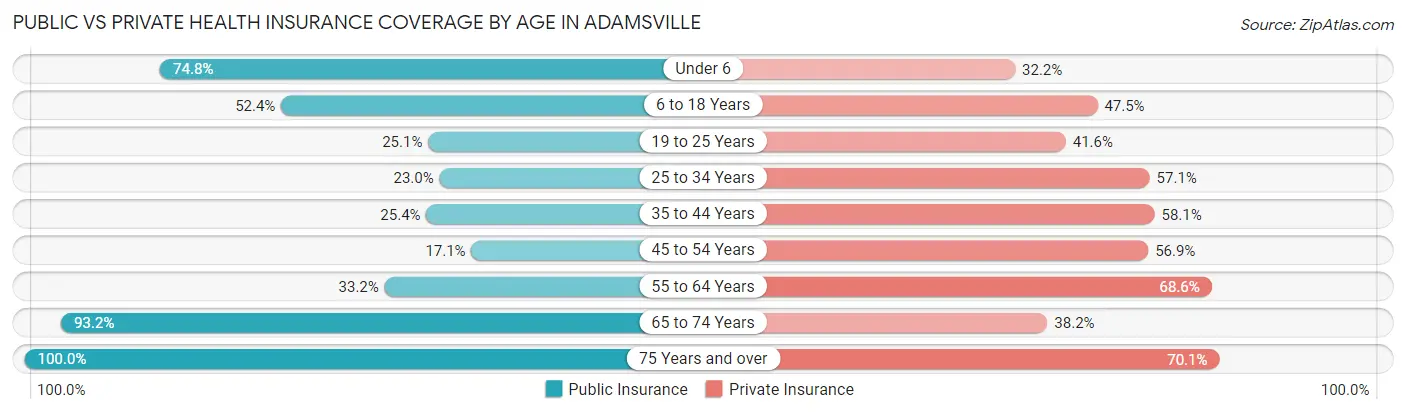
| Age Bracket | Public Insurance | Private Insurance |
| Under 6 | 107 (74.8%) | 46 (32.2%) |
| 6 to 18 Years | 298 (52.4%) | 270 (47.4%) |
| 19 to 25 Years | 76 (25.1%) | 126 (41.6%) |
| 25 to 34 Years | 37 (23.0%) | 92 (57.1%) |
| 35 to 44 Years | 60 (25.4%) | 137 (58.1%) |
| 45 to 54 Years | 36 (17.1%) | 120 (56.9%) |
| 55 to 64 Years | 73 (33.2%) | 151 (68.6%) |
| 65 to 74 Years | 193 (93.2%) | 79 (38.2%) |
| 75 Years and over | 177 (100.0%) | 124 (70.1%) |
| Total | 1,057 (47.5%) | 1,145 (51.4%) |
Disability Status by Sex by Age in Adamsville
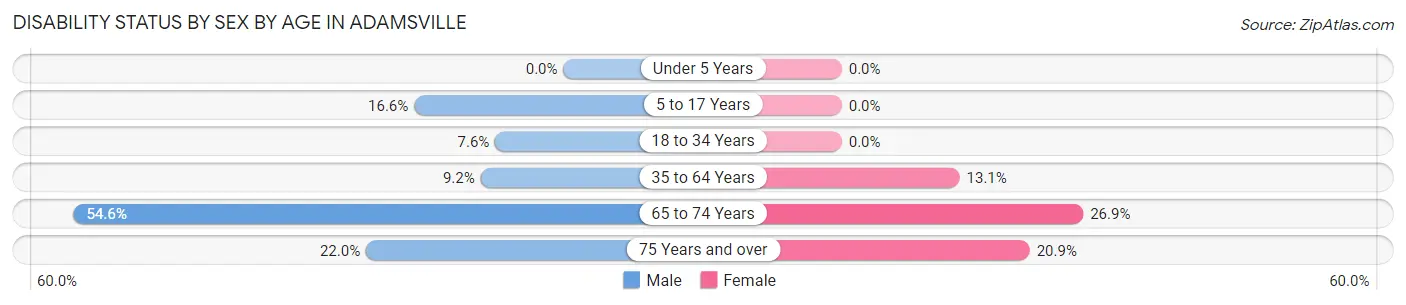
| Age Bracket | Male | Female |
| Under 5 Years | 0 (0.0%) | 0 (0.0%) |
| 5 to 17 Years | 55 (16.6%) | 0 (0.0%) |
| 18 to 34 Years | 18 (7.6%) | 0 (0.0%) |
| 35 to 64 Years | 32 (9.2%) | 42 (13.1%) |
| 65 to 74 Years | 48 (54.5%) | 32 (26.9%) |
| 75 Years and over | 20 (22.0%) | 18 (20.9%) |
Disability Class by Sex by Age in Adamsville
Disability Class: Hearing Difficulty
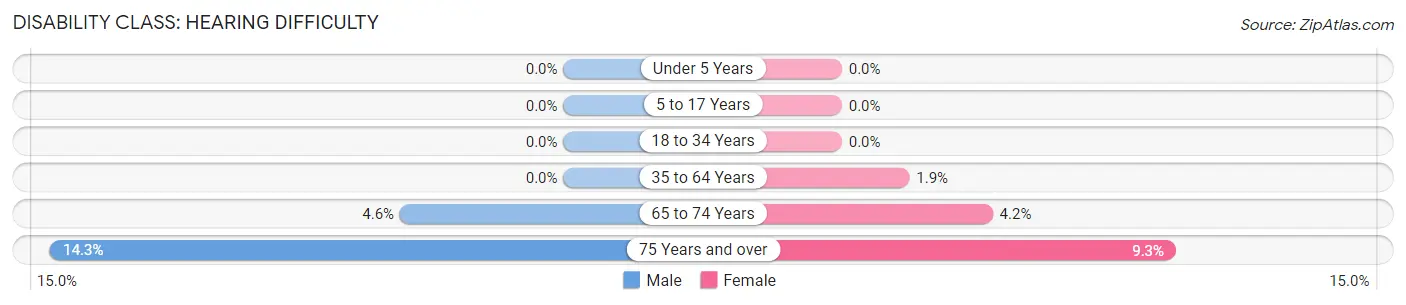
| Age Bracket | Male | Female |
| Under 5 Years | 0 (0.0%) | 0 (0.0%) |
| 5 to 17 Years | 0 (0.0%) | 0 (0.0%) |
| 18 to 34 Years | 0 (0.0%) | 0 (0.0%) |
| 35 to 64 Years | 0 (0.0%) | 6 (1.9%) |
| 65 to 74 Years | 4 (4.5%) | 5 (4.2%) |
| 75 Years and over | 13 (14.3%) | 8 (9.3%) |
Disability Class: Vision Difficulty
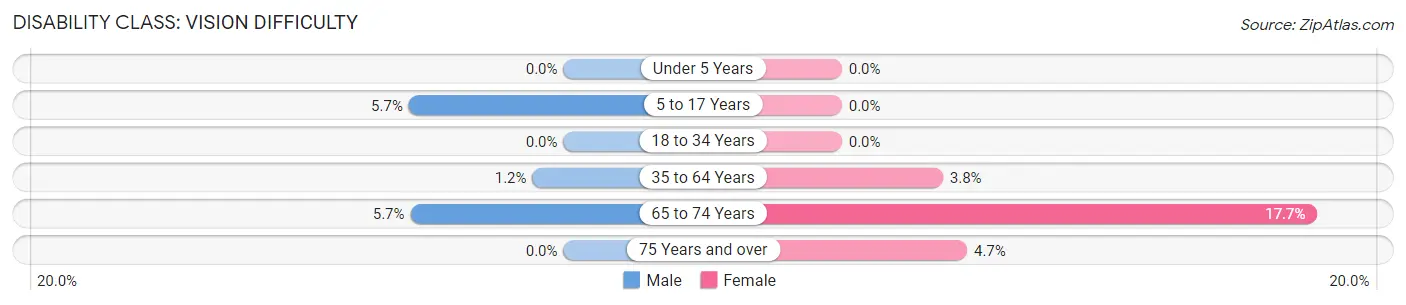
| Age Bracket | Male | Female |
| Under 5 Years | 0 (0.0%) | 0 (0.0%) |
| 5 to 17 Years | 19 (5.7%) | 0 (0.0%) |
| 18 to 34 Years | 0 (0.0%) | 0 (0.0%) |
| 35 to 64 Years | 4 (1.1%) | 12 (3.7%) |
| 65 to 74 Years | 5 (5.7%) | 21 (17.6%) |
| 75 Years and over | 0 (0.0%) | 4 (4.6%) |
Disability Class: Cognitive Difficulty
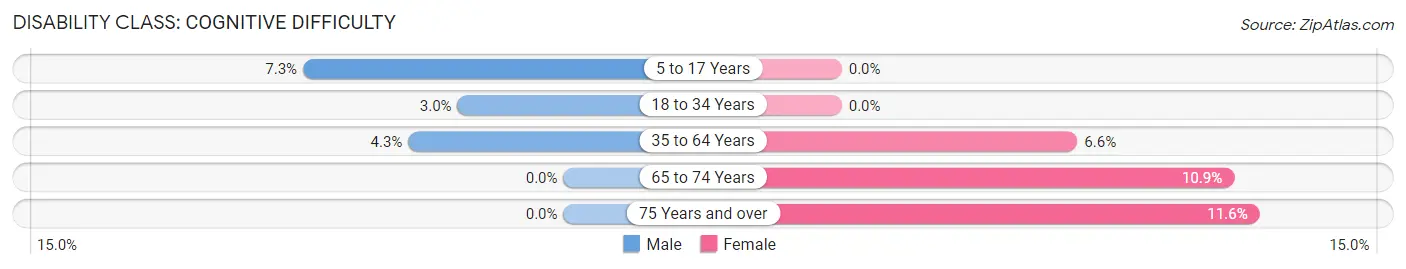
| Age Bracket | Male | Female |
| 5 to 17 Years | 24 (7.2%) | 0 (0.0%) |
| 18 to 34 Years | 7 (2.9%) | 0 (0.0%) |
| 35 to 64 Years | 15 (4.3%) | 21 (6.6%) |
| 65 to 74 Years | 0 (0.0%) | 13 (10.9%) |
| 75 Years and over | 0 (0.0%) | 10 (11.6%) |
Disability Class: Ambulatory Difficulty
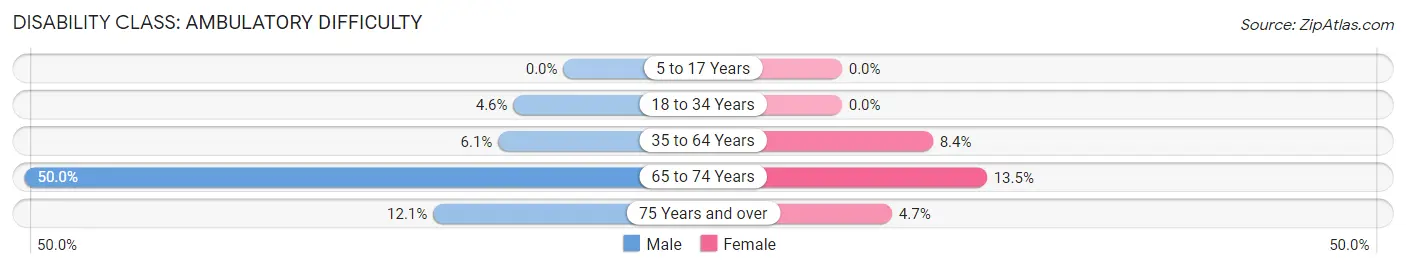
| Age Bracket | Male | Female |
| 5 to 17 Years | 0 (0.0%) | 0 (0.0%) |
| 18 to 34 Years | 11 (4.6%) | 0 (0.0%) |
| 35 to 64 Years | 21 (6.0%) | 27 (8.4%) |
| 65 to 74 Years | 44 (50.0%) | 16 (13.5%) |
| 75 Years and over | 11 (12.1%) | 4 (4.6%) |
Disability Class: Self-Care Difficulty
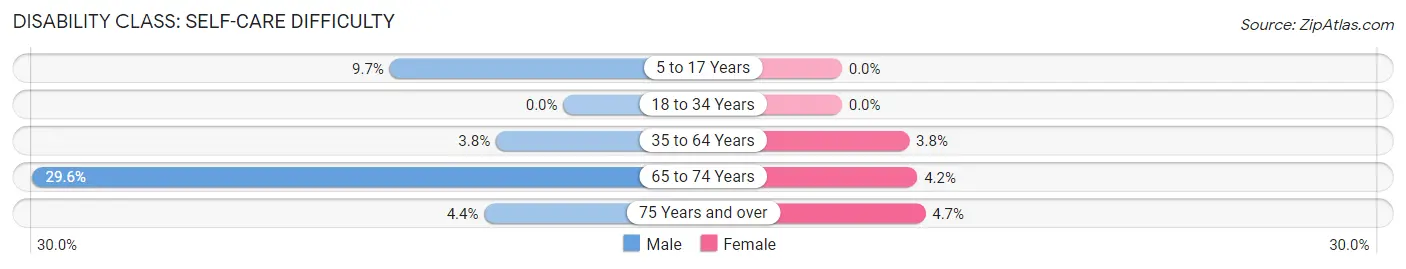
| Age Bracket | Male | Female |
| 5 to 17 Years | 32 (9.7%) | 0 (0.0%) |
| 18 to 34 Years | 0 (0.0%) | 0 (0.0%) |
| 35 to 64 Years | 13 (3.7%) | 12 (3.7%) |
| 65 to 74 Years | 26 (29.5%) | 5 (4.2%) |
| 75 Years and over | 4 (4.4%) | 4 (4.6%) |
Technology Access in Adamsville
Computing Device Access in Adamsville
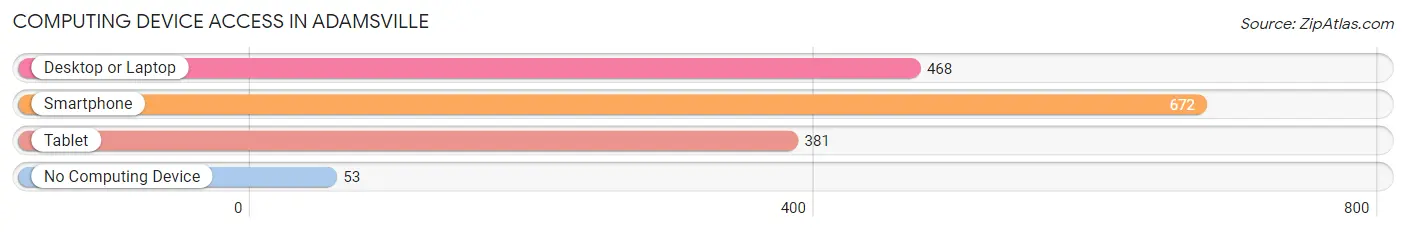
| Device Type | # Households | % Households |
| Desktop or Laptop | 468 | 59.4% |
| Smartphone | 672 | 85.3% |
| Tablet | 381 | 48.3% |
| No Computing Device | 53 | 6.7% |
| Total | 788 | 100.0% |
Internet Access in Adamsville
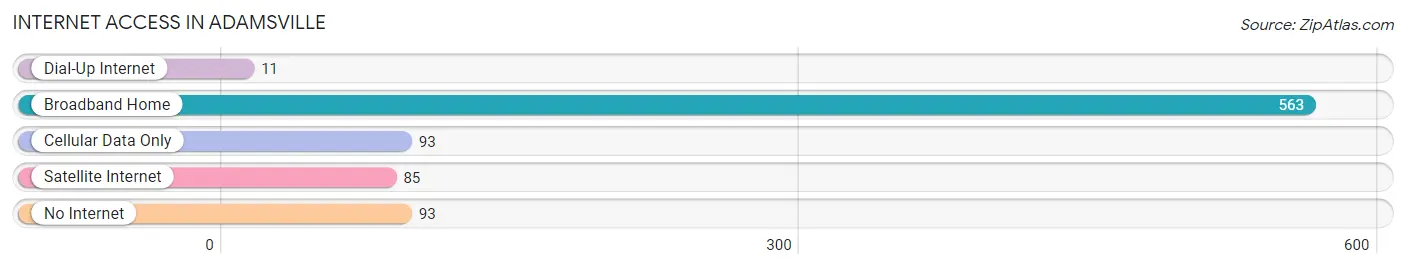
| Internet Type | # Households | % Households |
| Dial-Up Internet | 11 | 1.4% |
| Broadband Home | 563 | 71.5% |
| Cellular Data Only | 93 | 11.8% |
| Satellite Internet | 85 | 10.8% |
| No Internet | 93 | 11.8% |
| Total | 788 | 100.0% |
Adamsville Summary
Adamsville is a small town located in McNairy County, Tennessee. It is situated in the southwestern part of the state, about halfway between Memphis and Nashville. The town was founded in 1820 and has a population of approximately 2,500 people.
History
Adamsville was founded in 1820 by William Adams, a Revolutionary War veteran. Adams had served in the war under General Andrew Jackson and was awarded a land grant for his service. He chose the area that is now Adamsville as the site for his new town. The town was named after him and was incorporated in 1836.
The town grew slowly but steadily over the years, and by the late 19th century, it had become a thriving agricultural center. Cotton was the main crop grown in the area, and the town was home to several cotton gins and other businesses related to the industry.
In the early 20th century, the town began to diversify its economy. The first bank was established in 1910, and the first newspaper was published in 1912. The town also became a center for the timber industry, and several sawmills were built in the area.
Geography
Adamsville is located in the southwestern part of Tennessee, about halfway between Memphis and Nashville. The town is situated in McNairy County, which is part of the Jackson Purchase region of the state. The town is located on the banks of the Hatchie River, which flows through the area.
The town is surrounded by rolling hills and forests, and the area is known for its scenic beauty. The town is located near several state parks, including Natchez Trace State Park and Chickasaw State Park.
Economy
The economy of Adamsville is largely based on agriculture and timber. Cotton is still grown in the area, and the town is home to several cotton gins. The timber industry is also important to the local economy, and several sawmills are located in the area.
The town is also home to several small businesses, including restaurants, retail stores, and service providers. The town is also home to a small manufacturing sector, which produces a variety of products, including furniture and clothing.
Demographics
As of the 2010 census, the population of Adamsville was 2,500. The town is predominantly white, with about 90% of the population being Caucasian. The remaining 10% of the population is made up of African Americans, Hispanics, and other ethnicities.
The median household income in Adamsville is $35,000, and the median home value is $90,000. The town has a low unemployment rate, and the poverty rate is below the national average.
Adamsville is a small town with a rich history and a diverse economy. The town is home to a variety of businesses, and the local economy is largely based on agriculture and timber. The town is also home to a diverse population, and the median household income is slightly below the national average.
Common Questions
What is Per Capita Income in Adamsville?
Per Capita income in Adamsville is $24,411.
What is the Median Family Income in Adamsville?
Median Family Income in Adamsville is $58,242.
What is the Median Household income in Adamsville?
Median Household Income in Adamsville is $48,571.
What is Income or Wage Gap in Adamsville?
Income or Wage Gap in Adamsville is 25.9%.
Women in Adamsville earn 74.1 cents for every dollar earned by a man.
What is Inequality or Gini Index in Adamsville?
Inequality or Gini Index in Adamsville is 0.50.
What is the Total Population of Adamsville?
Total Population of Adamsville is 2,334.
What is the Total Male Population of Adamsville?
Total Male Population of Adamsville is 1,193.
What is the Total Female Population of Adamsville?
Total Female Population of Adamsville is 1,141.
What is the Ratio of Males per 100 Females in Adamsville?
There are 104.56 Males per 100 Females in Adamsville.
What is the Ratio of Females per 100 Males in Adamsville?
There are 95.64 Females per 100 Males in Adamsville.
What is the Median Population Age in Adamsville?
Median Population Age in Adamsville is 34.7 Years.
What is the Average Family Size in Adamsville
Average Family Size in Adamsville is 3.4 People.
What is the Average Household Size in Adamsville
Average Household Size in Adamsville is 2.8 People.
How Large is the Labor Force in Adamsville?
There are 871 People in the Labor Forcein in Adamsville.
What is the Percentage of People in the Labor Force in Adamsville?
50.6% of People are in the Labor Force in Adamsville.
What is the Unemployment Rate in Adamsville?
Unemployment Rate in Adamsville is 6.1%.