Fall Branch, TN Map & Demographics
Fall Branch Map
Fall Branch Overview
$36,705
PER CAPITA INCOME
$47,379
AVG FAMILY INCOME
$41,884
AVG HOUSEHOLD INCOME
14.7%
WAGE / INCOME GAP [ % ]
85.3¢/ $1
WAGE / INCOME GAP [ $ ]
0.51
INEQUALITY / GINI INDEX
984
TOTAL POPULATION
575
MALE POPULATION
409
FEMALE POPULATION
140.59
MALES / 100 FEMALES
71.13
FEMALES / 100 MALES
48.9
MEDIAN AGE
2.7
AVG FAMILY SIZE
2.2
AVG HOUSEHOLD SIZE
344
LABOR FORCE [ PEOPLE ]
39.6%
PERCENT IN LABOR FORCE
Fall Branch Zip Codes
Fall Branch Area Codes
Income in Fall Branch
Income Overview in Fall Branch
Per Capita Income in Fall Branch is $36,705, while median incomes of families and households are $47,379 and $41,884 respectively.
| Characteristic | Number | Measure |
| Per Capita Income | 984 | $36,705 |
| Median Family Income | 223 | $47,379 |
| Mean Family Income | 223 | $65,253 |
| Median Household Income | 443 | $41,884 |
| Mean Household Income | 443 | $77,542 |
| Income Deficit | 223 | $0 |
| Wage / Income Gap (%) | 984 | 14.66% |
| Wage / Income Gap ($) | 984 | 85.34¢ per $1 |
| Gini / Inequality Index | 984 | 0.51 |
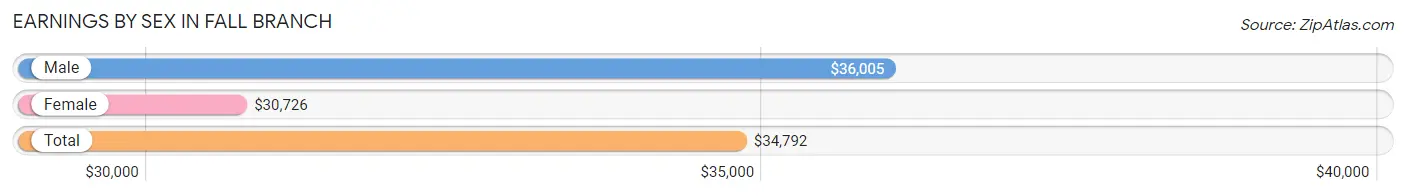
Earnings by Sex in Fall Branch
Average Earnings in Fall Branch are $34,792, $36,005 for men and $30,726 for women, a difference of 14.7%.
| Sex | Number | Average Earnings |
| Male | 347 (76.9%) | $36,005 |
| Female | 104 (23.1%) | $30,726 |
| Total | 451 (100.0%) | $34,792 |
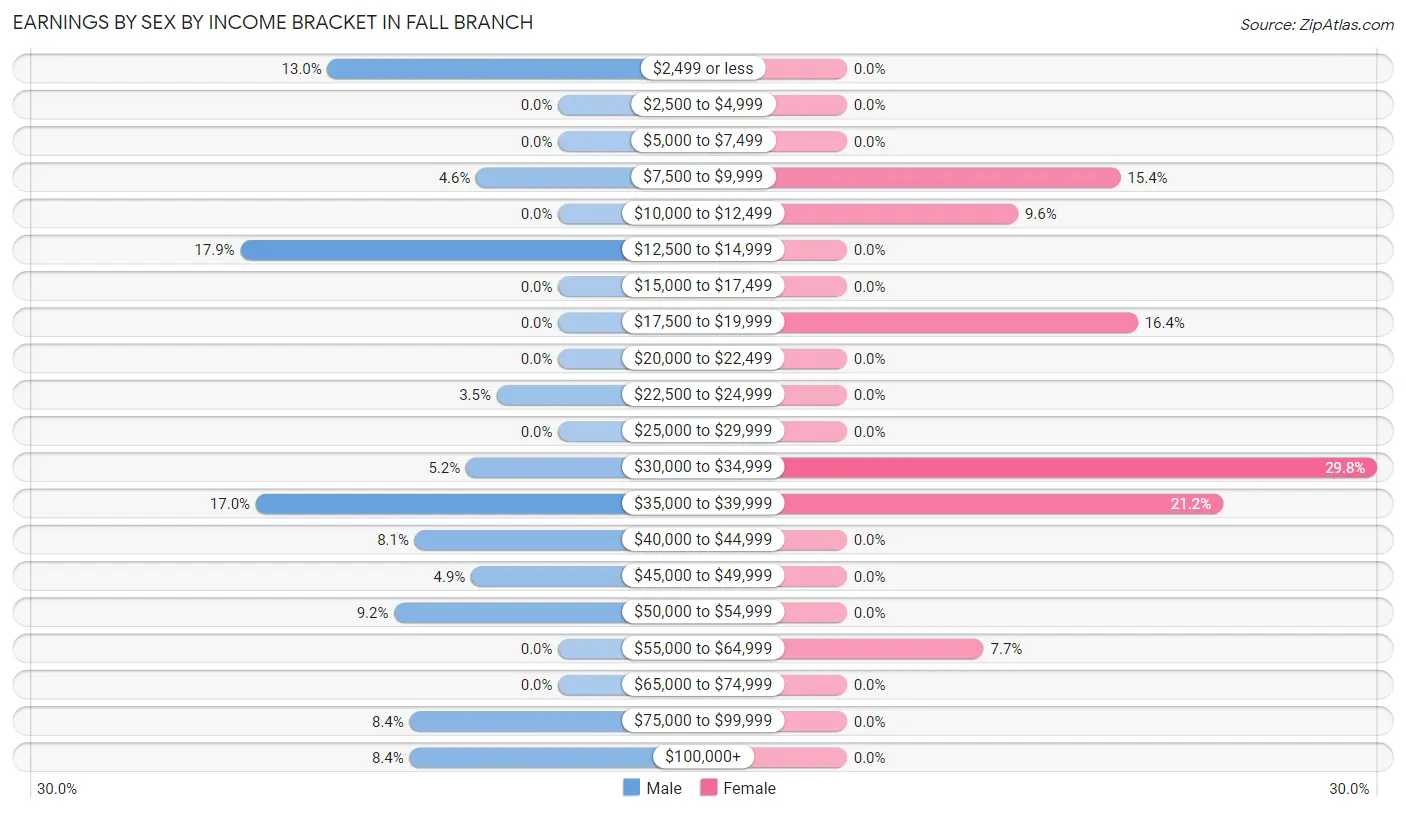
Earnings by Sex by Income Bracket in Fall Branch
The most common earnings brackets in Fall Branch are $12,500 to $14,999 for men (62 | 17.9%) and $30,000 to $34,999 for women (31 | 29.8%).
| Income | Male | Female |
| $2,499 or less | 45 (13.0%) | 0 (0.0%) |
| $2,500 to $4,999 | 0 (0.0%) | 0 (0.0%) |
| $5,000 to $7,499 | 0 (0.0%) | 0 (0.0%) |
| $7,500 to $9,999 | 16 (4.6%) | 16 (15.4%) |
| $10,000 to $12,499 | 0 (0.0%) | 10 (9.6%) |
| $12,500 to $14,999 | 62 (17.9%) | 0 (0.0%) |
| $15,000 to $17,499 | 0 (0.0%) | 0 (0.0%) |
| $17,500 to $19,999 | 0 (0.0%) | 17 (16.4%) |
| $20,000 to $22,499 | 0 (0.0%) | 0 (0.0%) |
| $22,500 to $24,999 | 12 (3.5%) | 0 (0.0%) |
| $25,000 to $29,999 | 0 (0.0%) | 0 (0.0%) |
| $30,000 to $34,999 | 18 (5.2%) | 31 (29.8%) |
| $35,000 to $39,999 | 59 (17.0%) | 22 (21.1%) |
| $40,000 to $44,999 | 28 (8.1%) | 0 (0.0%) |
| $45,000 to $49,999 | 17 (4.9%) | 0 (0.0%) |
| $50,000 to $54,999 | 32 (9.2%) | 0 (0.0%) |
| $55,000 to $64,999 | 0 (0.0%) | 8 (7.7%) |
| $65,000 to $74,999 | 0 (0.0%) | 0 (0.0%) |
| $75,000 to $99,999 | 29 (8.4%) | 0 (0.0%) |
| $100,000+ | 29 (8.4%) | 0 (0.0%) |
| Total | 347 (100.0%) | 104 (100.0%) |
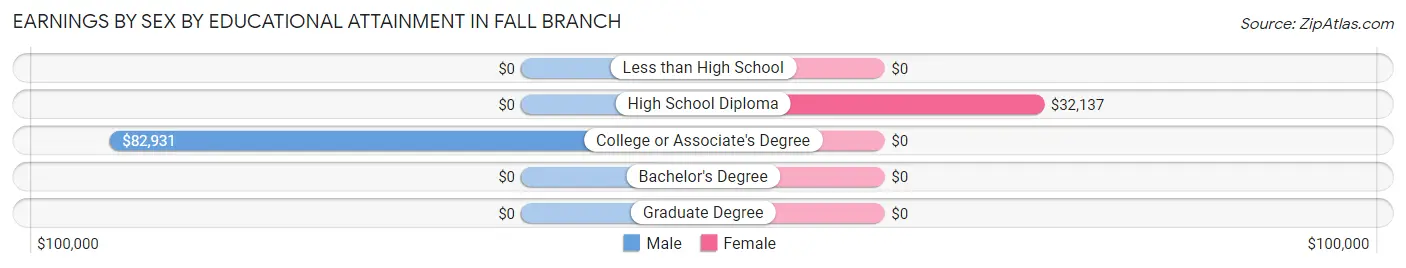
Earnings by Sex by Educational Attainment in Fall Branch
Average earnings in Fall Branch are $36,078 for men and $31,371 for women, a difference of 13.1%. Men with an educational attainment of college or associate's degree enjoy the highest average annual earnings of $82,931, while those with college or associate's degree education earn the least with $82,931. Women with an educational attainment of high school diploma earn the most with the average annual earnings of $32,137, while those with high school diploma education have the smallest earnings of $32,137.
| Educational Attainment | Male Income | Female Income |
| Less than High School | - | - |
| High School Diploma | - | - |
| College or Associate's Degree | $82,931 | $0 |
| Bachelor's Degree | - | - |
| Graduate Degree | - | - |
| Total | $36,078 | $31,371 |
Family Income in Fall Branch
Family Income Brackets in Fall Branch
According to the Fall Branch family income data, there are 76 families falling into the $35,000 to $49,999 income range, which is the most common income bracket and makes up 34.1% of all families.
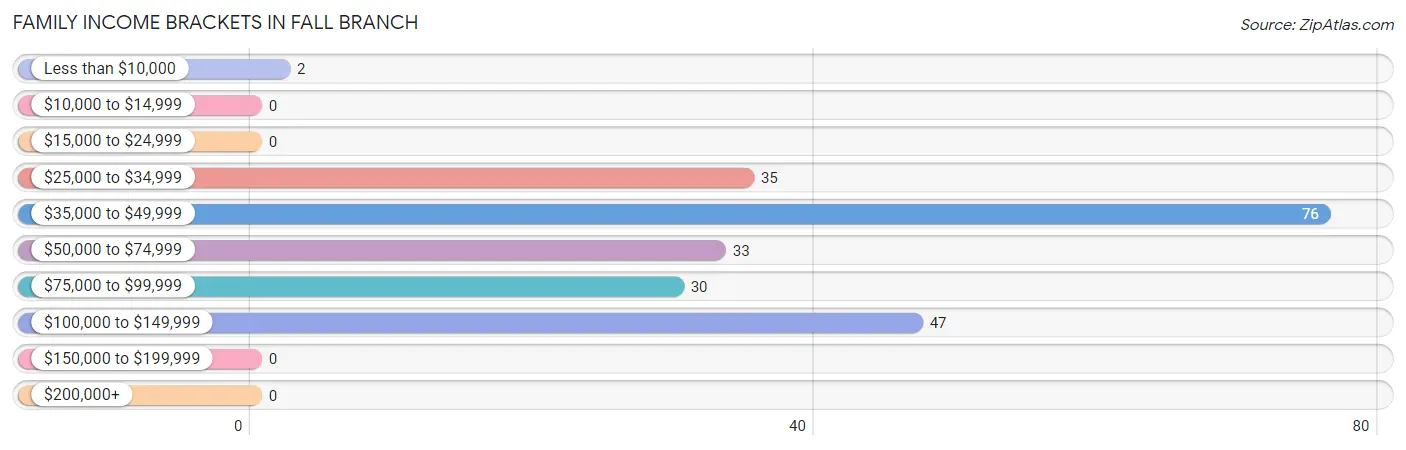
| Income Bracket | # Families | % Families |
| Less than $10,000 | 2 | 0.9% |
| $10,000 to $14,999 | 0 | 0.0% |
| $15,000 to $24,999 | 0 | 0.0% |
| $25,000 to $34,999 | 35 | 15.7% |
| $35,000 to $49,999 | 76 | 34.1% |
| $50,000 to $74,999 | 33 | 14.8% |
| $75,000 to $99,999 | 30 | 13.5% |
| $100,000 to $149,999 | 47 | 21.1% |
| $150,000 to $199,999 | 0 | 0.0% |
| $200,000+ | 0 | 0.0% |
Family Income by Famaliy Size in Fall Branch
3-person families (51 | 22.9%) account for the highest median family income in Fall Branch with $63,750 per family, while 2-person families (133 | 59.6%) have the highest median income of $22,304 per family member.
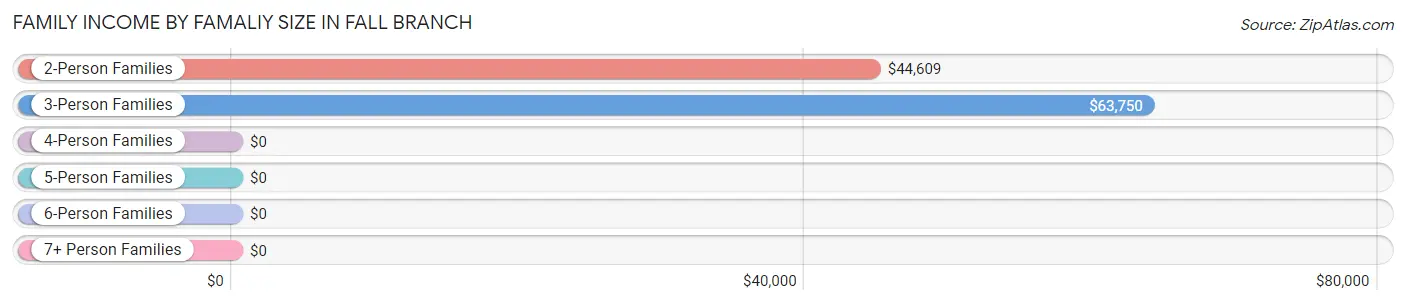
| Income Bracket | # Families | Median Income |
| 2-Person Families | 133 (59.6%) | $44,609 |
| 3-Person Families | 51 (22.9%) | $63,750 |
| 4-Person Families | 26 (11.7%) | $0 |
| 5-Person Families | 0 (0.0%) | $0 |
| 6-Person Families | 13 (5.8%) | $0 |
| 7+ Person Families | 0 (0.0%) | $0 |
| Total | 223 (100.0%) | $47,379 |
Family Income by Number of Earners in Fall Branch
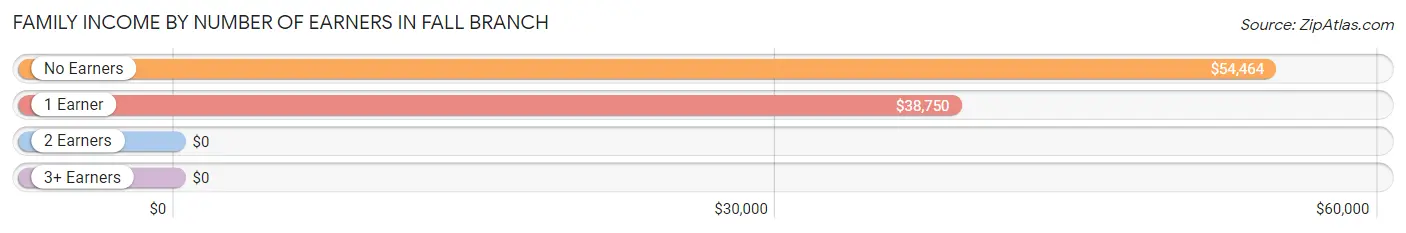
| Number of Earners | # Families | Median Income |
| No Earners | 63 (28.2%) | $54,464 |
| 1 Earner | 104 (46.6%) | $38,750 |
| 2 Earners | 39 (17.5%) | $0 |
| 3+ Earners | 17 (7.6%) | $0 |
| Total | 223 (100.0%) | $47,379 |
Household Income in Fall Branch
Household Income Brackets in Fall Branch
With 161 households falling in the category, the $35,000 to $49,999 income range is the most frequent in Fall Branch, accounting for 36.3% of all households.
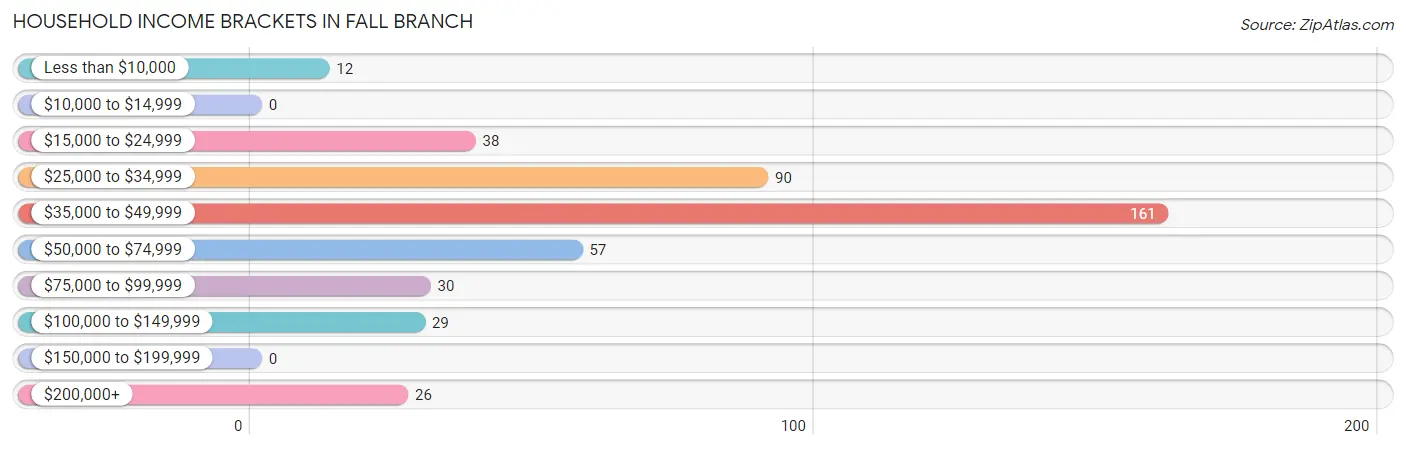
| Income Bracket | # Households | % Households |
| Less than $10,000 | 12 | 2.7% |
| $10,000 to $14,999 | 0 | 0.0% |
| $15,000 to $24,999 | 38 | 8.6% |
| $25,000 to $34,999 | 90 | 20.3% |
| $35,000 to $49,999 | 161 | 36.3% |
| $50,000 to $74,999 | 57 | 12.9% |
| $75,000 to $99,999 | 30 | 6.8% |
| $100,000 to $149,999 | 29 | 6.5% |
| $150,000 to $199,999 | 0 | 0.0% |
| $200,000+ | 26 | 5.9% |
Household Income by Householder Age in Fall Branch
The median household income in Fall Branch is $41,884, with the highest median household income of $41,903 found in the 45 to 64 years age bracket for the primary householder. A total of 172 households (38.8%) fall into this category. Meanwhile, the 15 to 24 years age bracket for the primary householder has the lowest median household income of $0, with 16 households (3.6%) in this group.
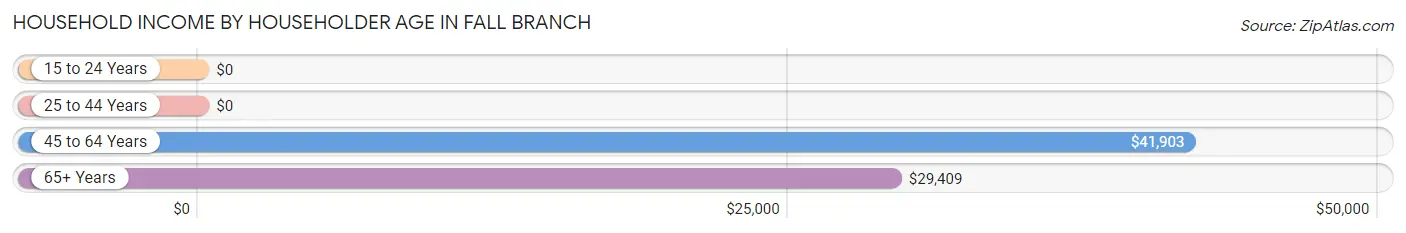
| Income Bracket | # Households | Median Income |
| 15 to 24 Years | 16 (3.6%) | $0 |
| 25 to 44 Years | 71 (16.0%) | $0 |
| 45 to 64 Years | 172 (38.8%) | $41,903 |
| 65+ Years | 184 (41.5%) | $29,409 |
| Total | 443 (100.0%) | $41,884 |
Poverty in Fall Branch
Income Below Poverty by Sex and Age in Fall Branch
With 27.0% poverty level for males and 13.7% for females among the residents of Fall Branch, 6 to 11 year old males and 18 to 24 year old females are the most vulnerable to poverty, with 13 males (100.0%) and 16 females (100.0%) in their respective age groups living below the poverty level.
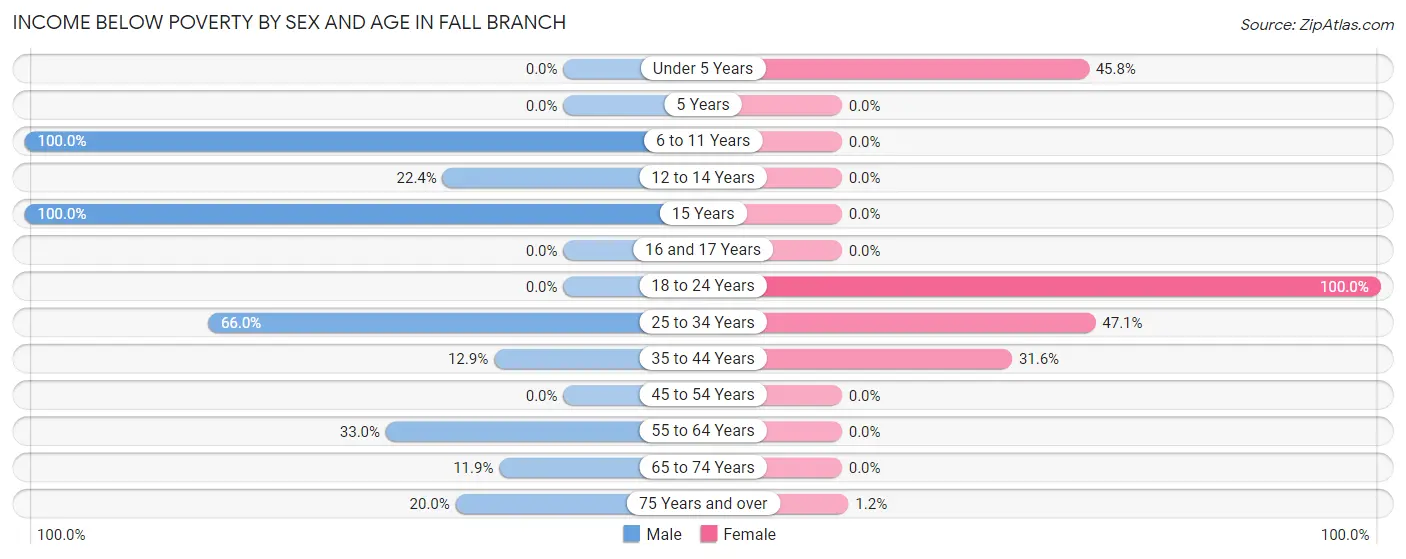
| Age Bracket | Male | Female |
| Under 5 Years | 0 (0.0%) | 11 (45.8%) |
| 5 Years | 0 (0.0%) | 0 (0.0%) |
| 6 to 11 Years | 13 (100.0%) | 0 (0.0%) |
| 12 to 14 Years | 13 (22.4%) | 0 (0.0%) |
| 15 Years | 13 (100.0%) | 0 (0.0%) |
| 16 and 17 Years | 0 (0.0%) | 0 (0.0%) |
| 18 to 24 Years | 0 (0.0%) | 16 (100.0%) |
| 25 to 34 Years | 62 (66.0%) | 16 (47.1%) |
| 35 to 44 Years | 13 (12.9%) | 12 (31.6%) |
| 45 to 54 Years | 0 (0.0%) | 0 (0.0%) |
| 55 to 64 Years | 29 (33.0%) | 0 (0.0%) |
| 65 to 74 Years | 10 (11.9%) | 0 (0.0%) |
| 75 Years and over | 2 (20.0%) | 1 (1.2%) |
| Total | 155 (27.0%) | 56 (13.7%) |
Income Above Poverty by Sex and Age in Fall Branch
According to the poverty statistics in Fall Branch, males aged 18 to 24 years and females aged 15 years are the age groups that are most secure financially, with 100.0% of males and 100.0% of females in these age groups living above the poverty line.
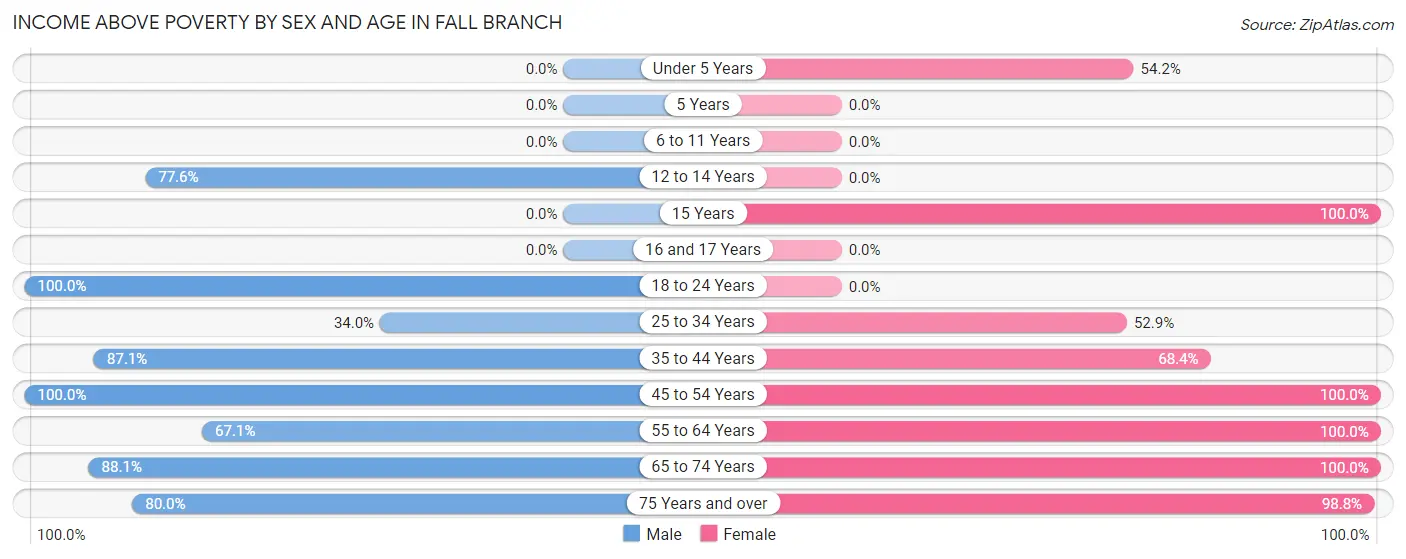
| Age Bracket | Male | Female |
| Under 5 Years | 0 (0.0%) | 13 (54.2%) |
| 5 Years | 0 (0.0%) | 0 (0.0%) |
| 6 to 11 Years | 0 (0.0%) | 0 (0.0%) |
| 12 to 14 Years | 45 (77.6%) | 0 (0.0%) |
| 15 Years | 0 (0.0%) | 8 (100.0%) |
| 16 and 17 Years | 0 (0.0%) | 0 (0.0%) |
| 18 to 24 Years | 41 (100.0%) | 0 (0.0%) |
| 25 to 34 Years | 32 (34.0%) | 18 (52.9%) |
| 35 to 44 Years | 88 (87.1%) | 26 (68.4%) |
| 45 to 54 Years | 73 (100.0%) | 60 (100.0%) |
| 55 to 64 Years | 59 (67.0%) | 62 (100.0%) |
| 65 to 74 Years | 74 (88.1%) | 86 (100.0%) |
| 75 Years and over | 8 (80.0%) | 80 (98.8%) |
| Total | 420 (73.0%) | 353 (86.3%) |
Income Below Poverty Among Married-Couple Families in Fall Branch
The poverty statistics for married-couple families in Fall Branch show that 7.3% or 15 of the total 206 families live below the poverty line. Families with 3 or 4 children have the highest poverty rate of 100.0%, comprising of 13 families. On the other hand, families with 1 or 2 children have the lowest poverty rate of 0.0%, which includes 0 families.
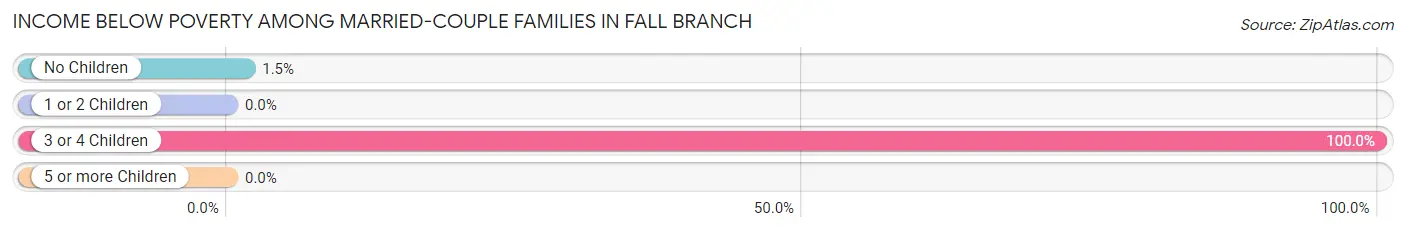
| Children | Above Poverty | Below Poverty |
| No Children | 131 (98.5%) | 2 (1.5%) |
| 1 or 2 Children | 60 (100.0%) | 0 (0.0%) |
| 3 or 4 Children | 0 (0.0%) | 13 (100.0%) |
| 5 or more Children | 0 (0.0%) | 0 (0.0%) |
| Total | 191 (92.7%) | 15 (7.3%) |
Income Below Poverty Among Single-Parent Households in Fall Branch
| Children | Single Father | Single Mother |
| No Children | 0 (0.0%) | 0 (0.0%) |
| 1 or 2 Children | 0 (0.0%) | 0 (0.0%) |
| 3 or 4 Children | 0 (0.0%) | 0 (0.0%) |
| 5 or more Children | 0 (0.0%) | 0 (0.0%) |
| Total | 0 (0.0%) | 0 (0.0%) |
Income Below Poverty Among Married-Couple vs Single-Parent Households in Fall Branch
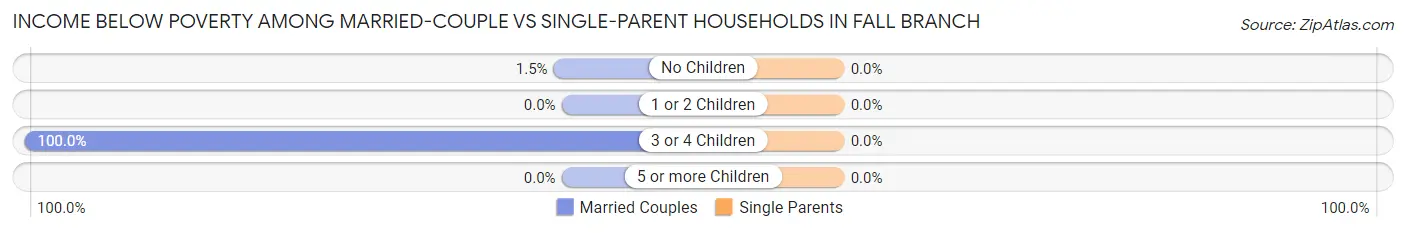
| Children | Married-Couple Families | Single-Parent Households |
| No Children | 2 (1.5%) | 0 (0.0%) |
| 1 or 2 Children | 0 (0.0%) | 0 (0.0%) |
| 3 or 4 Children | 13 (100.0%) | 0 (0.0%) |
| 5 or more Children | 0 (0.0%) | 0 (0.0%) |
| Total | 15 (7.3%) | 0 (0.0%) |
Race in Fall Branch
The most populous races in Fall Branch are , and White / Caucasian (984 | 100.0%).
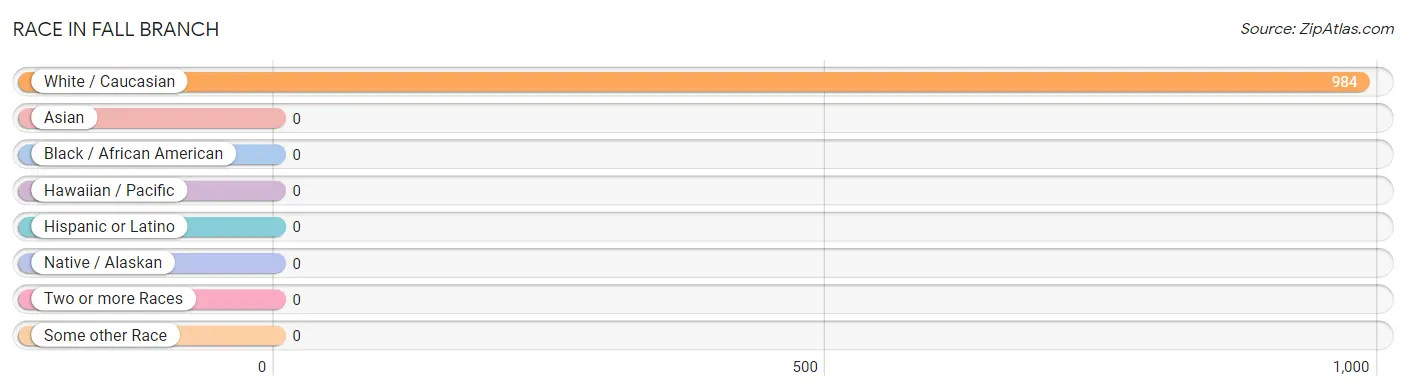
| Race | # Population | % Population |
| Asian | 0 | 0.0% |
| Black / African American | 0 | 0.0% |
| Hawaiian / Pacific | 0 | 0.0% |
| Hispanic or Latino | 0 | 0.0% |
| Native / Alaskan | 0 | 0.0% |
| White / Caucasian | 984 | 100.0% |
| Two or more Races | 0 | 0.0% |
| Some other Race | 0 | 0.0% |
| Total | 984 | 100.0% |
Ancestry in Fall Branch
The most populous ancestries reported in Fall Branch are English (241 | 24.5%), Irish (181 | 18.4%), German (155 | 15.8%), American (72 | 7.3%), and European (63 | 6.4%), together accounting for 72.4% of all Fall Branch residents.
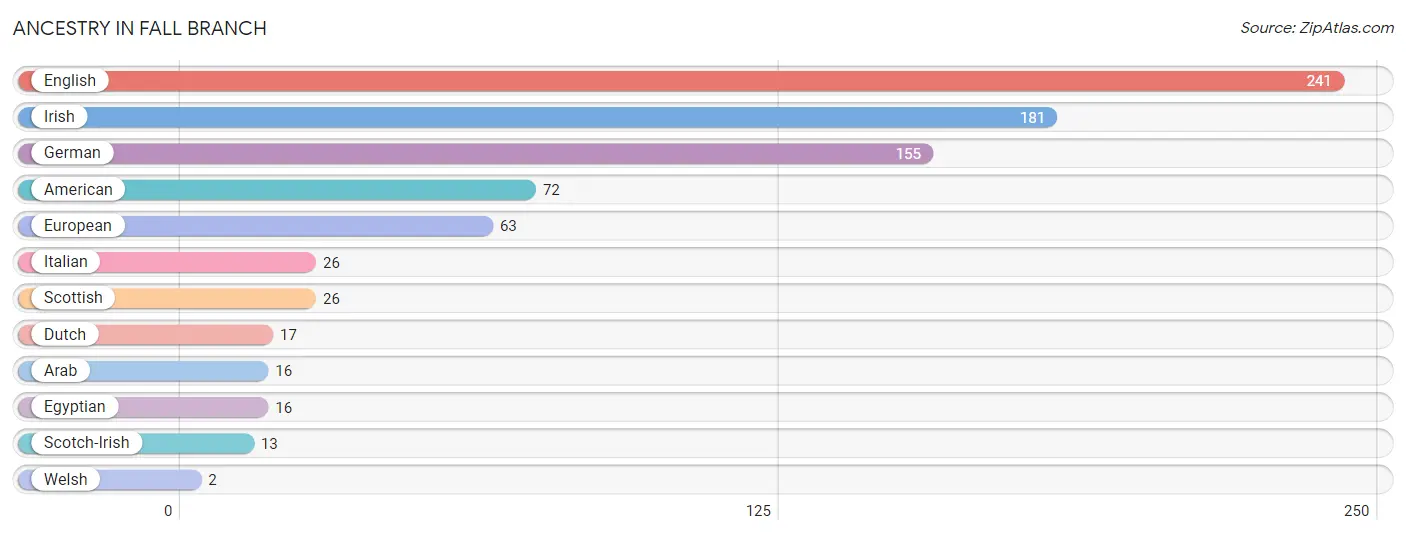
| Ancestry | # Population | % Population |
| American | 72 | 7.3% |
| Arab | 16 | 1.6% |
| Dutch | 17 | 1.7% |
| Egyptian | 16 | 1.6% |
| English | 241 | 24.5% |
| European | 63 | 6.4% |
| German | 155 | 15.8% |
| Irish | 181 | 18.4% |
| Italian | 26 | 2.6% |
| Scotch-Irish | 13 | 1.3% |
| Scottish | 26 | 2.6% |
| Welsh | 2 | 0.2% | View All 12 Rows |
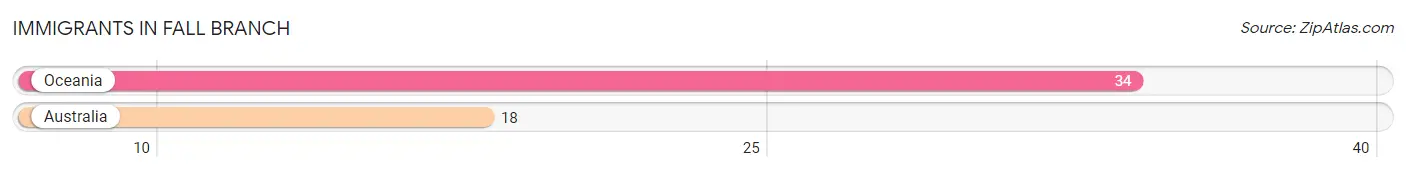
Immigrants in Fall Branch
The most numerous immigrant groups reported in Fall Branch came from Oceania (34 | 3.5%), and Australia (18 | 1.8%), together accounting for 5.3% of all Fall Branch residents.
| Immigration Origin | # Population | % Population |
| Australia | 18 | 1.8% |
| Oceania | 34 | 3.5% | View All 2 Rows |
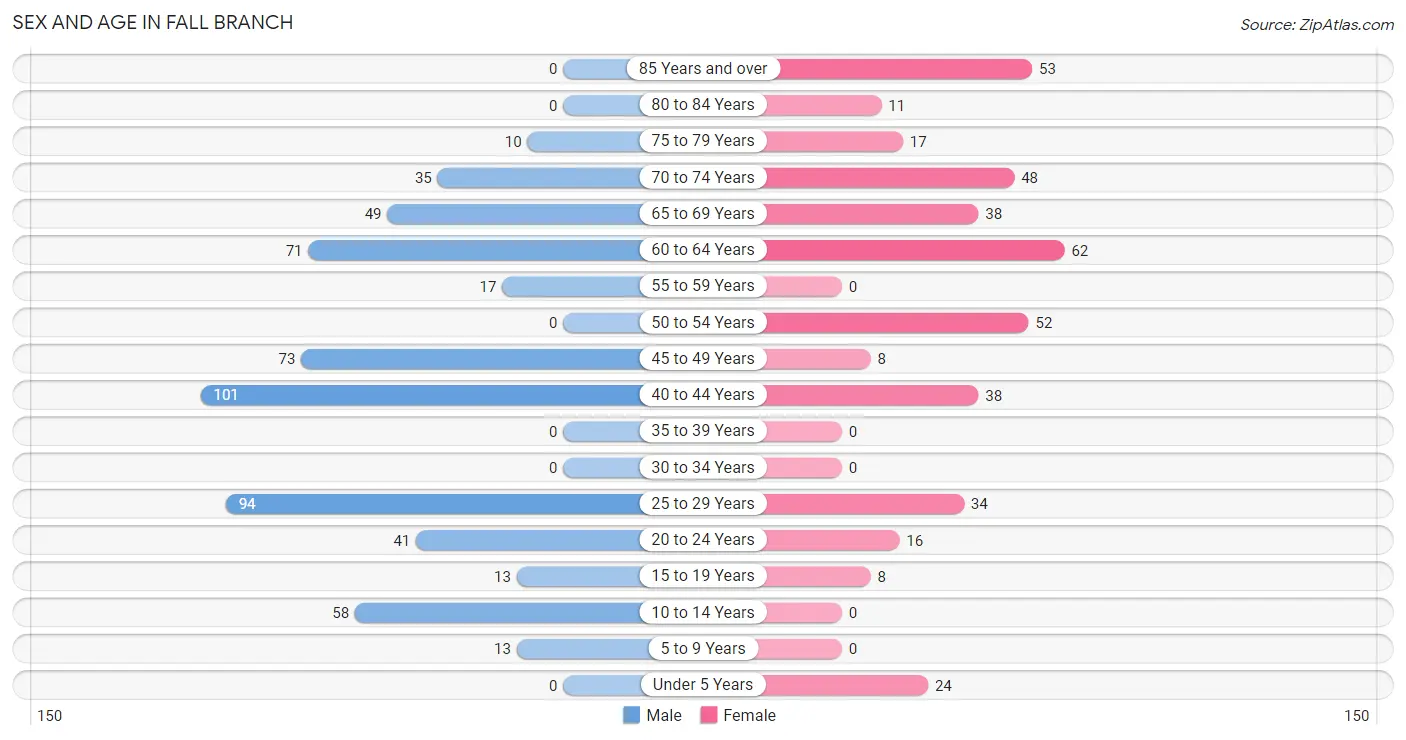
Sex and Age in Fall Branch
Sex and Age in Fall Branch
The most populous age groups in Fall Branch are 40 to 44 Years (101 | 17.6%) for men and 60 to 64 Years (62 | 15.2%) for women.
| Age Bracket | Male | Female |
| Under 5 Years | 0 (0.0%) | 24 (5.9%) |
| 5 to 9 Years | 13 (2.3%) | 0 (0.0%) |
| 10 to 14 Years | 58 (10.1%) | 0 (0.0%) |
| 15 to 19 Years | 13 (2.3%) | 8 (2.0%) |
| 20 to 24 Years | 41 (7.1%) | 16 (3.9%) |
| 25 to 29 Years | 94 (16.4%) | 34 (8.3%) |
| 30 to 34 Years | 0 (0.0%) | 0 (0.0%) |
| 35 to 39 Years | 0 (0.0%) | 0 (0.0%) |
| 40 to 44 Years | 101 (17.6%) | 38 (9.3%) |
| 45 to 49 Years | 73 (12.7%) | 8 (2.0%) |
| 50 to 54 Years | 0 (0.0%) | 52 (12.7%) |
| 55 to 59 Years | 17 (3.0%) | 0 (0.0%) |
| 60 to 64 Years | 71 (12.3%) | 62 (15.2%) |
| 65 to 69 Years | 49 (8.5%) | 38 (9.3%) |
| 70 to 74 Years | 35 (6.1%) | 48 (11.7%) |
| 75 to 79 Years | 10 (1.7%) | 17 (4.2%) |
| 80 to 84 Years | 0 (0.0%) | 11 (2.7%) |
| 85 Years and over | 0 (0.0%) | 53 (13.0%) |
| Total | 575 (100.0%) | 409 (100.0%) |
Families and Households in Fall Branch
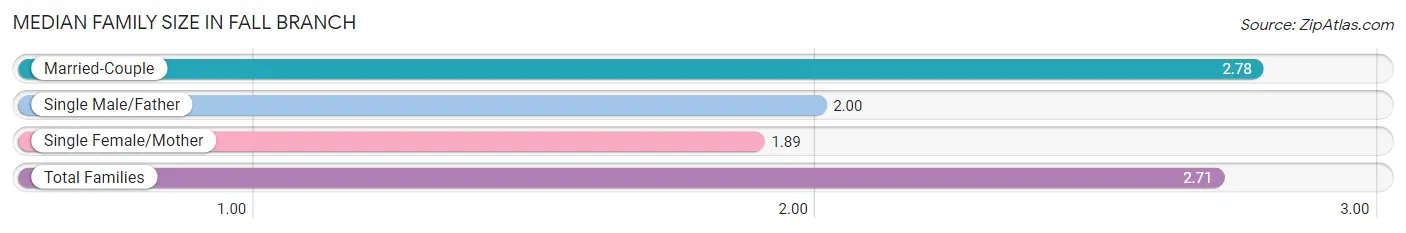
Median Family Size in Fall Branch
The median family size in Fall Branch is 2.71 persons per family, with married-couple families (206 | 92.4%) accounting for the largest median family size of 2.78 persons per family. On the other hand, single female/mother families (9 | 4.0%) represent the smallest median family size with 1.89 persons per family.
| Family Type | # Families | Family Size |
| Married-Couple | 206 (92.4%) | 2.78 |
| Single Male/Father | 8 (3.6%) | 2.00 |
| Single Female/Mother | 9 (4.0%) | 1.89 |
| Total Families | 223 (100.0%) | 2.71 |
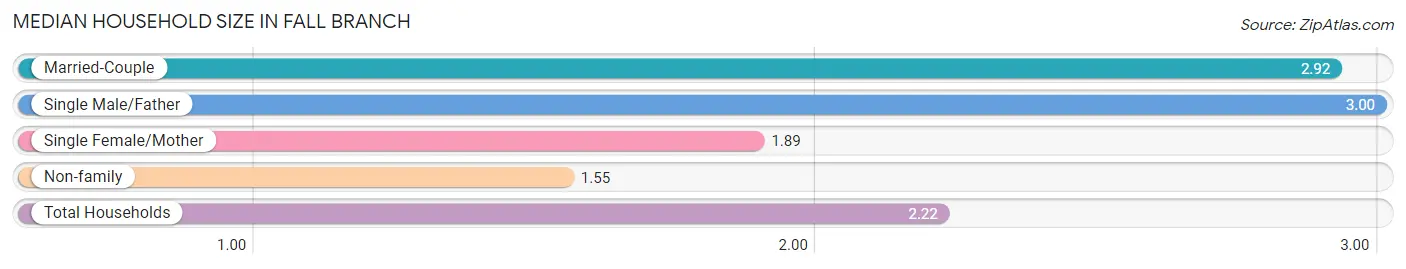
Median Household Size in Fall Branch
The median household size in Fall Branch is 2.22 persons per household, with single male/father households (8 | 1.8%) accounting for the largest median household size of 3 persons per household. non-family households (220 | 49.7%) represent the smallest median household size with 1.55 persons per household.
| Household Type | # Households | Household Size |
| Married-Couple | 206 (46.5%) | 2.92 |
| Single Male/Father | 8 (1.8%) | 3.00 |
| Single Female/Mother | 9 (2.0%) | 1.89 |
| Non-family | 220 (49.7%) | 1.55 |
| Total Households | 443 (100.0%) | 2.22 |
Household Size by Marriage Status in Fall Branch
Out of a total of 443 households in Fall Branch, 223 (50.3%) are family households, while 220 (49.7%) are nonfamily households. The most numerous type of family households are 2-person households, comprising 125, and the most common type of nonfamily households are 2-person households, comprising 111.
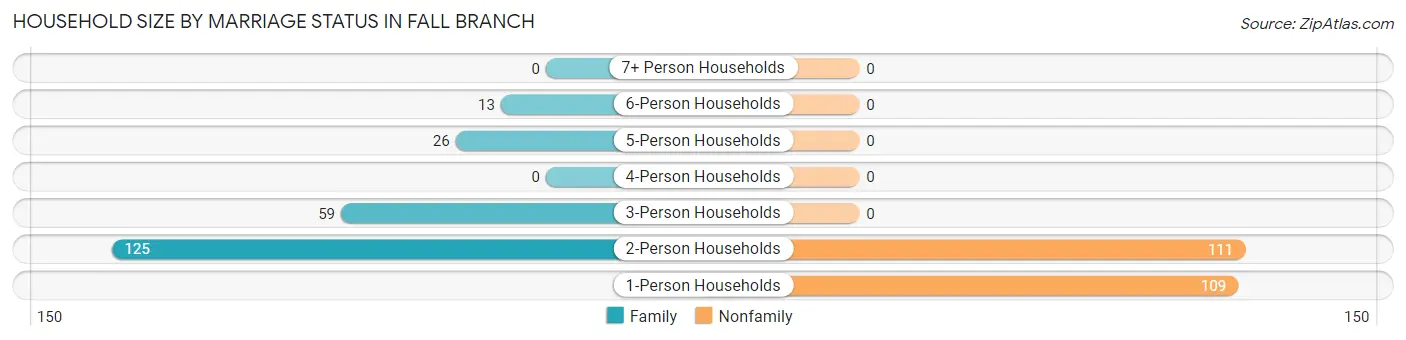
| Household Size | Family Households | Nonfamily Households |
| 1-Person Households | - | 109 (24.6%) |
| 2-Person Households | 125 (28.2%) | 111 (25.1%) |
| 3-Person Households | 59 (13.3%) | 0 (0.0%) |
| 4-Person Households | 0 (0.0%) | 0 (0.0%) |
| 5-Person Households | 26 (5.9%) | 0 (0.0%) |
| 6-Person Households | 13 (2.9%) | 0 (0.0%) |
| 7+ Person Households | 0 (0.0%) | 0 (0.0%) |
| Total | 223 (50.3%) | 220 (49.7%) |
Female Fertility in Fall Branch
Fertility by Age in Fall Branch
Average fertility rate in Fall Branch is 173.0 births per 1,000 women. Women in the age bracket of 20 to 34 years have the highest fertility rate with 360.0 births per 1,000 women. Women in the age bracket of 20 to 34 years acount for 100.0% of all women with births.
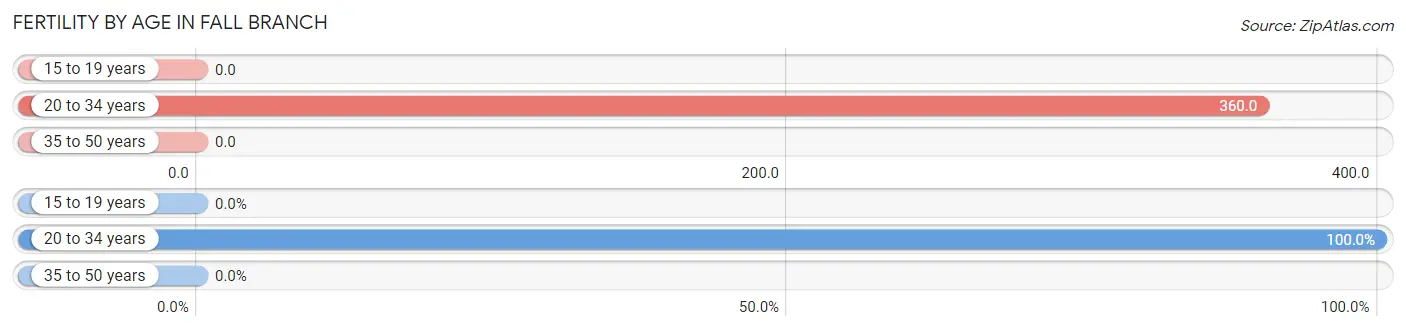
| Age Bracket | Women with Births | Births / 1,000 Women |
| 15 to 19 years | 0 (0.0%) | 0.0 |
| 20 to 34 years | 18 (100.0%) | 360.0 |
| 35 to 50 years | 0 (0.0%) | 0.0 |
| Total | 18 (100.0%) | 173.0 |
Fertility by Age by Marriage Status in Fall Branch
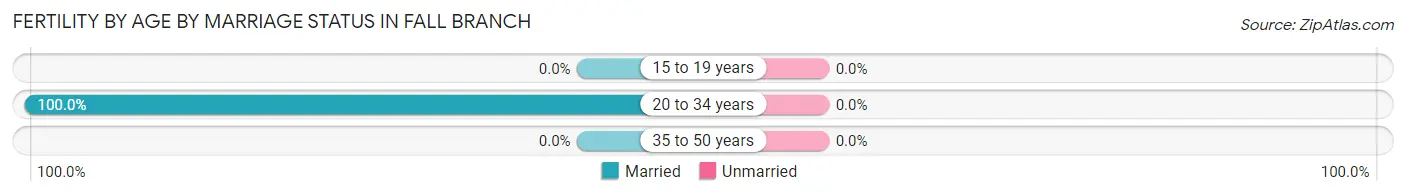
| Age Bracket | Married | Unmarried |
| 15 to 19 years | 0 (0.0%) | 0 (0.0%) |
| 20 to 34 years | 18 (100.0%) | 0 (0.0%) |
| 35 to 50 years | 0 (0.0%) | 0 (0.0%) |
| Total | 18 (100.0%) | 0 (0.0%) |
Fertility by Education in Fall Branch
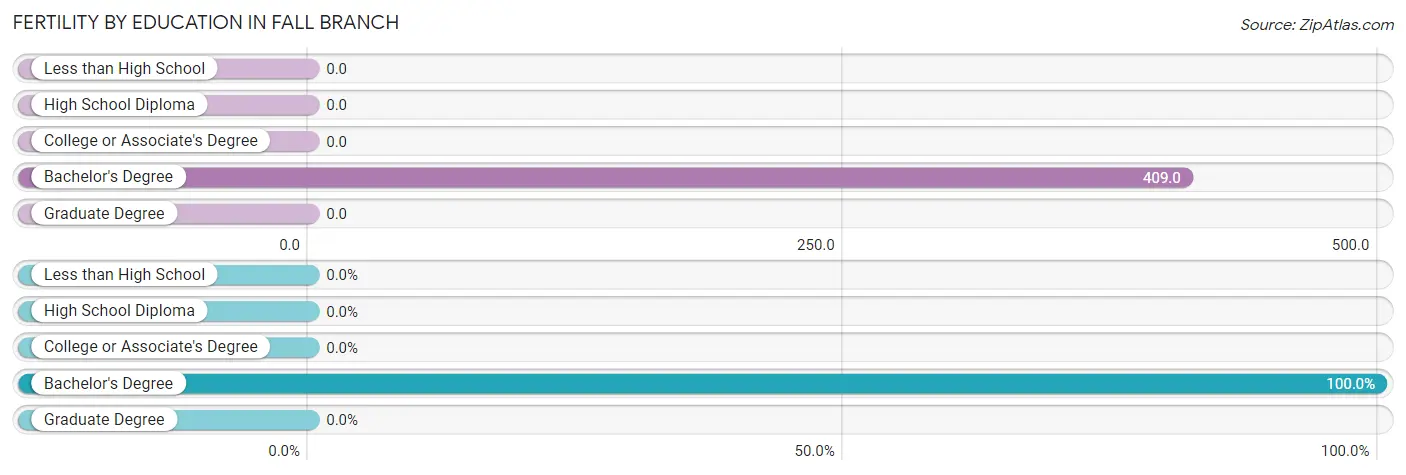
| Educational Attainment | Women with Births | Births / 1,000 Women |
| Less than High School | 0 (0.0%) | 0.0 |
| High School Diploma | 0 (0.0%) | 0.0 |
| College or Associate's Degree | 0 (0.0%) | 0.0 |
| Bachelor's Degree | 18 (100.0%) | 409.0 |
| Graduate Degree | 0 (0.0%) | 0.0 |
| Total | 18 (100.0%) | 173.0 |
Fertility by Education by Marriage Status in Fall Branch
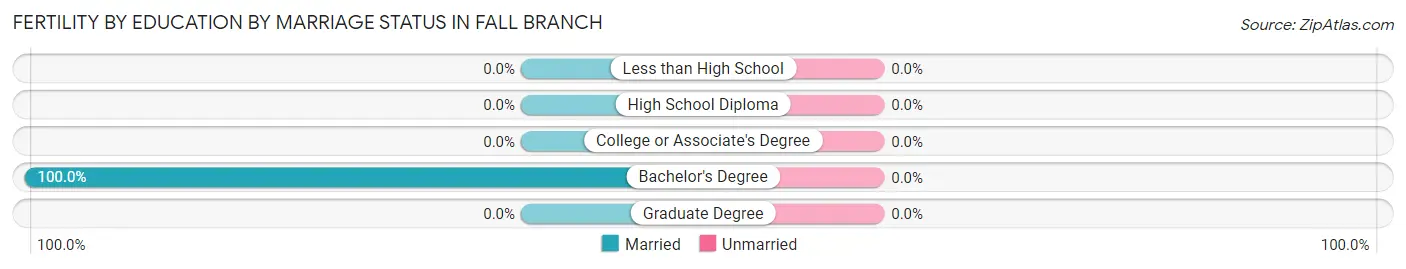
| Educational Attainment | Married | Unmarried |
| Less than High School | 0 (0.0%) | 0 (0.0%) |
| High School Diploma | 0 (0.0%) | 0 (0.0%) |
| College or Associate's Degree | 0 (0.0%) | 0 (0.0%) |
| Bachelor's Degree | 18 (100.0%) | 0 (0.0%) |
| Graduate Degree | 0 (0.0%) | 0 (0.0%) |
| Total | 18 (100.0%) | 0 (0.0%) |
Employment Characteristics in Fall Branch
Employment by Class of Employer in Fall Branch
Among the 327 employed individuals in Fall Branch, private company employees (167 | 51.1%), local government employees (58 | 17.7%), and self-employed (not incorporated) (57 | 17.4%) make up the most common classes of employment.
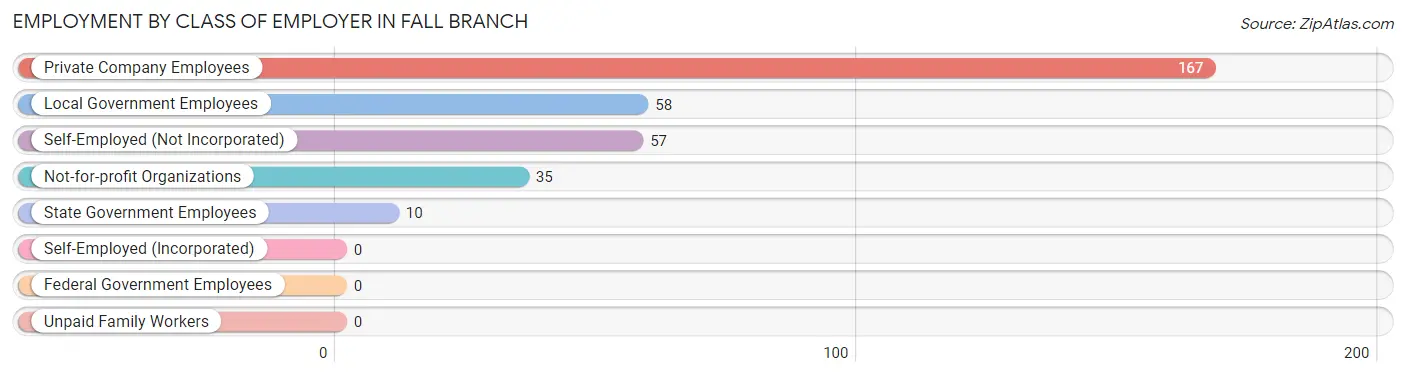
| Employer Class | # Employees | % Employees |
| Private Company Employees | 167 | 51.1% |
| Self-Employed (Incorporated) | 0 | 0.0% |
| Self-Employed (Not Incorporated) | 57 | 17.4% |
| Not-for-profit Organizations | 35 | 10.7% |
| Local Government Employees | 58 | 17.7% |
| State Government Employees | 10 | 3.1% |
| Federal Government Employees | 0 | 0.0% |
| Unpaid Family Workers | 0 | 0.0% |
| Total | 327 | 100.0% |
Employment Status by Age in Fall Branch
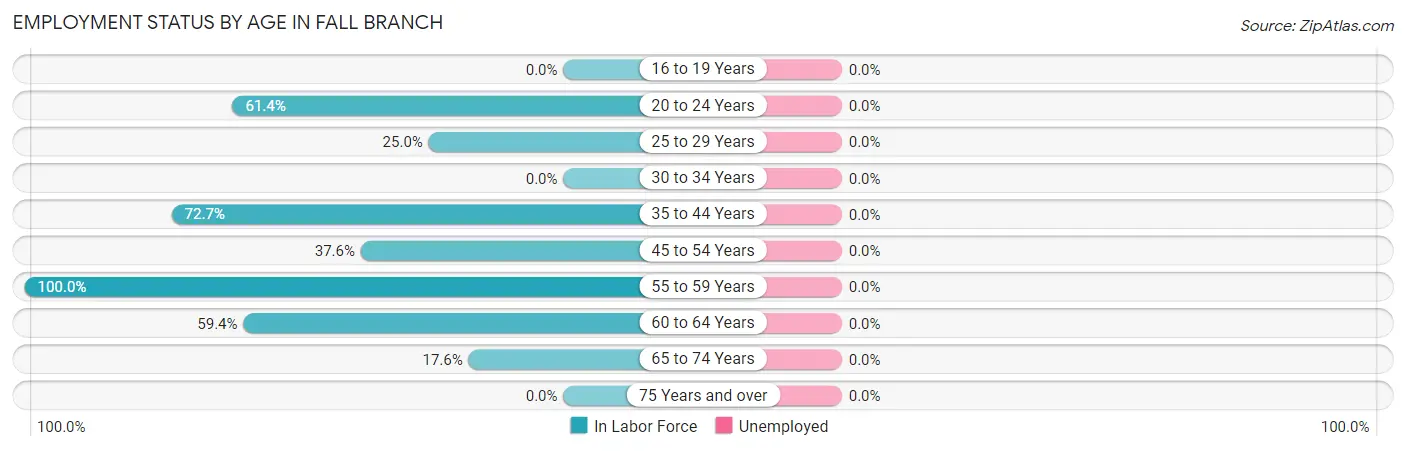
| Age Bracket | In Labor Force | Unemployed |
| 16 to 19 Years | 0 (0.0%) | 0 (0.0%) |
| 20 to 24 Years | 35 (61.4%) | 0 (0.0%) |
| 25 to 29 Years | 32 (25.0%) | 0 (0.0%) |
| 30 to 34 Years | 0 (0.0%) | 0 (0.0%) |
| 35 to 44 Years | 101 (72.7%) | 0 (0.0%) |
| 45 to 54 Years | 50 (37.6%) | 0 (0.0%) |
| 55 to 59 Years | 17 (100.0%) | 0 (0.0%) |
| 60 to 64 Years | 79 (59.4%) | 0 (0.0%) |
| 65 to 74 Years | 30 (17.6%) | 0 (0.0%) |
| 75 Years and over | 0 (0.0%) | 0 (0.0%) |
| Total | 344 (39.6%) | 0 (0.0%) |
Employment Status by Educational Attainment in Fall Branch
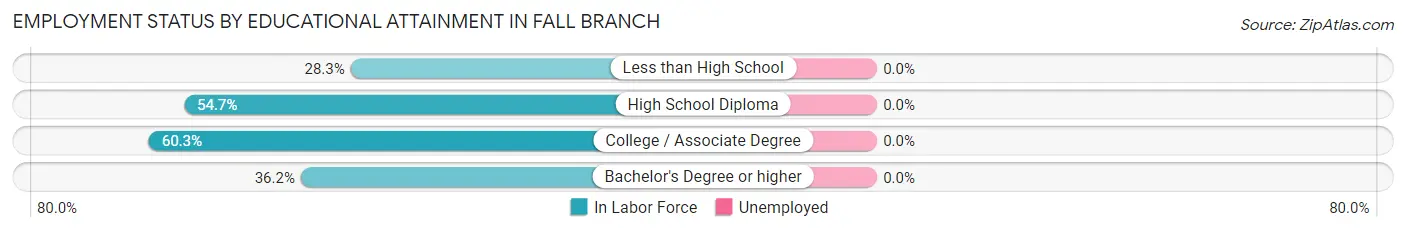
| Educational Attainment | In Labor Force | Unemployed |
| Less than High School | 17 (28.3%) | 0 (0.0%) |
| High School Diploma | 105 (54.7%) | 0 (0.0%) |
| College / Associate Degree | 123 (60.3%) | 0 (0.0%) |
| Bachelor's Degree or higher | 34 (36.2%) | 0 (0.0%) |
| Total | 279 (50.7%) | 0 (0.0%) |
Employment Occupations by Sex in Fall Branch
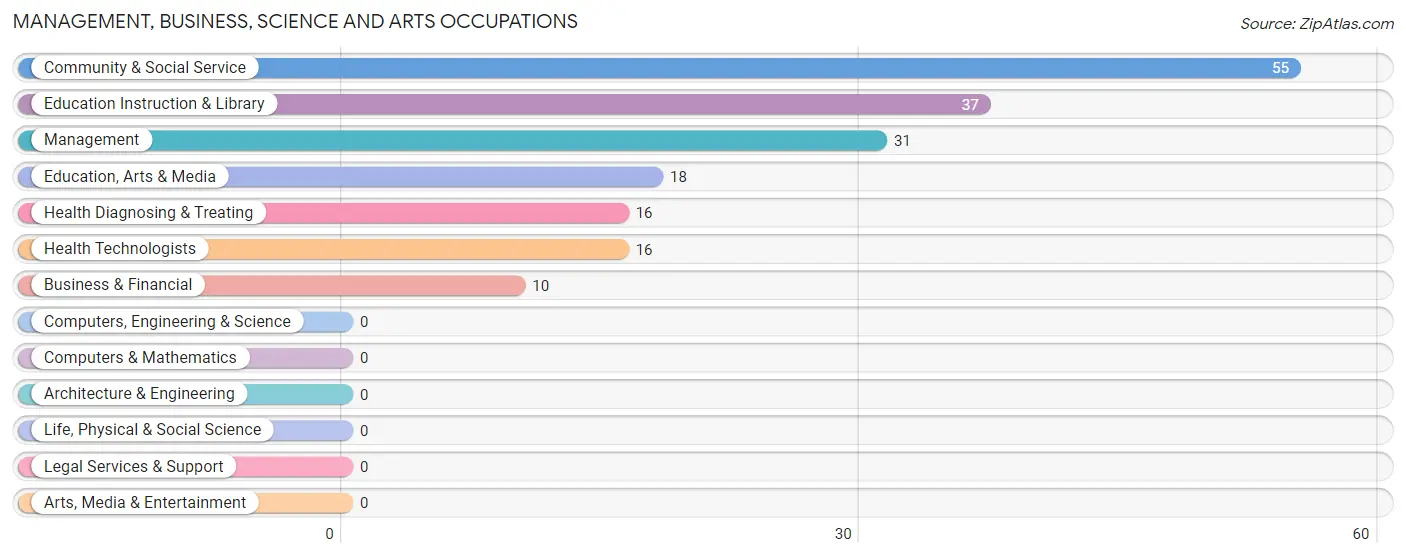
Management, Business, Science and Arts Occupations
The most common Management, Business, Science and Arts occupations in Fall Branch are Community & Social Service (55 | 16.0%), Education Instruction & Library (37 | 10.8%), Management (31 | 9.0%), Education, Arts & Media (18 | 5.2%), and Health Diagnosing & Treating (16 | 4.6%).
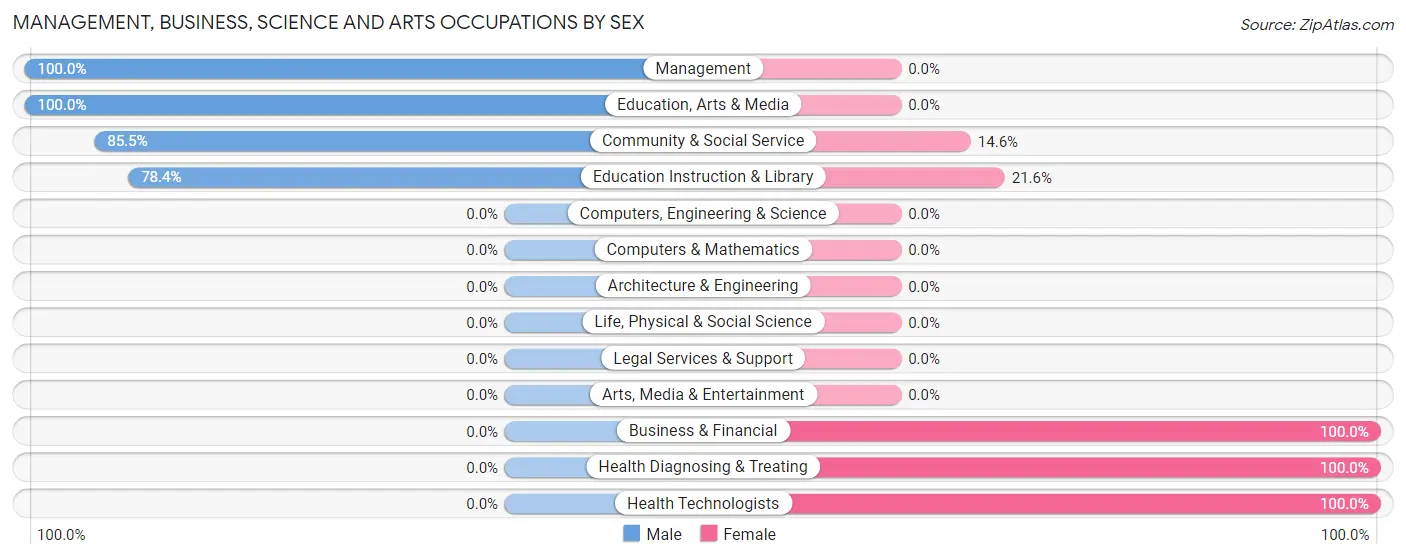
Management, Business, Science and Arts Occupations by Sex
Within the Management, Business, Science and Arts occupations in Fall Branch, the most male-oriented occupations are Management (100.0%), Education, Arts & Media (100.0%), and Community & Social Service (85.5%), while the most female-oriented occupations are Business & Financial (100.0%), Health Diagnosing & Treating (100.0%), and Health Technologists (100.0%).
| Occupation | Male | Female |
| Management | 31 (100.0%) | 0 (0.0%) |
| Business & Financial | 0 (0.0%) | 10 (100.0%) |
| Computers, Engineering & Science | 0 (0.0%) | 0 (0.0%) |
| Computers & Mathematics | 0 (0.0%) | 0 (0.0%) |
| Architecture & Engineering | 0 (0.0%) | 0 (0.0%) |
| Life, Physical & Social Science | 0 (0.0%) | 0 (0.0%) |
| Community & Social Service | 47 (85.5%) | 8 (14.5%) |
| Education, Arts & Media | 18 (100.0%) | 0 (0.0%) |
| Legal Services & Support | 0 (0.0%) | 0 (0.0%) |
| Education Instruction & Library | 29 (78.4%) | 8 (21.6%) |
| Arts, Media & Entertainment | 0 (0.0%) | 0 (0.0%) |
| Health Diagnosing & Treating | 0 (0.0%) | 16 (100.0%) |
| Health Technologists | 0 (0.0%) | 16 (100.0%) |
| Total (Category) | 78 (69.6%) | 34 (30.4%) |
| Total (Overall) | 240 (69.8%) | 104 (30.2%) |
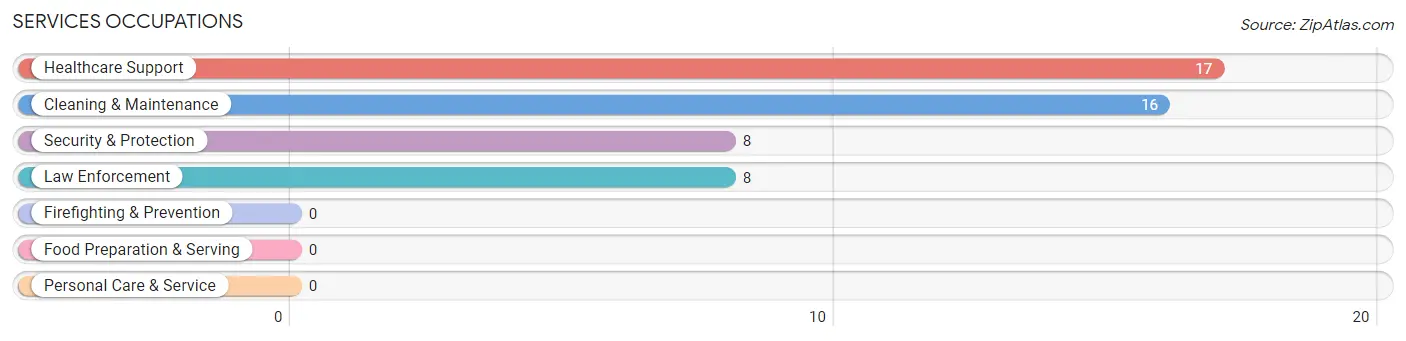
Services Occupations
The most common Services occupations in Fall Branch are Healthcare Support (17 | 4.9%), Cleaning & Maintenance (16 | 4.6%), Security & Protection (8 | 2.3%), and Law Enforcement (8 | 2.3%).
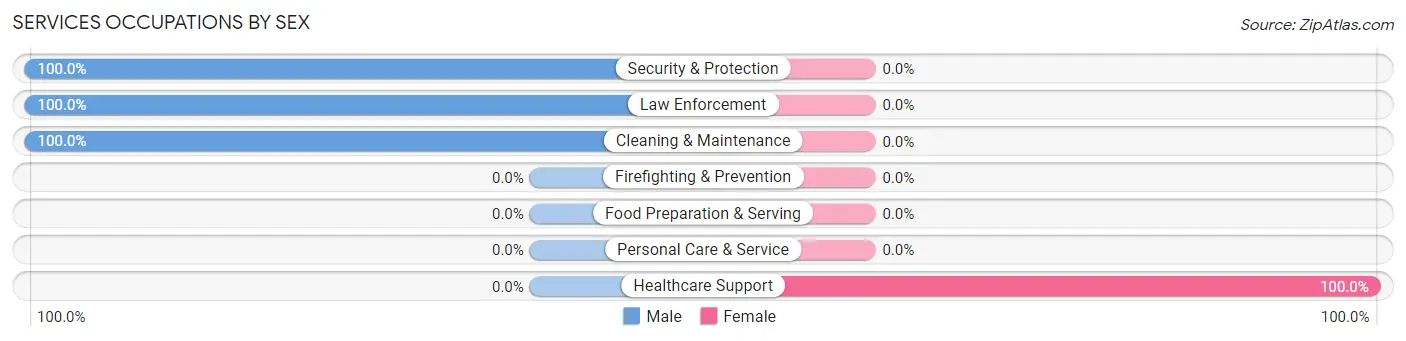
Services Occupations by Sex
| Occupation | Male | Female |
| Healthcare Support | 0 (0.0%) | 17 (100.0%) |
| Security & Protection | 8 (100.0%) | 0 (0.0%) |
| Firefighting & Prevention | 0 (0.0%) | 0 (0.0%) |
| Law Enforcement | 8 (100.0%) | 0 (0.0%) |
| Food Preparation & Serving | 0 (0.0%) | 0 (0.0%) |
| Cleaning & Maintenance | 16 (100.0%) | 0 (0.0%) |
| Personal Care & Service | 0 (0.0%) | 0 (0.0%) |
| Total (Category) | 24 (58.5%) | 17 (41.5%) |
| Total (Overall) | 240 (69.8%) | 104 (30.2%) |
Sales and Office Occupations
The most common Sales and Office occupations in Fall Branch are Office & Administration (70 | 20.3%), and Sales & Related (17 | 4.9%).
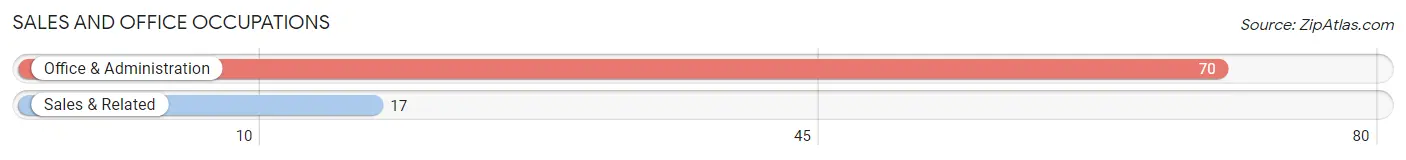
Sales and Office Occupations by Sex

| Occupation | Male | Female |
| Sales & Related | 17 (100.0%) | 0 (0.0%) |
| Office & Administration | 17 (24.3%) | 53 (75.7%) |
| Total (Category) | 34 (39.1%) | 53 (60.9%) |
| Total (Overall) | 240 (69.8%) | 104 (30.2%) |
Natural Resources, Construction and Maintenance Occupations
The most common Natural Resources, Construction and Maintenance occupations in Fall Branch are Construction & Extraction (32 | 9.3%), and Installation, Maintenance & Repair (29 | 8.4%).
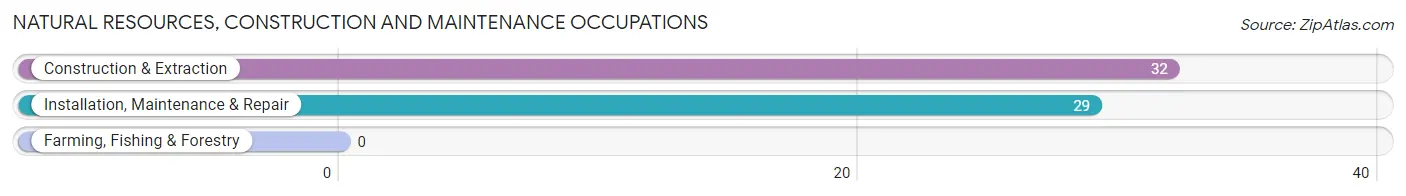
Natural Resources, Construction and Maintenance Occupations by Sex
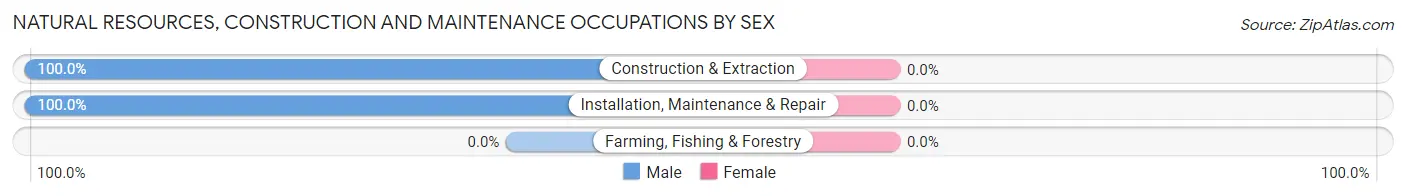
| Occupation | Male | Female |
| Farming, Fishing & Forestry | 0 (0.0%) | 0 (0.0%) |
| Construction & Extraction | 32 (100.0%) | 0 (0.0%) |
| Installation, Maintenance & Repair | 29 (100.0%) | 0 (0.0%) |
| Total (Category) | 61 (100.0%) | 0 (0.0%) |
| Total (Overall) | 240 (69.8%) | 104 (30.2%) |
Production, Transportation and Moving Occupations
The most common Production, Transportation and Moving occupations in Fall Branch are Transportation (30 | 8.7%), and Production (13 | 3.8%).
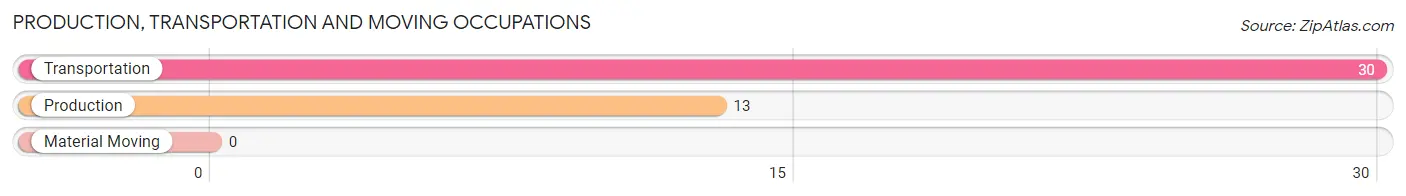
Production, Transportation and Moving Occupations by Sex
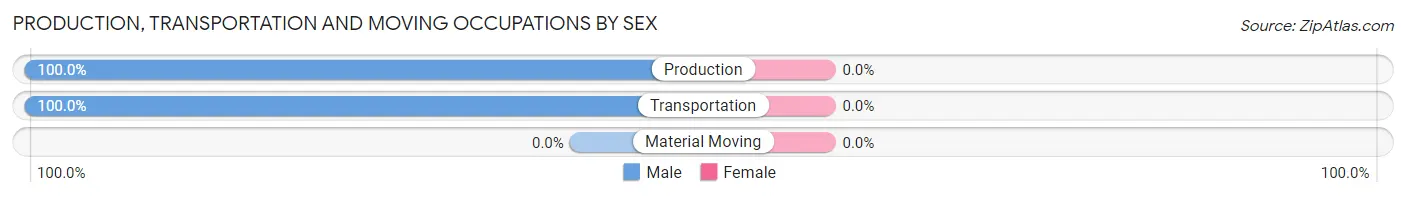
| Occupation | Male | Female |
| Production | 13 (100.0%) | 0 (0.0%) |
| Transportation | 30 (100.0%) | 0 (0.0%) |
| Material Moving | 0 (0.0%) | 0 (0.0%) |
| Total (Category) | 43 (100.0%) | 0 (0.0%) |
| Total (Overall) | 240 (69.8%) | 104 (30.2%) |
Employment Industries by Sex in Fall Branch
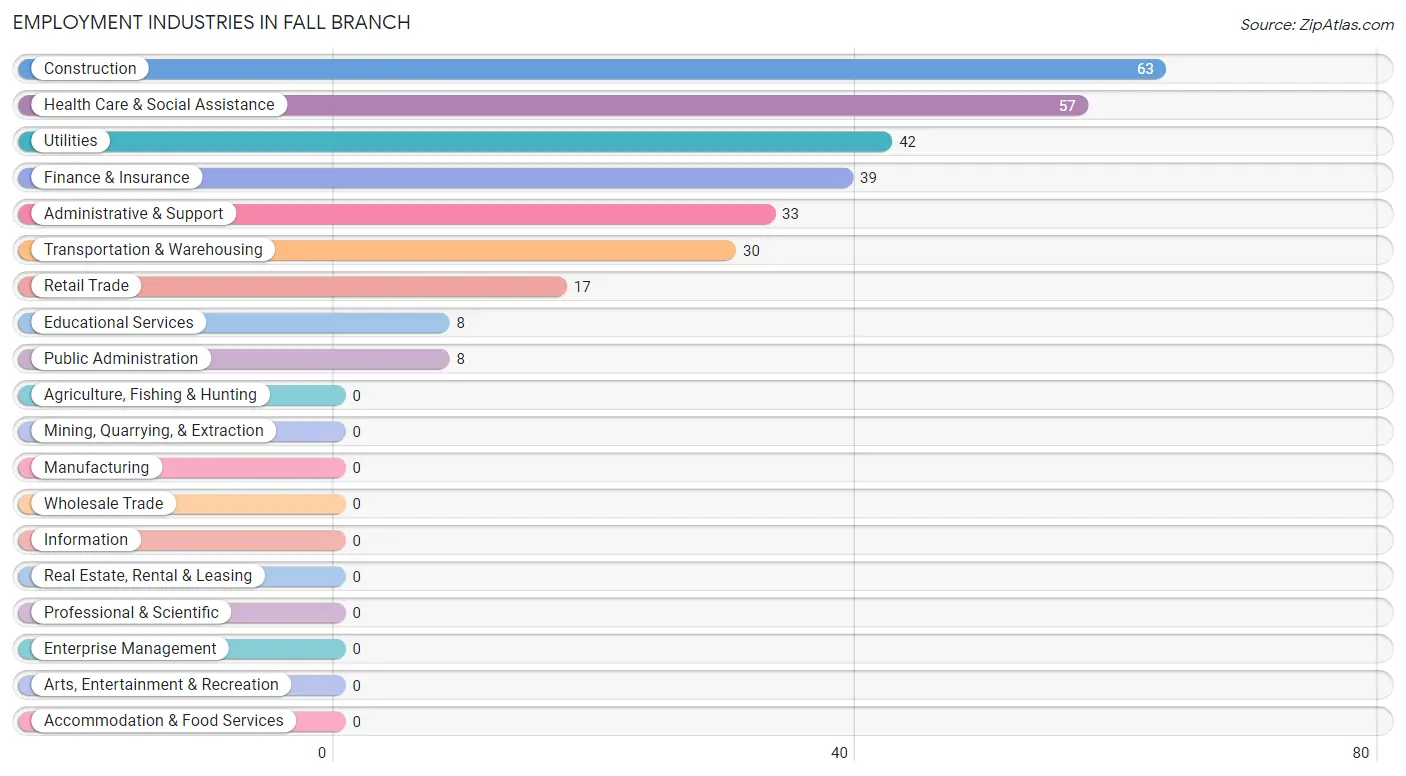
Employment Industries in Fall Branch
The major employment industries in Fall Branch include Construction (63 | 18.3%), Health Care & Social Assistance (57 | 16.6%), Utilities (42 | 12.2%), Finance & Insurance (39 | 11.3%), and Administrative & Support (33 | 9.6%).
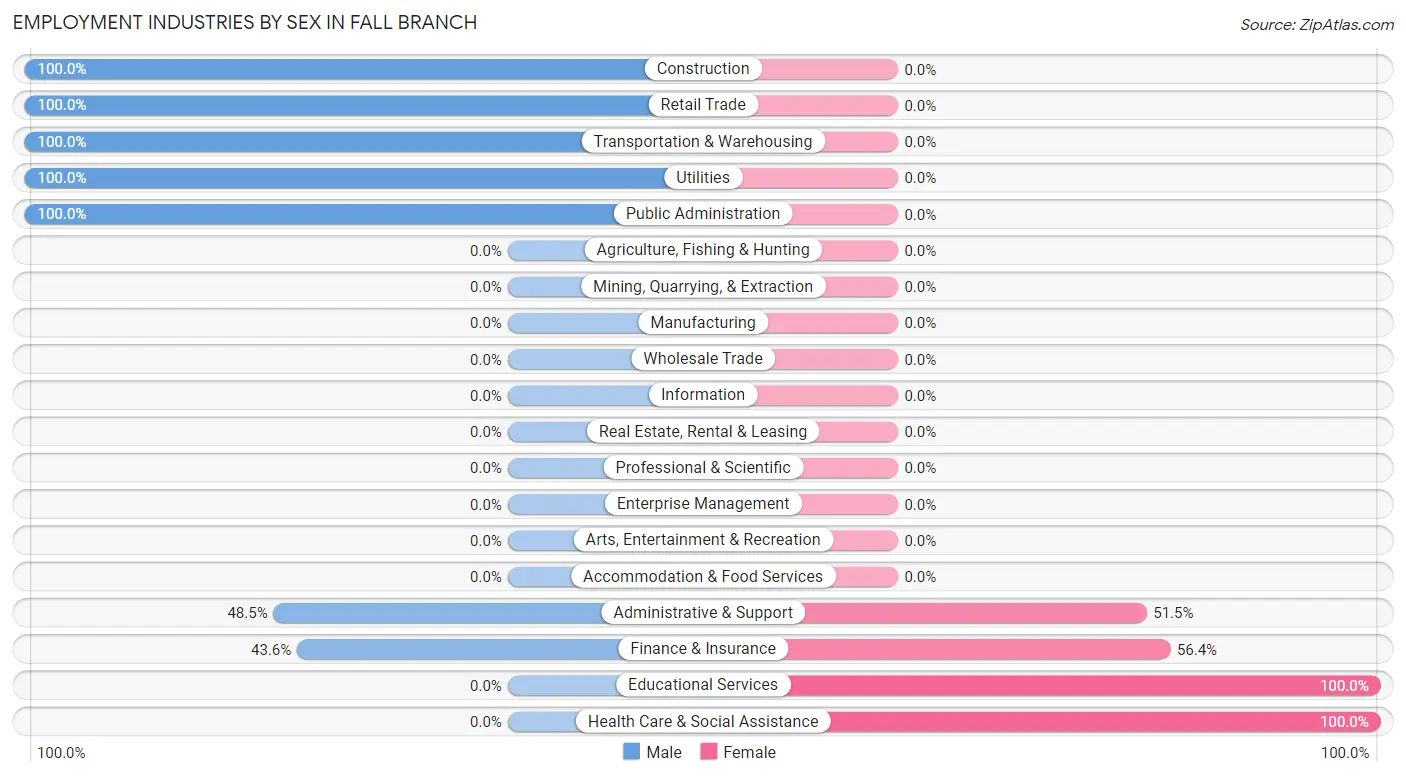
Employment Industries by Sex in Fall Branch
The Fall Branch industries that see more men than women are Construction (100.0%), Retail Trade (100.0%), and Transportation & Warehousing (100.0%), whereas the industries that tend to have a higher number of women are Educational Services (100.0%), Health Care & Social Assistance (100.0%), and Finance & Insurance (56.4%).
| Industry | Male | Female |
| Agriculture, Fishing & Hunting | 0 (0.0%) | 0 (0.0%) |
| Mining, Quarrying, & Extraction | 0 (0.0%) | 0 (0.0%) |
| Construction | 63 (100.0%) | 0 (0.0%) |
| Manufacturing | 0 (0.0%) | 0 (0.0%) |
| Wholesale Trade | 0 (0.0%) | 0 (0.0%) |
| Retail Trade | 17 (100.0%) | 0 (0.0%) |
| Transportation & Warehousing | 30 (100.0%) | 0 (0.0%) |
| Utilities | 42 (100.0%) | 0 (0.0%) |
| Information | 0 (0.0%) | 0 (0.0%) |
| Finance & Insurance | 17 (43.6%) | 22 (56.4%) |
| Real Estate, Rental & Leasing | 0 (0.0%) | 0 (0.0%) |
| Professional & Scientific | 0 (0.0%) | 0 (0.0%) |
| Enterprise Management | 0 (0.0%) | 0 (0.0%) |
| Administrative & Support | 16 (48.5%) | 17 (51.5%) |
| Educational Services | 0 (0.0%) | 8 (100.0%) |
| Health Care & Social Assistance | 0 (0.0%) | 57 (100.0%) |
| Arts, Entertainment & Recreation | 0 (0.0%) | 0 (0.0%) |
| Accommodation & Food Services | 0 (0.0%) | 0 (0.0%) |
| Public Administration | 8 (100.0%) | 0 (0.0%) |
| Total | 240 (69.8%) | 104 (30.2%) |
Education in Fall Branch
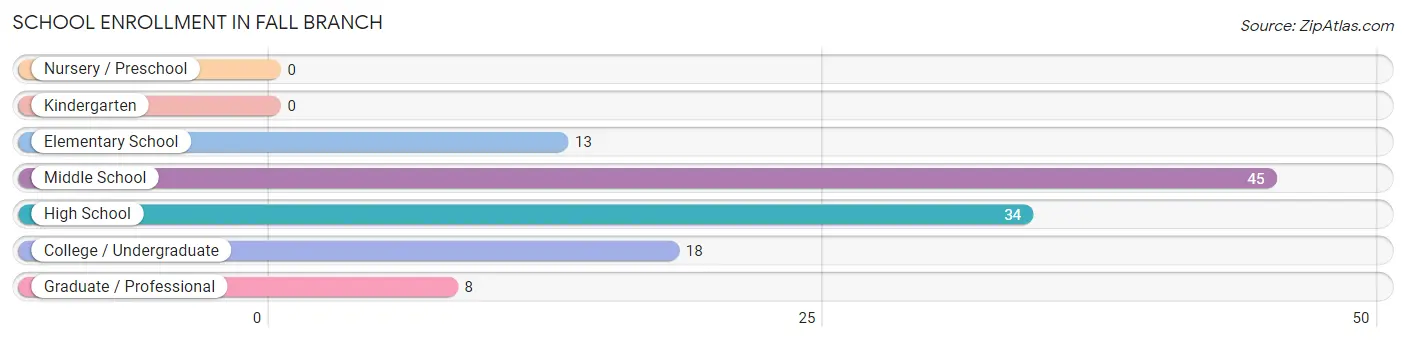
School Enrollment in Fall Branch
The most common levels of schooling among the 118 students in Fall Branch are middle school (45 | 38.1%), high school (34 | 28.8%), and college / undergraduate (18 | 15.2%).
| School Level | # Students | % Students |
| Nursery / Preschool | 0 | 0.0% |
| Kindergarten | 0 | 0.0% |
| Elementary School | 13 | 11.0% |
| Middle School | 45 | 38.1% |
| High School | 34 | 28.8% |
| College / Undergraduate | 18 | 15.2% |
| Graduate / Professional | 8 | 6.8% |
| Total | 118 | 100.0% |
School Enrollment by Age by Funding Source in Fall Branch
Out of a total of 118 students who are enrolled in schools in Fall Branch, 92 (78.0%) attend a private institution, while the remaining 26 (22.0%) are enrolled in public schools. The age group of 5 to 9 year old has the highest likelihood of being enrolled in private schools, with 13 (100.0% in the age bracket) enrolled. Conversely, the age group of 25 to 34 year olds has the lowest likelihood of being enrolled in a private school, with 18 (100.0% in the age bracket) attending a public institution.
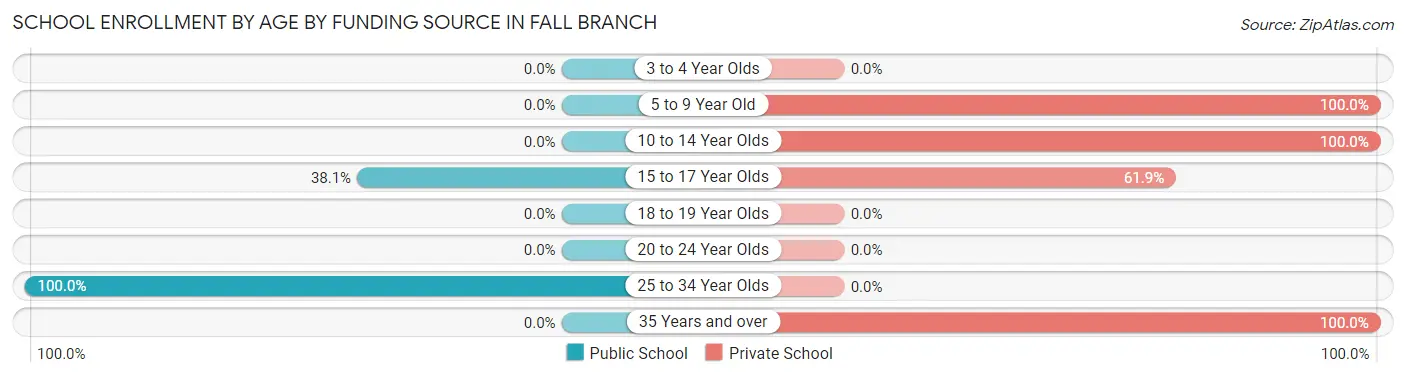
| Age Bracket | Public School | Private School |
| 3 to 4 Year Olds | 0 (0.0%) | 0 (0.0%) |
| 5 to 9 Year Old | 0 (0.0%) | 13 (100.0%) |
| 10 to 14 Year Olds | 0 (0.0%) | 58 (100.0%) |
| 15 to 17 Year Olds | 8 (38.1%) | 13 (61.9%) |
| 18 to 19 Year Olds | 0 (0.0%) | 0 (0.0%) |
| 20 to 24 Year Olds | 0 (0.0%) | 0 (0.0%) |
| 25 to 34 Year Olds | 18 (100.0%) | 0 (0.0%) |
| 35 Years and over | 0 (0.0%) | 8 (100.0%) |
| Total | 26 (22.0%) | 92 (78.0%) |
Educational Attainment by Field of Study in Fall Branch
Science & technology (51 | 28.6%), education (43 | 24.2%), computers & mathematics (18 | 10.1%), physical & health sciences (18 | 10.1%), and business (18 | 10.1%) are the most common fields of study among 178 individuals in Fall Branch who have obtained a bachelor's degree or higher.
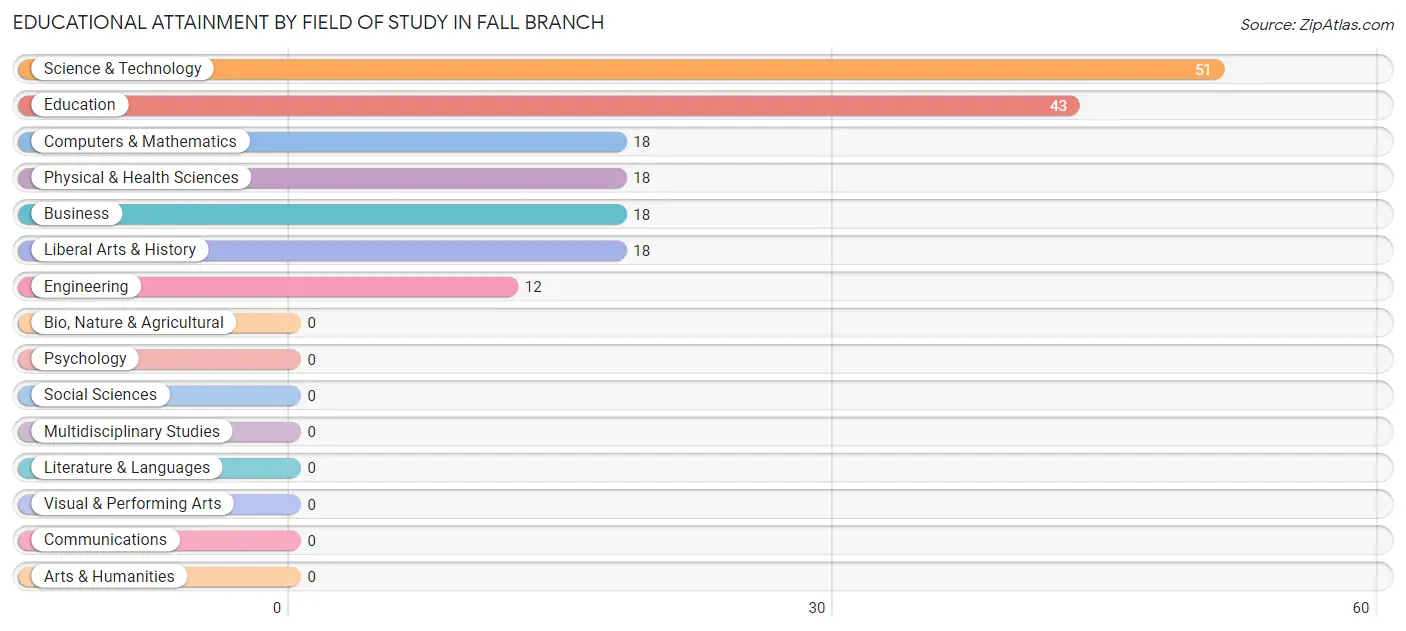
| Field of Study | # Graduates | % Graduates |
| Computers & Mathematics | 18 | 10.1% |
| Bio, Nature & Agricultural | 0 | 0.0% |
| Physical & Health Sciences | 18 | 10.1% |
| Psychology | 0 | 0.0% |
| Social Sciences | 0 | 0.0% |
| Engineering | 12 | 6.7% |
| Multidisciplinary Studies | 0 | 0.0% |
| Science & Technology | 51 | 28.6% |
| Business | 18 | 10.1% |
| Education | 43 | 24.2% |
| Literature & Languages | 0 | 0.0% |
| Liberal Arts & History | 18 | 10.1% |
| Visual & Performing Arts | 0 | 0.0% |
| Communications | 0 | 0.0% |
| Arts & Humanities | 0 | 0.0% |
| Total | 178 | 100.0% |
Transportation & Commute in Fall Branch
Vehicle Availability by Sex in Fall Branch
The most prevalent vehicle ownership categories in Fall Branch are males with 2 vehicles (155, accounting for 64.6%) and females with 2 vehicles (16, making up 178.2%).
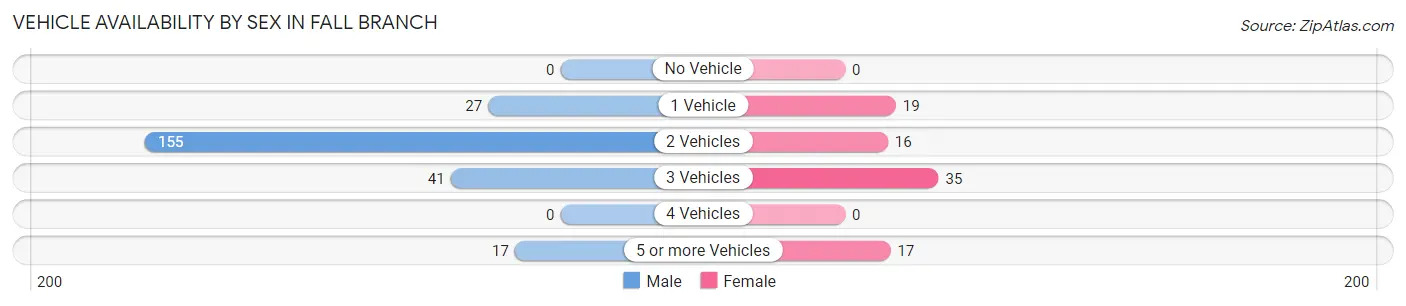
| Vehicles Available | Male | Female |
| No Vehicle | 0 (0.0%) | 0 (0.0%) |
| 1 Vehicle | 27 (11.3%) | 19 (21.8%) |
| 2 Vehicles | 155 (64.6%) | 16 (18.4%) |
| 3 Vehicles | 41 (17.1%) | 35 (40.2%) |
| 4 Vehicles | 0 (0.0%) | 0 (0.0%) |
| 5 or more Vehicles | 17 (7.1%) | 17 (19.5%) |
| Total | 240 (100.0%) | 87 (100.0%) |
Commute Time in Fall Branch
The most frequently occuring commute durations in Fall Branch are 30 to 34 minutes (72 commuters, 24.9%), 20 to 24 minutes (63 commuters, 21.8%), and 25 to 29 minutes (55 commuters, 19.0%).
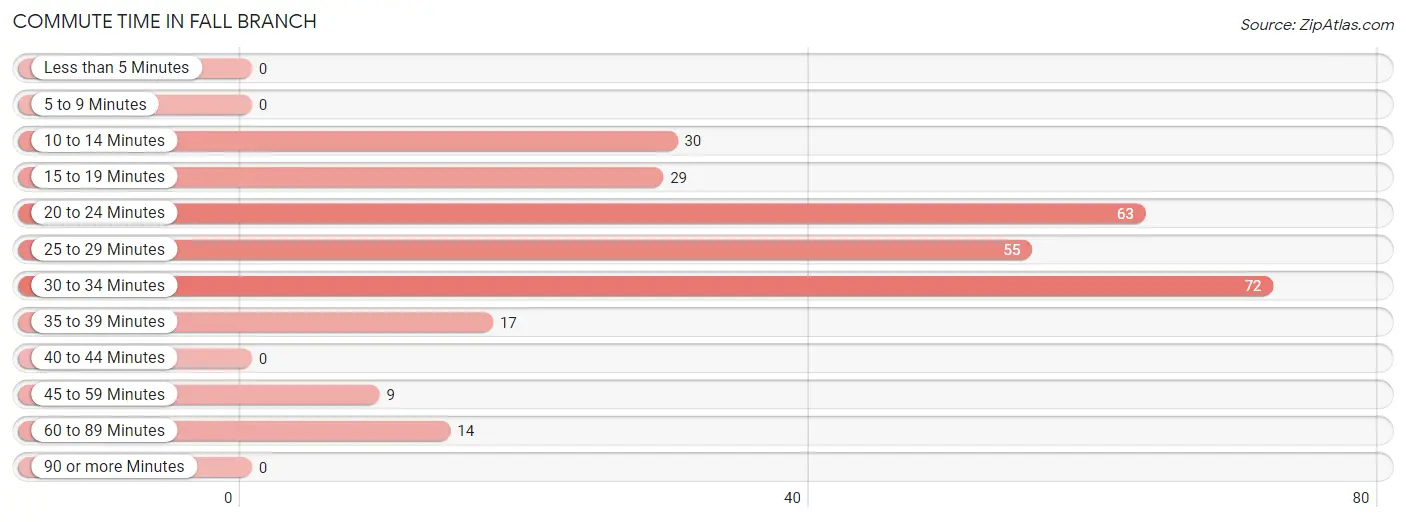
| Commute Time | # Commuters | % Commuters |
| Less than 5 Minutes | 0 | 0.0% |
| 5 to 9 Minutes | 0 | 0.0% |
| 10 to 14 Minutes | 30 | 10.4% |
| 15 to 19 Minutes | 29 | 10.0% |
| 20 to 24 Minutes | 63 | 21.8% |
| 25 to 29 Minutes | 55 | 19.0% |
| 30 to 34 Minutes | 72 | 24.9% |
| 35 to 39 Minutes | 17 | 5.9% |
| 40 to 44 Minutes | 0 | 0.0% |
| 45 to 59 Minutes | 9 | 3.1% |
| 60 to 89 Minutes | 14 | 4.8% |
| 90 or more Minutes | 0 | 0.0% |
Commute Time by Sex in Fall Branch
The most common commute times in Fall Branch are 25 to 29 minutes (55 commuters, 26.1%) for males and 20 to 24 minutes (29 commuters, 37.2%) for females.
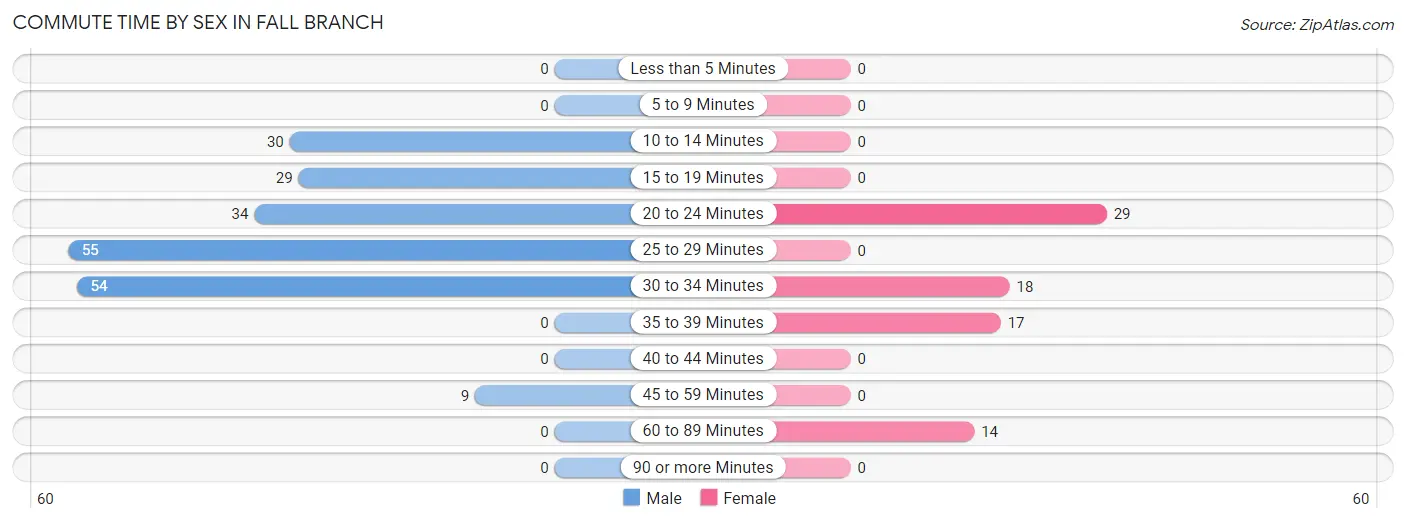
| Commute Time | Male | Female |
| Less than 5 Minutes | 0 (0.0%) | 0 (0.0%) |
| 5 to 9 Minutes | 0 (0.0%) | 0 (0.0%) |
| 10 to 14 Minutes | 30 (14.2%) | 0 (0.0%) |
| 15 to 19 Minutes | 29 (13.7%) | 0 (0.0%) |
| 20 to 24 Minutes | 34 (16.1%) | 29 (37.2%) |
| 25 to 29 Minutes | 55 (26.1%) | 0 (0.0%) |
| 30 to 34 Minutes | 54 (25.6%) | 18 (23.1%) |
| 35 to 39 Minutes | 0 (0.0%) | 17 (21.8%) |
| 40 to 44 Minutes | 0 (0.0%) | 0 (0.0%) |
| 45 to 59 Minutes | 9 (4.3%) | 0 (0.0%) |
| 60 to 89 Minutes | 0 (0.0%) | 14 (17.9%) |
| 90 or more Minutes | 0 (0.0%) | 0 (0.0%) |
Time of Departure to Work by Sex in Fall Branch
The most frequent times of departure to work in Fall Branch are 7:00 AM to 7:29 AM (46, 21.8%) for males and 7:00 AM to 7:29 AM (32, 41.0%) for females.
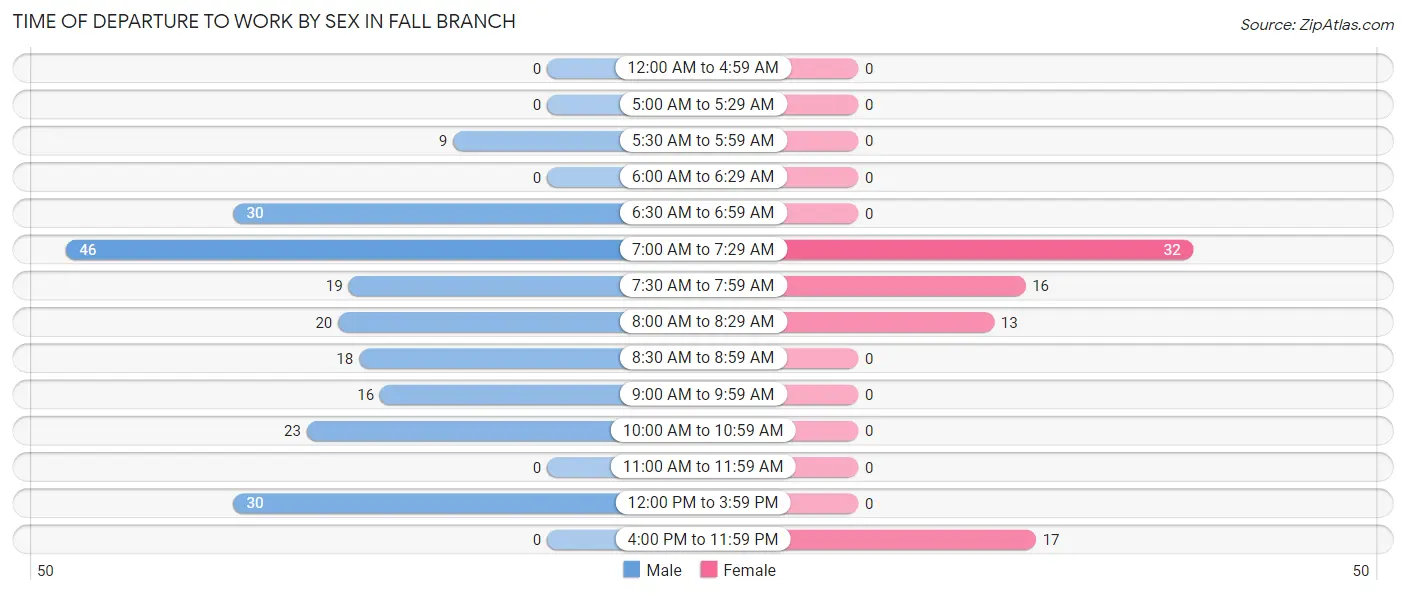
| Time of Departure | Male | Female |
| 12:00 AM to 4:59 AM | 0 (0.0%) | 0 (0.0%) |
| 5:00 AM to 5:29 AM | 0 (0.0%) | 0 (0.0%) |
| 5:30 AM to 5:59 AM | 9 (4.3%) | 0 (0.0%) |
| 6:00 AM to 6:29 AM | 0 (0.0%) | 0 (0.0%) |
| 6:30 AM to 6:59 AM | 30 (14.2%) | 0 (0.0%) |
| 7:00 AM to 7:29 AM | 46 (21.8%) | 32 (41.0%) |
| 7:30 AM to 7:59 AM | 19 (9.0%) | 16 (20.5%) |
| 8:00 AM to 8:29 AM | 20 (9.5%) | 13 (16.7%) |
| 8:30 AM to 8:59 AM | 18 (8.5%) | 0 (0.0%) |
| 9:00 AM to 9:59 AM | 16 (7.6%) | 0 (0.0%) |
| 10:00 AM to 10:59 AM | 23 (10.9%) | 0 (0.0%) |
| 11:00 AM to 11:59 AM | 0 (0.0%) | 0 (0.0%) |
| 12:00 PM to 3:59 PM | 30 (14.2%) | 0 (0.0%) |
| 4:00 PM to 11:59 PM | 0 (0.0%) | 17 (21.8%) |
| Total | 211 (100.0%) | 78 (100.0%) |
Housing Occupancy in Fall Branch
Occupancy by Ownership in Fall Branch
Of the total 443 dwellings in Fall Branch, owner-occupied units account for 381 (86.0%), while renter-occupied units make up 62 (14.0%).
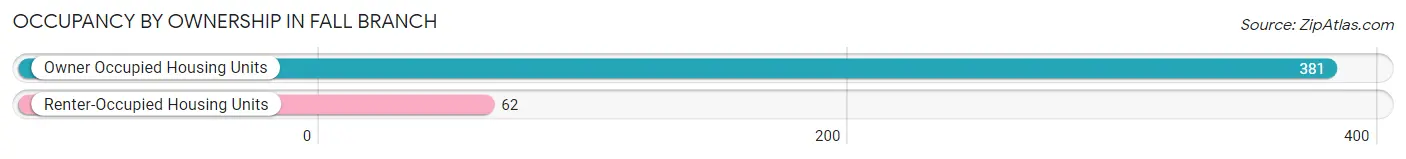
| Occupancy | # Housing Units | % Housing Units |
| Owner Occupied Housing Units | 381 | 86.0% |
| Renter-Occupied Housing Units | 62 | 14.0% |
| Total Occupied Housing Units | 443 | 100.0% |
Occupancy by Household Size in Fall Branch
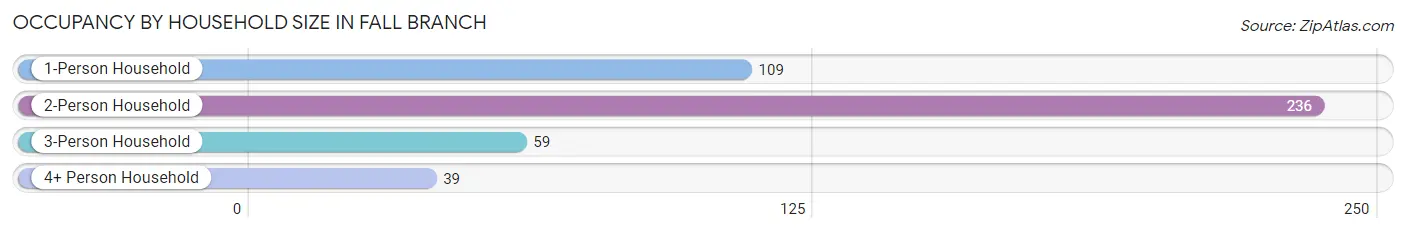
| Household Size | # Housing Units | % Housing Units |
| 1-Person Household | 109 | 24.6% |
| 2-Person Household | 236 | 53.3% |
| 3-Person Household | 59 | 13.3% |
| 4+ Person Household | 39 | 8.8% |
| Total Housing Units | 443 | 100.0% |
Occupancy by Ownership by Household Size in Fall Branch
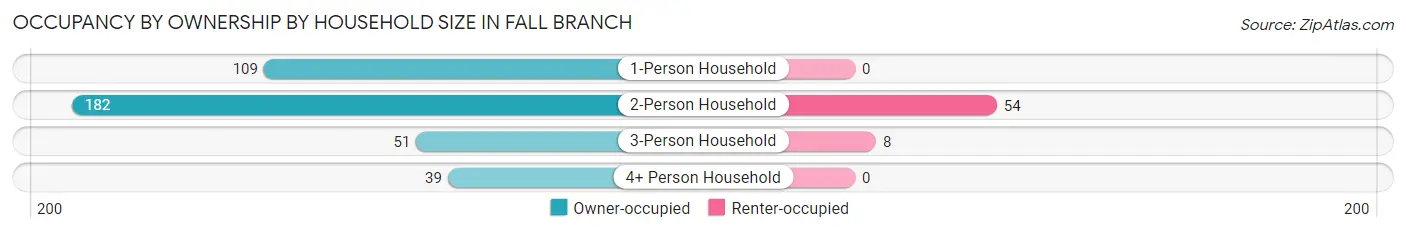
| Household Size | Owner-occupied | Renter-occupied |
| 1-Person Household | 109 (100.0%) | 0 (0.0%) |
| 2-Person Household | 182 (77.1%) | 54 (22.9%) |
| 3-Person Household | 51 (86.4%) | 8 (13.6%) |
| 4+ Person Household | 39 (100.0%) | 0 (0.0%) |
| Total Housing Units | 381 (86.0%) | 62 (14.0%) |
Occupancy by Educational Attainment in Fall Branch
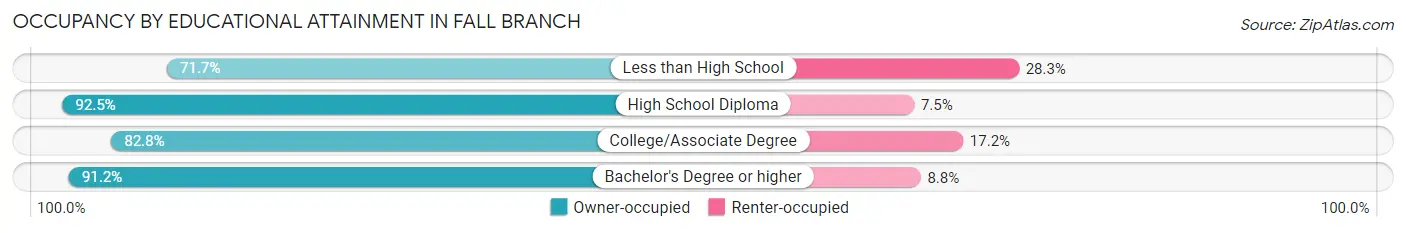
| Household Size | Owner-occupied | Renter-occupied |
| Less than High School | 33 (71.7%) | 13 (28.3%) |
| High School Diploma | 111 (92.5%) | 9 (7.5%) |
| College/Associate Degree | 154 (82.8%) | 32 (17.2%) |
| Bachelor's Degree or higher | 83 (91.2%) | 8 (8.8%) |
Occupancy by Age of Householder in Fall Branch
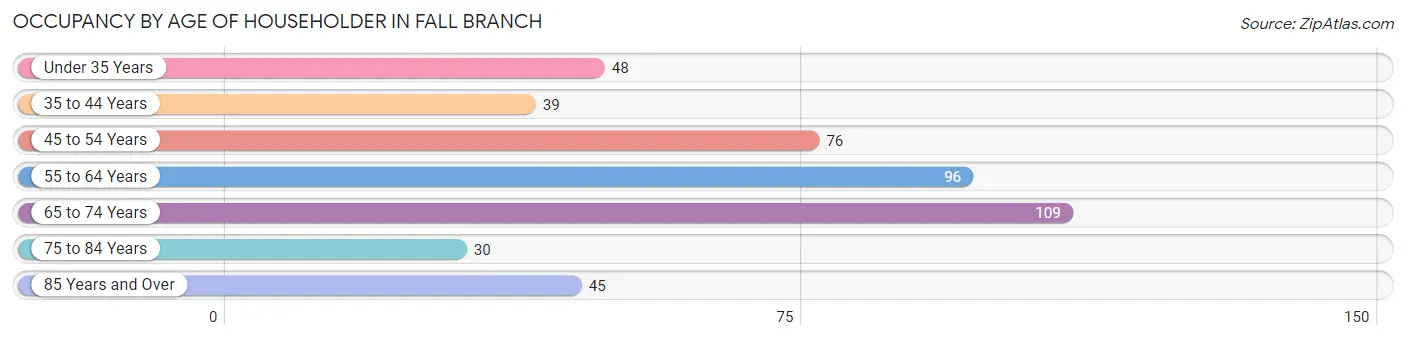
| Age Bracket | # Households | % Households |
| Under 35 Years | 48 | 10.8% |
| 35 to 44 Years | 39 | 8.8% |
| 45 to 54 Years | 76 | 17.2% |
| 55 to 64 Years | 96 | 21.7% |
| 65 to 74 Years | 109 | 24.6% |
| 75 to 84 Years | 30 | 6.8% |
| 85 Years and Over | 45 | 10.2% |
| Total | 443 | 100.0% |
Housing Finances in Fall Branch
Median Income by Occupancy in Fall Branch
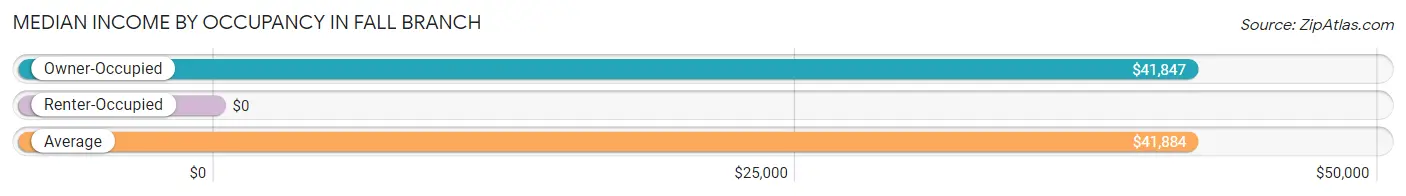
| Occupancy Type | # Households | Median Income |
| Owner-Occupied | 381 (86.0%) | $41,847 |
| Renter-Occupied | 62 (14.0%) | $0 |
| Average | 443 (100.0%) | $41,884 |
Occupancy by Householder Income Bracket in Fall Branch
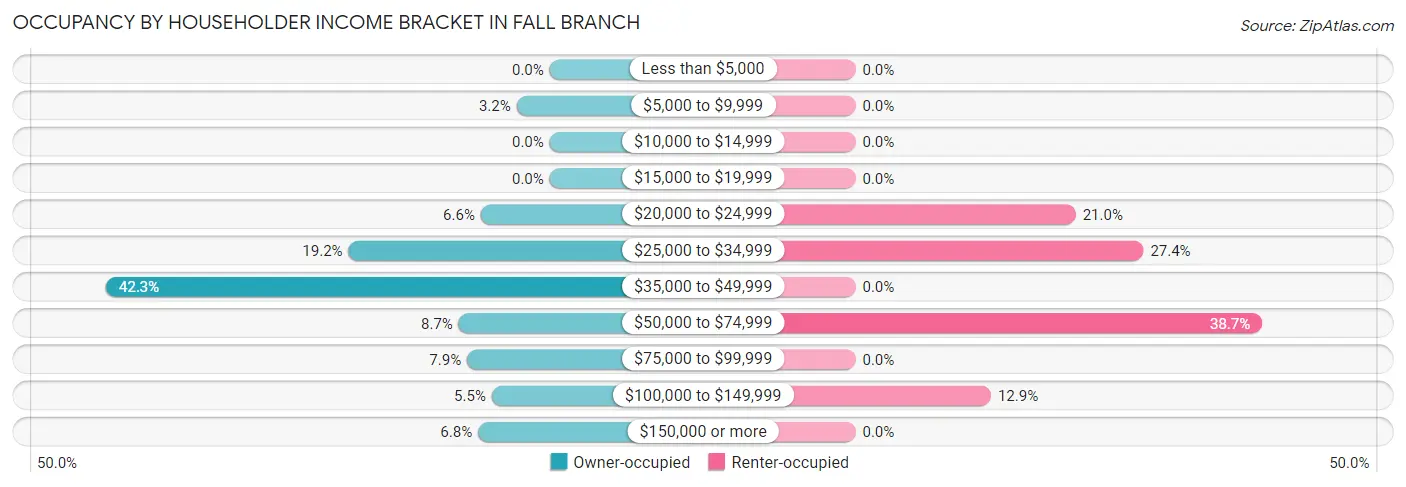
| Income Bracket | Owner-occupied | Renter-occupied |
| Less than $5,000 | 0 (0.0%) | 0 (0.0%) |
| $5,000 to $9,999 | 12 (3.2%) | 0 (0.0%) |
| $10,000 to $14,999 | 0 (0.0%) | 0 (0.0%) |
| $15,000 to $19,999 | 0 (0.0%) | 0 (0.0%) |
| $20,000 to $24,999 | 25 (6.6%) | 13 (21.0%) |
| $25,000 to $34,999 | 73 (19.2%) | 17 (27.4%) |
| $35,000 to $49,999 | 161 (42.3%) | 0 (0.0%) |
| $50,000 to $74,999 | 33 (8.7%) | 24 (38.7%) |
| $75,000 to $99,999 | 30 (7.9%) | 0 (0.0%) |
| $100,000 to $149,999 | 21 (5.5%) | 8 (12.9%) |
| $150,000 or more | 26 (6.8%) | 0 (0.0%) |
| Total | 381 (100.0%) | 62 (100.0%) |
Monthly Housing Cost Tiers in Fall Branch
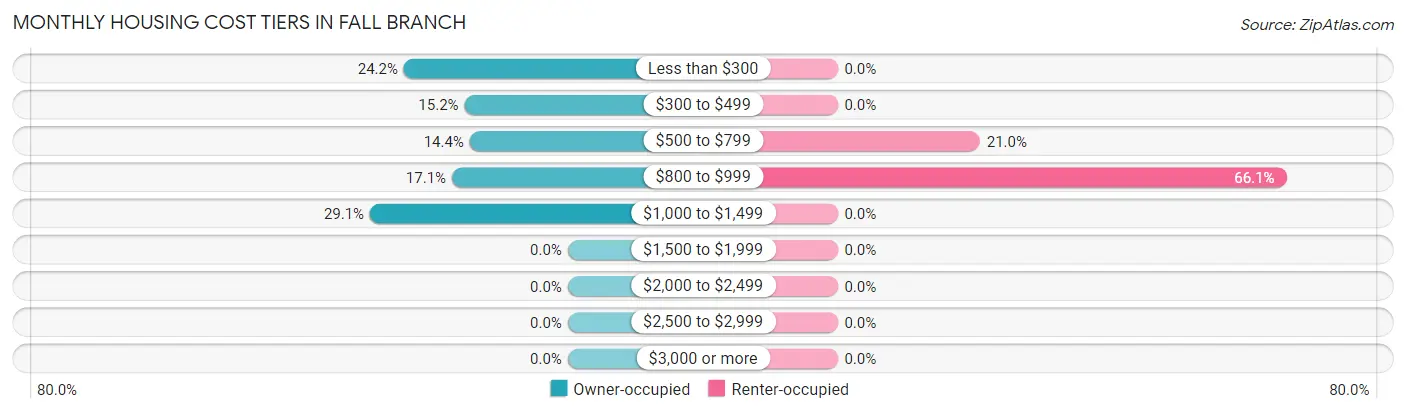
| Monthly Cost | Owner-occupied | Renter-occupied |
| Less than $300 | 92 (24.1%) | 0 (0.0%) |
| $300 to $499 | 58 (15.2%) | 0 (0.0%) |
| $500 to $799 | 55 (14.4%) | 13 (21.0%) |
| $800 to $999 | 65 (17.1%) | 41 (66.1%) |
| $1,000 to $1,499 | 111 (29.1%) | 0 (0.0%) |
| $1,500 to $1,999 | 0 (0.0%) | 0 (0.0%) |
| $2,000 to $2,499 | 0 (0.0%) | 0 (0.0%) |
| $2,500 to $2,999 | 0 (0.0%) | 0 (0.0%) |
| $3,000 or more | 0 (0.0%) | 0 (0.0%) |
| Total | 381 (100.0%) | 62 (100.0%) |
Physical Housing Characteristics in Fall Branch
Housing Structures in Fall Branch
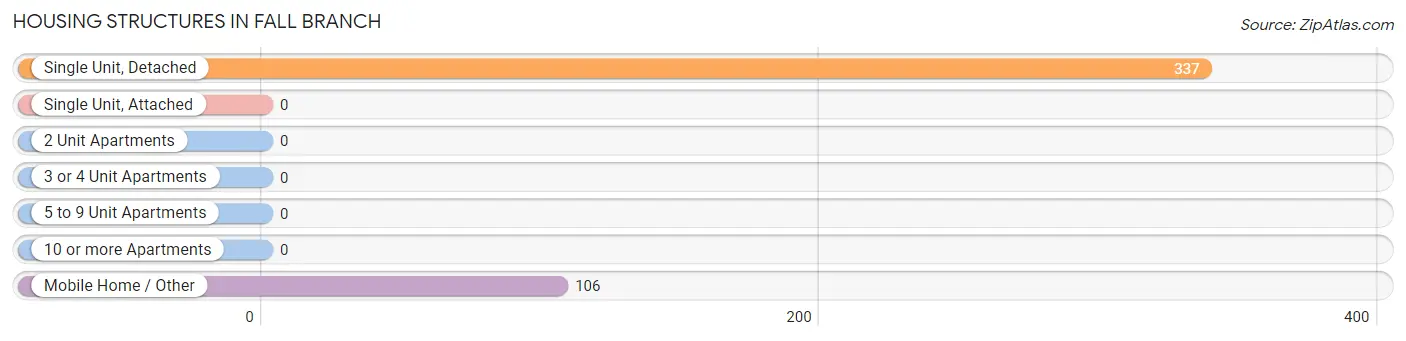
| Structure Type | # Housing Units | % Housing Units |
| Single Unit, Detached | 337 | 76.1% |
| Single Unit, Attached | 0 | 0.0% |
| 2 Unit Apartments | 0 | 0.0% |
| 3 or 4 Unit Apartments | 0 | 0.0% |
| 5 to 9 Unit Apartments | 0 | 0.0% |
| 10 or more Apartments | 0 | 0.0% |
| Mobile Home / Other | 106 | 23.9% |
| Total | 443 | 100.0% |
Housing Structures by Occupancy in Fall Branch
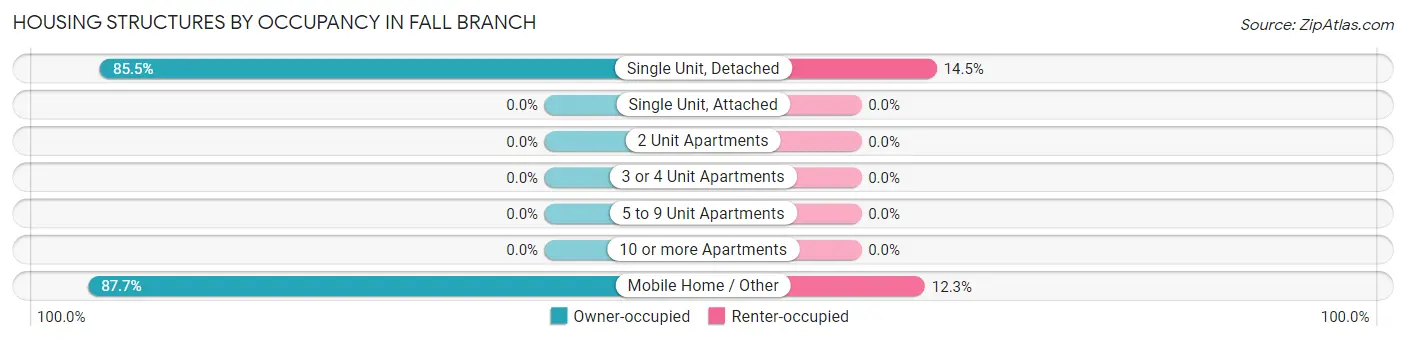
| Structure Type | Owner-occupied | Renter-occupied |
| Single Unit, Detached | 288 (85.5%) | 49 (14.5%) |
| Single Unit, Attached | 0 (0.0%) | 0 (0.0%) |
| 2 Unit Apartments | 0 (0.0%) | 0 (0.0%) |
| 3 or 4 Unit Apartments | 0 (0.0%) | 0 (0.0%) |
| 5 to 9 Unit Apartments | 0 (0.0%) | 0 (0.0%) |
| 10 or more Apartments | 0 (0.0%) | 0 (0.0%) |
| Mobile Home / Other | 93 (87.7%) | 13 (12.3%) |
| Total | 381 (86.0%) | 62 (14.0%) |
Housing Structures by Number of Rooms in Fall Branch
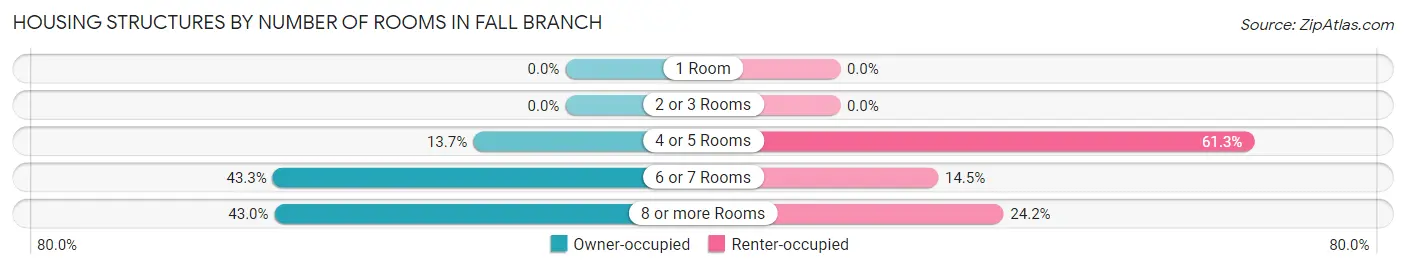
| Number of Rooms | Owner-occupied | Renter-occupied |
| 1 Room | 0 (0.0%) | 0 (0.0%) |
| 2 or 3 Rooms | 0 (0.0%) | 0 (0.0%) |
| 4 or 5 Rooms | 52 (13.7%) | 38 (61.3%) |
| 6 or 7 Rooms | 165 (43.3%) | 9 (14.5%) |
| 8 or more Rooms | 164 (43.0%) | 15 (24.2%) |
| Total | 381 (100.0%) | 62 (100.0%) |
Housing Structure by Heating Type in Fall Branch
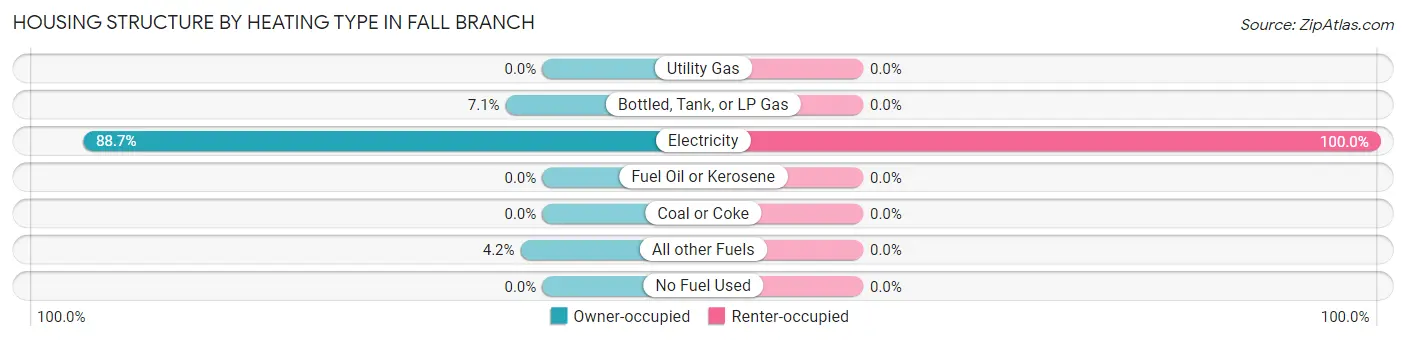
| Heating Type | Owner-occupied | Renter-occupied |
| Utility Gas | 0 (0.0%) | 0 (0.0%) |
| Bottled, Tank, or LP Gas | 27 (7.1%) | 0 (0.0%) |
| Electricity | 338 (88.7%) | 62 (100.0%) |
| Fuel Oil or Kerosene | 0 (0.0%) | 0 (0.0%) |
| Coal or Coke | 0 (0.0%) | 0 (0.0%) |
| All other Fuels | 16 (4.2%) | 0 (0.0%) |
| No Fuel Used | 0 (0.0%) | 0 (0.0%) |
| Total | 381 (100.0%) | 62 (100.0%) |
Household Vehicle Usage in Fall Branch
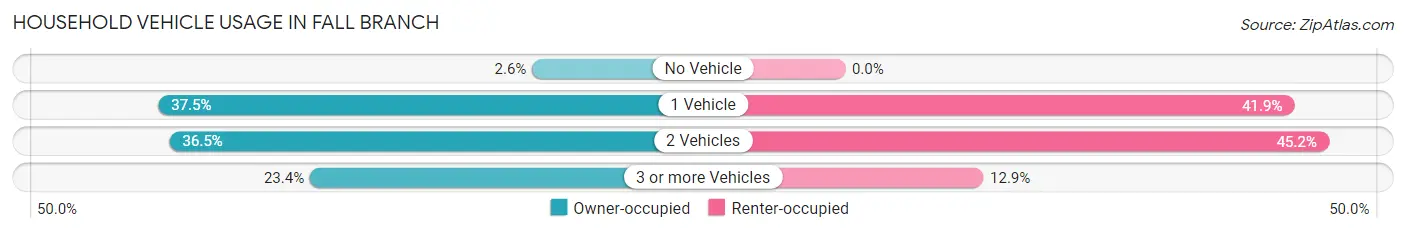
| Vehicles per Household | Owner-occupied | Renter-occupied |
| No Vehicle | 10 (2.6%) | 0 (0.0%) |
| 1 Vehicle | 143 (37.5%) | 26 (41.9%) |
| 2 Vehicles | 139 (36.5%) | 28 (45.2%) |
| 3 or more Vehicles | 89 (23.4%) | 8 (12.9%) |
| Total | 381 (100.0%) | 62 (100.0%) |
Real Estate & Mortgages in Fall Branch
Real Estate and Mortgage Overview in Fall Branch
| Characteristic | Without Mortgage | With Mortgage |
| Housing Units | 178 | 203 |
| Median Property Value | $153,800 | $107,100 |
| Median Household Income | $37,188 | $26 |
| Monthly Housing Costs | $296 | $0 |
| Real Estate Taxes | $852 | $16 |
Property Value by Mortgage Status in Fall Branch
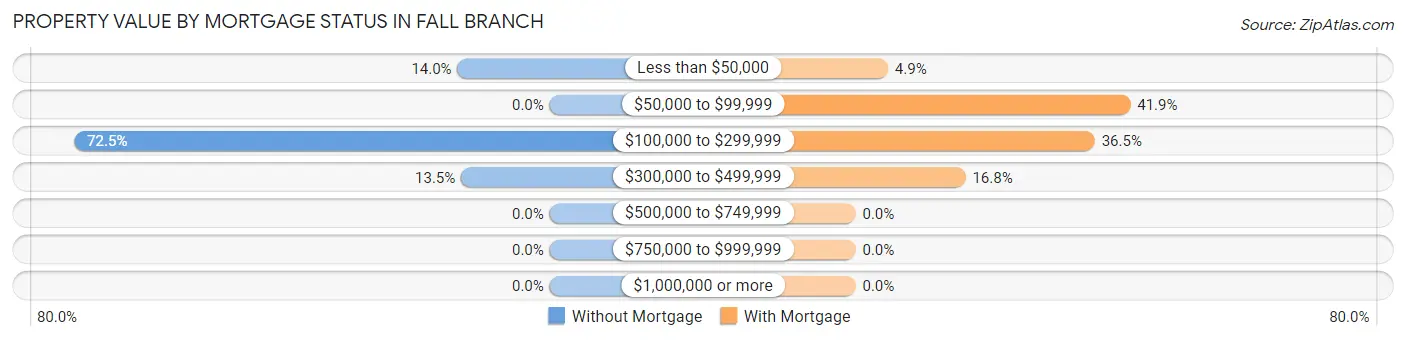
| Property Value | Without Mortgage | With Mortgage |
| Less than $50,000 | 25 (14.0%) | 10 (4.9%) |
| $50,000 to $99,999 | 0 (0.0%) | 85 (41.9%) |
| $100,000 to $299,999 | 129 (72.5%) | 74 (36.4%) |
| $300,000 to $499,999 | 24 (13.5%) | 34 (16.8%) |
| $500,000 to $749,999 | 0 (0.0%) | 0 (0.0%) |
| $750,000 to $999,999 | 0 (0.0%) | 0 (0.0%) |
| $1,000,000 or more | 0 (0.0%) | 0 (0.0%) |
| Total | 178 (100.0%) | 203 (100.0%) |
Household Income by Mortgage Status in Fall Branch
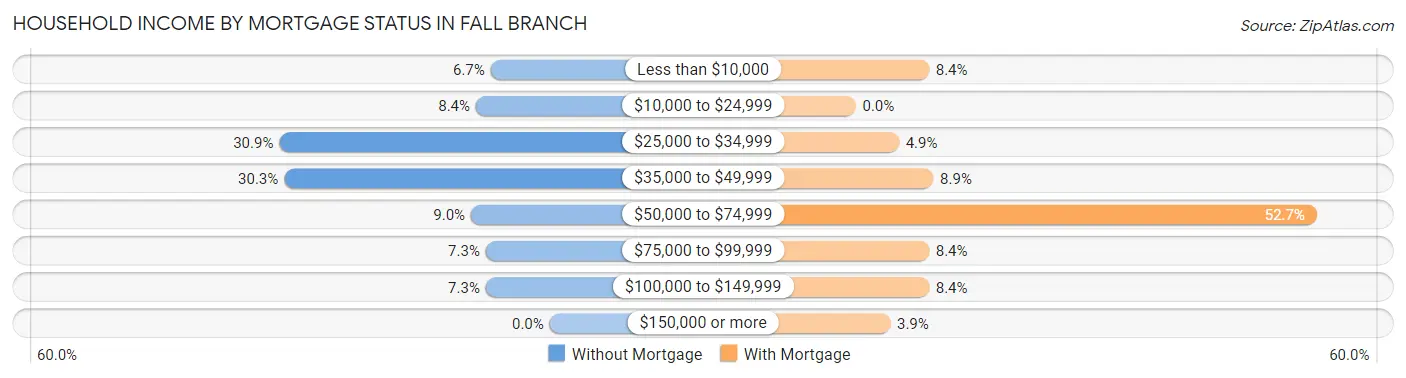
| Household Income | Without Mortgage | With Mortgage |
| Less than $10,000 | 12 (6.7%) | 17 (8.4%) |
| $10,000 to $24,999 | 15 (8.4%) | 0 (0.0%) |
| $25,000 to $34,999 | 55 (30.9%) | 10 (4.9%) |
| $35,000 to $49,999 | 54 (30.3%) | 18 (8.9%) |
| $50,000 to $74,999 | 16 (9.0%) | 107 (52.7%) |
| $75,000 to $99,999 | 13 (7.3%) | 17 (8.4%) |
| $100,000 to $149,999 | 13 (7.3%) | 17 (8.4%) |
| $150,000 or more | 0 (0.0%) | 8 (3.9%) |
| Total | 178 (100.0%) | 203 (100.0%) |
Property Value to Household Income Ratio in Fall Branch
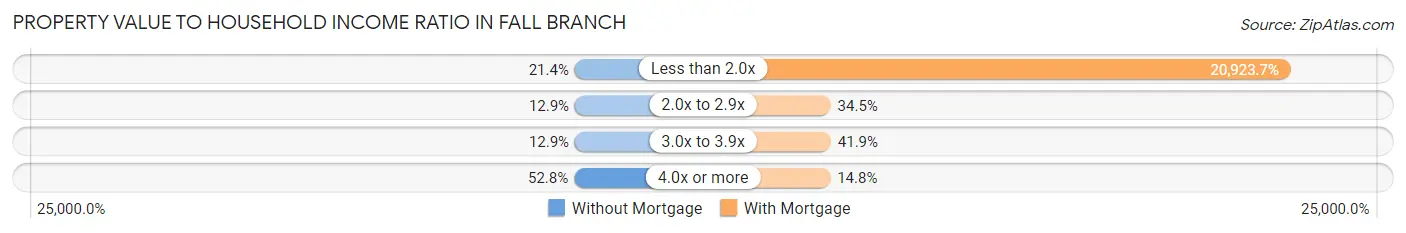
| Value-to-Income Ratio | Without Mortgage | With Mortgage |
| Less than 2.0x | 38 (21.3%) | 42,475 (20,923.7%) |
| 2.0x to 2.9x | 23 (12.9%) | 70 (34.5%) |
| 3.0x to 3.9x | 23 (12.9%) | 85 (41.9%) |
| 4.0x or more | 94 (52.8%) | 30 (14.8%) |
| Total | 178 (100.0%) | 203 (100.0%) |
Real Estate Taxes by Mortgage Status in Fall Branch

| Property Taxes | Without Mortgage | With Mortgage |
| Less than $800 | 62 (34.8%) | 0 (0.0%) |
| $800 to $1,499 | 80 (44.9%) | 179 (88.2%) |
| $800 to $1,499 | 12 (6.7%) | 8 (3.9%) |
| Total | 178 (100.0%) | 203 (100.0%) |
Health & Disability in Fall Branch
Health Insurance Coverage by Age in Fall Branch
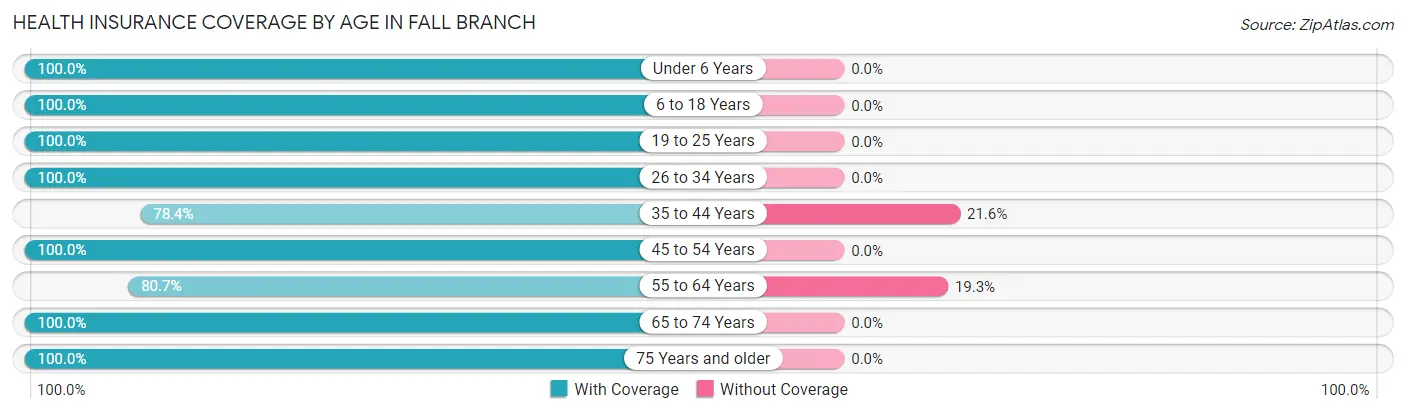
| Age Bracket | With Coverage | Without Coverage |
| Under 6 Years | 24 (100.0%) | 0 (0.0%) |
| 6 to 18 Years | 92 (100.0%) | 0 (0.0%) |
| 19 to 25 Years | 75 (100.0%) | 0 (0.0%) |
| 26 to 34 Years | 110 (100.0%) | 0 (0.0%) |
| 35 to 44 Years | 109 (78.4%) | 30 (21.6%) |
| 45 to 54 Years | 133 (100.0%) | 0 (0.0%) |
| 55 to 64 Years | 121 (80.7%) | 29 (19.3%) |
| 65 to 74 Years | 170 (100.0%) | 0 (0.0%) |
| 75 Years and older | 91 (100.0%) | 0 (0.0%) |
| Total | 925 (94.0%) | 59 (6.0%) |
Health Insurance Coverage by Citizenship Status in Fall Branch

| Citizenship Status | With Coverage | Without Coverage |
| Native Born | 24 (100.0%) | 0 (0.0%) |
| Foreign Born, Citizen | 92 (100.0%) | 0 (0.0%) |
| Foreign Born, not a Citizen | 75 (100.0%) | 0 (0.0%) |
Health Insurance Coverage by Household Income in Fall Branch
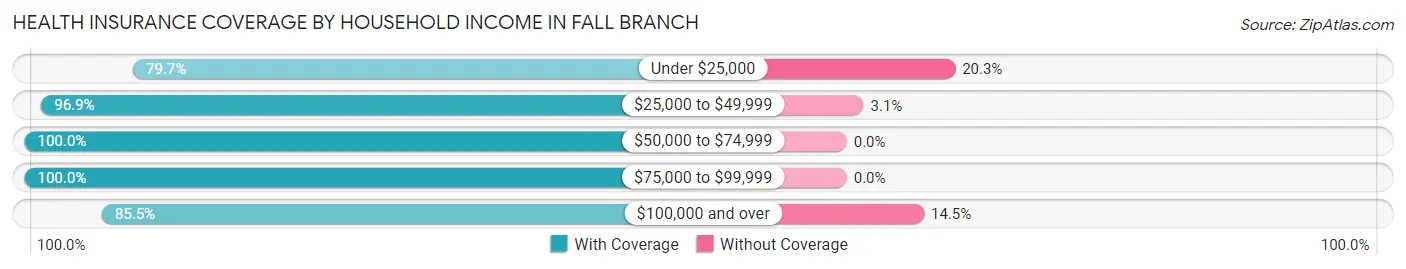
| Household Income | With Coverage | Without Coverage |
| Under $25,000 | 51 (79.7%) | 13 (20.3%) |
| $25,000 to $49,999 | 494 (96.9%) | 16 (3.1%) |
| $50,000 to $74,999 | 122 (100.0%) | 0 (0.0%) |
| $75,000 to $99,999 | 81 (100.0%) | 0 (0.0%) |
| $100,000 and over | 177 (85.5%) | 30 (14.5%) |
Public vs Private Health Insurance Coverage by Age in Fall Branch
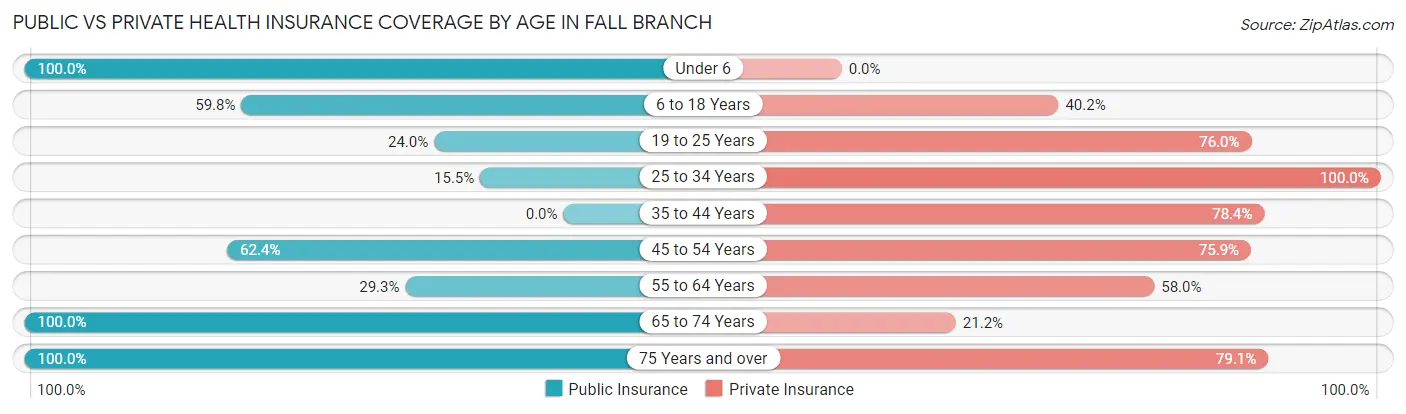
| Age Bracket | Public Insurance | Private Insurance |
| Under 6 | 24 (100.0%) | 0 (0.0%) |
| 6 to 18 Years | 55 (59.8%) | 37 (40.2%) |
| 19 to 25 Years | 18 (24.0%) | 57 (76.0%) |
| 25 to 34 Years | 17 (15.4%) | 110 (100.0%) |
| 35 to 44 Years | 0 (0.0%) | 109 (78.4%) |
| 45 to 54 Years | 83 (62.4%) | 101 (75.9%) |
| 55 to 64 Years | 44 (29.3%) | 87 (58.0%) |
| 65 to 74 Years | 170 (100.0%) | 36 (21.2%) |
| 75 Years and over | 91 (100.0%) | 72 (79.1%) |
| Total | 502 (51.0%) | 609 (61.9%) |
Disability Status by Sex by Age in Fall Branch
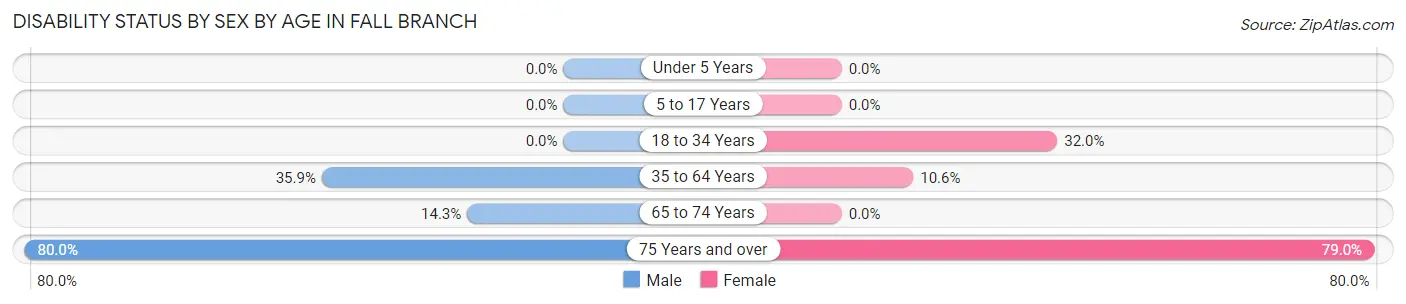
| Age Bracket | Male | Female |
| Under 5 Years | 0 (0.0%) | 0 (0.0%) |
| 5 to 17 Years | 0 (0.0%) | 0 (0.0%) |
| 18 to 34 Years | 0 (0.0%) | 16 (32.0%) |
| 35 to 64 Years | 94 (35.9%) | 17 (10.6%) |
| 65 to 74 Years | 12 (14.3%) | 0 (0.0%) |
| 75 Years and over | 8 (80.0%) | 64 (79.0%) |
Disability Class by Sex by Age in Fall Branch
Disability Class: Hearing Difficulty
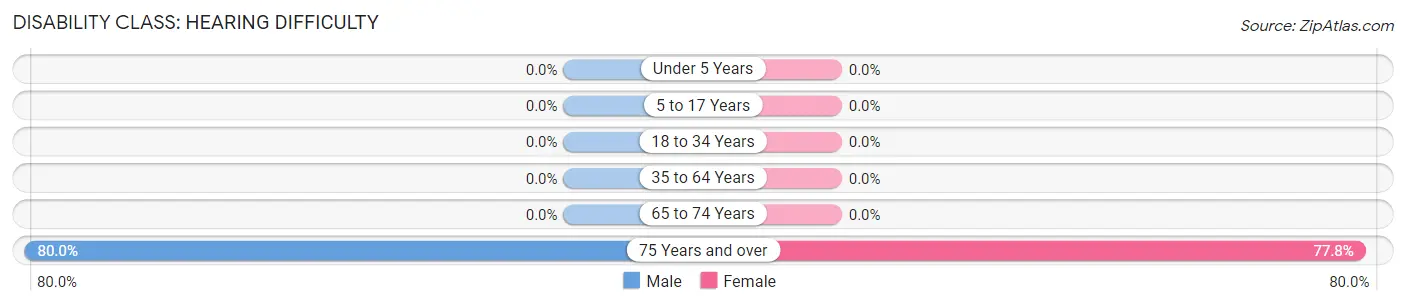
| Age Bracket | Male | Female |
| Under 5 Years | 0 (0.0%) | 0 (0.0%) |
| 5 to 17 Years | 0 (0.0%) | 0 (0.0%) |
| 18 to 34 Years | 0 (0.0%) | 0 (0.0%) |
| 35 to 64 Years | 0 (0.0%) | 0 (0.0%) |
| 65 to 74 Years | 0 (0.0%) | 0 (0.0%) |
| 75 Years and over | 8 (80.0%) | 63 (77.8%) |
Disability Class: Vision Difficulty
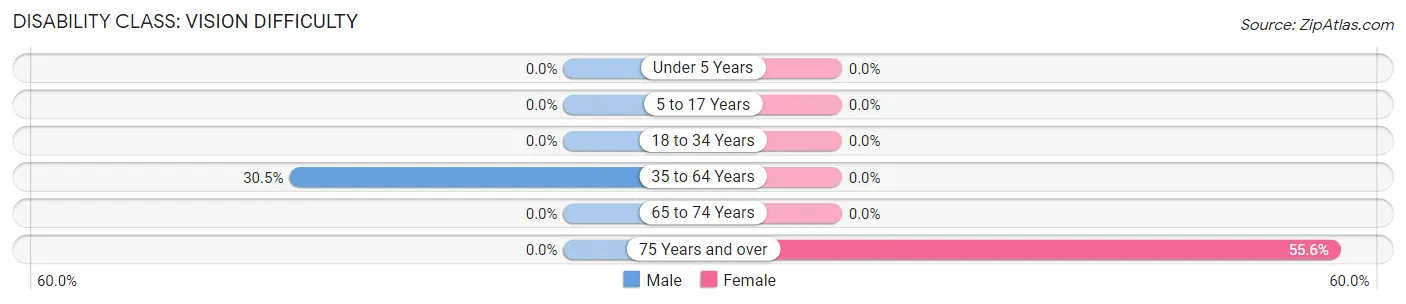
| Age Bracket | Male | Female |
| Under 5 Years | 0 (0.0%) | 0 (0.0%) |
| 5 to 17 Years | 0 (0.0%) | 0 (0.0%) |
| 18 to 34 Years | 0 (0.0%) | 0 (0.0%) |
| 35 to 64 Years | 80 (30.5%) | 0 (0.0%) |
| 65 to 74 Years | 0 (0.0%) | 0 (0.0%) |
| 75 Years and over | 0 (0.0%) | 45 (55.6%) |
Disability Class: Cognitive Difficulty
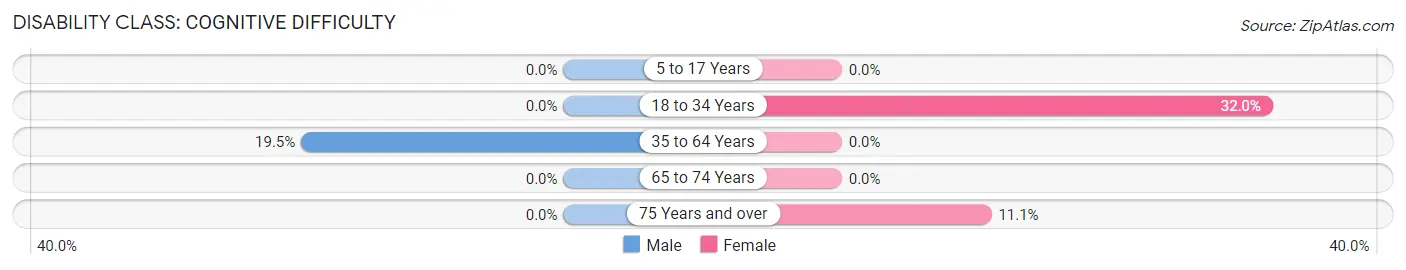
| Age Bracket | Male | Female |
| 5 to 17 Years | 0 (0.0%) | 0 (0.0%) |
| 18 to 34 Years | 0 (0.0%) | 16 (32.0%) |
| 35 to 64 Years | 51 (19.5%) | 0 (0.0%) |
| 65 to 74 Years | 0 (0.0%) | 0 (0.0%) |
| 75 Years and over | 0 (0.0%) | 9 (11.1%) |
Disability Class: Ambulatory Difficulty
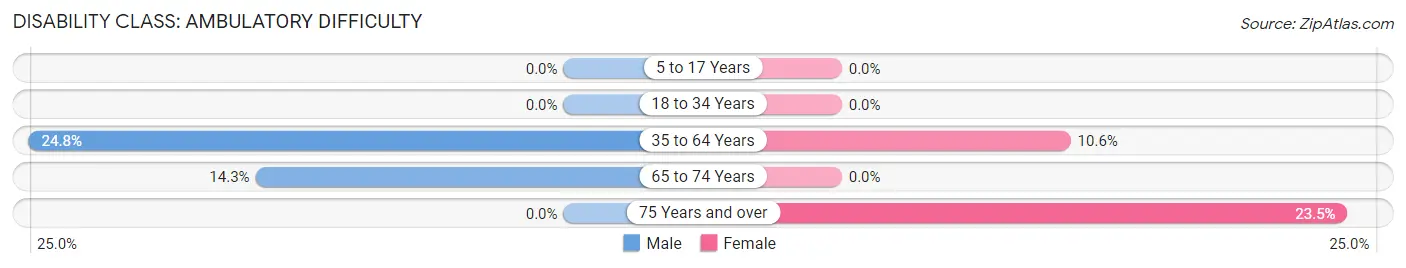
| Age Bracket | Male | Female |
| 5 to 17 Years | 0 (0.0%) | 0 (0.0%) |
| 18 to 34 Years | 0 (0.0%) | 0 (0.0%) |
| 35 to 64 Years | 65 (24.8%) | 17 (10.6%) |
| 65 to 74 Years | 12 (14.3%) | 0 (0.0%) |
| 75 Years and over | 0 (0.0%) | 19 (23.5%) |
Disability Class: Self-Care Difficulty
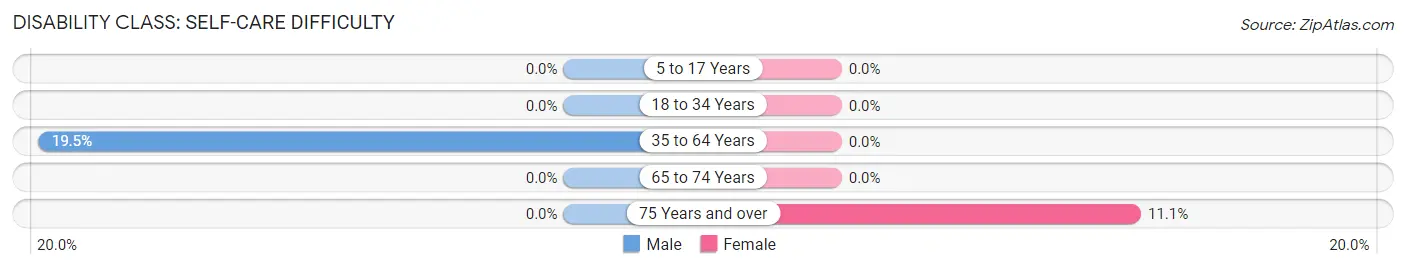
| Age Bracket | Male | Female |
| 5 to 17 Years | 0 (0.0%) | 0 (0.0%) |
| 18 to 34 Years | 0 (0.0%) | 0 (0.0%) |
| 35 to 64 Years | 51 (19.5%) | 0 (0.0%) |
| 65 to 74 Years | 0 (0.0%) | 0 (0.0%) |
| 75 Years and over | 0 (0.0%) | 9 (11.1%) |
Technology Access in Fall Branch
Computing Device Access in Fall Branch
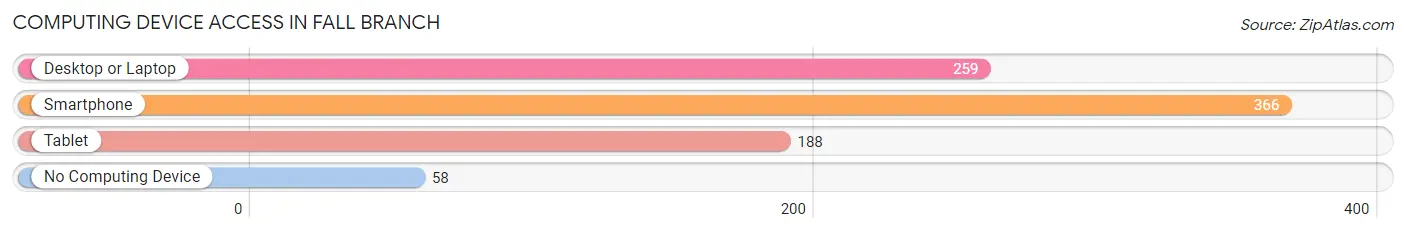
| Device Type | # Households | % Households |
| Desktop or Laptop | 259 | 58.5% |
| Smartphone | 366 | 82.6% |
| Tablet | 188 | 42.4% |
| No Computing Device | 58 | 13.1% |
| Total | 443 | 100.0% |
Internet Access in Fall Branch
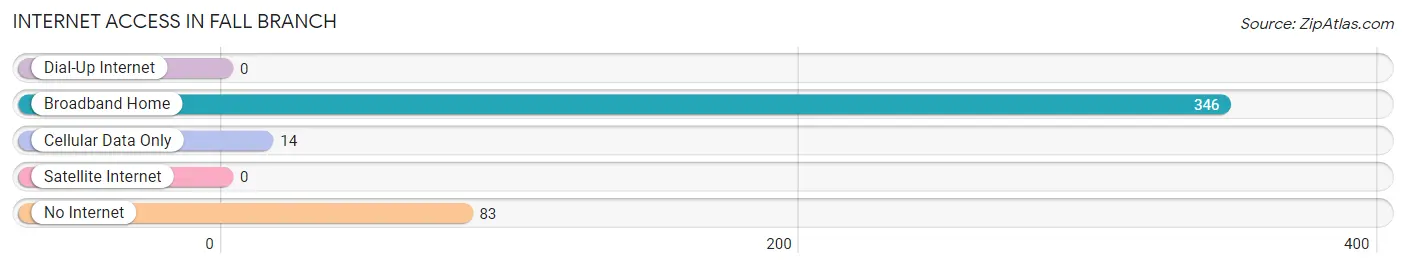
| Internet Type | # Households | % Households |
| Dial-Up Internet | 0 | 0.0% |
| Broadband Home | 346 | 78.1% |
| Cellular Data Only | 14 | 3.2% |
| Satellite Internet | 0 | 0.0% |
| No Internet | 83 | 18.7% |
| Total | 443 | 100.0% |
Fall Branch Summary
Fall Branch is a small unincorporated community located in Washington County, Tennessee. It is situated in the northeastern corner of the state, just south of the Virginia border. The population of Fall Branch was estimated to be 1,845 in 2019.
History
The area that is now Fall Branch was first settled in the late 1700s by a group of settlers from North Carolina. The settlement was originally known as “Falls Branch”, named after the nearby creek. The creek was named for the numerous waterfalls that were located along its course. The settlement was officially incorporated in 1820 and the name was changed to “Fall Branch”.
The town grew slowly over the years, but it was not until the late 1800s that it began to experience significant growth. This was due to the construction of the East Tennessee and Virginia Railroad, which ran through the town. The railroad brought new businesses and industries to the area, and Fall Branch soon became a thriving community.
Geography
Fall Branch is located in the northeastern corner of Tennessee, just south of the Virginia border. It is situated in the Appalachian Mountains, and the terrain is mostly hilly and forested. The town is located along the Nolichucky River, which is a tributary of the French Broad River. The town is also located near the Cherokee National Forest, which is a popular destination for outdoor recreation.
Economy
The economy of Fall Branch is largely based on agriculture and manufacturing. The town is home to several farms, which produce a variety of crops, including corn, soybeans, and hay. There are also several manufacturing plants in the area, which produce a variety of products, including furniture, textiles, and automotive parts.
The town is also home to several small businesses, including restaurants, retail stores, and service providers. The town is also home to a branch of the Washington County Public Library, which provides access to books, magazines, and other resources.
Demographics
As of the 2019 census, the population of Fall Branch was estimated to be 1,845. The racial makeup of the town was 95.3% White, 1.2% African American, 0.3% Native American, 0.2% Asian, 0.1% Pacific Islander, and 2.9% from other races. The median household income was $37,917, and the median home value was $127,400.
Conclusion
Fall Branch is a small unincorporated community located in Washington County, Tennessee. It is situated in the northeastern corner of the state, just south of the Virginia border. The population of Fall Branch was estimated to be 1,845 in 2019. The economy of Fall Branch is largely based on agriculture and manufacturing, and the town is home to several small businesses. The racial makeup of the town was 95.3% White, 1.2% African American, 0.3% Native American, 0.2% Asian, 0.1% Pacific Islander, and 2.9% from other races. The median household income was $37,917, and the median home value was $127,400.
Common Questions
What is Per Capita Income in Fall Branch?
Per Capita income in Fall Branch is $36,705.
What is the Median Family Income in Fall Branch?
Median Family Income in Fall Branch is $47,379.
What is the Median Household income in Fall Branch?
Median Household Income in Fall Branch is $41,884.
What is Income or Wage Gap in Fall Branch?
Income or Wage Gap in Fall Branch is 14.7%.
Women in Fall Branch earn 85.3 cents for every dollar earned by a man.
What is Inequality or Gini Index in Fall Branch?
Inequality or Gini Index in Fall Branch is 0.51.
What is the Total Population of Fall Branch?
Total Population of Fall Branch is 984.
What is the Total Male Population of Fall Branch?
Total Male Population of Fall Branch is 575.
What is the Total Female Population of Fall Branch?
Total Female Population of Fall Branch is 409.
What is the Ratio of Males per 100 Females in Fall Branch?
There are 140.59 Males per 100 Females in Fall Branch.
What is the Ratio of Females per 100 Males in Fall Branch?
There are 71.13 Females per 100 Males in Fall Branch.
What is the Median Population Age in Fall Branch?
Median Population Age in Fall Branch is 48.9 Years.
What is the Average Family Size in Fall Branch
Average Family Size in Fall Branch is 2.7 People.
What is the Average Household Size in Fall Branch
Average Household Size in Fall Branch is 2.2 People.
How Large is the Labor Force in Fall Branch?
There are 344 People in the Labor Forcein in Fall Branch.
What is the Percentage of People in the Labor Force in Fall Branch?
39.6% of People are in the Labor Force in Fall Branch.