Walnut Hill, TN Map & Demographics
Walnut Hill Map
Walnut Hill Overview
$27,491
PER CAPITA INCOME
$67,433
AVG FAMILY INCOME
$64,250
AVG HOUSEHOLD INCOME
0.39
INEQUALITY / GINI INDEX
2,648
TOTAL POPULATION
1,486
MALE POPULATION
1,162
FEMALE POPULATION
127.88
MALES / 100 FEMALES
78.20
FEMALES / 100 MALES
46.1
MEDIAN AGE
3.8
AVG FAMILY SIZE
3.1
AVG HOUSEHOLD SIZE
1,041
LABOR FORCE [ PEOPLE ]
45.7%
PERCENT IN LABOR FORCE
6.0%
UNEMPLOYMENT RATE
Income in Walnut Hill
Income Overview in Walnut Hill
Per Capita Income in Walnut Hill is $27,491, while median incomes of families and households are $67,433 and $64,250 respectively.
| Characteristic | Number | Measure |
| Per Capita Income | 2,648 | $27,491 |
| Median Family Income | 585 | $67,433 |
| Mean Family Income | 585 | $85,574 |
| Median Household Income | 861 | $64,250 |
| Mean Household Income | 861 | $79,296 |
| Income Deficit | 585 | $0 |
| Wage / Income Gap (%) | 2,648 | 0.00% |
| Wage / Income Gap ($) | 2,648 | 100.00¢ per $1 |
| Gini / Inequality Index | 2,648 | 0.39 |
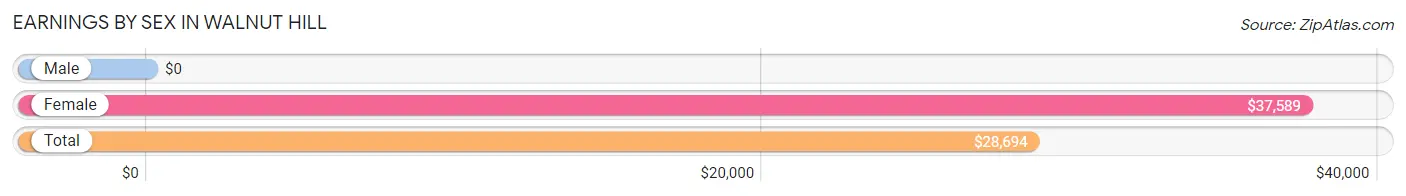
Earnings by Sex in Walnut Hill
| Sex | Number | Average Earnings |
| Male | 915 (67.2%) | $0 |
| Female | 446 (32.8%) | $37,589 |
| Total | 1,361 (100.0%) | $28,694 |
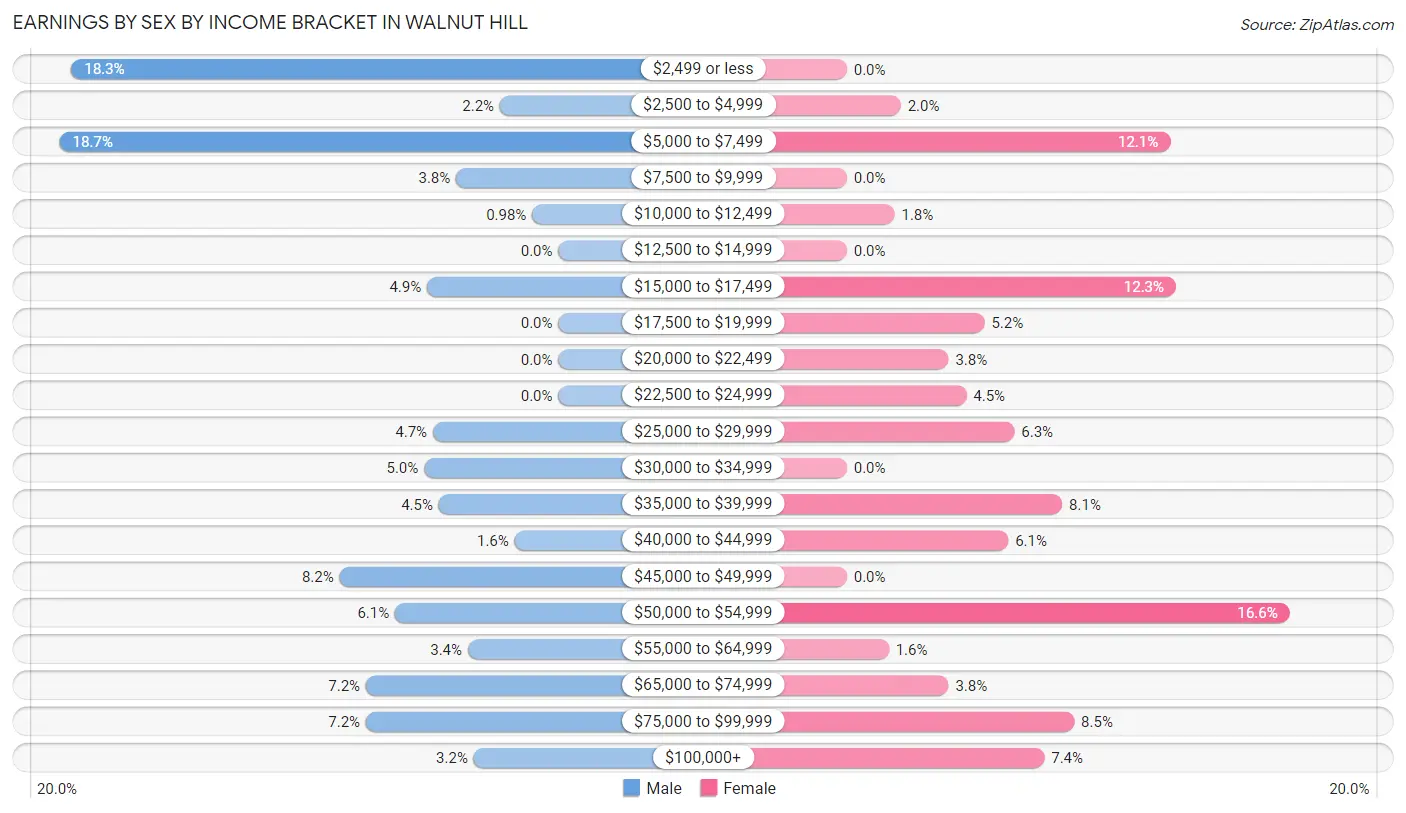
Earnings by Sex by Income Bracket in Walnut Hill
The most common earnings brackets in Walnut Hill are $5,000 to $7,499 for men (171 | 18.7%) and $50,000 to $54,999 for women (74 | 16.6%).
| Income | Male | Female |
| $2,499 or less | 167 (18.2%) | 0 (0.0%) |
| $2,500 to $4,999 | 20 (2.2%) | 9 (2.0%) |
| $5,000 to $7,499 | 171 (18.7%) | 54 (12.1%) |
| $7,500 to $9,999 | 35 (3.8%) | 0 (0.0%) |
| $10,000 to $12,499 | 9 (1.0%) | 8 (1.8%) |
| $12,500 to $14,999 | 0 (0.0%) | 0 (0.0%) |
| $15,000 to $17,499 | 45 (4.9%) | 55 (12.3%) |
| $17,500 to $19,999 | 0 (0.0%) | 23 (5.2%) |
| $20,000 to $22,499 | 0 (0.0%) | 17 (3.8%) |
| $22,500 to $24,999 | 0 (0.0%) | 20 (4.5%) |
| $25,000 to $29,999 | 43 (4.7%) | 28 (6.3%) |
| $30,000 to $34,999 | 46 (5.0%) | 0 (0.0%) |
| $35,000 to $39,999 | 41 (4.5%) | 36 (8.1%) |
| $40,000 to $44,999 | 15 (1.6%) | 27 (6.0%) |
| $45,000 to $49,999 | 75 (8.2%) | 0 (0.0%) |
| $50,000 to $54,999 | 56 (6.1%) | 74 (16.6%) |
| $55,000 to $64,999 | 31 (3.4%) | 7 (1.6%) |
| $65,000 to $74,999 | 66 (7.2%) | 17 (3.8%) |
| $75,000 to $99,999 | 66 (7.2%) | 38 (8.5%) |
| $100,000+ | 29 (3.2%) | 33 (7.4%) |
| Total | 915 (100.0%) | 446 (100.0%) |
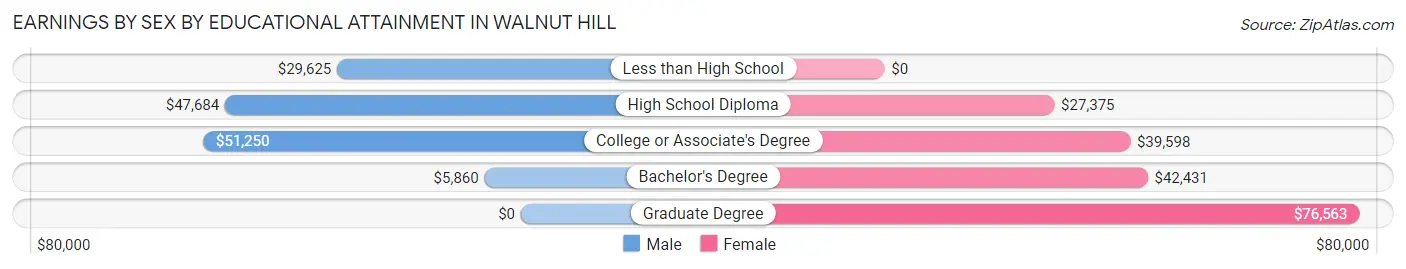
Earnings by Sex by Educational Attainment in Walnut Hill
| Educational Attainment | Male Income | Female Income |
| Less than High School | $29,625 | $0 |
| High School Diploma | $47,684 | $27,375 |
| College or Associate's Degree | $51,250 | $39,598 |
| Bachelor's Degree | $5,860 | $42,431 |
| Graduate Degree | - | - |
| Total | - | - |
Family Income in Walnut Hill
Family Income Brackets in Walnut Hill
According to the Walnut Hill family income data, there are 202 families falling into the $50,000 to $74,999 income range, which is the most common income bracket and makes up 34.5% of all families.
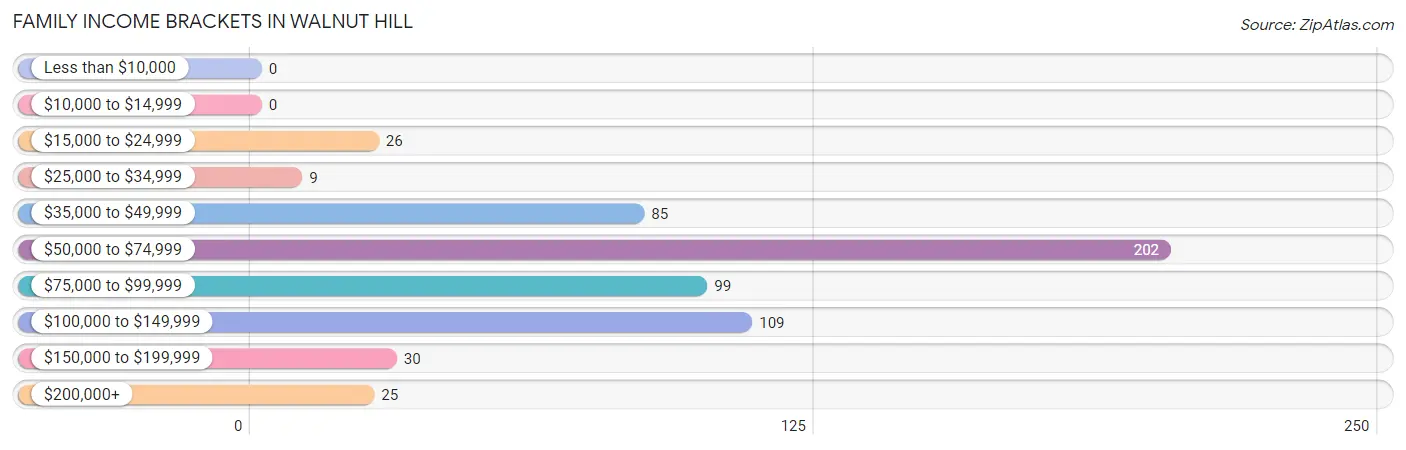
| Income Bracket | # Families | % Families |
| Less than $10,000 | 0 | 0.0% |
| $10,000 to $14,999 | 0 | 0.0% |
| $15,000 to $24,999 | 26 | 4.4% |
| $25,000 to $34,999 | 9 | 1.5% |
| $35,000 to $49,999 | 85 | 14.5% |
| $50,000 to $74,999 | 202 | 34.5% |
| $75,000 to $99,999 | 99 | 16.9% |
| $100,000 to $149,999 | 109 | 18.6% |
| $150,000 to $199,999 | 30 | 5.1% |
| $200,000+ | 25 | 4.3% |
Family Income by Famaliy Size in Walnut Hill
4-person families (112 | 19.2%) account for the highest median family income in Walnut Hill with $145,263 per family, while 4-person families (112 | 19.2%) have the highest median income of $36,316 per family member.
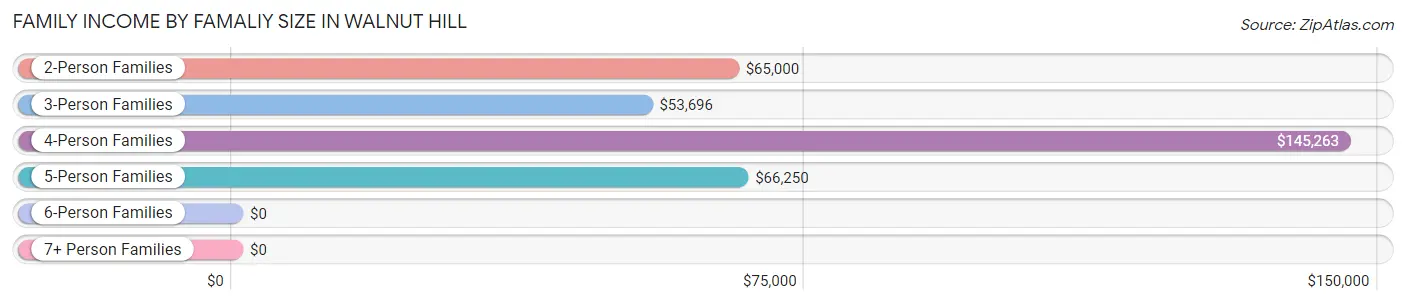
| Income Bracket | # Families | Median Income |
| 2-Person Families | 212 (36.2%) | $65,000 |
| 3-Person Families | 166 (28.4%) | $53,696 |
| 4-Person Families | 112 (19.2%) | $145,263 |
| 5-Person Families | 46 (7.9%) | $66,250 |
| 6-Person Families | 49 (8.4%) | $0 |
| 7+ Person Families | 0 (0.0%) | $0 |
| Total | 585 (100.0%) | $67,433 |
Family Income by Number of Earners in Walnut Hill
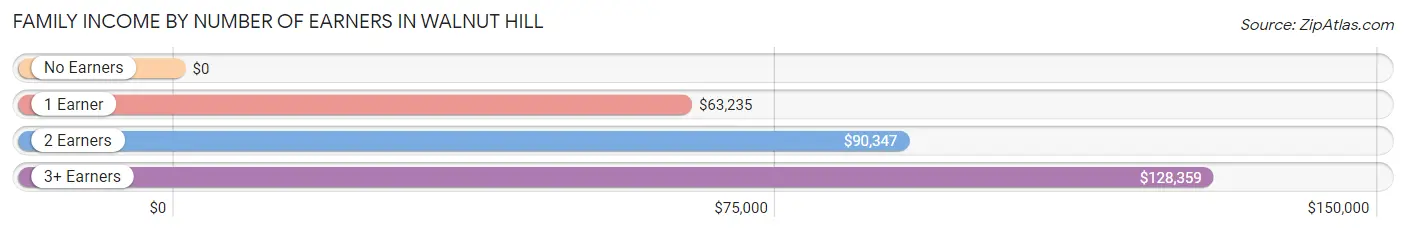
| Number of Earners | # Families | Median Income |
| No Earners | 104 (17.8%) | $0 |
| 1 Earner | 154 (26.3%) | $63,235 |
| 2 Earners | 267 (45.6%) | $90,347 |
| 3+ Earners | 60 (10.3%) | $128,359 |
| Total | 585 (100.0%) | $67,433 |
Household Income in Walnut Hill
Household Income Brackets in Walnut Hill
With 243 households falling in the category, the $50,000 to $74,999 income range is the most frequent in Walnut Hill, accounting for 28.2% of all households. In contrast, only 9 households (1.1%) fall into the $10,000 to $14,999 income bracket, making it the least populous group.
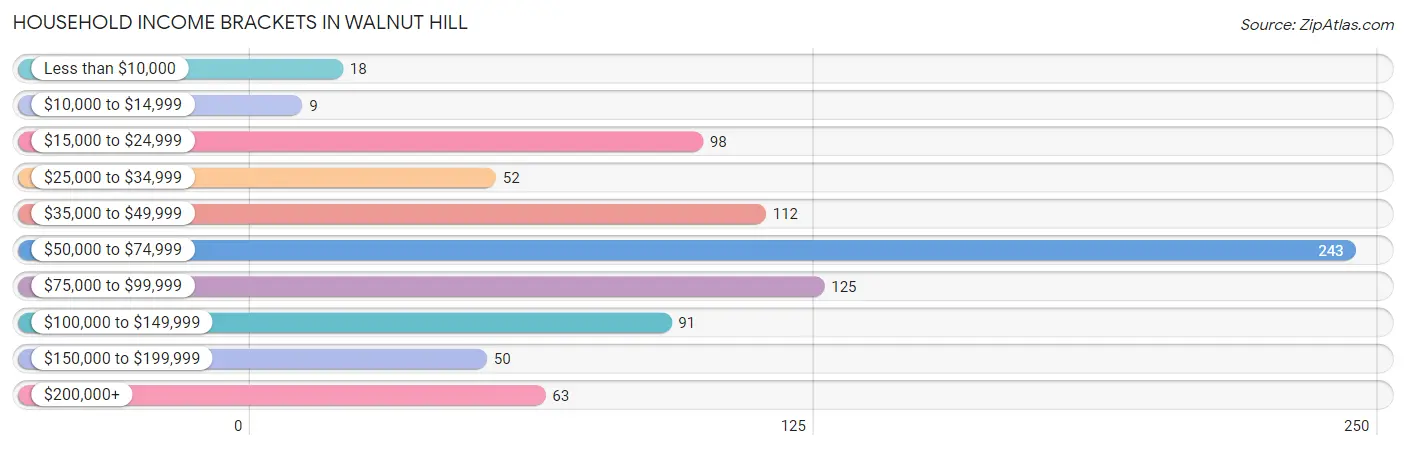
| Income Bracket | # Households | % Households |
| Less than $10,000 | 18 | 2.1% |
| $10,000 to $14,999 | 9 | 1.0% |
| $15,000 to $24,999 | 98 | 11.4% |
| $25,000 to $34,999 | 52 | 6.0% |
| $35,000 to $49,999 | 112 | 13.0% |
| $50,000 to $74,999 | 243 | 28.2% |
| $75,000 to $99,999 | 125 | 14.5% |
| $100,000 to $149,999 | 91 | 10.6% |
| $150,000 to $199,999 | 50 | 5.8% |
| $200,000+ | 63 | 7.3% |
Household Income by Householder Age in Walnut Hill
The median household income in Walnut Hill is $64,250, with the highest median household income of $72,917 found in the 45 to 64 years age bracket for the primary householder. A total of 299 households (34.7%) fall into this category. Meanwhile, the 15 to 24 years age bracket for the primary householder has the lowest median household income of $0, with 18 households (2.1%) in this group.
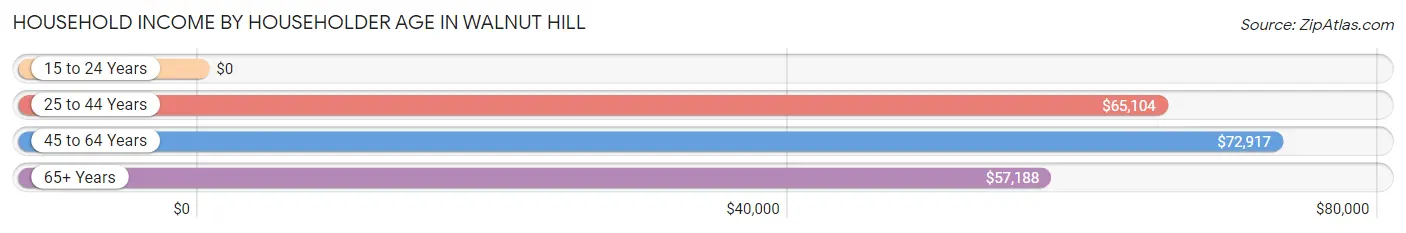
| Income Bracket | # Households | Median Income |
| 15 to 24 Years | 18 (2.1%) | $0 |
| 25 to 44 Years | 196 (22.8%) | $65,104 |
| 45 to 64 Years | 299 (34.7%) | $72,917 |
| 65+ Years | 348 (40.4%) | $57,188 |
| Total | 861 (100.0%) | $64,250 |
Poverty in Walnut Hill
Income Below Poverty by Sex and Age in Walnut Hill
With 2.5% poverty level for males and 8.2% for females among the residents of Walnut Hill, 16 and 17 year old males and 12 to 14 year old females are the most vulnerable to poverty, with 23 males (34.3%) and 27 females (100.0%) in their respective age groups living below the poverty level.
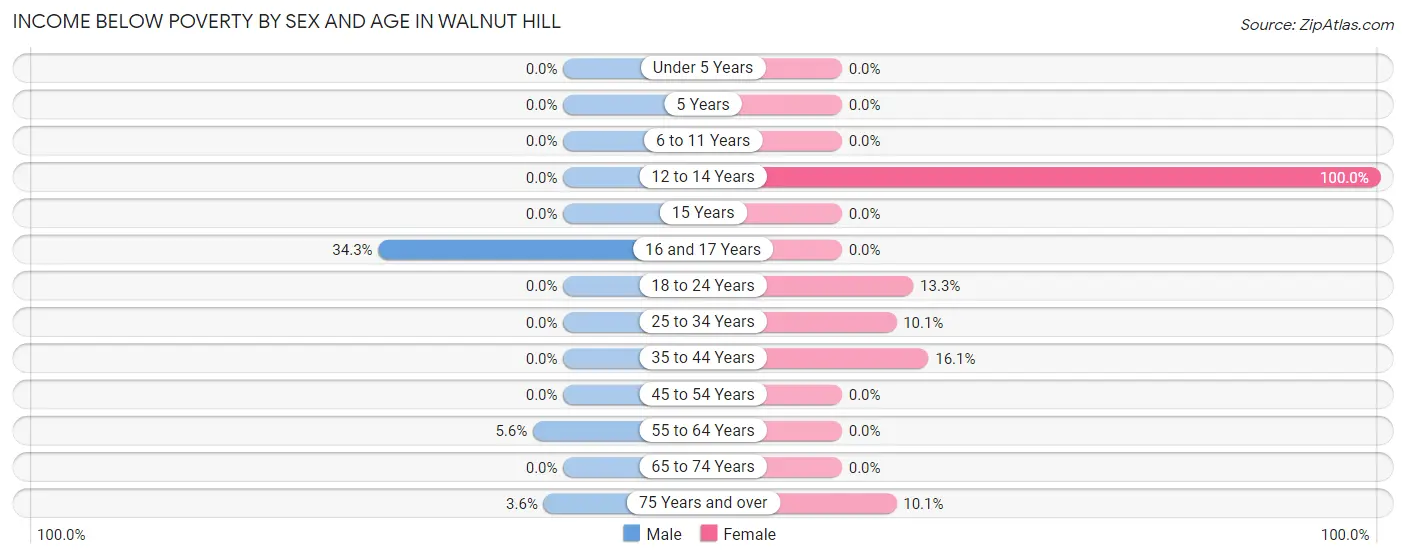
| Age Bracket | Male | Female |
| Under 5 Years | 0 (0.0%) | 0 (0.0%) |
| 5 Years | 0 (0.0%) | 0 (0.0%) |
| 6 to 11 Years | 0 (0.0%) | 0 (0.0%) |
| 12 to 14 Years | 0 (0.0%) | 27 (100.0%) |
| 15 Years | 0 (0.0%) | 0 (0.0%) |
| 16 and 17 Years | 23 (34.3%) | 0 (0.0%) |
| 18 to 24 Years | 0 (0.0%) | 11 (13.3%) |
| 25 to 34 Years | 0 (0.0%) | 10 (10.1%) |
| 35 to 44 Years | 0 (0.0%) | 26 (16.1%) |
| 45 to 54 Years | 0 (0.0%) | 0 (0.0%) |
| 55 to 64 Years | 9 (5.6%) | 0 (0.0%) |
| 65 to 74 Years | 0 (0.0%) | 0 (0.0%) |
| 75 Years and over | 4 (3.6%) | 18 (10.1%) |
| Total | 36 (2.5%) | 92 (8.2%) |
Income Above Poverty by Sex and Age in Walnut Hill
According to the poverty statistics in Walnut Hill, males aged under 5 years and females aged under 5 years are the age groups that are most secure financially, with 100.0% of males and 100.0% of females in these age groups living above the poverty line.
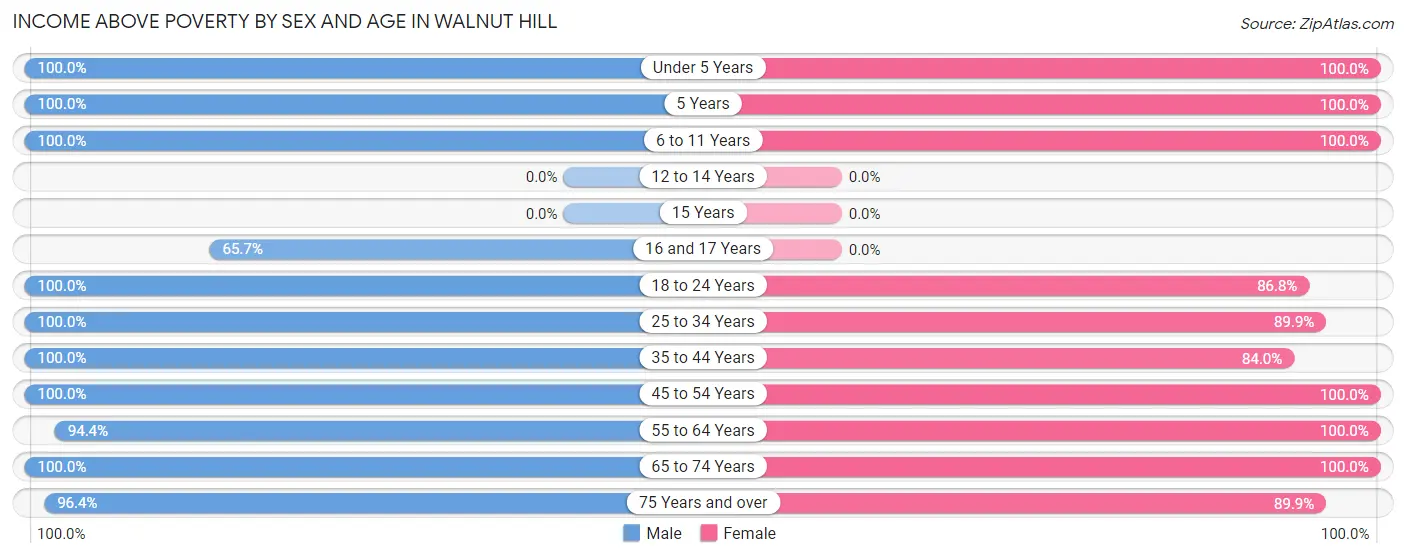
| Age Bracket | Male | Female |
| Under 5 Years | 42 (100.0%) | 51 (100.0%) |
| 5 Years | 17 (100.0%) | 11 (100.0%) |
| 6 to 11 Years | 110 (100.0%) | 43 (100.0%) |
| 12 to 14 Years | 0 (0.0%) | 0 (0.0%) |
| 15 Years | 0 (0.0%) | 0 (0.0%) |
| 16 and 17 Years | 44 (65.7%) | 0 (0.0%) |
| 18 to 24 Years | 142 (100.0%) | 72 (86.8%) |
| 25 to 34 Years | 145 (100.0%) | 89 (89.9%) |
| 35 to 44 Years | 243 (100.0%) | 136 (84.0%) |
| 45 to 54 Years | 284 (100.0%) | 140 (100.0%) |
| 55 to 64 Years | 151 (94.4%) | 113 (100.0%) |
| 65 to 74 Years | 133 (100.0%) | 219 (100.0%) |
| 75 Years and over | 106 (96.4%) | 160 (89.9%) |
| Total | 1,417 (97.5%) | 1,034 (91.8%) |
Income Below Poverty Among Married-Couple Families in Walnut Hill
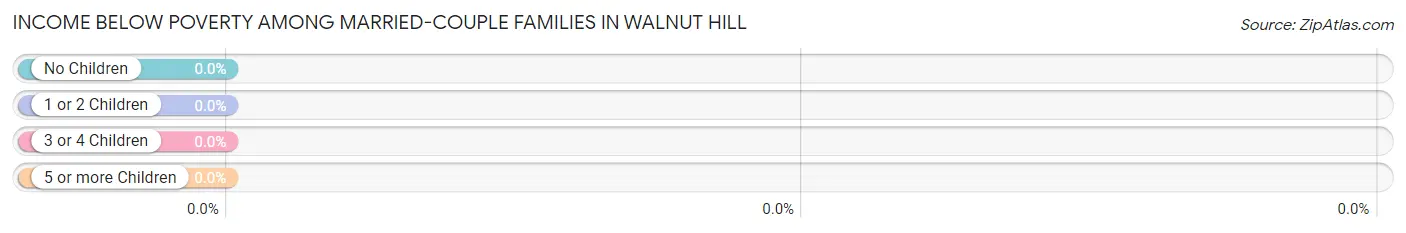
| Children | Above Poverty | Below Poverty |
| No Children | 263 (100.0%) | 0 (0.0%) |
| 1 or 2 Children | 131 (100.0%) | 0 (0.0%) |
| 3 or 4 Children | 35 (100.0%) | 0 (0.0%) |
| 5 or more Children | 0 (0.0%) | 0 (0.0%) |
| Total | 429 (100.0%) | 0 (0.0%) |
Income Below Poverty Among Single-Parent Households in Walnut Hill
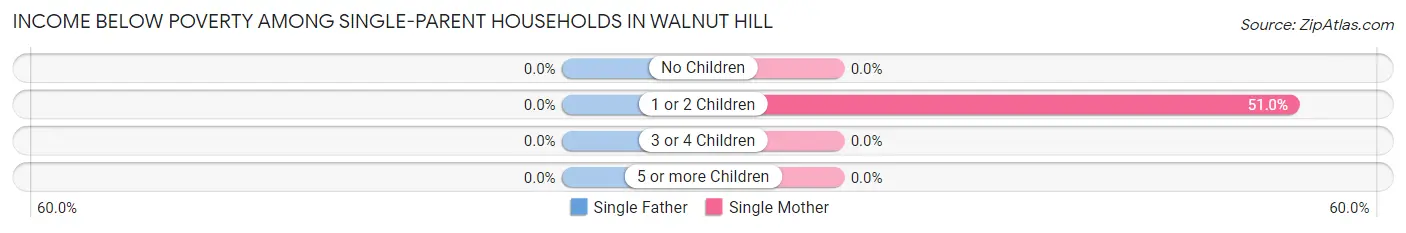
| Children | Single Father | Single Mother |
| No Children | 0 (0.0%) | 0 (0.0%) |
| 1 or 2 Children | 0 (0.0%) | 26 (51.0%) |
| 3 or 4 Children | 0 (0.0%) | 0 (0.0%) |
| 5 or more Children | 0 (0.0%) | 0 (0.0%) |
| Total | 0 (0.0%) | 26 (23.6%) |
Income Below Poverty Among Married-Couple vs Single-Parent Households in Walnut Hill
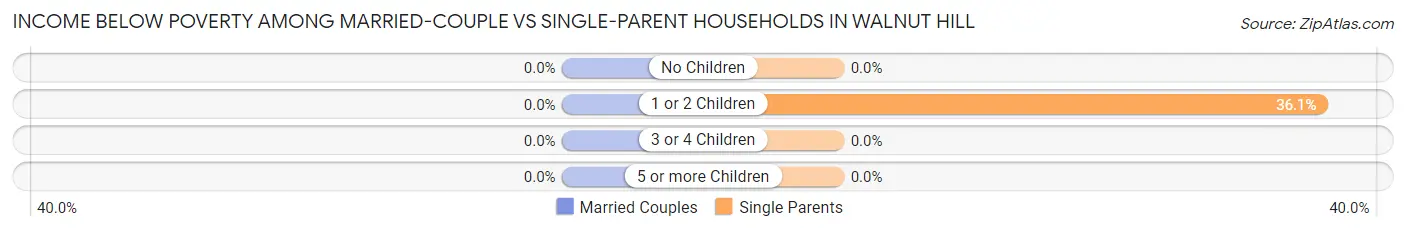
| Children | Married-Couple Families | Single-Parent Households |
| No Children | 0 (0.0%) | 0 (0.0%) |
| 1 or 2 Children | 0 (0.0%) | 26 (36.1%) |
| 3 or 4 Children | 0 (0.0%) | 0 (0.0%) |
| 5 or more Children | 0 (0.0%) | 0 (0.0%) |
| Total | 0 (0.0%) | 26 (16.7%) |
Race in Walnut Hill
The most populous races in Walnut Hill are White / Caucasian (2,564 | 96.8%), Native / Alaskan (77 | 2.9%), and Asian (7 | 0.3%).
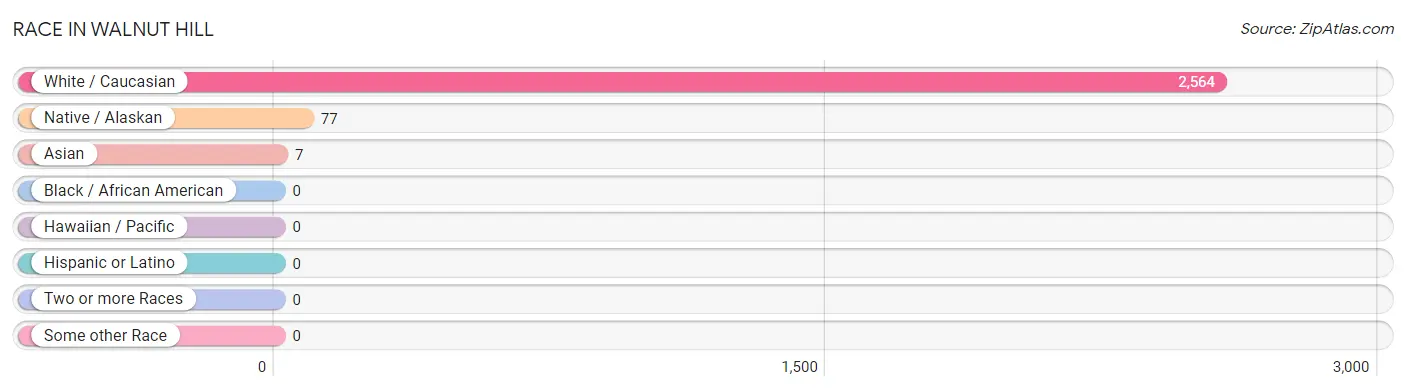
| Race | # Population | % Population |
| Asian | 7 | 0.3% |
| Black / African American | 0 | 0.0% |
| Hawaiian / Pacific | 0 | 0.0% |
| Hispanic or Latino | 0 | 0.0% |
| Native / Alaskan | 77 | 2.9% |
| White / Caucasian | 2,564 | 96.8% |
| Two or more Races | 0 | 0.0% |
| Some other Race | 0 | 0.0% |
| Total | 2,648 | 100.0% |
Ancestry in Walnut Hill
The most populous ancestries reported in Walnut Hill are English (884 | 33.4%), Irish (601 | 22.7%), American (472 | 17.8%), German (279 | 10.5%), and Scotch-Irish (84 | 3.2%), together accounting for 87.6% of all Walnut Hill residents.
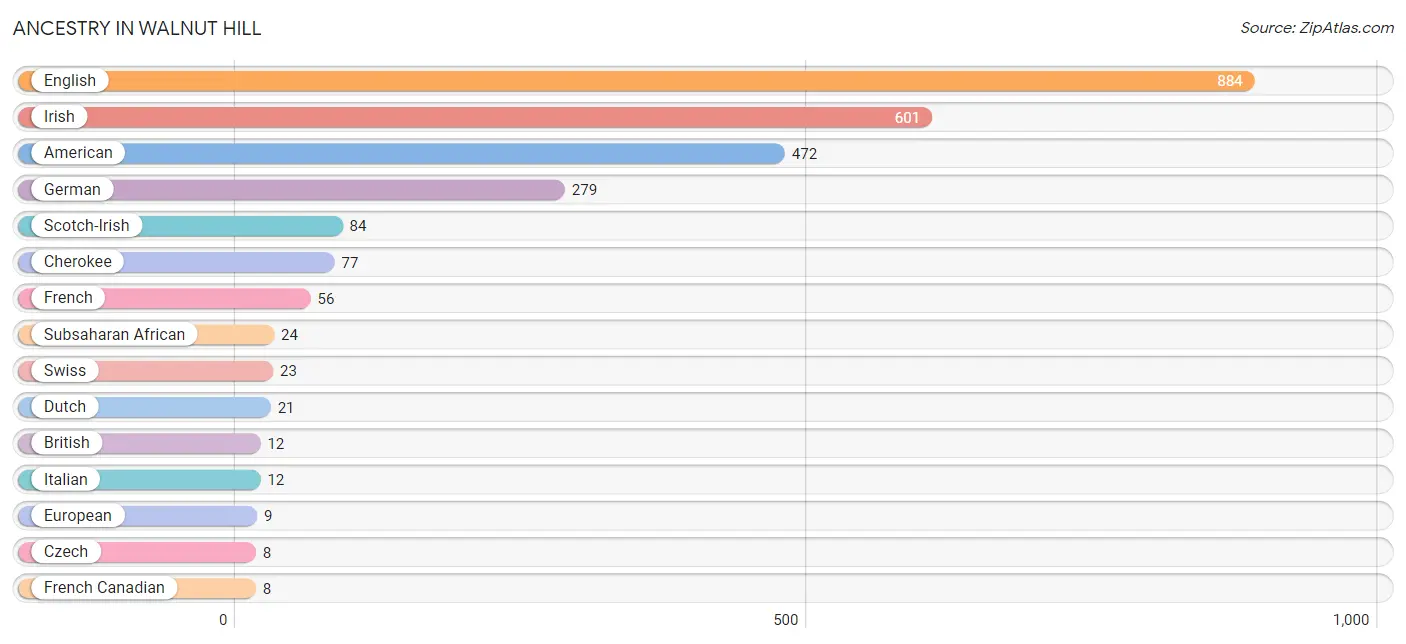
| Ancestry | # Population | % Population |
| American | 472 | 17.8% |
| British | 12 | 0.4% |
| Cherokee | 77 | 2.9% |
| Czech | 8 | 0.3% |
| Dutch | 21 | 0.8% |
| English | 884 | 33.4% |
| European | 9 | 0.3% |
| French | 56 | 2.1% |
| French Canadian | 8 | 0.3% |
| German | 279 | 10.5% |
| Irish | 601 | 22.7% |
| Italian | 12 | 0.4% |
| Japanese | 7 | 0.3% |
| Scotch-Irish | 84 | 3.2% |
| Scottish | 7 | 0.3% |
| Subsaharan African | 24 | 0.9% |
| Swiss | 23 | 0.9% |
| Welsh | 4 | 0.2% | View All 18 Rows |
Immigrants in Walnut Hill

| Immigration Origin | # Population | % Population | View All 0 Rows |
Sex and Age in Walnut Hill
Sex and Age in Walnut Hill
The most populous age groups in Walnut Hill are 40 to 44 Years (219 | 14.7%) for men and 70 to 74 Years (178 | 15.3%) for women.
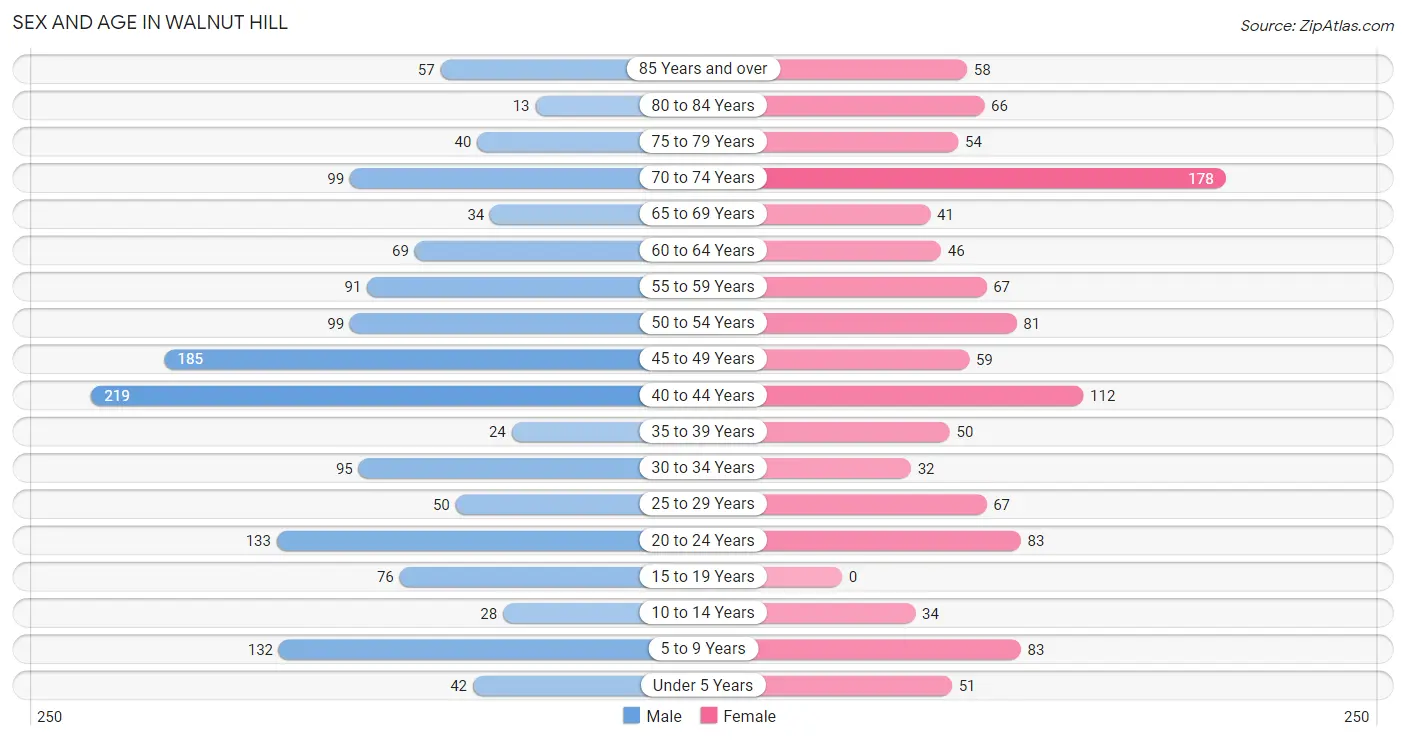
| Age Bracket | Male | Female |
| Under 5 Years | 42 (2.8%) | 51 (4.4%) |
| 5 to 9 Years | 132 (8.9%) | 83 (7.1%) |
| 10 to 14 Years | 28 (1.9%) | 34 (2.9%) |
| 15 to 19 Years | 76 (5.1%) | 0 (0.0%) |
| 20 to 24 Years | 133 (8.9%) | 83 (7.1%) |
| 25 to 29 Years | 50 (3.4%) | 67 (5.8%) |
| 30 to 34 Years | 95 (6.4%) | 32 (2.8%) |
| 35 to 39 Years | 24 (1.6%) | 50 (4.3%) |
| 40 to 44 Years | 219 (14.7%) | 112 (9.6%) |
| 45 to 49 Years | 185 (12.4%) | 59 (5.1%) |
| 50 to 54 Years | 99 (6.7%) | 81 (7.0%) |
| 55 to 59 Years | 91 (6.1%) | 67 (5.8%) |
| 60 to 64 Years | 69 (4.6%) | 46 (4.0%) |
| 65 to 69 Years | 34 (2.3%) | 41 (3.5%) |
| 70 to 74 Years | 99 (6.7%) | 178 (15.3%) |
| 75 to 79 Years | 40 (2.7%) | 54 (4.6%) |
| 80 to 84 Years | 13 (0.9%) | 66 (5.7%) |
| 85 Years and over | 57 (3.8%) | 58 (5.0%) |
| Total | 1,486 (100.0%) | 1,162 (100.0%) |
Families and Households in Walnut Hill
Median Family Size in Walnut Hill
The median family size in Walnut Hill is 3.76 persons per family, with married-couple families (429 | 73.3%) accounting for the largest median family size of 3.99 persons per family. On the other hand, single male/father families (46 | 7.9%) represent the smallest median family size with 2.67 persons per family.
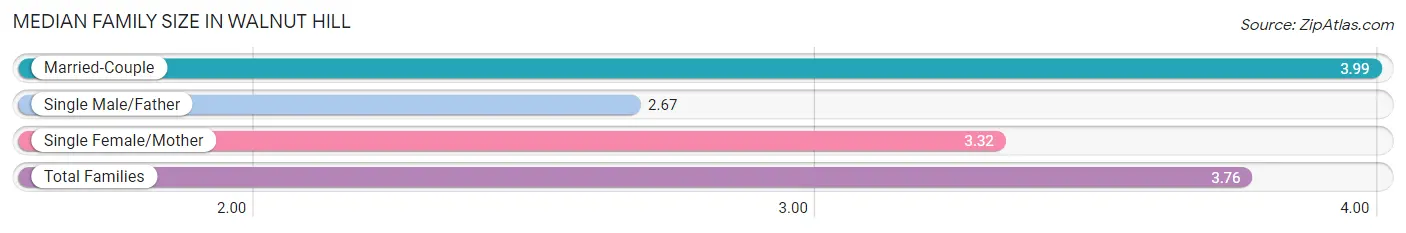
| Family Type | # Families | Family Size |
| Married-Couple | 429 (73.3%) | 3.99 |
| Single Male/Father | 46 (7.9%) | 2.67 |
| Single Female/Mother | 110 (18.8%) | 3.32 |
| Total Families | 585 (100.0%) | 3.76 |
Median Household Size in Walnut Hill
The median household size in Walnut Hill is 3.08 persons per household, with married-couple households (429 | 49.8%) accounting for the largest median household size of 4.15 persons per household. non-family households (276 | 32.1%) represent the smallest median household size with 1.16 persons per household.
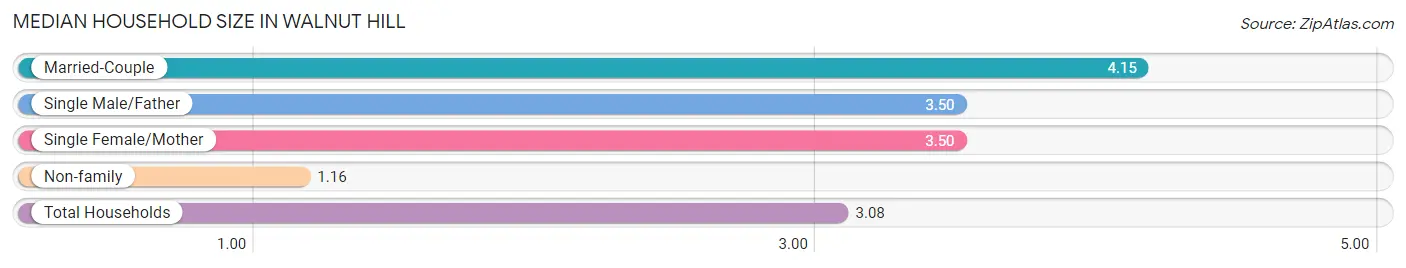
| Household Type | # Households | Household Size |
| Married-Couple | 429 (49.8%) | 4.15 |
| Single Male/Father | 46 (5.3%) | 3.50 |
| Single Female/Mother | 110 (12.8%) | 3.50 |
| Non-family | 276 (32.1%) | 1.16 |
| Total Households | 861 (100.0%) | 3.08 |
Household Size by Marriage Status in Walnut Hill
Out of a total of 861 households in Walnut Hill, 585 (67.9%) are family households, while 276 (32.1%) are nonfamily households. The most numerous type of family households are 2-person households, comprising 186, and the most common type of nonfamily households are 1-person households, comprising 231.
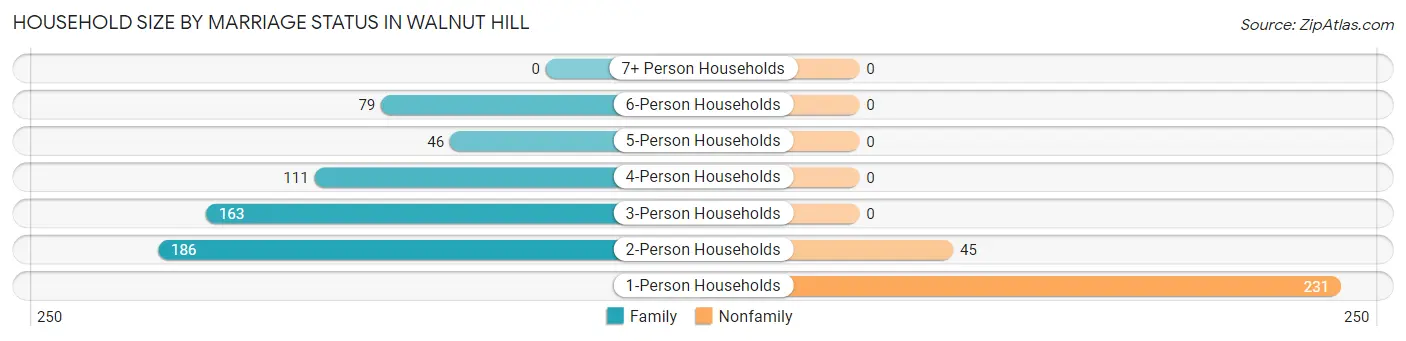
| Household Size | Family Households | Nonfamily Households |
| 1-Person Households | - | 231 (26.8%) |
| 2-Person Households | 186 (21.6%) | 45 (5.2%) |
| 3-Person Households | 163 (18.9%) | 0 (0.0%) |
| 4-Person Households | 111 (12.9%) | 0 (0.0%) |
| 5-Person Households | 46 (5.3%) | 0 (0.0%) |
| 6-Person Households | 79 (9.2%) | 0 (0.0%) |
| 7+ Person Households | 0 (0.0%) | 0 (0.0%) |
| Total | 585 (67.9%) | 276 (32.1%) |
Female Fertility in Walnut Hill
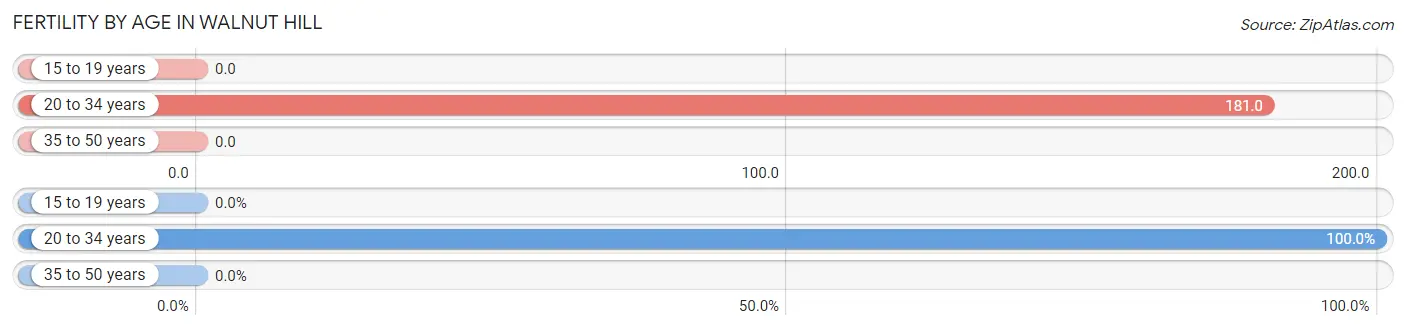
Fertility by Age in Walnut Hill
Average fertility rate in Walnut Hill is 74.0 births per 1,000 women. Women in the age bracket of 20 to 34 years have the highest fertility rate with 181.0 births per 1,000 women. Women in the age bracket of 20 to 34 years acount for 100.0% of all women with births.
| Age Bracket | Women with Births | Births / 1,000 Women |
| 15 to 19 years | 0 (0.0%) | 0.0 |
| 20 to 34 years | 33 (100.0%) | 181.0 |
| 35 to 50 years | 0 (0.0%) | 0.0 |
| Total | 33 (100.0%) | 74.0 |
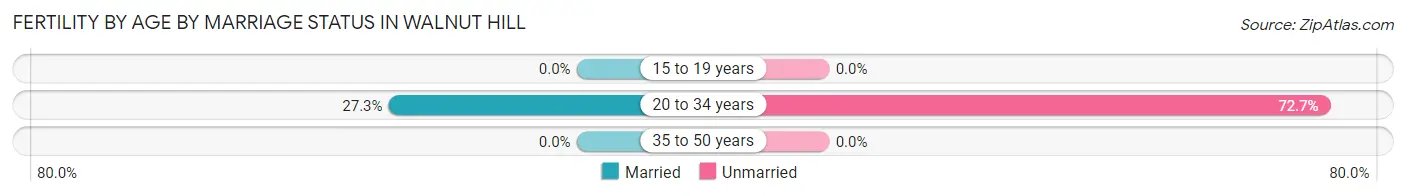
Fertility by Age by Marriage Status in Walnut Hill
27.3% of women with births (33) in Walnut Hill are married. The highest percentage of unmarried women with births falls into 20 to 34 years age bracket with 72.7% of them unmarried at the time of birth, while the lowest percentage of unmarried women with births belong to 20 to 34 years age bracket with 72.7% of them unmarried.
| Age Bracket | Married | Unmarried |
| 15 to 19 years | 0 (0.0%) | 0 (0.0%) |
| 20 to 34 years | 9 (27.3%) | 24 (72.7%) |
| 35 to 50 years | 0 (0.0%) | 0 (0.0%) |
| Total | 9 (27.3%) | 24 (72.7%) |
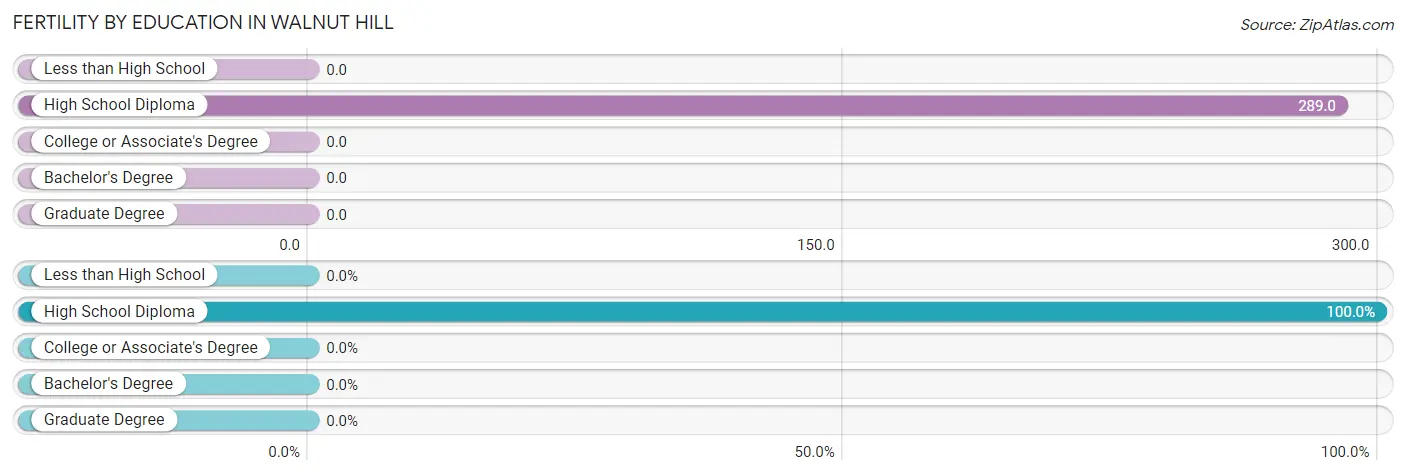
Fertility by Education in Walnut Hill
| Educational Attainment | Women with Births | Births / 1,000 Women |
| Less than High School | 0 (0.0%) | 0.0 |
| High School Diploma | 33 (100.0%) | 289.0 |
| College or Associate's Degree | 0 (0.0%) | 0.0 |
| Bachelor's Degree | 0 (0.0%) | 0.0 |
| Graduate Degree | 0 (0.0%) | 0.0 |
| Total | 33 (100.0%) | 74.0 |
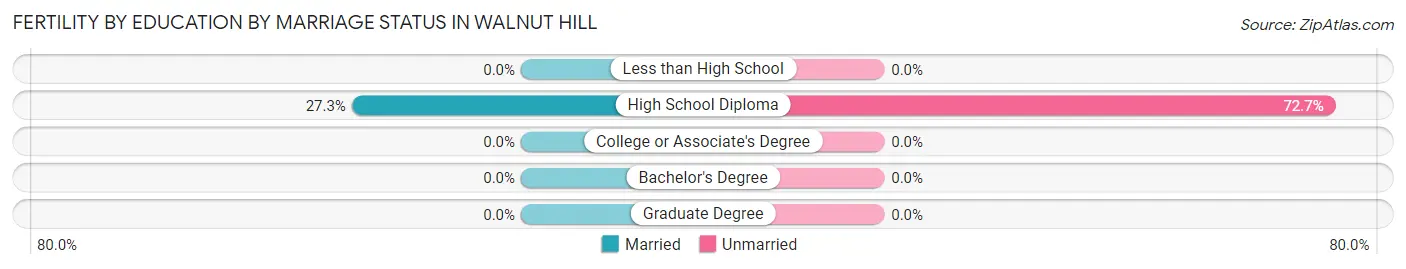
Fertility by Education by Marriage Status in Walnut Hill
72.7% of women with births in Walnut Hill are unmarried. Women with the educational attainment of high school diploma are most likely to be married with 27.3% of them married at childbirth, while women with the educational attainment of high school diploma are least likely to be married with 72.7% of them unmarried at childbirth.
| Educational Attainment | Married | Unmarried |
| Less than High School | 0 (0.0%) | 0 (0.0%) |
| High School Diploma | 9 (27.3%) | 24 (72.7%) |
| College or Associate's Degree | 0 (0.0%) | 0 (0.0%) |
| Bachelor's Degree | 0 (0.0%) | 0 (0.0%) |
| Graduate Degree | 0 (0.0%) | 0 (0.0%) |
| Total | 9 (27.3%) | 24 (72.7%) |
Employment Characteristics in Walnut Hill
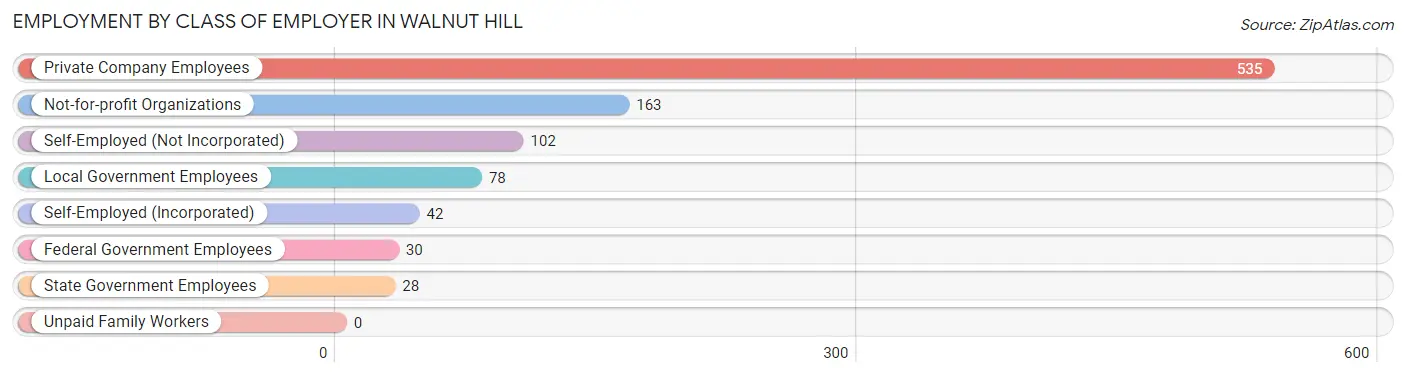
Employment by Class of Employer in Walnut Hill
Among the 978 employed individuals in Walnut Hill, private company employees (535 | 54.7%), not-for-profit organizations (163 | 16.7%), and self-employed (not incorporated) (102 | 10.4%) make up the most common classes of employment.
| Employer Class | # Employees | % Employees |
| Private Company Employees | 535 | 54.7% |
| Self-Employed (Incorporated) | 42 | 4.3% |
| Self-Employed (Not Incorporated) | 102 | 10.4% |
| Not-for-profit Organizations | 163 | 16.7% |
| Local Government Employees | 78 | 8.0% |
| State Government Employees | 28 | 2.9% |
| Federal Government Employees | 30 | 3.1% |
| Unpaid Family Workers | 0 | 0.0% |
| Total | 978 | 100.0% |
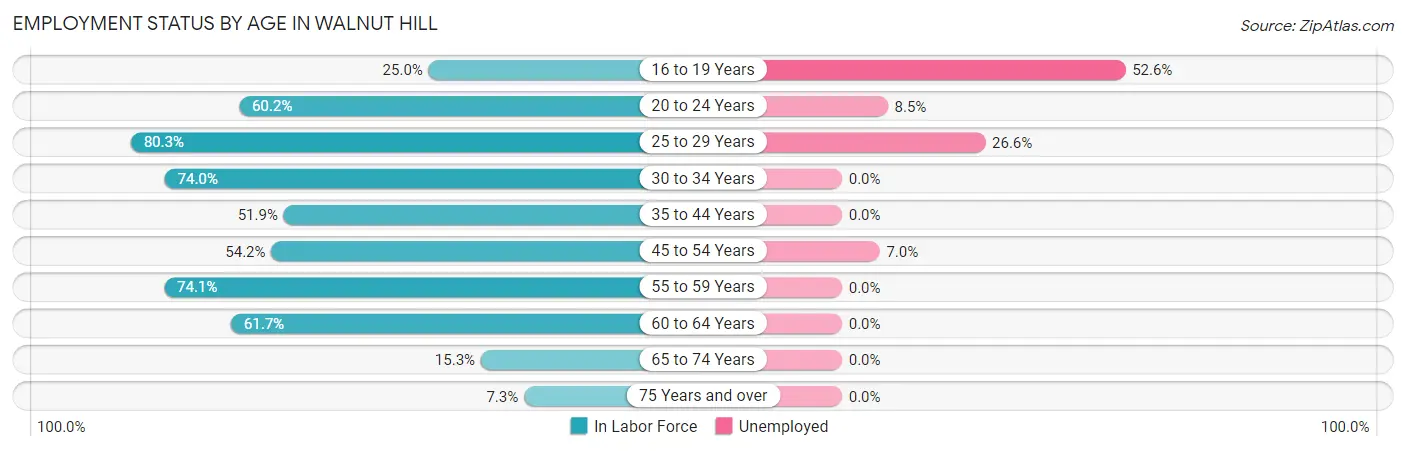
Employment Status by Age in Walnut Hill
According to the labor force statistics for Walnut Hill, out of the total population over 16 years of age (2,278), 45.7% or 1,041 individuals are in the labor force, with 6.0% or 62 of them unemployed. The age group with the highest labor force participation rate is 25 to 29 years, with 80.3% or 94 individuals in the labor force. Within the labor force, the 16 to 19 years age range has the highest percentage of unemployed individuals, with 52.6% or 10 of them being unemployed.
| Age Bracket | In Labor Force | Unemployed |
| 16 to 19 Years | 19 (25.0%) | 10 (52.6%) |
| 20 to 24 Years | 130 (60.2%) | 11 (8.5%) |
| 25 to 29 Years | 94 (80.3%) | 25 (26.6%) |
| 30 to 34 Years | 94 (74.0%) | 0 (0.0%) |
| 35 to 44 Years | 210 (51.9%) | 0 (0.0%) |
| 45 to 54 Years | 230 (54.2%) | 16 (7.0%) |
| 55 to 59 Years | 117 (74.1%) | 0 (0.0%) |
| 60 to 64 Years | 71 (61.7%) | 0 (0.0%) |
| 65 to 74 Years | 54 (15.3%) | 0 (0.0%) |
| 75 Years and over | 21 (7.3%) | 0 (0.0%) |
| Total | 1,041 (45.7%) | 62 (6.0%) |
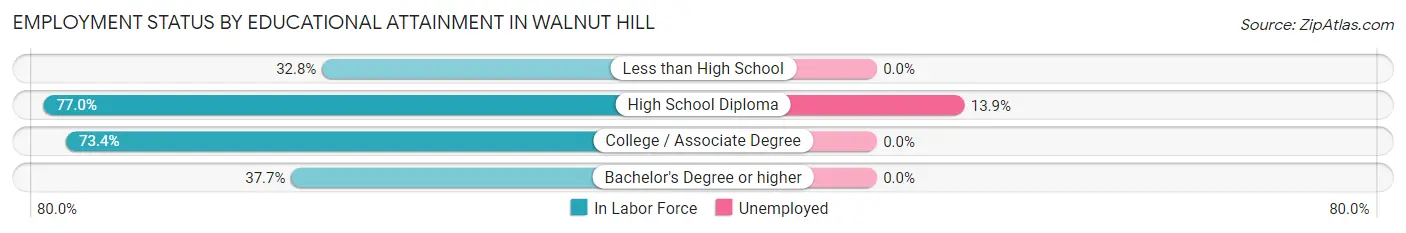
Employment Status by Educational Attainment in Walnut Hill
According to labor force statistics for Walnut Hill, 60.6% of individuals (816) out of the total population between 25 and 64 years of age (1,346) are in the labor force, with 5.0% or 41 of them being unemployed. The group with the highest labor force participation rate are those with the educational attainment of high school diploma, with 77.0% or 295 individuals in the labor force. Within the labor force, individuals with high school diploma education have the highest percentage of unemployment, with 13.9% or 41 of them being unemployed.
| Educational Attainment | In Labor Force | Unemployed |
| Less than High School | 19 (32.8%) | 0 (0.0%) |
| High School Diploma | 295 (77.0%) | 53 (13.9%) |
| College / Associate Degree | 331 (73.4%) | 0 (0.0%) |
| Bachelor's Degree or higher | 171 (37.7%) | 0 (0.0%) |
| Total | 816 (60.6%) | 67 (5.0%) |
Employment Occupations by Sex in Walnut Hill
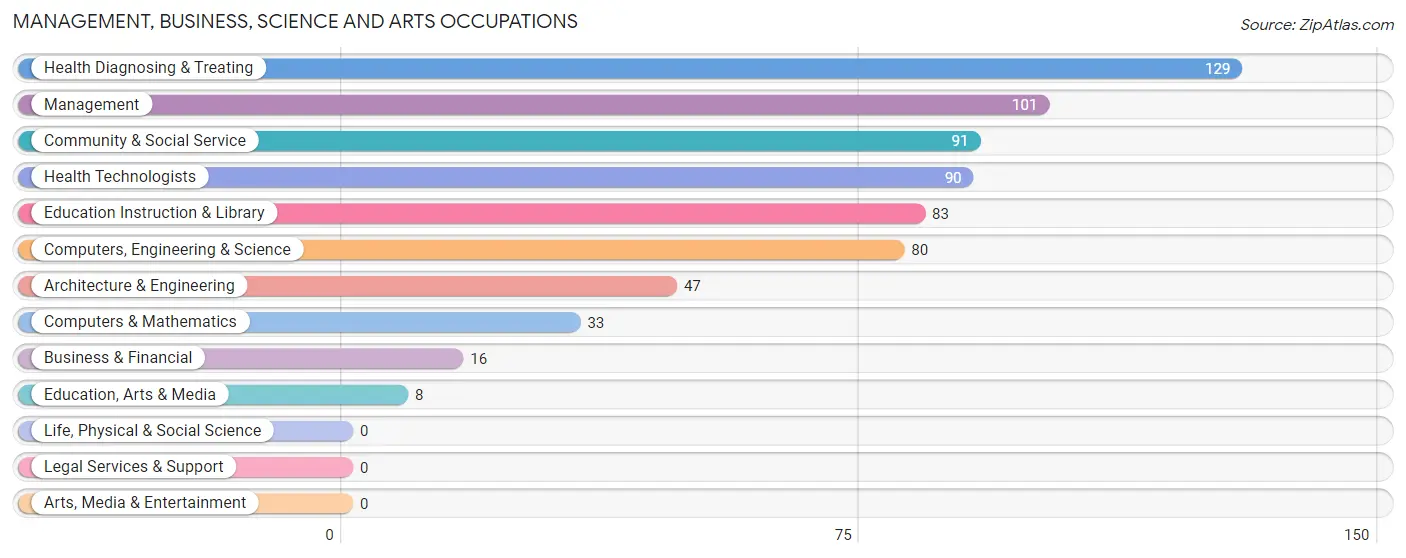
Management, Business, Science and Arts Occupations
The most common Management, Business, Science and Arts occupations in Walnut Hill are Health Diagnosing & Treating (129 | 13.2%), Management (101 | 10.3%), Community & Social Service (91 | 9.3%), Health Technologists (90 | 9.2%), and Education Instruction & Library (83 | 8.5%).
Management, Business, Science and Arts Occupations by Sex
Within the Management, Business, Science and Arts occupations in Walnut Hill, the most male-oriented occupations are Architecture & Engineering (100.0%), Education, Arts & Media (100.0%), and Computers, Engineering & Science (85.0%), while the most female-oriented occupations are Business & Financial (100.0%), Education Instruction & Library (100.0%), and Health Diagnosing & Treating (94.6%).
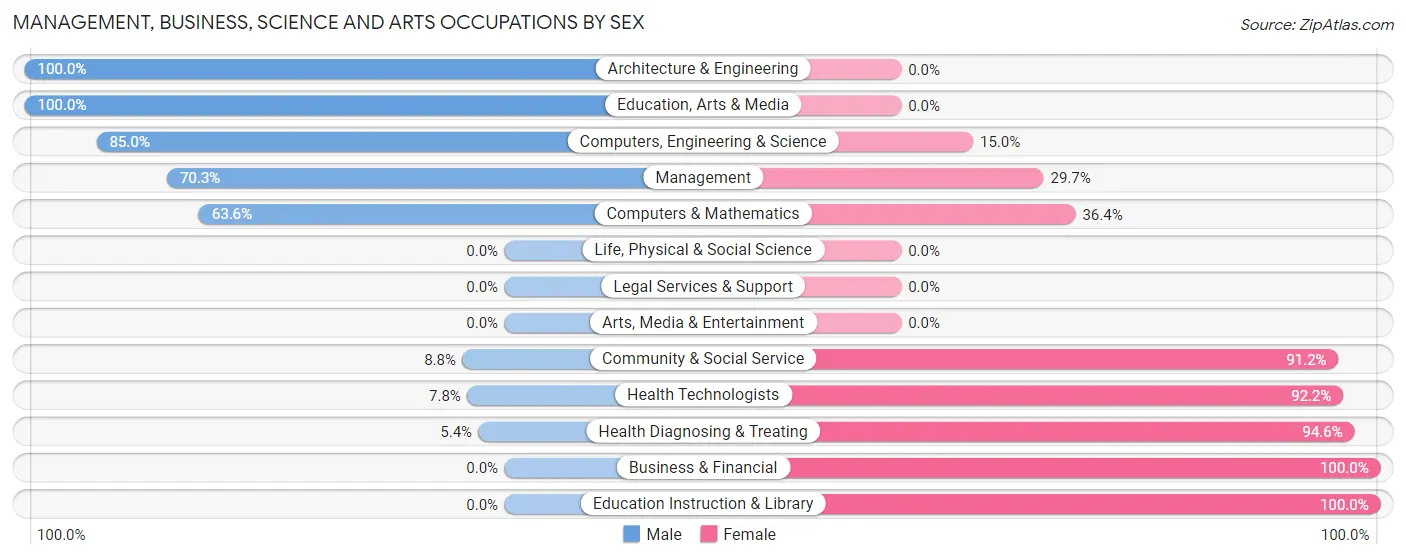
| Occupation | Male | Female |
| Management | 71 (70.3%) | 30 (29.7%) |
| Business & Financial | 0 (0.0%) | 16 (100.0%) |
| Computers, Engineering & Science | 68 (85.0%) | 12 (15.0%) |
| Computers & Mathematics | 21 (63.6%) | 12 (36.4%) |
| Architecture & Engineering | 47 (100.0%) | 0 (0.0%) |
| Life, Physical & Social Science | 0 (0.0%) | 0 (0.0%) |
| Community & Social Service | 8 (8.8%) | 83 (91.2%) |
| Education, Arts & Media | 8 (100.0%) | 0 (0.0%) |
| Legal Services & Support | 0 (0.0%) | 0 (0.0%) |
| Education Instruction & Library | 0 (0.0%) | 83 (100.0%) |
| Arts, Media & Entertainment | 0 (0.0%) | 0 (0.0%) |
| Health Diagnosing & Treating | 7 (5.4%) | 122 (94.6%) |
| Health Technologists | 7 (7.8%) | 83 (92.2%) |
| Total (Category) | 154 (36.9%) | 263 (63.1%) |
| Total (Overall) | 561 (57.4%) | 417 (42.6%) |
Services Occupations
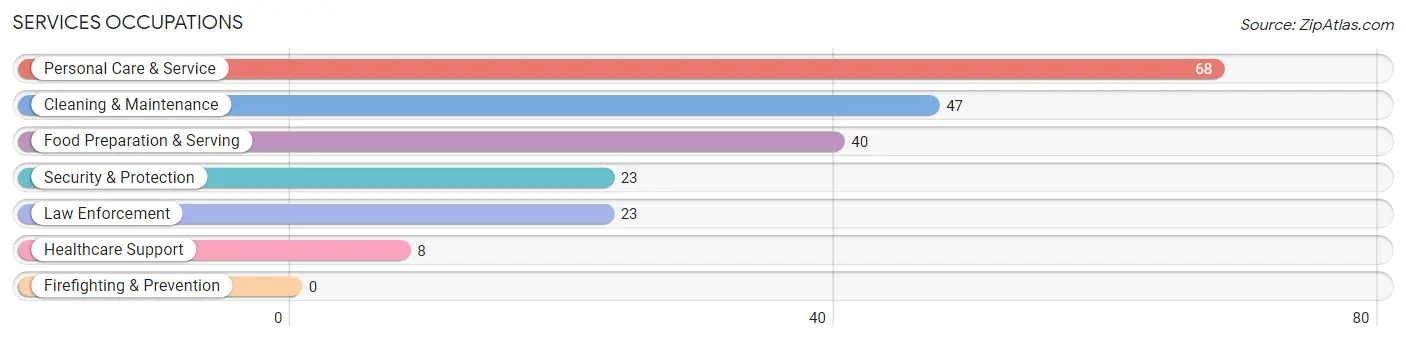
The most common Services occupations in Walnut Hill are Personal Care & Service (68 | 7.0%), Cleaning & Maintenance (47 | 4.8%), Food Preparation & Serving (40 | 4.1%), Security & Protection (23 | 2.4%), and Law Enforcement (23 | 2.4%).
Services Occupations by Sex
Within the Services occupations in Walnut Hill, the most male-oriented occupations are Security & Protection (100.0%), Law Enforcement (100.0%), and Food Preparation & Serving (100.0%), while the most female-oriented occupations are Healthcare Support (100.0%), Personal Care & Service (48.5%), and Cleaning & Maintenance (21.3%).
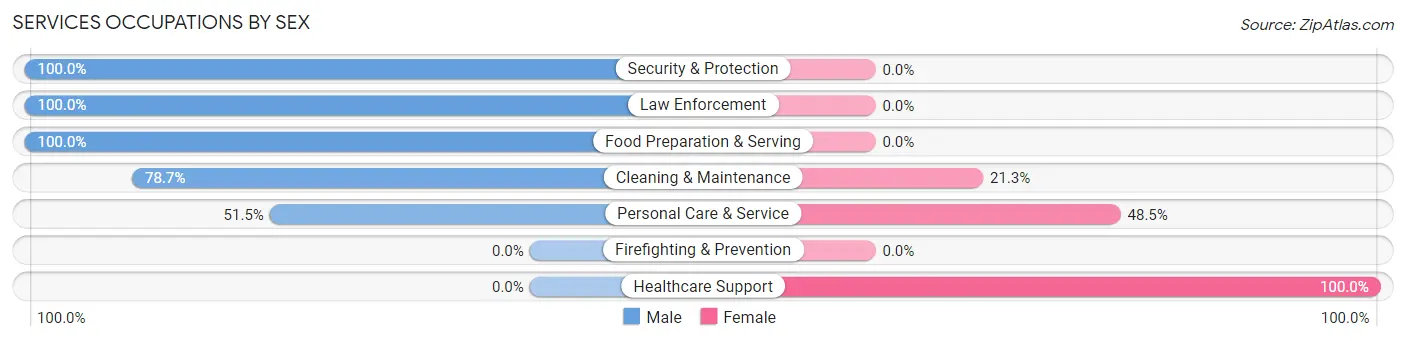
| Occupation | Male | Female |
| Healthcare Support | 0 (0.0%) | 8 (100.0%) |
| Security & Protection | 23 (100.0%) | 0 (0.0%) |
| Firefighting & Prevention | 0 (0.0%) | 0 (0.0%) |
| Law Enforcement | 23 (100.0%) | 0 (0.0%) |
| Food Preparation & Serving | 40 (100.0%) | 0 (0.0%) |
| Cleaning & Maintenance | 37 (78.7%) | 10 (21.3%) |
| Personal Care & Service | 35 (51.5%) | 33 (48.5%) |
| Total (Category) | 135 (72.6%) | 51 (27.4%) |
| Total (Overall) | 561 (57.4%) | 417 (42.6%) |
Sales and Office Occupations
The most common Sales and Office occupations in Walnut Hill are Sales & Related (84 | 8.6%), and Office & Administration (70 | 7.2%).
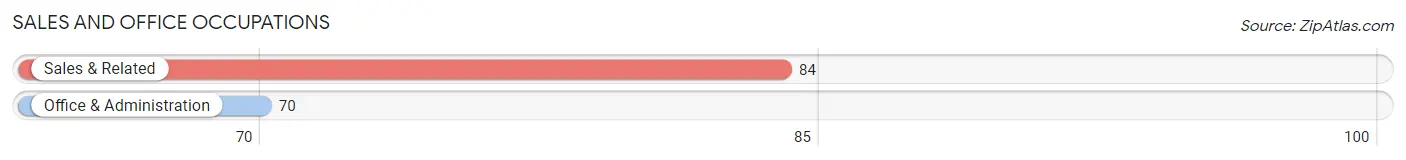
Sales and Office Occupations by Sex

| Occupation | Male | Female |
| Sales & Related | 58 (69.1%) | 26 (30.9%) |
| Office & Administration | 9 (12.9%) | 61 (87.1%) |
| Total (Category) | 67 (43.5%) | 87 (56.5%) |
| Total (Overall) | 561 (57.4%) | 417 (42.6%) |
Natural Resources, Construction and Maintenance Occupations
The most common Natural Resources, Construction and Maintenance occupations in Walnut Hill are Construction & Extraction (57 | 5.8%), and Installation, Maintenance & Repair (36 | 3.7%).
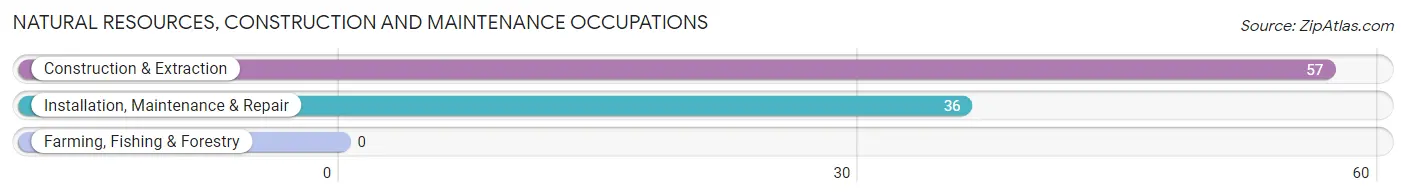
Natural Resources, Construction and Maintenance Occupations by Sex
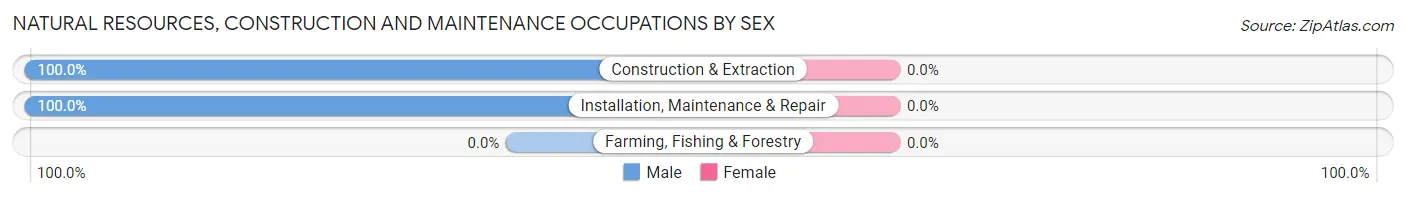
| Occupation | Male | Female |
| Farming, Fishing & Forestry | 0 (0.0%) | 0 (0.0%) |
| Construction & Extraction | 57 (100.0%) | 0 (0.0%) |
| Installation, Maintenance & Repair | 36 (100.0%) | 0 (0.0%) |
| Total (Category) | 93 (100.0%) | 0 (0.0%) |
| Total (Overall) | 561 (57.4%) | 417 (42.6%) |
Production, Transportation and Moving Occupations
The most common Production, Transportation and Moving occupations in Walnut Hill are Transportation (52 | 5.3%), Production (42 | 4.3%), and Material Moving (34 | 3.5%).
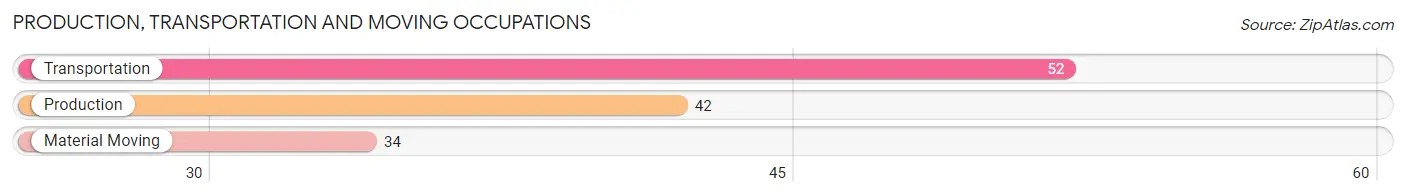
Production, Transportation and Moving Occupations by Sex
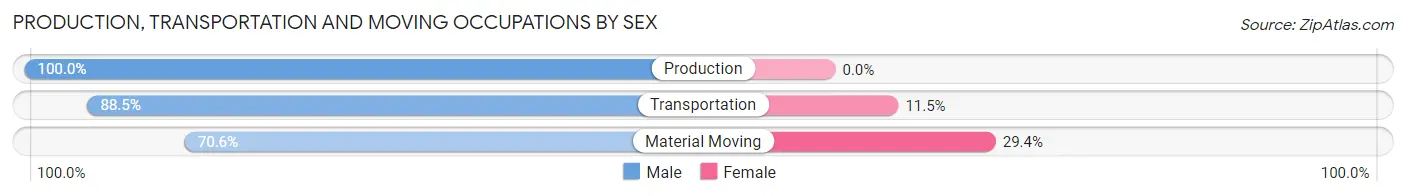
| Occupation | Male | Female |
| Production | 42 (100.0%) | 0 (0.0%) |
| Transportation | 46 (88.5%) | 6 (11.5%) |
| Material Moving | 24 (70.6%) | 10 (29.4%) |
| Total (Category) | 112 (87.5%) | 16 (12.5%) |
| Total (Overall) | 561 (57.4%) | 417 (42.6%) |
Employment Industries by Sex in Walnut Hill
Employment Industries in Walnut Hill
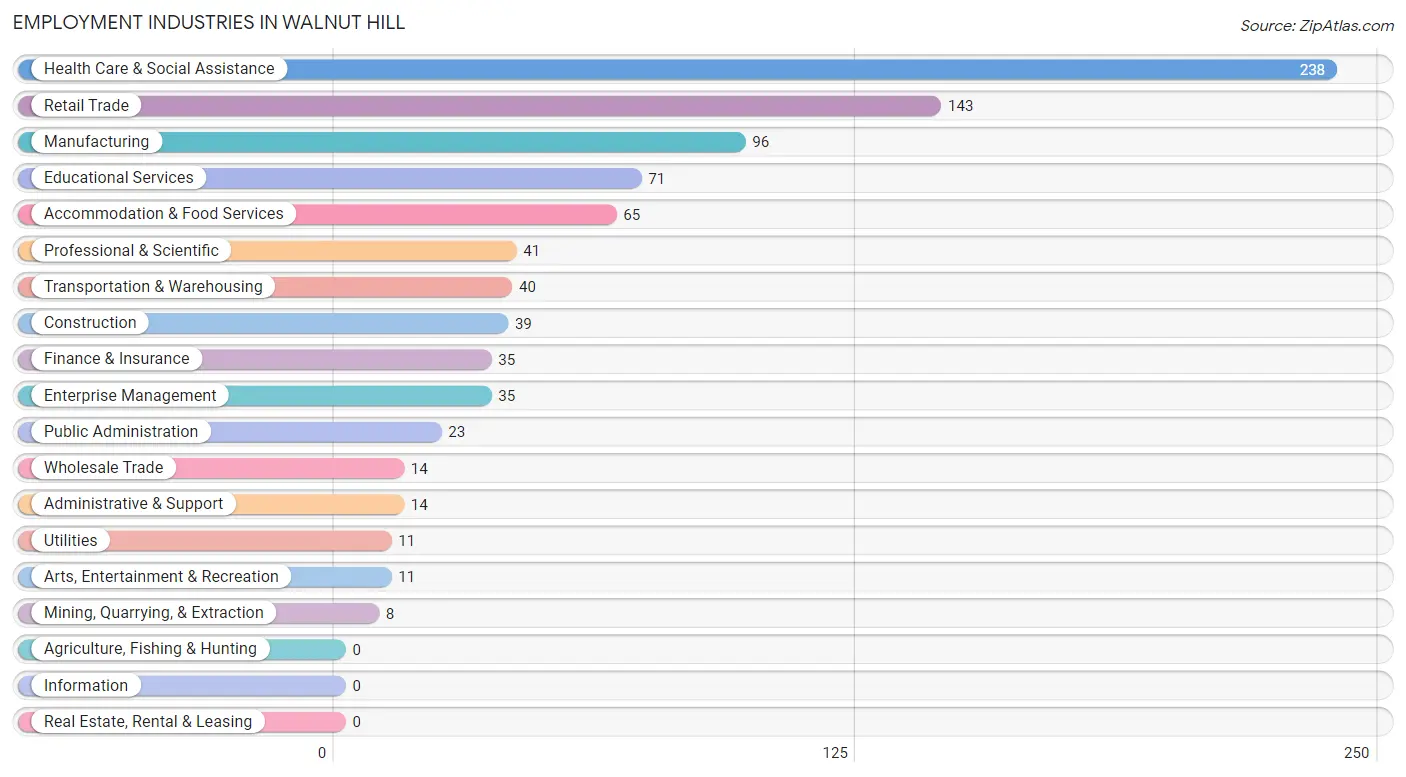
The major employment industries in Walnut Hill include Health Care & Social Assistance (238 | 24.3%), Retail Trade (143 | 14.6%), Manufacturing (96 | 9.8%), Educational Services (71 | 7.3%), and Accommodation & Food Services (65 | 6.7%).
Employment Industries by Sex in Walnut Hill
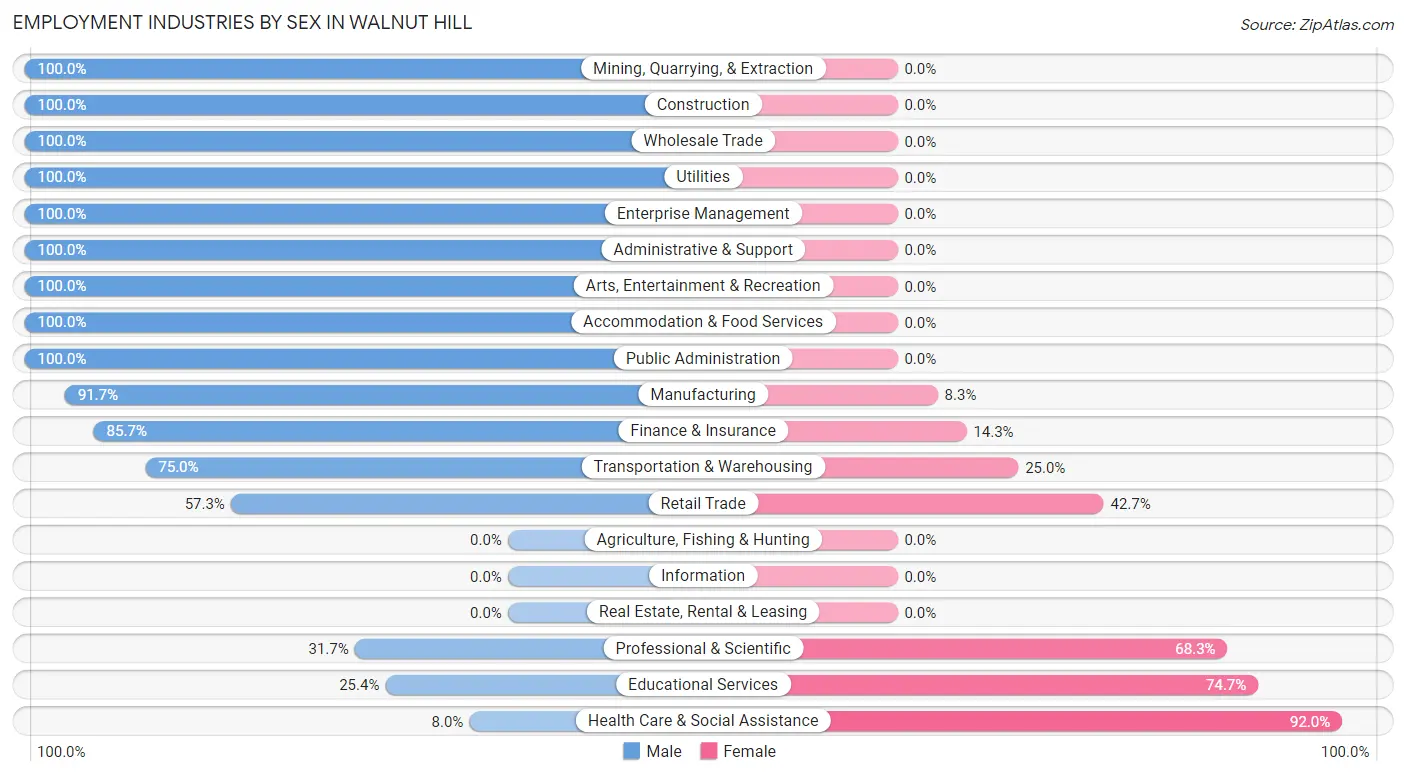
The Walnut Hill industries that see more men than women are Mining, Quarrying, & Extraction (100.0%), Construction (100.0%), and Wholesale Trade (100.0%), whereas the industries that tend to have a higher number of women are Health Care & Social Assistance (92.0%), Educational Services (74.7%), and Professional & Scientific (68.3%).
| Industry | Male | Female |
| Agriculture, Fishing & Hunting | 0 (0.0%) | 0 (0.0%) |
| Mining, Quarrying, & Extraction | 8 (100.0%) | 0 (0.0%) |
| Construction | 39 (100.0%) | 0 (0.0%) |
| Manufacturing | 88 (91.7%) | 8 (8.3%) |
| Wholesale Trade | 14 (100.0%) | 0 (0.0%) |
| Retail Trade | 82 (57.3%) | 61 (42.7%) |
| Transportation & Warehousing | 30 (75.0%) | 10 (25.0%) |
| Utilities | 11 (100.0%) | 0 (0.0%) |
| Information | 0 (0.0%) | 0 (0.0%) |
| Finance & Insurance | 30 (85.7%) | 5 (14.3%) |
| Real Estate, Rental & Leasing | 0 (0.0%) | 0 (0.0%) |
| Professional & Scientific | 13 (31.7%) | 28 (68.3%) |
| Enterprise Management | 35 (100.0%) | 0 (0.0%) |
| Administrative & Support | 14 (100.0%) | 0 (0.0%) |
| Educational Services | 18 (25.4%) | 53 (74.7%) |
| Health Care & Social Assistance | 19 (8.0%) | 219 (92.0%) |
| Arts, Entertainment & Recreation | 11 (100.0%) | 0 (0.0%) |
| Accommodation & Food Services | 65 (100.0%) | 0 (0.0%) |
| Public Administration | 23 (100.0%) | 0 (0.0%) |
| Total | 561 (57.4%) | 417 (42.6%) |
Education in Walnut Hill
School Enrollment in Walnut Hill
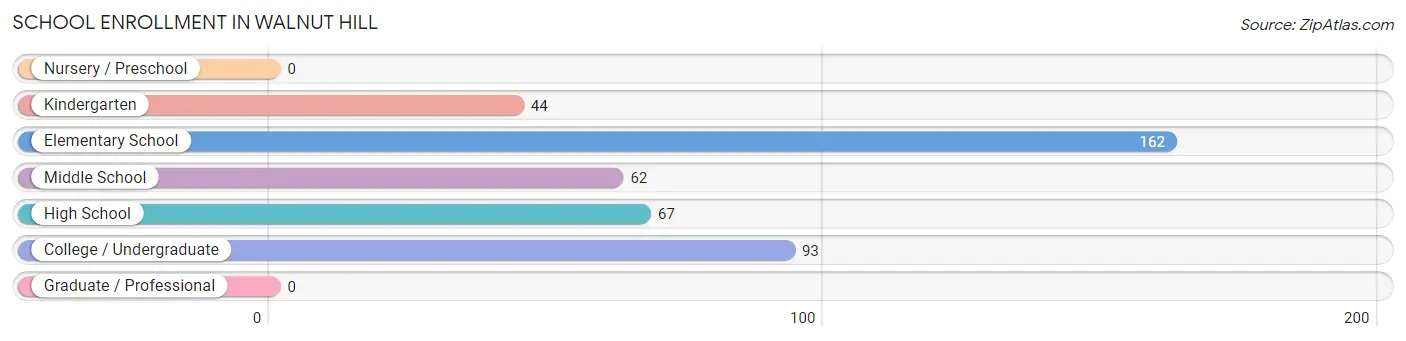
The most common levels of schooling among the 428 students in Walnut Hill are elementary school (162 | 37.9%), college / undergraduate (93 | 21.7%), and high school (67 | 15.7%).
| School Level | # Students | % Students |
| Nursery / Preschool | 0 | 0.0% |
| Kindergarten | 44 | 10.3% |
| Elementary School | 162 | 37.9% |
| Middle School | 62 | 14.5% |
| High School | 67 | 15.7% |
| College / Undergraduate | 93 | 21.7% |
| Graduate / Professional | 0 | 0.0% |
| Total | 428 | 100.0% |
School Enrollment by Age by Funding Source in Walnut Hill
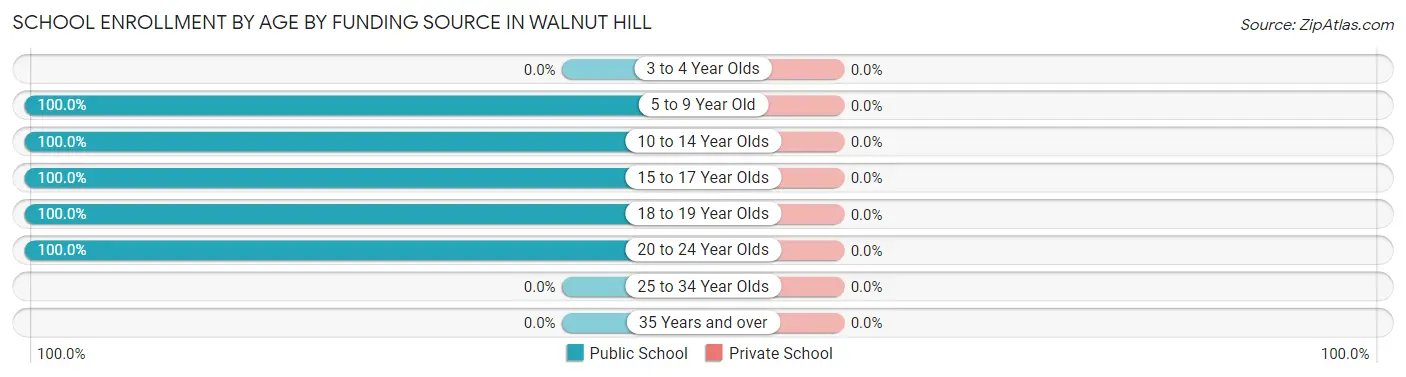
| Age Bracket | Public School | Private School |
| 3 to 4 Year Olds | 0 (0.0%) | 0 (0.0%) |
| 5 to 9 Year Old | 206 (100.0%) | 0 (0.0%) |
| 10 to 14 Year Olds | 62 (100.0%) | 0 (0.0%) |
| 15 to 17 Year Olds | 67 (100.0%) | 0 (0.0%) |
| 18 to 19 Year Olds | 9 (100.0%) | 0 (0.0%) |
| 20 to 24 Year Olds | 84 (100.0%) | 0 (0.0%) |
| 25 to 34 Year Olds | 0 (0.0%) | 0 (0.0%) |
| 35 Years and over | 0 (0.0%) | 0 (0.0%) |
| Total | 428 (100.0%) | 0 (0.0%) |
Educational Attainment by Field of Study in Walnut Hill
Social sciences (165 | 28.5%), visual & performing arts (129 | 22.3%), science & technology (100 | 17.3%), arts & humanities (55 | 9.5%), and education (35 | 6.0%) are the most common fields of study among 579 individuals in Walnut Hill who have obtained a bachelor's degree or higher.
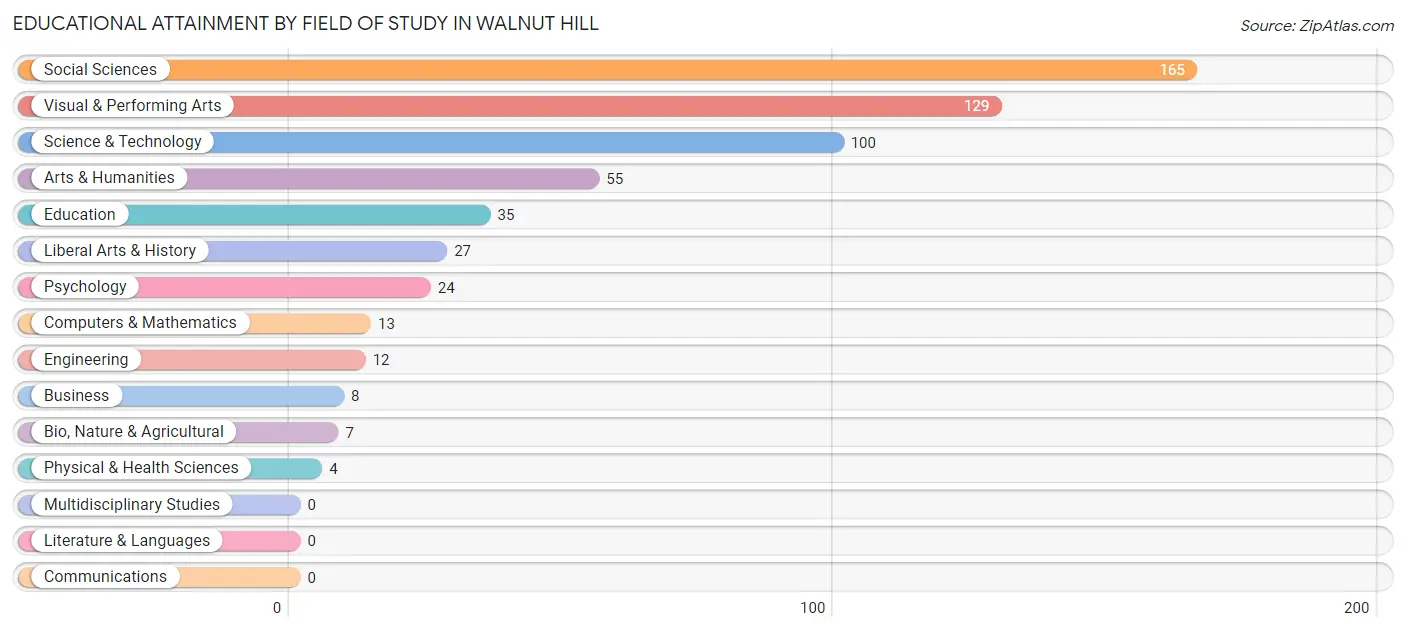
| Field of Study | # Graduates | % Graduates |
| Computers & Mathematics | 13 | 2.2% |
| Bio, Nature & Agricultural | 7 | 1.2% |
| Physical & Health Sciences | 4 | 0.7% |
| Psychology | 24 | 4.2% |
| Social Sciences | 165 | 28.5% |
| Engineering | 12 | 2.1% |
| Multidisciplinary Studies | 0 | 0.0% |
| Science & Technology | 100 | 17.3% |
| Business | 8 | 1.4% |
| Education | 35 | 6.0% |
| Literature & Languages | 0 | 0.0% |
| Liberal Arts & History | 27 | 4.7% |
| Visual & Performing Arts | 129 | 22.3% |
| Communications | 0 | 0.0% |
| Arts & Humanities | 55 | 9.5% |
| Total | 579 | 100.0% |
Transportation & Commute in Walnut Hill
Vehicle Availability by Sex in Walnut Hill
The most prevalent vehicle ownership categories in Walnut Hill are males with 2 vehicles (192, accounting for 34.2%) and females with 2 vehicles (124, making up 46.0%).
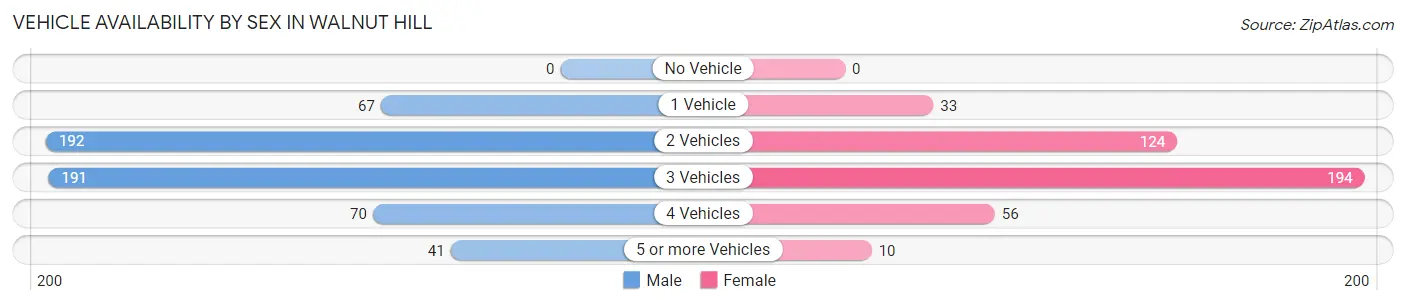
| Vehicles Available | Male | Female |
| No Vehicle | 0 (0.0%) | 0 (0.0%) |
| 1 Vehicle | 67 (11.9%) | 33 (7.9%) |
| 2 Vehicles | 192 (34.2%) | 124 (29.7%) |
| 3 Vehicles | 191 (34.1%) | 194 (46.5%) |
| 4 Vehicles | 70 (12.5%) | 56 (13.4%) |
| 5 or more Vehicles | 41 (7.3%) | 10 (2.4%) |
| Total | 561 (100.0%) | 417 (100.0%) |
Commute Time in Walnut Hill
The most frequently occuring commute durations in Walnut Hill are 10 to 14 minutes (216 commuters, 23.6%), 15 to 19 minutes (164 commuters, 17.9%), and 20 to 24 minutes (150 commuters, 16.4%).
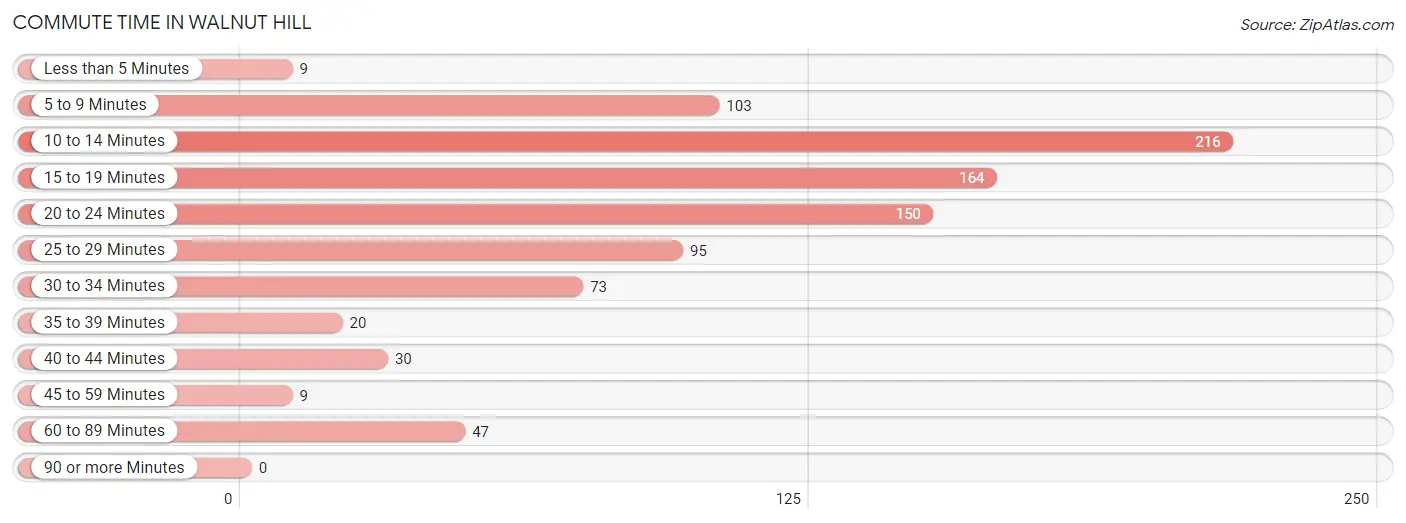
| Commute Time | # Commuters | % Commuters |
| Less than 5 Minutes | 9 | 1.0% |
| 5 to 9 Minutes | 103 | 11.2% |
| 10 to 14 Minutes | 216 | 23.6% |
| 15 to 19 Minutes | 164 | 17.9% |
| 20 to 24 Minutes | 150 | 16.4% |
| 25 to 29 Minutes | 95 | 10.4% |
| 30 to 34 Minutes | 73 | 8.0% |
| 35 to 39 Minutes | 20 | 2.2% |
| 40 to 44 Minutes | 30 | 3.3% |
| 45 to 59 Minutes | 9 | 1.0% |
| 60 to 89 Minutes | 47 | 5.1% |
| 90 or more Minutes | 0 | 0.0% |
Commute Time by Sex in Walnut Hill
The most common commute times in Walnut Hill are 15 to 19 minutes (114 commuters, 21.7%) for males and 10 to 14 minutes (119 commuters, 30.5%) for females.
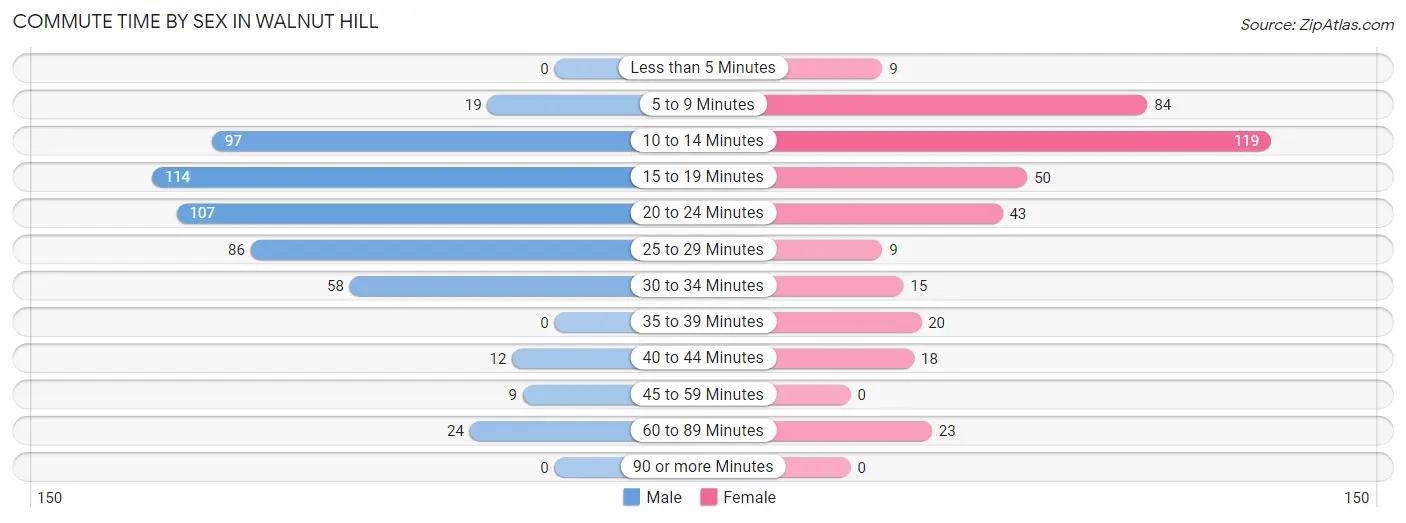
| Commute Time | Male | Female |
| Less than 5 Minutes | 0 (0.0%) | 9 (2.3%) |
| 5 to 9 Minutes | 19 (3.6%) | 84 (21.5%) |
| 10 to 14 Minutes | 97 (18.4%) | 119 (30.5%) |
| 15 to 19 Minutes | 114 (21.7%) | 50 (12.8%) |
| 20 to 24 Minutes | 107 (20.3%) | 43 (11.0%) |
| 25 to 29 Minutes | 86 (16.4%) | 9 (2.3%) |
| 30 to 34 Minutes | 58 (11.0%) | 15 (3.8%) |
| 35 to 39 Minutes | 0 (0.0%) | 20 (5.1%) |
| 40 to 44 Minutes | 12 (2.3%) | 18 (4.6%) |
| 45 to 59 Minutes | 9 (1.7%) | 0 (0.0%) |
| 60 to 89 Minutes | 24 (4.6%) | 23 (5.9%) |
| 90 or more Minutes | 0 (0.0%) | 0 (0.0%) |
Time of Departure to Work by Sex in Walnut Hill
The most frequent times of departure to work in Walnut Hill are 7:30 AM to 7:59 AM (126, 23.9%) for males and 7:00 AM to 7:29 AM (97, 24.9%) for females.
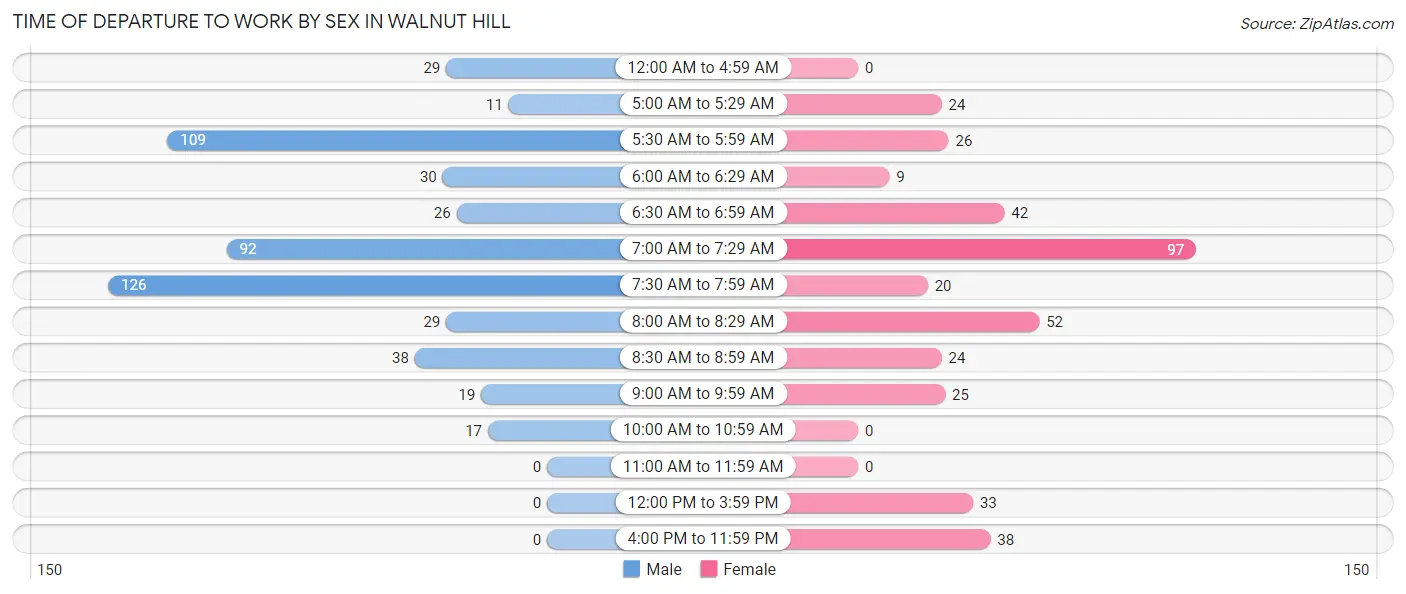
| Time of Departure | Male | Female |
| 12:00 AM to 4:59 AM | 29 (5.5%) | 0 (0.0%) |
| 5:00 AM to 5:29 AM | 11 (2.1%) | 24 (6.1%) |
| 5:30 AM to 5:59 AM | 109 (20.7%) | 26 (6.7%) |
| 6:00 AM to 6:29 AM | 30 (5.7%) | 9 (2.3%) |
| 6:30 AM to 6:59 AM | 26 (4.9%) | 42 (10.8%) |
| 7:00 AM to 7:29 AM | 92 (17.5%) | 97 (24.9%) |
| 7:30 AM to 7:59 AM | 126 (23.9%) | 20 (5.1%) |
| 8:00 AM to 8:29 AM | 29 (5.5%) | 52 (13.3%) |
| 8:30 AM to 8:59 AM | 38 (7.2%) | 24 (6.1%) |
| 9:00 AM to 9:59 AM | 19 (3.6%) | 25 (6.4%) |
| 10:00 AM to 10:59 AM | 17 (3.2%) | 0 (0.0%) |
| 11:00 AM to 11:59 AM | 0 (0.0%) | 0 (0.0%) |
| 12:00 PM to 3:59 PM | 0 (0.0%) | 33 (8.5%) |
| 4:00 PM to 11:59 PM | 0 (0.0%) | 38 (9.7%) |
| Total | 526 (100.0%) | 390 (100.0%) |
Housing Occupancy in Walnut Hill
Occupancy by Ownership in Walnut Hill
Of the total 861 dwellings in Walnut Hill, owner-occupied units account for 822 (95.5%), while renter-occupied units make up 39 (4.5%).
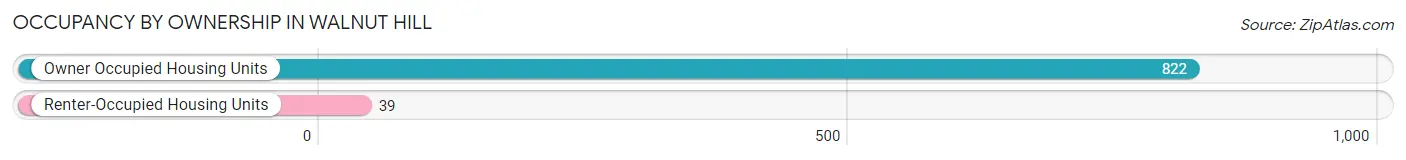
| Occupancy | # Housing Units | % Housing Units |
| Owner Occupied Housing Units | 822 | 95.5% |
| Renter-Occupied Housing Units | 39 | 4.5% |
| Total Occupied Housing Units | 861 | 100.0% |
Occupancy by Household Size in Walnut Hill
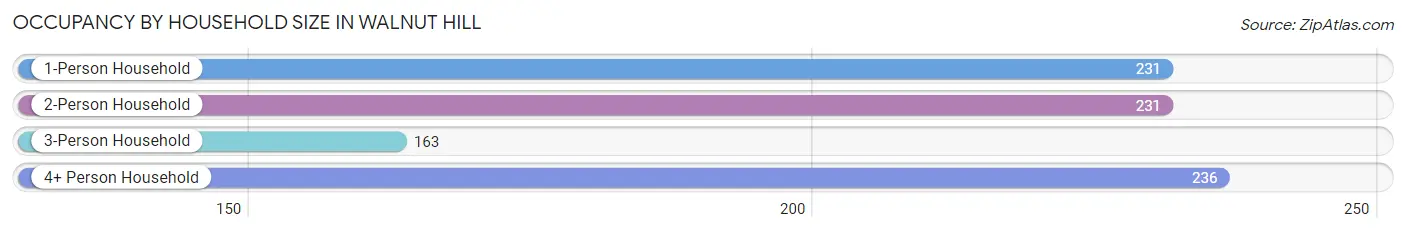
| Household Size | # Housing Units | % Housing Units |
| 1-Person Household | 231 | 26.8% |
| 2-Person Household | 231 | 26.8% |
| 3-Person Household | 163 | 18.9% |
| 4+ Person Household | 236 | 27.4% |
| Total Housing Units | 861 | 100.0% |
Occupancy by Ownership by Household Size in Walnut Hill
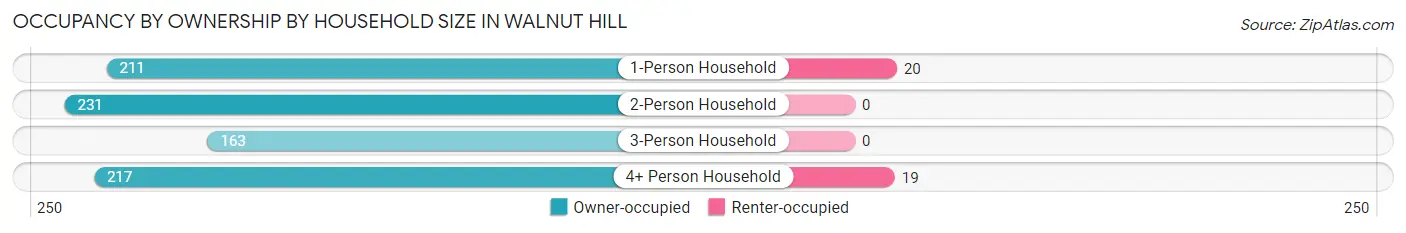
| Household Size | Owner-occupied | Renter-occupied |
| 1-Person Household | 211 (91.3%) | 20 (8.7%) |
| 2-Person Household | 231 (100.0%) | 0 (0.0%) |
| 3-Person Household | 163 (100.0%) | 0 (0.0%) |
| 4+ Person Household | 217 (91.9%) | 19 (8.1%) |
| Total Housing Units | 822 (95.5%) | 39 (4.5%) |
Occupancy by Educational Attainment in Walnut Hill
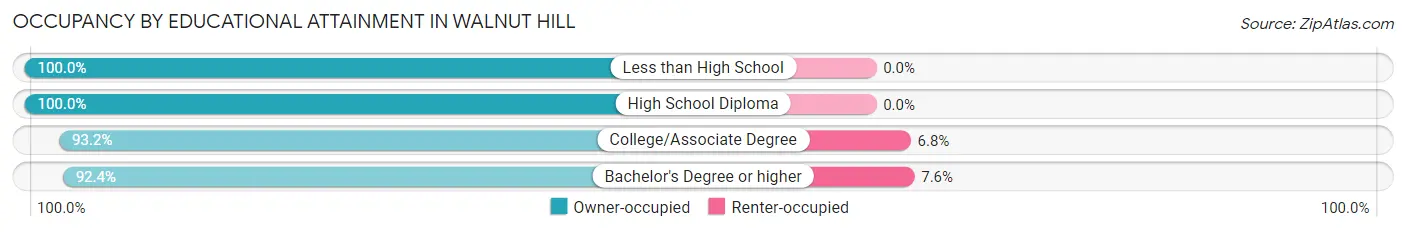
| Household Size | Owner-occupied | Renter-occupied |
| Less than High School | 121 (100.0%) | 0 (0.0%) |
| High School Diploma | 187 (100.0%) | 0 (0.0%) |
| College/Associate Degree | 355 (93.2%) | 26 (6.8%) |
| Bachelor's Degree or higher | 159 (92.4%) | 13 (7.6%) |
Occupancy by Age of Householder in Walnut Hill
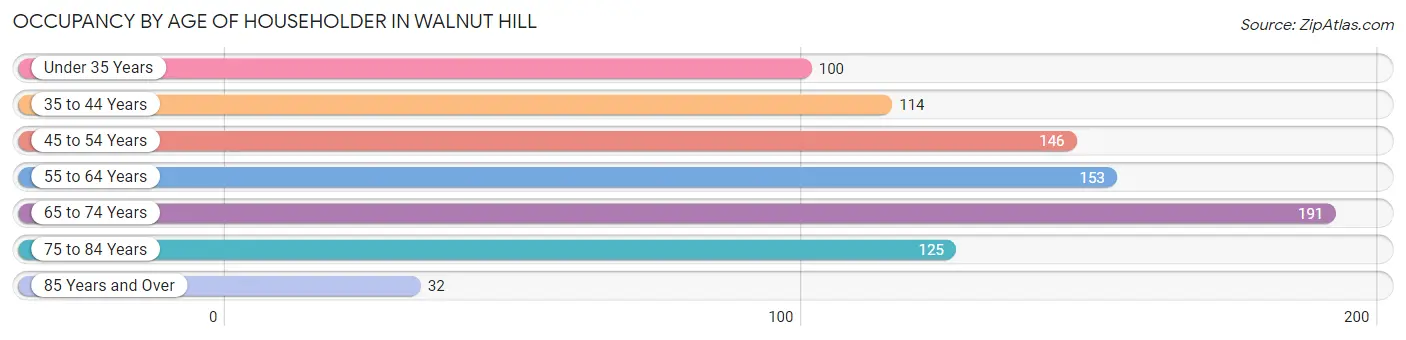
| Age Bracket | # Households | % Households |
| Under 35 Years | 100 | 11.6% |
| 35 to 44 Years | 114 | 13.2% |
| 45 to 54 Years | 146 | 17.0% |
| 55 to 64 Years | 153 | 17.8% |
| 65 to 74 Years | 191 | 22.2% |
| 75 to 84 Years | 125 | 14.5% |
| 85 Years and Over | 32 | 3.7% |
| Total | 861 | 100.0% |
Housing Finances in Walnut Hill
Median Income by Occupancy in Walnut Hill
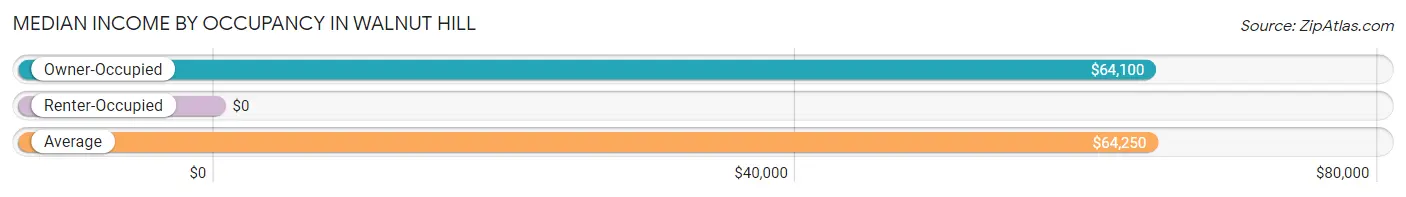
| Occupancy Type | # Households | Median Income |
| Owner-Occupied | 822 (95.5%) | $64,100 |
| Renter-Occupied | 39 (4.5%) | $0 |
| Average | 861 (100.0%) | $64,250 |
Occupancy by Householder Income Bracket in Walnut Hill
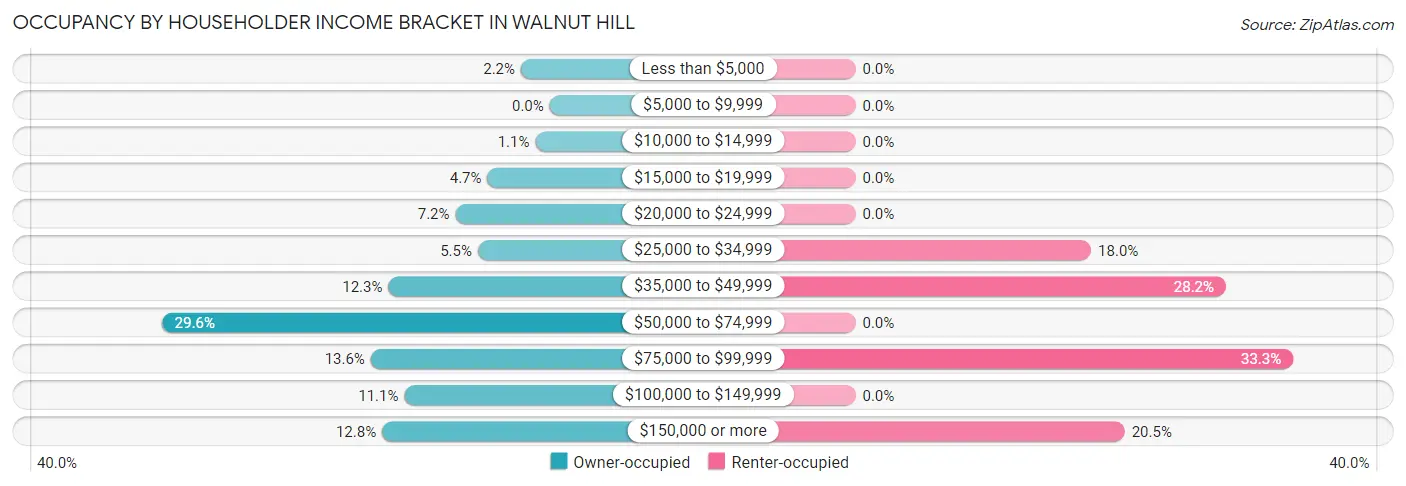
| Income Bracket | Owner-occupied | Renter-occupied |
| Less than $5,000 | 18 (2.2%) | 0 (0.0%) |
| $5,000 to $9,999 | 0 (0.0%) | 0 (0.0%) |
| $10,000 to $14,999 | 9 (1.1%) | 0 (0.0%) |
| $15,000 to $19,999 | 39 (4.7%) | 0 (0.0%) |
| $20,000 to $24,999 | 59 (7.2%) | 0 (0.0%) |
| $25,000 to $34,999 | 45 (5.5%) | 7 (17.9%) |
| $35,000 to $49,999 | 101 (12.3%) | 11 (28.2%) |
| $50,000 to $74,999 | 243 (29.6%) | 0 (0.0%) |
| $75,000 to $99,999 | 112 (13.6%) | 13 (33.3%) |
| $100,000 to $149,999 | 91 (11.1%) | 0 (0.0%) |
| $150,000 or more | 105 (12.8%) | 8 (20.5%) |
| Total | 822 (100.0%) | 39 (100.0%) |
Monthly Housing Cost Tiers in Walnut Hill
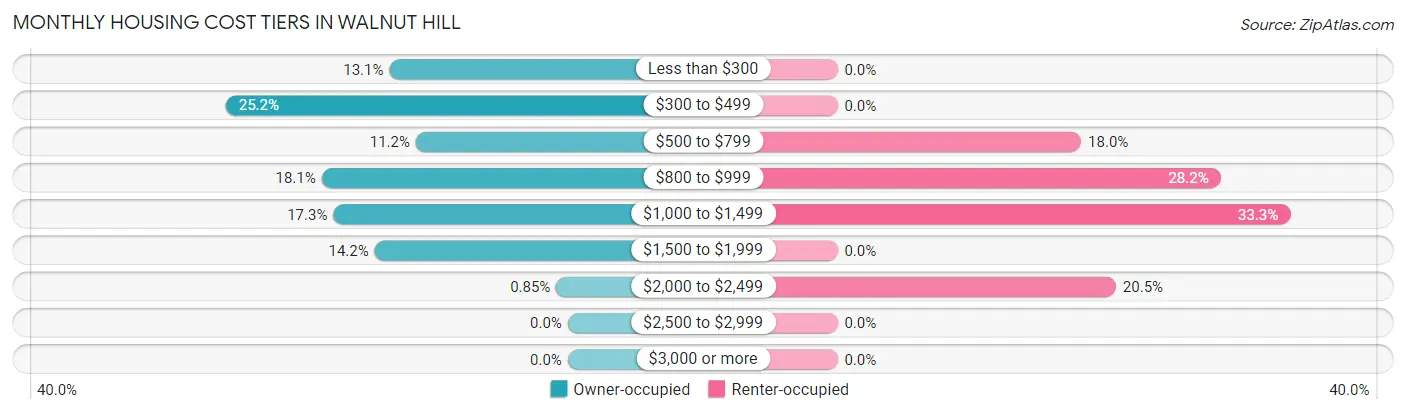
| Monthly Cost | Owner-occupied | Renter-occupied |
| Less than $300 | 108 (13.1%) | 0 (0.0%) |
| $300 to $499 | 207 (25.2%) | 0 (0.0%) |
| $500 to $799 | 92 (11.2%) | 7 (17.9%) |
| $800 to $999 | 149 (18.1%) | 11 (28.2%) |
| $1,000 to $1,499 | 142 (17.3%) | 13 (33.3%) |
| $1,500 to $1,999 | 117 (14.2%) | 0 (0.0%) |
| $2,000 to $2,499 | 7 (0.9%) | 8 (20.5%) |
| $2,500 to $2,999 | 0 (0.0%) | 0 (0.0%) |
| $3,000 or more | 0 (0.0%) | 0 (0.0%) |
| Total | 822 (100.0%) | 39 (100.0%) |
Physical Housing Characteristics in Walnut Hill
Housing Structures in Walnut Hill
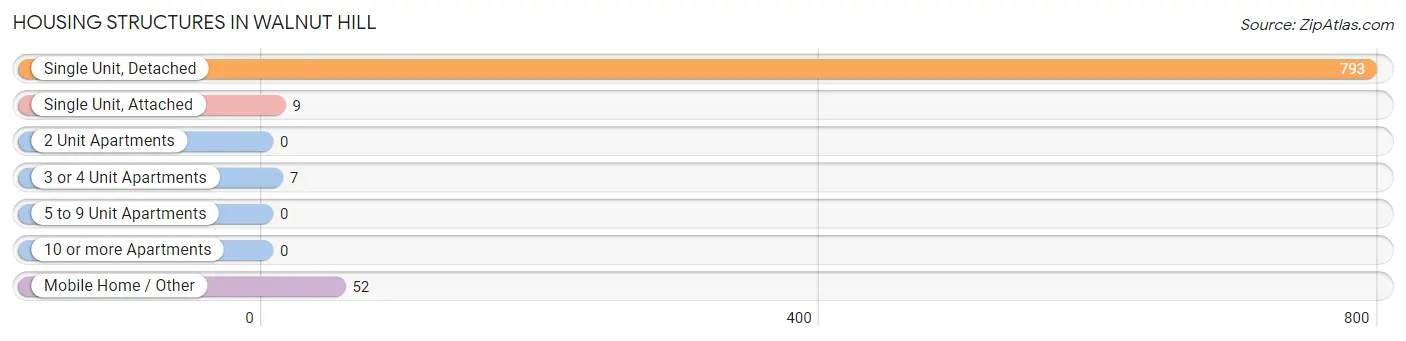
| Structure Type | # Housing Units | % Housing Units |
| Single Unit, Detached | 793 | 92.1% |
| Single Unit, Attached | 9 | 1.1% |
| 2 Unit Apartments | 0 | 0.0% |
| 3 or 4 Unit Apartments | 7 | 0.8% |
| 5 to 9 Unit Apartments | 0 | 0.0% |
| 10 or more Apartments | 0 | 0.0% |
| Mobile Home / Other | 52 | 6.0% |
| Total | 861 | 100.0% |
Housing Structures by Occupancy in Walnut Hill
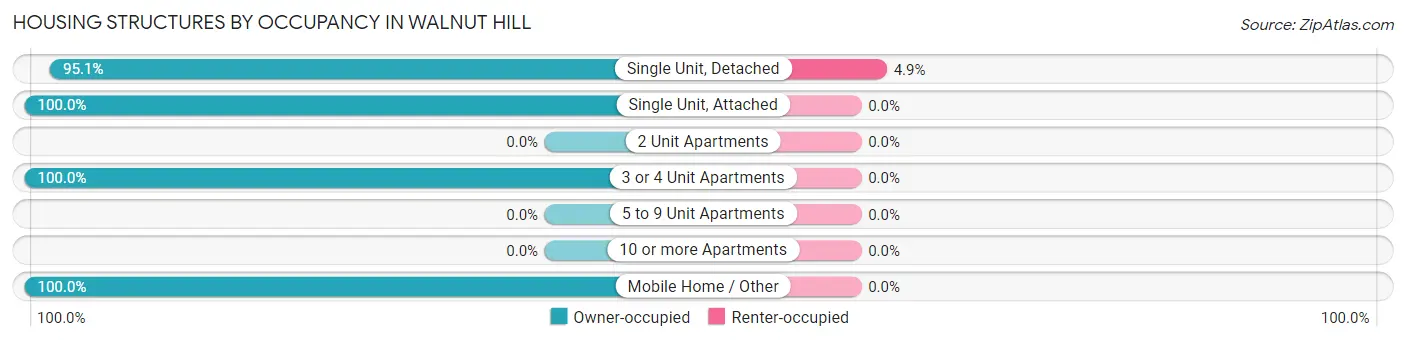
| Structure Type | Owner-occupied | Renter-occupied |
| Single Unit, Detached | 754 (95.1%) | 39 (4.9%) |
| Single Unit, Attached | 9 (100.0%) | 0 (0.0%) |
| 2 Unit Apartments | 0 (0.0%) | 0 (0.0%) |
| 3 or 4 Unit Apartments | 7 (100.0%) | 0 (0.0%) |
| 5 to 9 Unit Apartments | 0 (0.0%) | 0 (0.0%) |
| 10 or more Apartments | 0 (0.0%) | 0 (0.0%) |
| Mobile Home / Other | 52 (100.0%) | 0 (0.0%) |
| Total | 822 (95.5%) | 39 (4.5%) |
Housing Structures by Number of Rooms in Walnut Hill
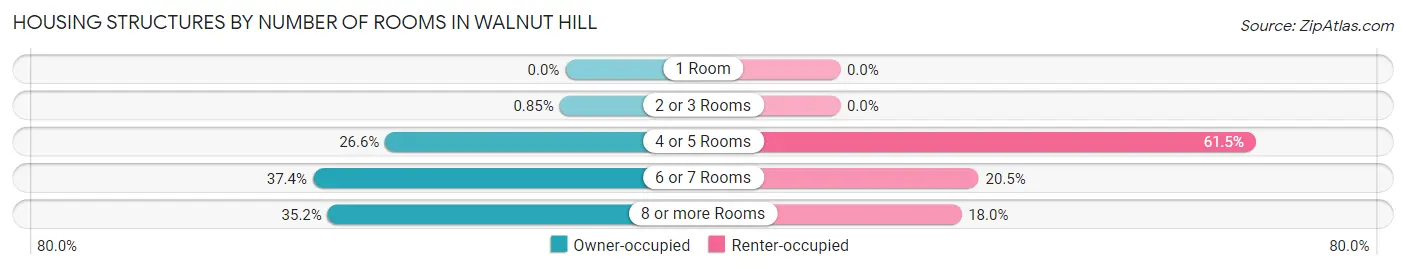
| Number of Rooms | Owner-occupied | Renter-occupied |
| 1 Room | 0 (0.0%) | 0 (0.0%) |
| 2 or 3 Rooms | 7 (0.9%) | 0 (0.0%) |
| 4 or 5 Rooms | 219 (26.6%) | 24 (61.5%) |
| 6 or 7 Rooms | 307 (37.3%) | 8 (20.5%) |
| 8 or more Rooms | 289 (35.2%) | 7 (17.9%) |
| Total | 822 (100.0%) | 39 (100.0%) |
Housing Structure by Heating Type in Walnut Hill
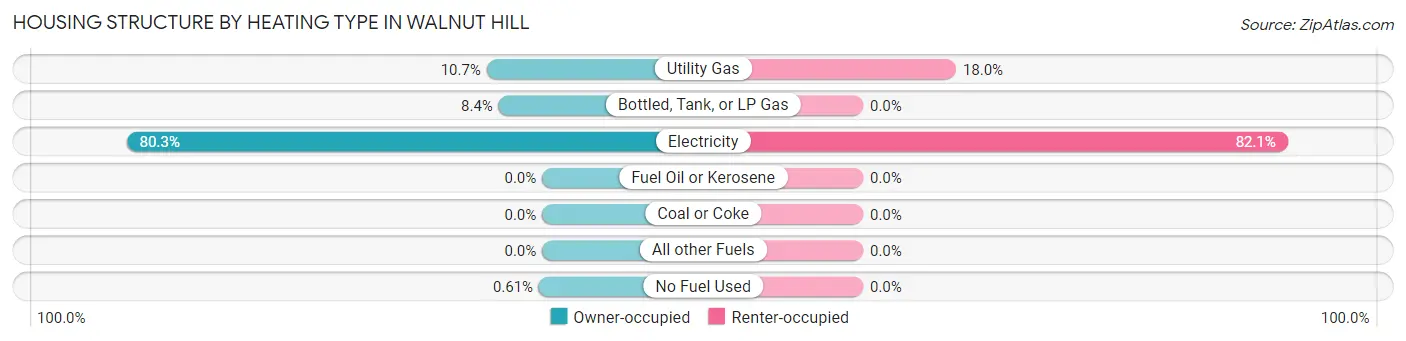
| Heating Type | Owner-occupied | Renter-occupied |
| Utility Gas | 88 (10.7%) | 7 (17.9%) |
| Bottled, Tank, or LP Gas | 69 (8.4%) | 0 (0.0%) |
| Electricity | 660 (80.3%) | 32 (82.1%) |
| Fuel Oil or Kerosene | 0 (0.0%) | 0 (0.0%) |
| Coal or Coke | 0 (0.0%) | 0 (0.0%) |
| All other Fuels | 0 (0.0%) | 0 (0.0%) |
| No Fuel Used | 5 (0.6%) | 0 (0.0%) |
| Total | 822 (100.0%) | 39 (100.0%) |
Household Vehicle Usage in Walnut Hill
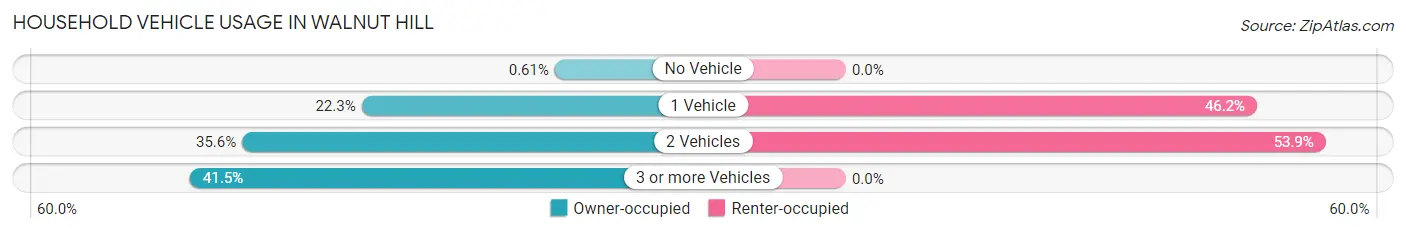
| Vehicles per Household | Owner-occupied | Renter-occupied |
| No Vehicle | 5 (0.6%) | 0 (0.0%) |
| 1 Vehicle | 183 (22.3%) | 18 (46.2%) |
| 2 Vehicles | 293 (35.6%) | 21 (53.8%) |
| 3 or more Vehicles | 341 (41.5%) | 0 (0.0%) |
| Total | 822 (100.0%) | 39 (100.0%) |
Real Estate & Mortgages in Walnut Hill
Real Estate and Mortgage Overview in Walnut Hill
| Characteristic | Without Mortgage | With Mortgage |
| Housing Units | 406 | 416 |
| Median Property Value | $150,000 | $171,200 |
| Median Household Income | $62,411 | $72 |
| Monthly Housing Costs | $391 | $0 |
| Real Estate Taxes | $849 | $17 |
Property Value by Mortgage Status in Walnut Hill
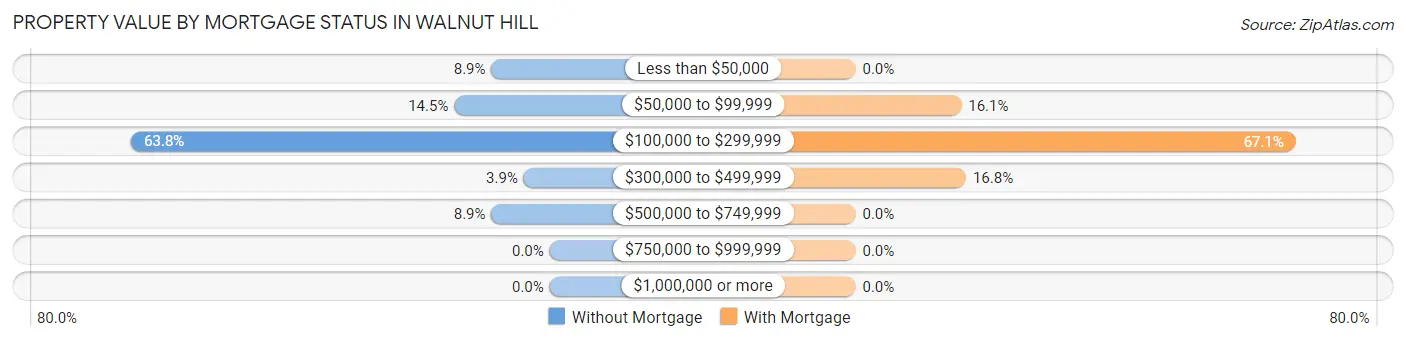
| Property Value | Without Mortgage | With Mortgage |
| Less than $50,000 | 36 (8.9%) | 0 (0.0%) |
| $50,000 to $99,999 | 59 (14.5%) | 67 (16.1%) |
| $100,000 to $299,999 | 259 (63.8%) | 279 (67.1%) |
| $300,000 to $499,999 | 16 (3.9%) | 70 (16.8%) |
| $500,000 to $749,999 | 36 (8.9%) | 0 (0.0%) |
| $750,000 to $999,999 | 0 (0.0%) | 0 (0.0%) |
| $1,000,000 or more | 0 (0.0%) | 0 (0.0%) |
| Total | 406 (100.0%) | 416 (100.0%) |
Household Income by Mortgage Status in Walnut Hill
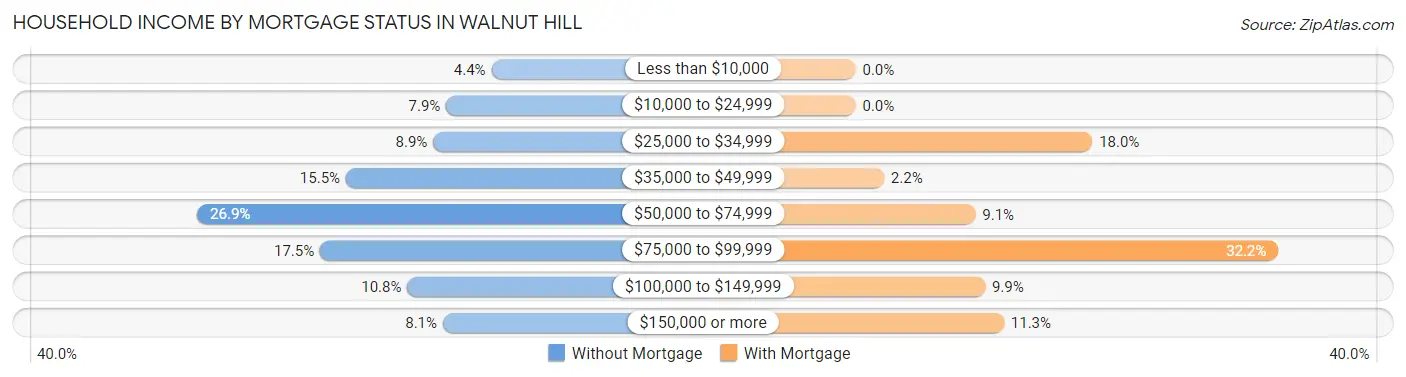
| Household Income | Without Mortgage | With Mortgage |
| Less than $10,000 | 18 (4.4%) | 0 (0.0%) |
| $10,000 to $24,999 | 32 (7.9%) | 0 (0.0%) |
| $25,000 to $34,999 | 36 (8.9%) | 75 (18.0%) |
| $35,000 to $49,999 | 63 (15.5%) | 9 (2.2%) |
| $50,000 to $74,999 | 109 (26.9%) | 38 (9.1%) |
| $75,000 to $99,999 | 71 (17.5%) | 134 (32.2%) |
| $100,000 to $149,999 | 44 (10.8%) | 41 (9.9%) |
| $150,000 or more | 33 (8.1%) | 47 (11.3%) |
| Total | 406 (100.0%) | 416 (100.0%) |
Property Value to Household Income Ratio in Walnut Hill
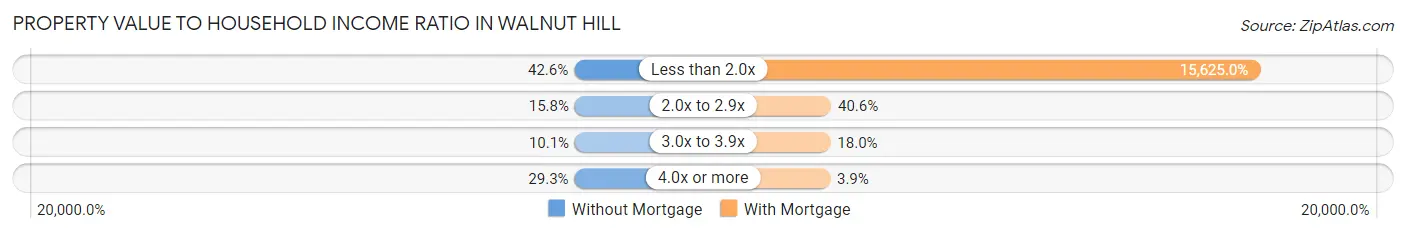
| Value-to-Income Ratio | Without Mortgage | With Mortgage |
| Less than 2.0x | 173 (42.6%) | 65,000 (15,625.0%) |
| 2.0x to 2.9x | 64 (15.8%) | 169 (40.6%) |
| 3.0x to 3.9x | 41 (10.1%) | 75 (18.0%) |
| 4.0x or more | 119 (29.3%) | 16 (3.8%) |
| Total | 406 (100.0%) | 416 (100.0%) |
Real Estate Taxes by Mortgage Status in Walnut Hill
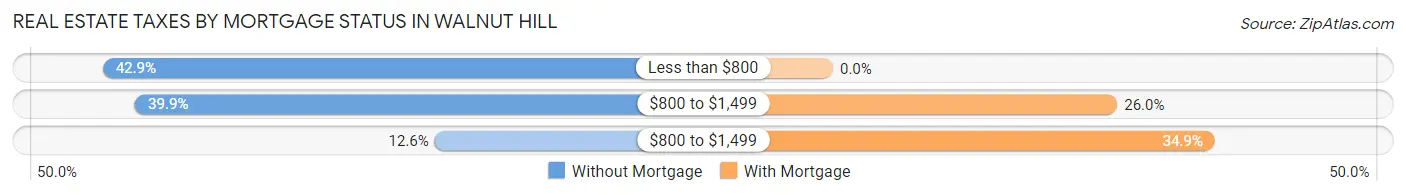
| Property Taxes | Without Mortgage | With Mortgage |
| Less than $800 | 174 (42.9%) | 0 (0.0%) |
| $800 to $1,499 | 162 (39.9%) | 108 (26.0%) |
| $800 to $1,499 | 51 (12.6%) | 145 (34.9%) |
| Total | 406 (100.0%) | 416 (100.0%) |
Health & Disability in Walnut Hill
Health Insurance Coverage by Age in Walnut Hill
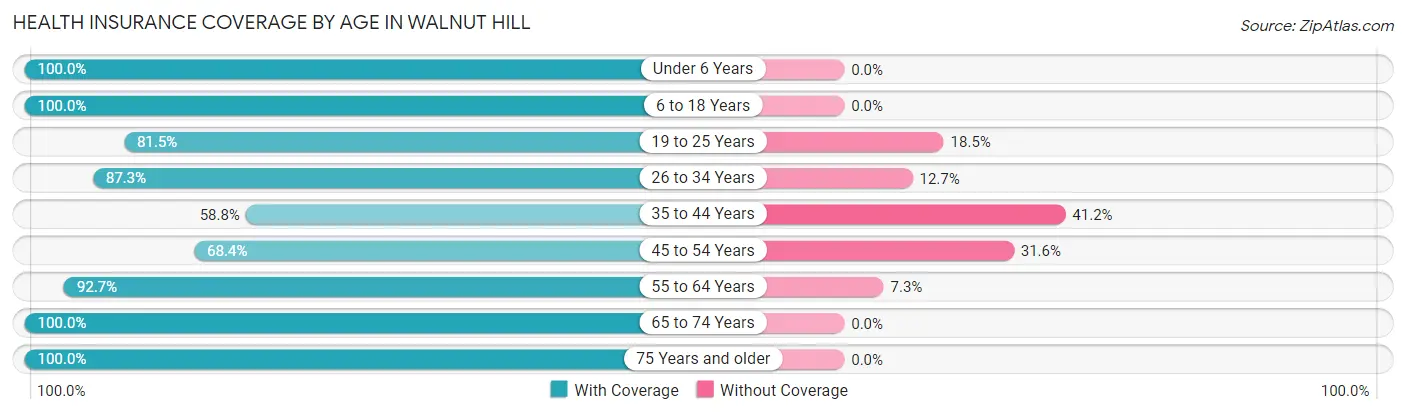
| Age Bracket | With Coverage | Without Coverage |
| Under 6 Years | 121 (100.0%) | 0 (0.0%) |
| 6 to 18 Years | 325 (100.0%) | 0 (0.0%) |
| 19 to 25 Years | 189 (81.5%) | 43 (18.5%) |
| 26 to 34 Years | 199 (87.3%) | 29 (12.7%) |
| 35 to 44 Years | 238 (58.8%) | 167 (41.2%) |
| 45 to 54 Years | 290 (68.4%) | 134 (31.6%) |
| 55 to 64 Years | 253 (92.7%) | 20 (7.3%) |
| 65 to 74 Years | 352 (100.0%) | 0 (0.0%) |
| 75 Years and older | 288 (100.0%) | 0 (0.0%) |
| Total | 2,255 (85.2%) | 393 (14.8%) |
Health Insurance Coverage by Citizenship Status in Walnut Hill
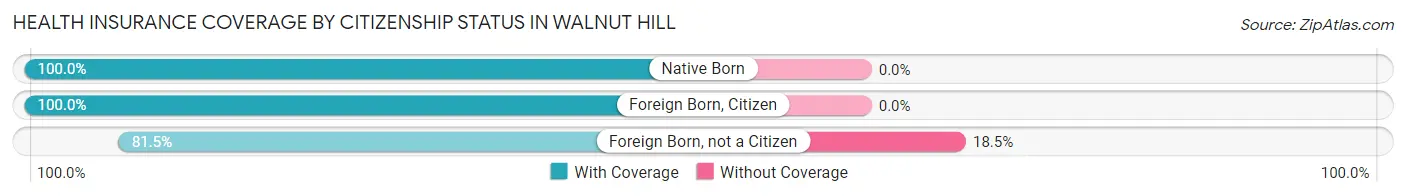
| Citizenship Status | With Coverage | Without Coverage |
| Native Born | 121 (100.0%) | 0 (0.0%) |
| Foreign Born, Citizen | 325 (100.0%) | 0 (0.0%) |
| Foreign Born, not a Citizen | 189 (81.5%) | 43 (18.5%) |
Health Insurance Coverage by Household Income in Walnut Hill
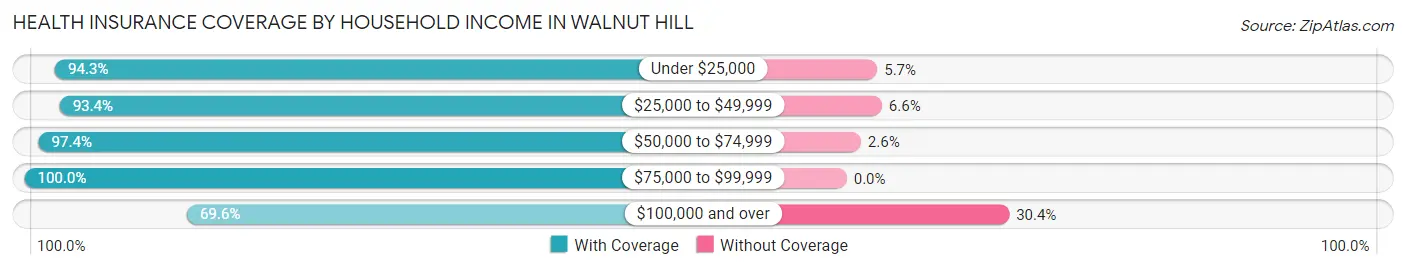
| Household Income | With Coverage | Without Coverage |
| Under $25,000 | 165 (94.3%) | 10 (5.7%) |
| $25,000 to $49,999 | 284 (93.4%) | 20 (6.6%) |
| $50,000 to $74,999 | 739 (97.4%) | 20 (2.6%) |
| $75,000 to $99,999 | 283 (100.0%) | 0 (0.0%) |
| $100,000 and over | 784 (69.6%) | 343 (30.4%) |
Public vs Private Health Insurance Coverage by Age in Walnut Hill
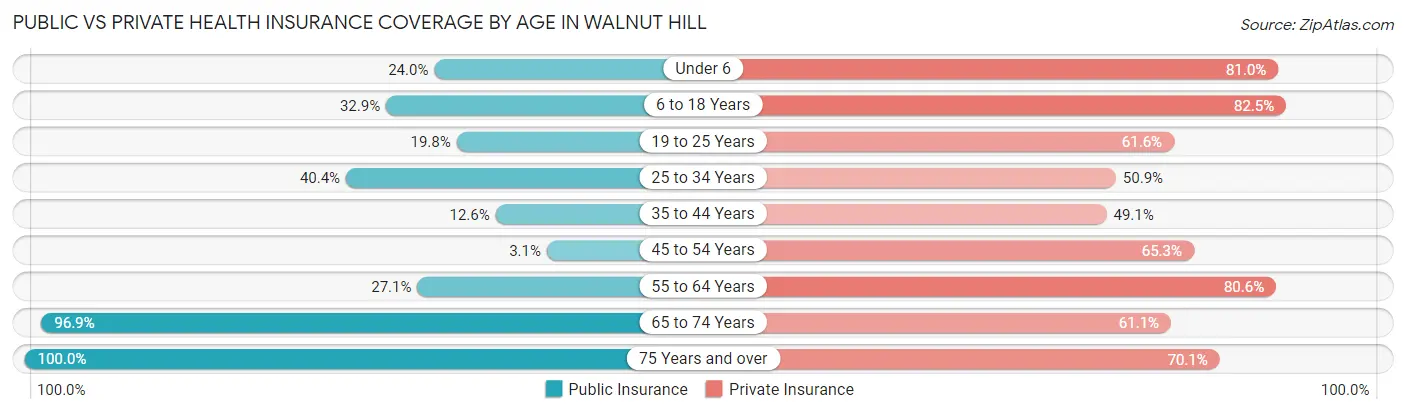
| Age Bracket | Public Insurance | Private Insurance |
| Under 6 | 29 (24.0%) | 98 (81.0%) |
| 6 to 18 Years | 107 (32.9%) | 268 (82.5%) |
| 19 to 25 Years | 46 (19.8%) | 143 (61.6%) |
| 25 to 34 Years | 92 (40.4%) | 116 (50.9%) |
| 35 to 44 Years | 51 (12.6%) | 199 (49.1%) |
| 45 to 54 Years | 13 (3.1%) | 277 (65.3%) |
| 55 to 64 Years | 74 (27.1%) | 220 (80.6%) |
| 65 to 74 Years | 341 (96.9%) | 215 (61.1%) |
| 75 Years and over | 288 (100.0%) | 202 (70.1%) |
| Total | 1,041 (39.3%) | 1,738 (65.6%) |
Disability Status by Sex by Age in Walnut Hill
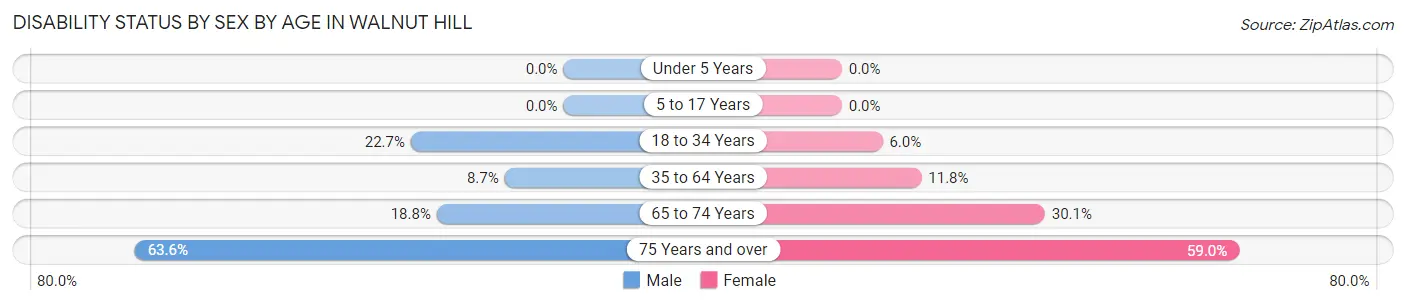
| Age Bracket | Male | Female |
| Under 5 Years | 0 (0.0%) | 0 (0.0%) |
| 5 to 17 Years | 0 (0.0%) | 0 (0.0%) |
| 18 to 34 Years | 65 (22.7%) | 11 (6.0%) |
| 35 to 64 Years | 60 (8.7%) | 49 (11.8%) |
| 65 to 74 Years | 25 (18.8%) | 66 (30.1%) |
| 75 Years and over | 70 (63.6%) | 105 (59.0%) |
Disability Class by Sex by Age in Walnut Hill
Disability Class: Hearing Difficulty
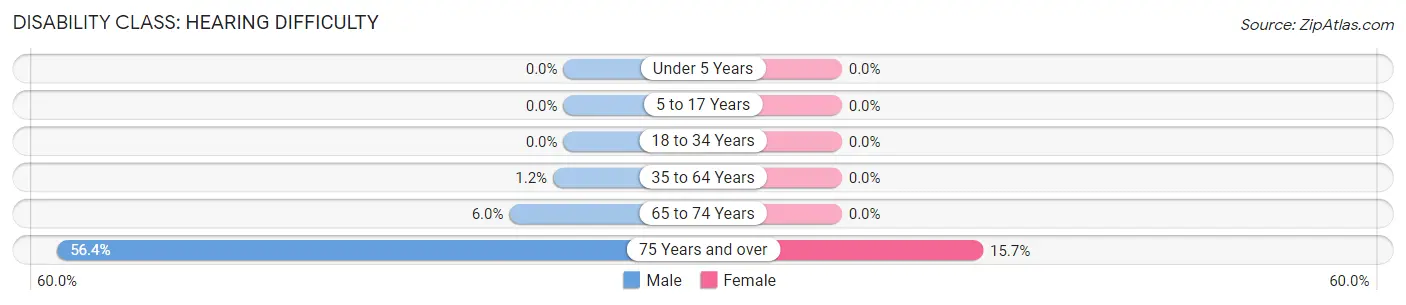
| Age Bracket | Male | Female |
| Under 5 Years | 0 (0.0%) | 0 (0.0%) |
| 5 to 17 Years | 0 (0.0%) | 0 (0.0%) |
| 18 to 34 Years | 0 (0.0%) | 0 (0.0%) |
| 35 to 64 Years | 8 (1.2%) | 0 (0.0%) |
| 65 to 74 Years | 8 (6.0%) | 0 (0.0%) |
| 75 Years and over | 62 (56.4%) | 28 (15.7%) |
Disability Class: Vision Difficulty
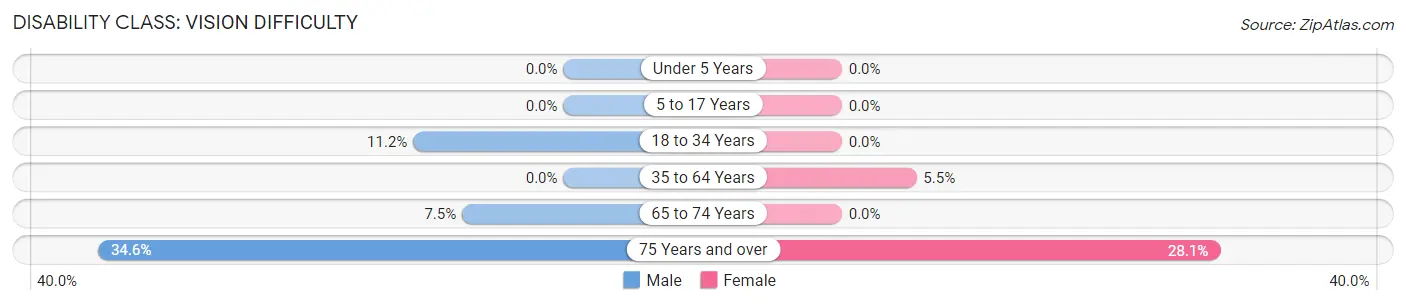
| Age Bracket | Male | Female |
| Under 5 Years | 0 (0.0%) | 0 (0.0%) |
| 5 to 17 Years | 0 (0.0%) | 0 (0.0%) |
| 18 to 34 Years | 32 (11.2%) | 0 (0.0%) |
| 35 to 64 Years | 0 (0.0%) | 23 (5.5%) |
| 65 to 74 Years | 10 (7.5%) | 0 (0.0%) |
| 75 Years and over | 38 (34.5%) | 50 (28.1%) |
Disability Class: Cognitive Difficulty
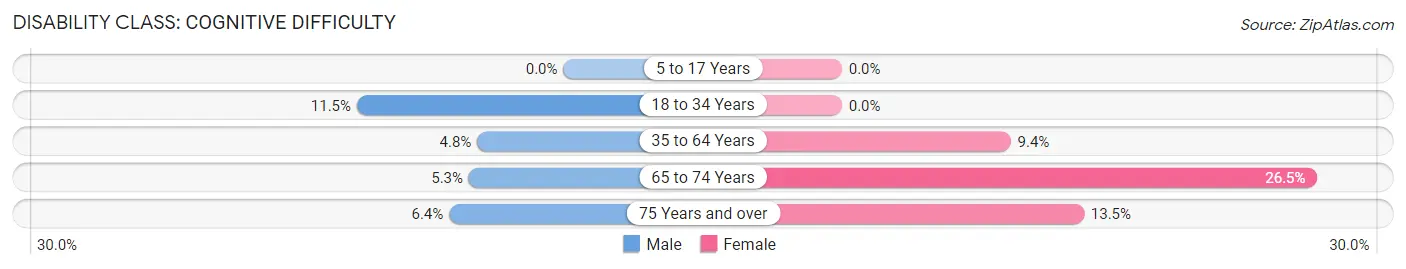
| Age Bracket | Male | Female |
| 5 to 17 Years | 0 (0.0%) | 0 (0.0%) |
| 18 to 34 Years | 33 (11.5%) | 0 (0.0%) |
| 35 to 64 Years | 33 (4.8%) | 39 (9.4%) |
| 65 to 74 Years | 7 (5.3%) | 58 (26.5%) |
| 75 Years and over | 7 (6.4%) | 24 (13.5%) |
Disability Class: Ambulatory Difficulty
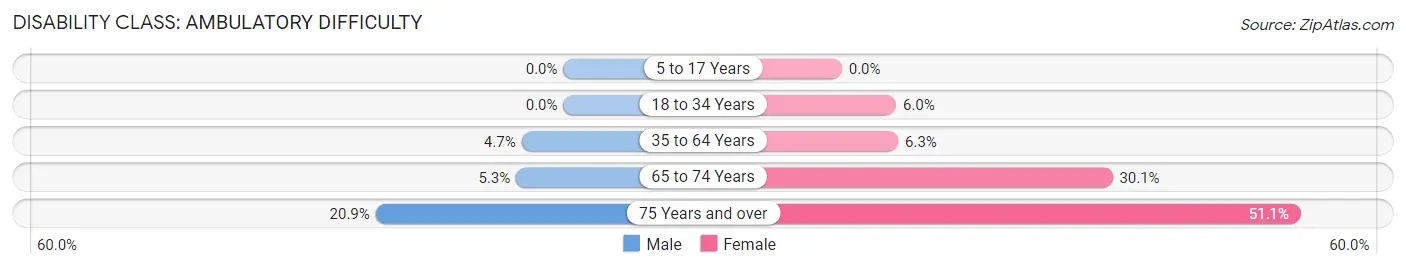
| Age Bracket | Male | Female |
| 5 to 17 Years | 0 (0.0%) | 0 (0.0%) |
| 18 to 34 Years | 0 (0.0%) | 11 (6.0%) |
| 35 to 64 Years | 32 (4.7%) | 26 (6.3%) |
| 65 to 74 Years | 7 (5.3%) | 66 (30.1%) |
| 75 Years and over | 23 (20.9%) | 91 (51.1%) |
Disability Class: Self-Care Difficulty
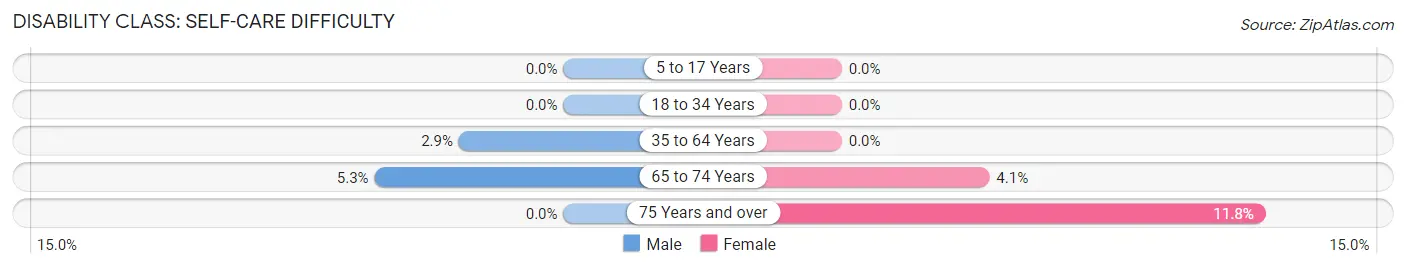
| Age Bracket | Male | Female |
| 5 to 17 Years | 0 (0.0%) | 0 (0.0%) |
| 18 to 34 Years | 0 (0.0%) | 0 (0.0%) |
| 35 to 64 Years | 20 (2.9%) | 0 (0.0%) |
| 65 to 74 Years | 7 (5.3%) | 9 (4.1%) |
| 75 Years and over | 0 (0.0%) | 21 (11.8%) |
Technology Access in Walnut Hill
Computing Device Access in Walnut Hill
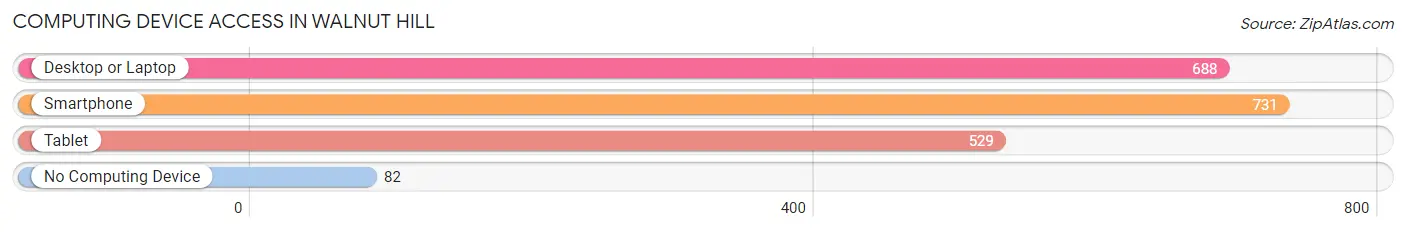
| Device Type | # Households | % Households |
| Desktop or Laptop | 688 | 79.9% |
| Smartphone | 731 | 84.9% |
| Tablet | 529 | 61.4% |
| No Computing Device | 82 | 9.5% |
| Total | 861 | 100.0% |
Internet Access in Walnut Hill
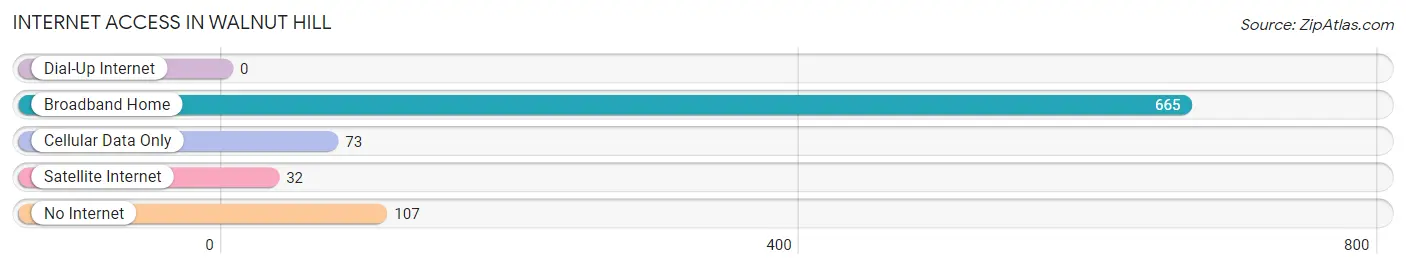
| Internet Type | # Households | % Households |
| Dial-Up Internet | 0 | 0.0% |
| Broadband Home | 665 | 77.2% |
| Cellular Data Only | 73 | 8.5% |
| Satellite Internet | 32 | 3.7% |
| No Internet | 107 | 12.4% |
| Total | 861 | 100.0% |
Walnut Hill Summary
Walnut Hill is a small unincorporated community located in the state of Tennessee. It is situated in the western part of the state, in the county of Williamson. The population of Walnut Hill was estimated to be around 1,000 people in 2020.
History
Walnut Hill was first settled in the early 1800s by a group of settlers from North Carolina. The community was named after the abundance of walnut trees in the area. The first post office was established in 1845 and the first school was built in 1848.
In the late 1800s, the town began to grow and prosper. The railroad was built through the town in 1887, which helped to bring in more people and businesses. The town also had a cotton gin, a grist mill, and a sawmill.
In the early 1900s, the town began to decline. The railroad was removed in the 1920s and the cotton gin and grist mill closed in the 1930s. The sawmill closed in the 1940s.
Geography
Walnut Hill is located in the western part of Tennessee, in Williamson County. It is situated on the banks of the Harpeth River, about 25 miles south of Nashville. The town is surrounded by rolling hills and farmland.
The climate in Walnut Hill is humid subtropical, with hot summers and mild winters. The average annual temperature is around 65 degrees Fahrenheit. The average annual precipitation is around 45 inches.
Economy
The economy of Walnut Hill is largely based on agriculture. The town is home to several farms, which produce a variety of crops, including corn, soybeans, wheat, and hay. The town also has a few small businesses, including a gas station, a convenience store, and a few restaurants.
Demographics
The population of Walnut Hill was estimated to be around 1,000 people in 2020. The racial makeup of the town is predominantly white, with a small percentage of African Americans. The median household income is around $50,000. The median age is around 40 years old.
Conclusion
Walnut Hill is a small unincorporated community located in the western part of Tennessee. It has a long history, dating back to the early 1800s. The town is surrounded by rolling hills and farmland, and the economy is largely based on agriculture. The population of Walnut Hill is estimated to be around 1,000 people, with a predominantly white population and a median household income of around $50,000.
Common Questions
What is Per Capita Income in Walnut Hill?
Per Capita income in Walnut Hill is $27,491.
What is the Median Family Income in Walnut Hill?
Median Family Income in Walnut Hill is $67,433.
What is the Median Household income in Walnut Hill?
Median Household Income in Walnut Hill is $64,250.
What is Inequality or Gini Index in Walnut Hill?
Inequality or Gini Index in Walnut Hill is 0.39.
What is the Total Population of Walnut Hill?
Total Population of Walnut Hill is 2,648.
What is the Total Male Population of Walnut Hill?
Total Male Population of Walnut Hill is 1,486.
What is the Total Female Population of Walnut Hill?
Total Female Population of Walnut Hill is 1,162.
What is the Ratio of Males per 100 Females in Walnut Hill?
There are 127.88 Males per 100 Females in Walnut Hill.
What is the Ratio of Females per 100 Males in Walnut Hill?
There are 78.20 Females per 100 Males in Walnut Hill.
What is the Median Population Age in Walnut Hill?
Median Population Age in Walnut Hill is 46.1 Years.
What is the Average Family Size in Walnut Hill
Average Family Size in Walnut Hill is 3.8 People.
What is the Average Household Size in Walnut Hill
Average Household Size in Walnut Hill is 3.1 People.
How Large is the Labor Force in Walnut Hill?
There are 1,041 People in the Labor Forcein in Walnut Hill.
What is the Percentage of People in the Labor Force in Walnut Hill?
45.7% of People are in the Labor Force in Walnut Hill.
What is the Unemployment Rate in Walnut Hill?
Unemployment Rate in Walnut Hill is 6.0%.