Louisville, TN Map & Demographics
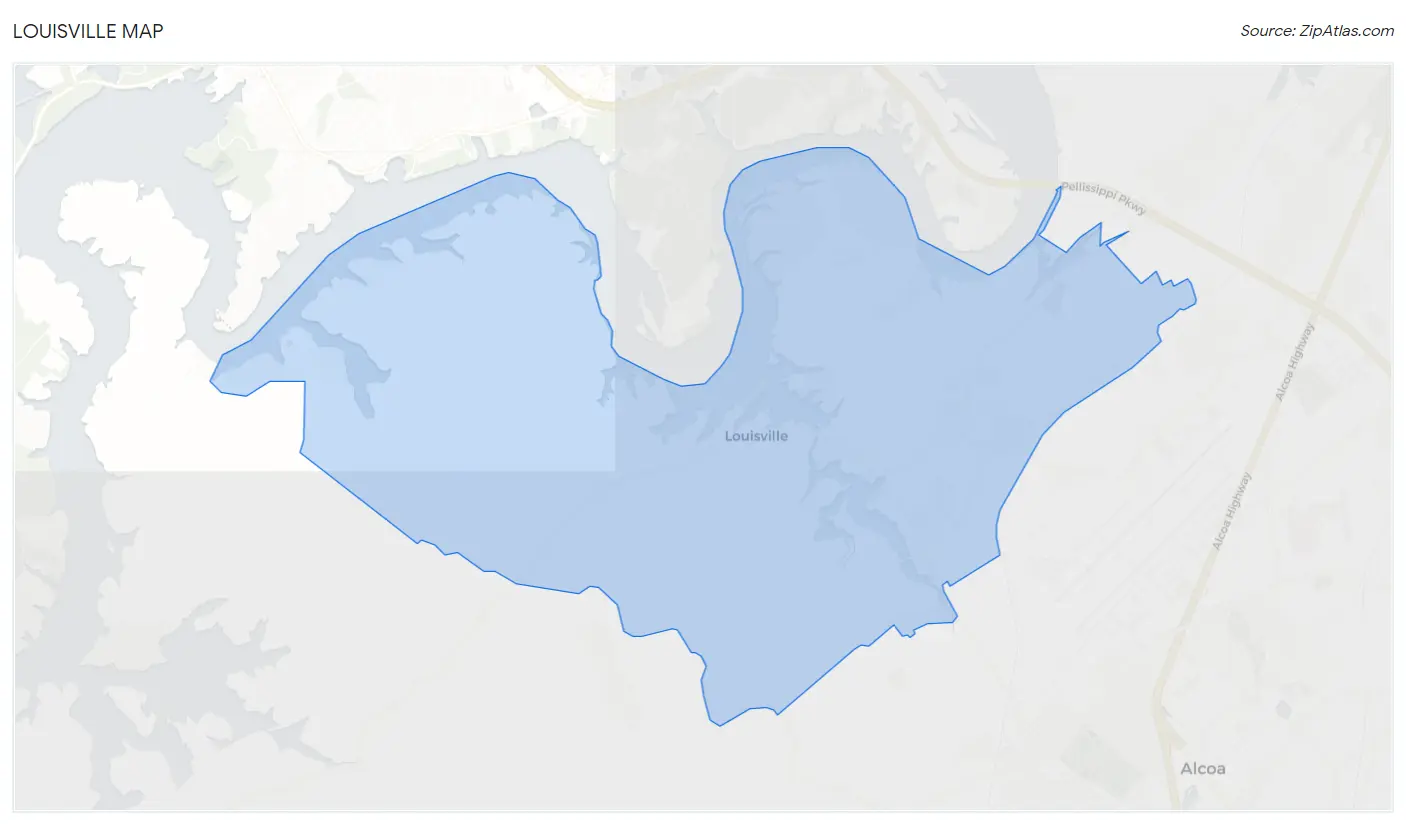
Louisville Map
Louisville Overview
$60,428
PER CAPITA INCOME
$101,818
AVG FAMILY INCOME
$80,307
AVG HOUSEHOLD INCOME
17.5%
WAGE / INCOME GAP [ % ]
82.5¢/ $1
WAGE / INCOME GAP [ $ ]
0.52
INEQUALITY / GINI INDEX
4,359
TOTAL POPULATION
2,197
MALE POPULATION
2,162
FEMALE POPULATION
101.62
MALES / 100 FEMALES
98.41
FEMALES / 100 MALES
51.9
MEDIAN AGE
2.6
AVG FAMILY SIZE
2.3
AVG HOUSEHOLD SIZE
2,298
LABOR FORCE [ PEOPLE ]
59.7%
PERCENT IN LABOR FORCE
4.5%
UNEMPLOYMENT RATE
Louisville Zip Codes
Louisville Area Codes
Income in Louisville
Income Overview in Louisville
Per Capita Income in Louisville is $60,428, while median incomes of families and households are $101,818 and $80,307 respectively.
| Characteristic | Number | Measure |
| Per Capita Income | 4,359 | $60,428 |
| Median Family Income | 1,406 | $101,818 |
| Mean Family Income | 1,406 | $164,683 |
| Median Household Income | 1,889 | $80,307 |
| Mean Household Income | 1,889 | $138,649 |
| Income Deficit | 1,406 | $0 |
| Wage / Income Gap (%) | 4,359 | 17.50% |
| Wage / Income Gap ($) | 4,359 | 82.50¢ per $1 |
| Gini / Inequality Index | 4,359 | 0.52 |
Earnings by Sex in Louisville
Average Earnings in Louisville are $42,500, $47,727 for men and $39,375 for women, a difference of 17.5%.
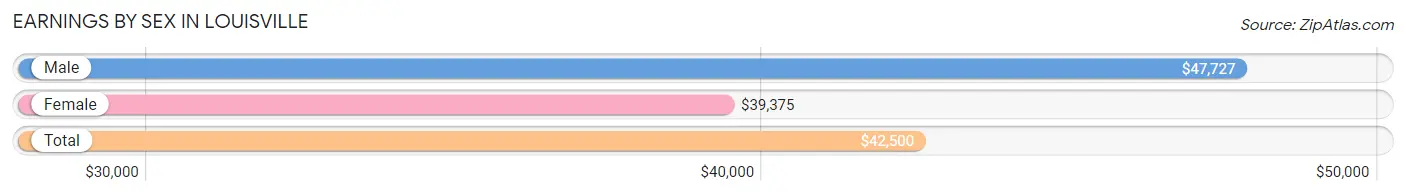
| Sex | Number | Average Earnings |
| Male | 1,382 (59.7%) | $47,727 |
| Female | 934 (40.3%) | $39,375 |
| Total | 2,316 (100.0%) | $42,500 |
Earnings by Sex by Income Bracket in Louisville
The most common earnings brackets in Louisville are $100,000+ for men (304 | 22.0%) and $35,000 to $39,999 for women (114 | 12.2%).
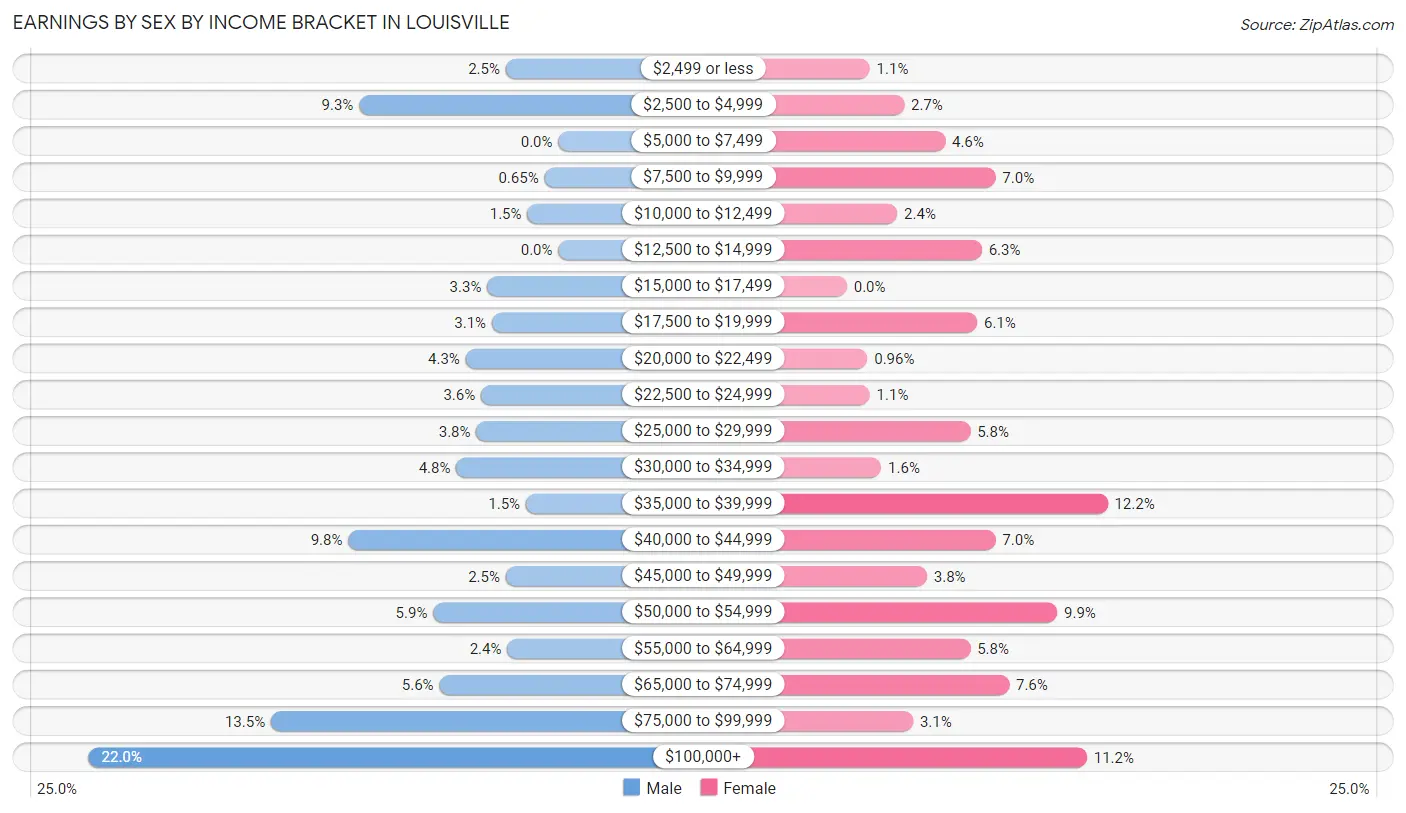
| Income | Male | Female |
| $2,499 or less | 34 (2.5%) | 10 (1.1%) |
| $2,500 to $4,999 | 129 (9.3%) | 25 (2.7%) |
| $5,000 to $7,499 | 0 (0.0%) | 43 (4.6%) |
| $7,500 to $9,999 | 9 (0.6%) | 65 (7.0%) |
| $10,000 to $12,499 | 20 (1.5%) | 22 (2.4%) |
| $12,500 to $14,999 | 0 (0.0%) | 59 (6.3%) |
| $15,000 to $17,499 | 46 (3.3%) | 0 (0.0%) |
| $17,500 to $19,999 | 43 (3.1%) | 57 (6.1%) |
| $20,000 to $22,499 | 60 (4.3%) | 9 (1.0%) |
| $22,500 to $24,999 | 50 (3.6%) | 10 (1.1%) |
| $25,000 to $29,999 | 53 (3.8%) | 54 (5.8%) |
| $30,000 to $34,999 | 66 (4.8%) | 15 (1.6%) |
| $35,000 to $39,999 | 21 (1.5%) | 114 (12.2%) |
| $40,000 to $44,999 | 136 (9.8%) | 65 (7.0%) |
| $45,000 to $49,999 | 34 (2.5%) | 35 (3.7%) |
| $50,000 to $54,999 | 81 (5.9%) | 92 (9.9%) |
| $55,000 to $64,999 | 33 (2.4%) | 54 (5.8%) |
| $65,000 to $74,999 | 77 (5.6%) | 71 (7.6%) |
| $75,000 to $99,999 | 186 (13.5%) | 29 (3.1%) |
| $100,000+ | 304 (22.0%) | 105 (11.2%) |
| Total | 1,382 (100.0%) | 934 (100.0%) |
Earnings by Sex by Educational Attainment in Louisville
Average earnings in Louisville are $57,292 for men and $39,935 for women, a difference of 30.3%. Men with an educational attainment of bachelor's degree enjoy the highest average annual earnings of $73,214, while those with high school diploma education earn the least with $41,530. Women with an educational attainment of bachelor's degree earn the most with the average annual earnings of $55,208, while those with college or associate's degree education have the smallest earnings of $36,550.
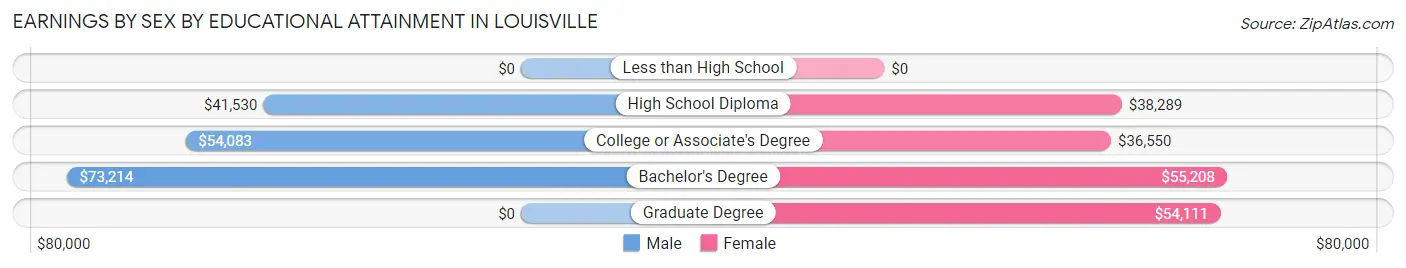
| Educational Attainment | Male Income | Female Income |
| Less than High School | - | - |
| High School Diploma | $41,530 | $38,289 |
| College or Associate's Degree | $54,083 | $36,550 |
| Bachelor's Degree | $73,214 | $55,208 |
| Graduate Degree | - | - |
| Total | $57,292 | $39,935 |
Family Income in Louisville
Family Income Brackets in Louisville
According to the Louisville family income data, there are 321 families falling into the $50,000 to $74,999 income range, which is the most common income bracket and makes up 22.8% of all families. Conversely, the $10,000 to $14,999 income bracket is the least frequent group with only 8 families (0.6%) belonging to this category.
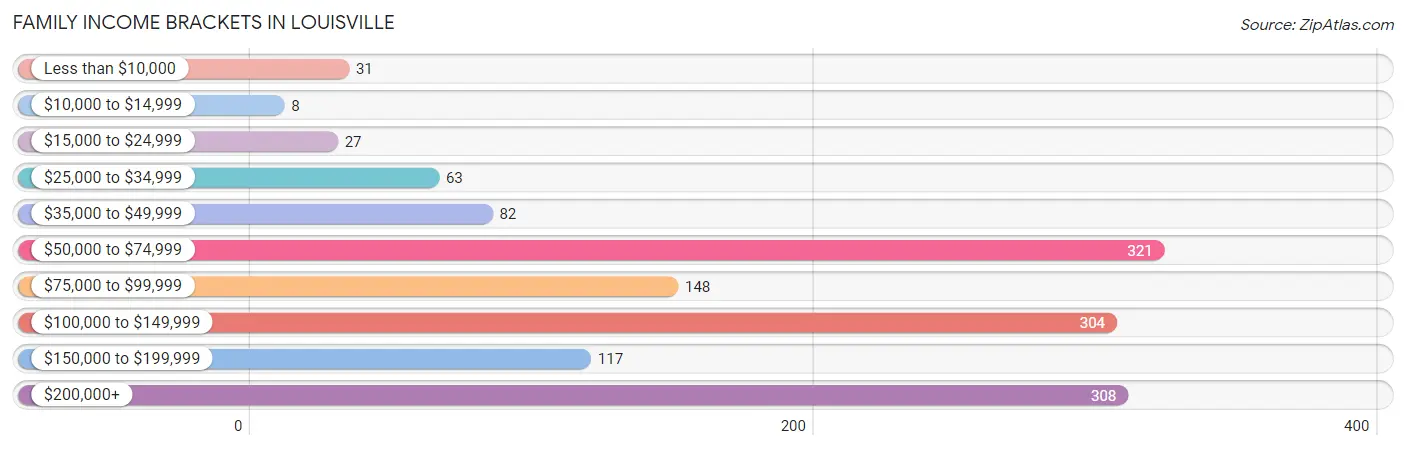
| Income Bracket | # Families | % Families |
| Less than $10,000 | 31 | 2.2% |
| $10,000 to $14,999 | 8 | 0.6% |
| $15,000 to $24,999 | 27 | 1.9% |
| $25,000 to $34,999 | 63 | 4.5% |
| $35,000 to $49,999 | 82 | 5.8% |
| $50,000 to $74,999 | 321 | 22.8% |
| $75,000 to $99,999 | 148 | 10.5% |
| $100,000 to $149,999 | 304 | 21.6% |
| $150,000 to $199,999 | 117 | 8.3% |
| $200,000+ | 308 | 21.9% |
Family Income by Famaliy Size in Louisville
4-person families (120 | 8.5%) account for the highest median family income in Louisville with $132,917 per family, while 2-person families (928 | 66.0%) have the highest median income of $47,100 per family member.
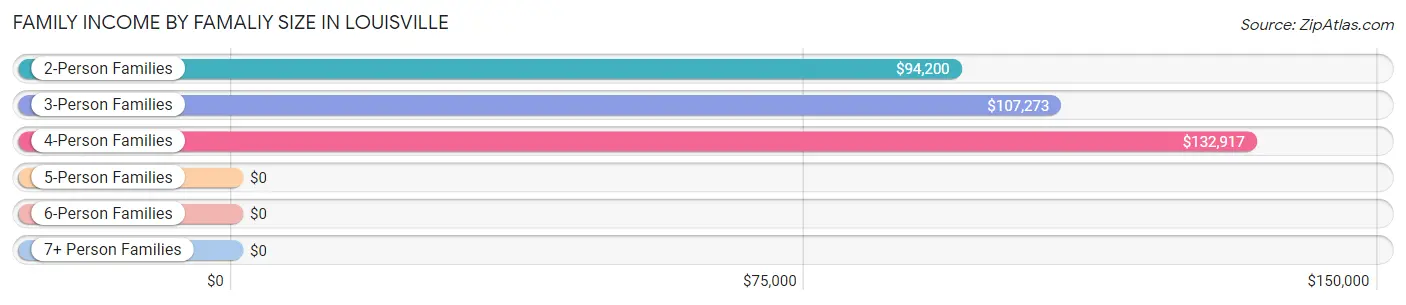
| Income Bracket | # Families | Median Income |
| 2-Person Families | 928 (66.0%) | $94,200 |
| 3-Person Families | 288 (20.5%) | $107,273 |
| 4-Person Families | 120 (8.5%) | $132,917 |
| 5-Person Families | 18 (1.3%) | $0 |
| 6-Person Families | 25 (1.8%) | $0 |
| 7+ Person Families | 27 (1.9%) | $0 |
| Total | 1,406 (100.0%) | $101,818 |
Family Income by Number of Earners in Louisville
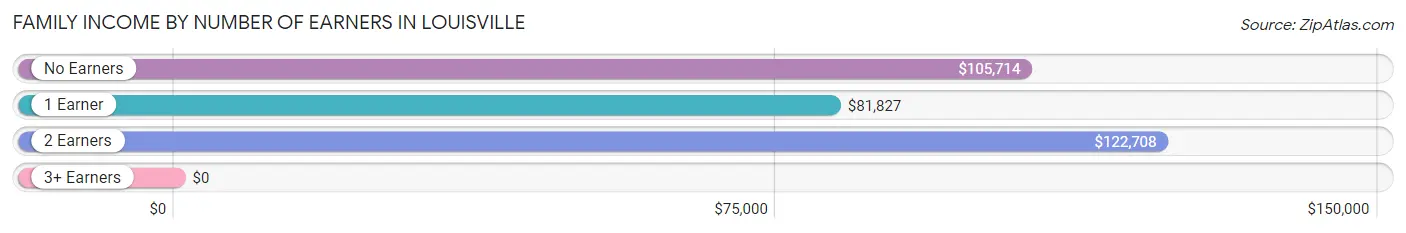
| Number of Earners | # Families | Median Income |
| No Earners | 336 (23.9%) | $105,714 |
| 1 Earner | 468 (33.3%) | $81,827 |
| 2 Earners | 477 (33.9%) | $122,708 |
| 3+ Earners | 125 (8.9%) | $0 |
| Total | 1,406 (100.0%) | $101,818 |
Household Income in Louisville
Household Income Brackets in Louisville
With 468 households falling in the category, the $50,000 to $74,999 income range is the most frequent in Louisville, accounting for 24.8% of all households. In contrast, only 9 households (0.5%) fall into the $10,000 to $14,999 income bracket, making it the least populous group.
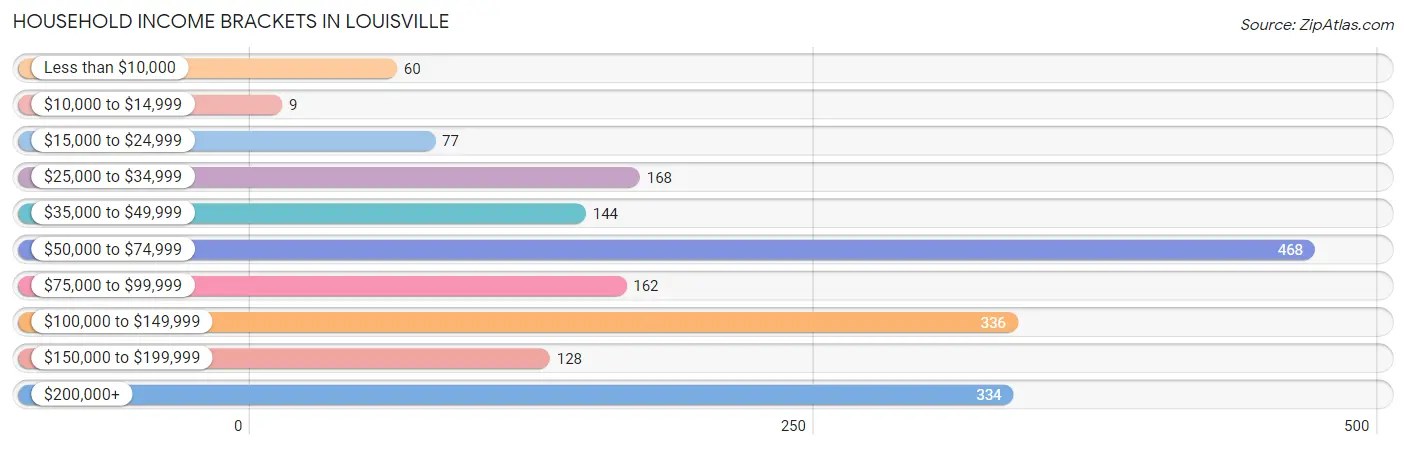
| Income Bracket | # Households | % Households |
| Less than $10,000 | 60 | 3.2% |
| $10,000 to $14,999 | 9 | 0.5% |
| $15,000 to $24,999 | 77 | 4.1% |
| $25,000 to $34,999 | 168 | 8.9% |
| $35,000 to $49,999 | 144 | 7.6% |
| $50,000 to $74,999 | 468 | 24.8% |
| $75,000 to $99,999 | 162 | 8.6% |
| $100,000 to $149,999 | 336 | 17.8% |
| $150,000 to $199,999 | 128 | 6.8% |
| $200,000+ | 334 | 17.7% |
Household Income by Householder Age in Louisville
The median household income in Louisville is $80,307, with the highest median household income of $90,156 found in the 65+ years age bracket for the primary householder. A total of 703 households (37.2%) fall into this category. Meanwhile, the 15 to 24 years age bracket for the primary householder has the lowest median household income of $0, with 5 households (0.3%) in this group.
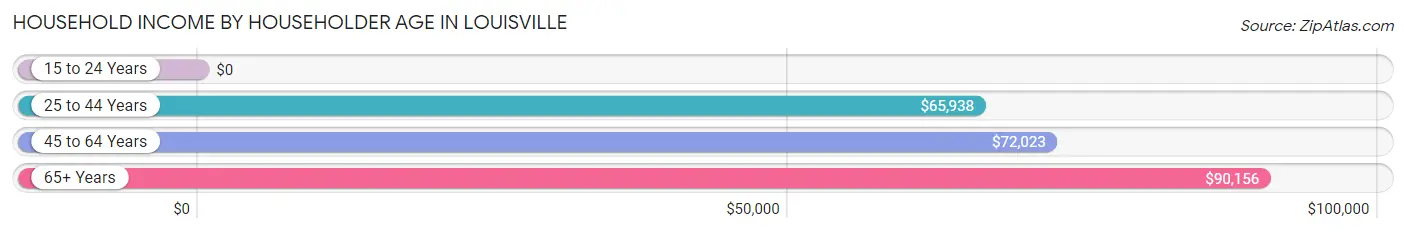
| Income Bracket | # Households | Median Income |
| 15 to 24 Years | 5 (0.3%) | $0 |
| 25 to 44 Years | 436 (23.1%) | $65,938 |
| 45 to 64 Years | 745 (39.4%) | $72,023 |
| 65+ Years | 703 (37.2%) | $90,156 |
| Total | 1,889 (100.0%) | $80,307 |
Poverty in Louisville
Income Below Poverty by Sex and Age in Louisville
With 8.5% poverty level for males and 11.6% for females among the residents of Louisville, 6 to 11 year old males and 16 and 17 year old females are the most vulnerable to poverty, with 26 males (32.5%) and 12 females (100.0%) in their respective age groups living below the poverty level.
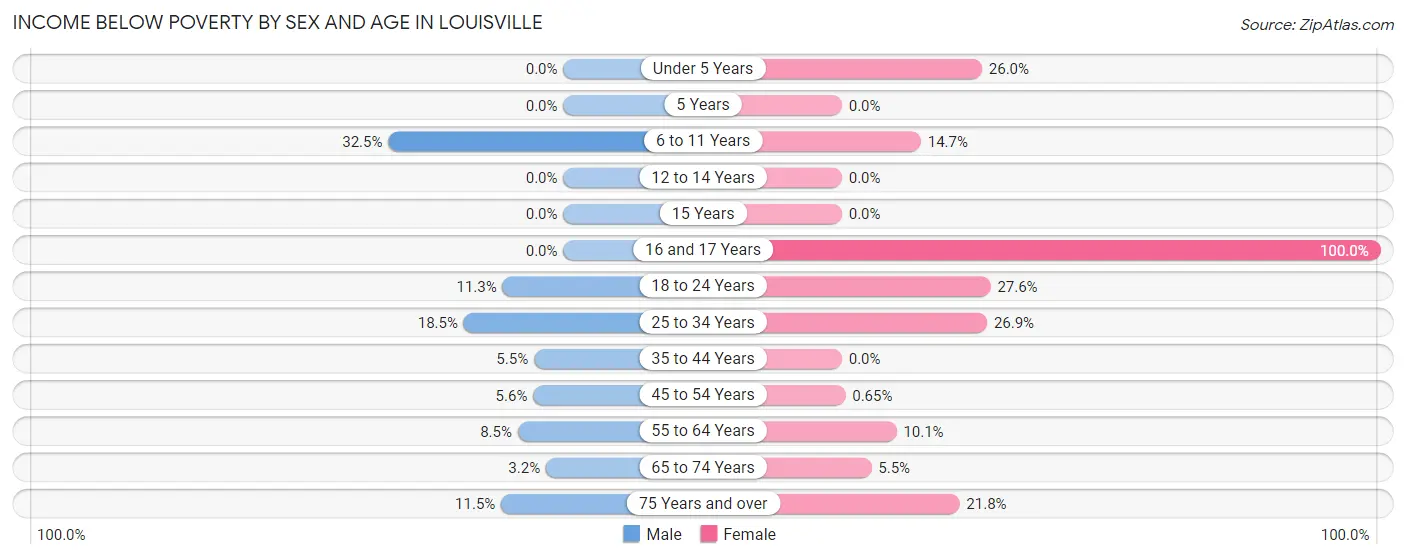
| Age Bracket | Male | Female |
| Under 5 Years | 0 (0.0%) | 26 (26.0%) |
| 5 Years | 0 (0.0%) | 0 (0.0%) |
| 6 to 11 Years | 26 (32.5%) | 11 (14.7%) |
| 12 to 14 Years | 0 (0.0%) | 0 (0.0%) |
| 15 Years | 0 (0.0%) | 0 (0.0%) |
| 16 and 17 Years | 0 (0.0%) | 12 (100.0%) |
| 18 to 24 Years | 22 (11.3%) | 16 (27.6%) |
| 25 to 34 Years | 56 (18.5%) | 66 (26.9%) |
| 35 to 44 Years | 9 (5.4%) | 0 (0.0%) |
| 45 to 54 Years | 26 (5.6%) | 2 (0.6%) |
| 55 to 64 Years | 22 (8.5%) | 45 (10.1%) |
| 65 to 74 Years | 13 (3.2%) | 23 (5.5%) |
| 75 Years and over | 12 (11.5%) | 50 (21.8%) |
| Total | 186 (8.5%) | 251 (11.6%) |
Income Above Poverty by Sex and Age in Louisville
According to the poverty statistics in Louisville, males aged under 5 years and females aged 12 to 14 years are the age groups that are most secure financially, with 100.0% of males and 100.0% of females in these age groups living above the poverty line.
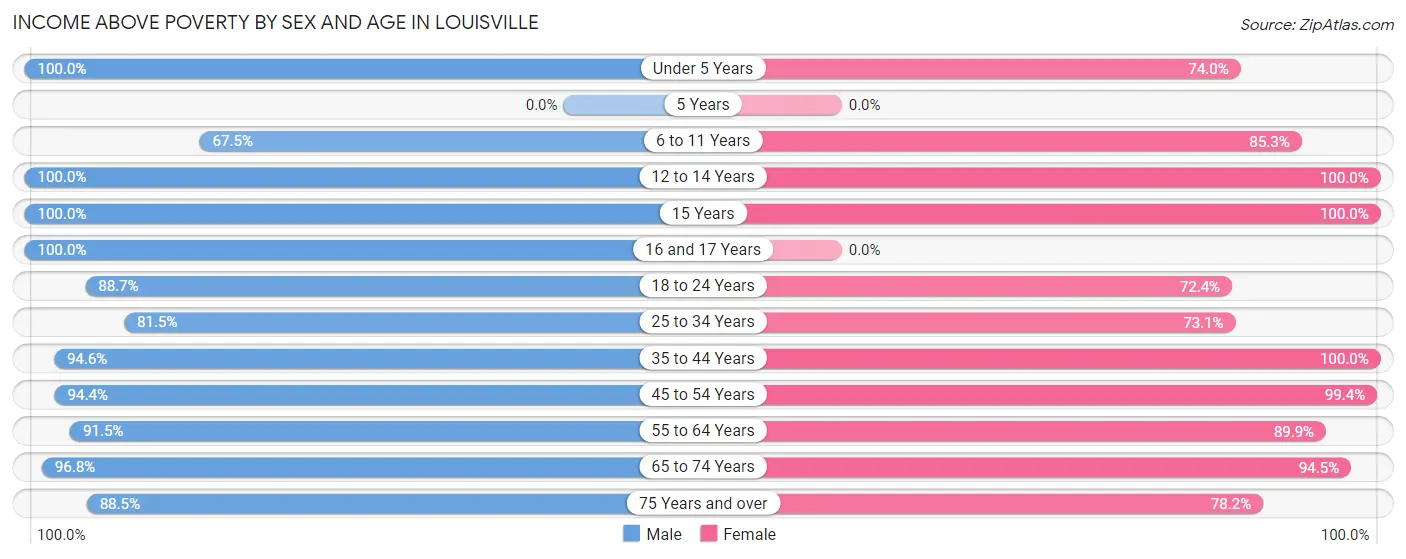
| Age Bracket | Male | Female |
| Under 5 Years | 89 (100.0%) | 74 (74.0%) |
| 5 Years | 0 (0.0%) | 0 (0.0%) |
| 6 to 11 Years | 54 (67.5%) | 64 (85.3%) |
| 12 to 14 Years | 34 (100.0%) | 59 (100.0%) |
| 15 Years | 60 (100.0%) | 12 (100.0%) |
| 16 and 17 Years | 38 (100.0%) | 0 (0.0%) |
| 18 to 24 Years | 173 (88.7%) | 42 (72.4%) |
| 25 to 34 Years | 247 (81.5%) | 179 (73.1%) |
| 35 to 44 Years | 156 (94.6%) | 202 (100.0%) |
| 45 to 54 Years | 439 (94.4%) | 305 (99.4%) |
| 55 to 64 Years | 238 (91.5%) | 399 (89.9%) |
| 65 to 74 Years | 391 (96.8%) | 396 (94.5%) |
| 75 Years and over | 92 (88.5%) | 179 (78.2%) |
| Total | 2,011 (91.5%) | 1,911 (88.4%) |
Income Below Poverty Among Married-Couple Families in Louisville
The poverty statistics for married-couple families in Louisville show that 5.0% or 58 of the total 1,170 families live below the poverty line. Families with 1 or 2 children have the highest poverty rate of 13.0%, comprising of 32 families. On the other hand, families with 3 or 4 children have the lowest poverty rate of 0.0%, which includes 0 families.
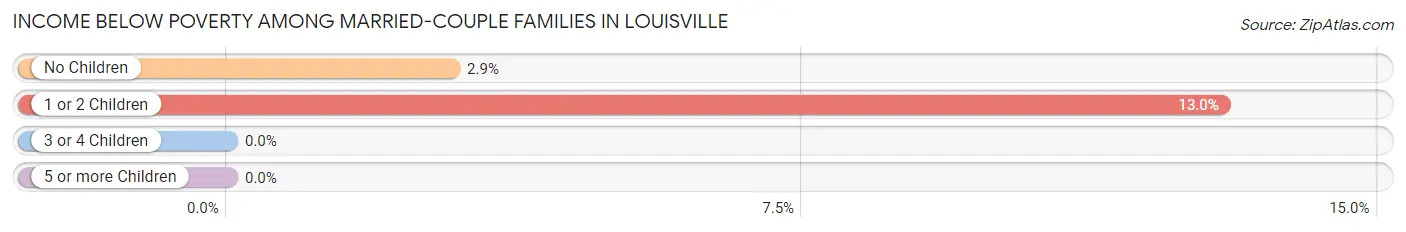
| Children | Above Poverty | Below Poverty |
| No Children | 872 (97.1%) | 26 (2.9%) |
| 1 or 2 Children | 215 (87.0%) | 32 (13.0%) |
| 3 or 4 Children | 25 (100.0%) | 0 (0.0%) |
| 5 or more Children | 0 (0.0%) | 0 (0.0%) |
| Total | 1,112 (95.0%) | 58 (5.0%) |
Income Below Poverty Among Single-Parent Households in Louisville
According to the poverty data in Louisville, 24.2% or 22 single-father households and 9.7% or 14 single-mother households are living below the poverty line. Among single-father households, those with 1 or 2 children have the highest poverty rate, with 22 households (31.4%) experiencing poverty. Likewise, among single-mother households, those with no children have the highest poverty rate, with 14 households (13.0%) falling below the poverty line.
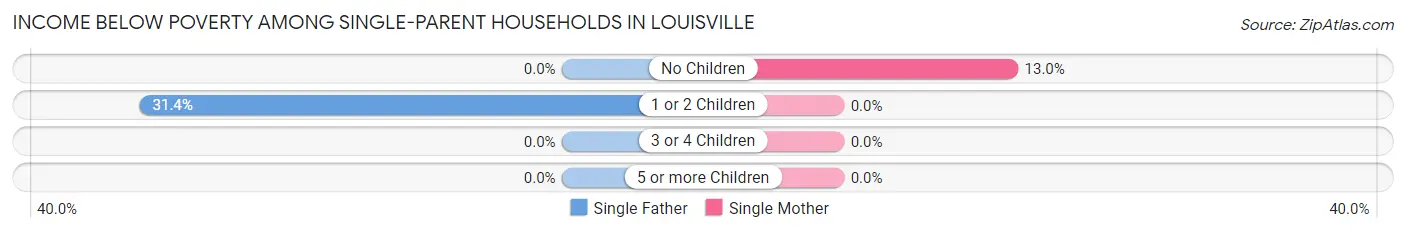
| Children | Single Father | Single Mother |
| No Children | 0 (0.0%) | 14 (13.0%) |
| 1 or 2 Children | 22 (31.4%) | 0 (0.0%) |
| 3 or 4 Children | 0 (0.0%) | 0 (0.0%) |
| 5 or more Children | 0 (0.0%) | 0 (0.0%) |
| Total | 22 (24.2%) | 14 (9.7%) |
Income Below Poverty Among Married-Couple vs Single-Parent Households in Louisville
The poverty data for Louisville shows that 58 of the married-couple family households (5.0%) and 36 of the single-parent households (15.2%) are living below the poverty level. Within the married-couple family households, those with 1 or 2 children have the highest poverty rate, with 32 households (13.0%) falling below the poverty line. Among the single-parent households, those with 1 or 2 children have the highest poverty rate, with 22 household (20.6%) living below poverty.
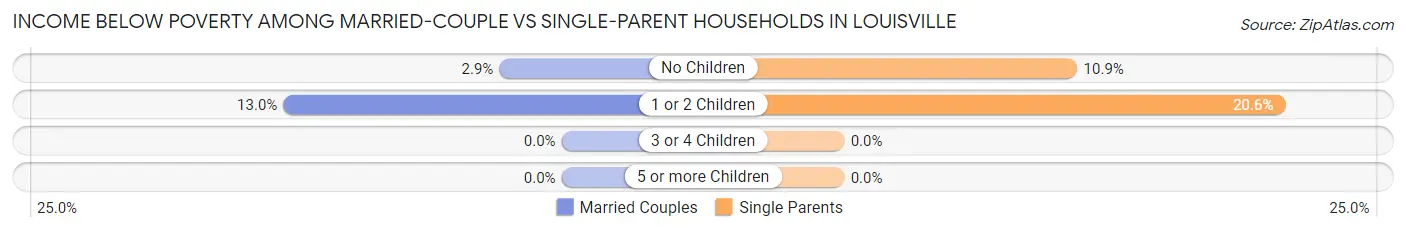
| Children | Married-Couple Families | Single-Parent Households |
| No Children | 26 (2.9%) | 14 (10.8%) |
| 1 or 2 Children | 32 (13.0%) | 22 (20.6%) |
| 3 or 4 Children | 0 (0.0%) | 0 (0.0%) |
| 5 or more Children | 0 (0.0%) | 0 (0.0%) |
| Total | 58 (5.0%) | 36 (15.2%) |
Race in Louisville
The most populous races in Louisville are White / Caucasian (4,089 | 93.8%), Black / African American (155 | 3.6%), and Hispanic or Latino (106 | 2.4%).
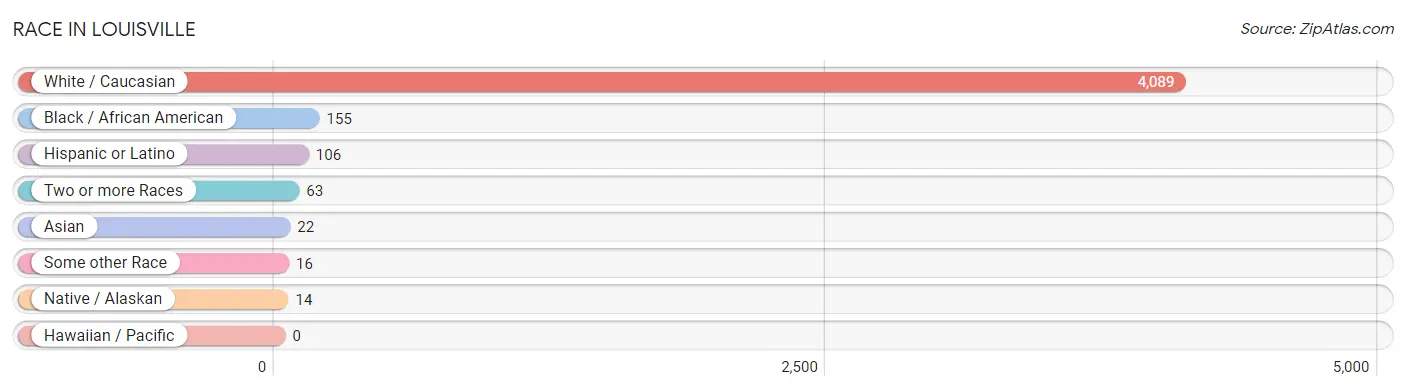
| Race | # Population | % Population |
| Asian | 22 | 0.5% |
| Black / African American | 155 | 3.6% |
| Hawaiian / Pacific | 0 | 0.0% |
| Hispanic or Latino | 106 | 2.4% |
| Native / Alaskan | 14 | 0.3% |
| White / Caucasian | 4,089 | 93.8% |
| Two or more Races | 63 | 1.5% |
| Some other Race | 16 | 0.4% |
| Total | 4,359 | 100.0% |
Ancestry in Louisville
The most populous ancestries reported in Louisville are English (625 | 14.3%), German (572 | 13.1%), Irish (552 | 12.7%), American (417 | 9.6%), and Dutch (227 | 5.2%), together accounting for 54.9% of all Louisville residents.
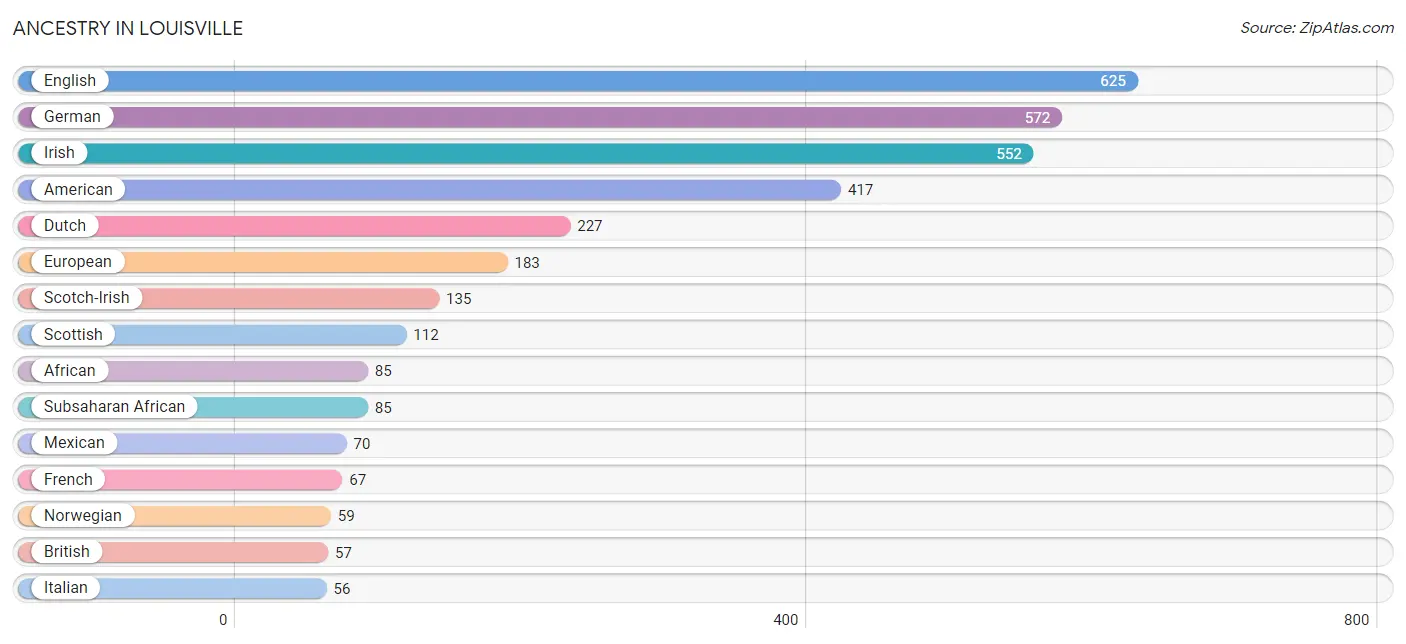
| Ancestry | # Population | % Population |
| African | 85 | 1.9% |
| American | 417 | 9.6% |
| Arab | 13 | 0.3% |
| Bhutanese | 18 | 0.4% |
| British | 57 | 1.3% |
| Central American | 14 | 0.3% |
| Central American Indian | 14 | 0.3% |
| Cuban | 6 | 0.1% |
| Czech | 21 | 0.5% |
| Danish | 14 | 0.3% |
| Dutch | 227 | 5.2% |
| Eastern European | 39 | 0.9% |
| English | 625 | 14.3% |
| European | 183 | 4.2% |
| Finnish | 7 | 0.2% |
| French | 67 | 1.5% |
| French Canadian | 12 | 0.3% |
| German | 572 | 13.1% |
| Guatemalan | 14 | 0.3% |
| Iranian | 17 | 0.4% |
| Irish | 552 | 12.7% |
| Italian | 56 | 1.3% |
| Lebanese | 13 | 0.3% |
| Lithuanian | 45 | 1.0% |
| Luxembourger | 41 | 0.9% |
| Malaysian | 4 | 0.1% |
| Mexican | 70 | 1.6% |
| Norwegian | 59 | 1.3% |
| Polish | 19 | 0.4% |
| Puerto Rican | 16 | 0.4% |
| Russian | 8 | 0.2% |
| Scotch-Irish | 135 | 3.1% |
| Scottish | 112 | 2.6% |
| Slovak | 10 | 0.2% |
| Subsaharan African | 85 | 1.9% |
| Swedish | 10 | 0.2% |
| Thai | 18 | 0.4% |
| Welsh | 15 | 0.3% | View All 38 Rows |
Immigrants in Louisville
The most numerous immigrant groups reported in Louisville came from Europe (52 | 1.2%), Western Europe (52 | 1.2%), Asia (32 | 0.7%), Africa (18 | 0.4%), and Eastern Africa (18 | 0.4%), together accounting for 3.9% of all Louisville residents.
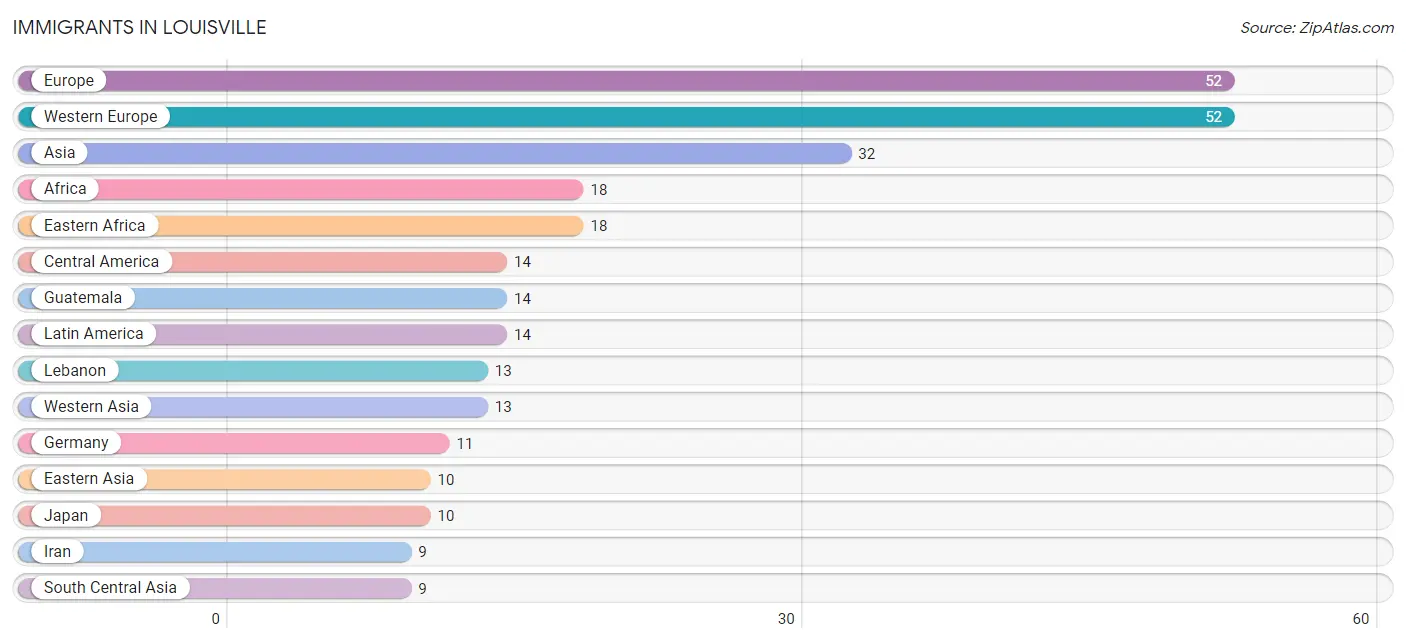
| Immigration Origin | # Population | % Population |
| Africa | 18 | 0.4% |
| Asia | 32 | 0.7% |
| Central America | 14 | 0.3% |
| Eastern Africa | 18 | 0.4% |
| Eastern Asia | 10 | 0.2% |
| Europe | 52 | 1.2% |
| Germany | 11 | 0.3% |
| Guatemala | 14 | 0.3% |
| Iran | 9 | 0.2% |
| Japan | 10 | 0.2% |
| Latin America | 14 | 0.3% |
| Lebanon | 13 | 0.3% |
| South Central Asia | 9 | 0.2% |
| Western Asia | 13 | 0.3% |
| Western Europe | 52 | 1.2% | View All 15 Rows |
Sex and Age in Louisville
Sex and Age in Louisville
The most populous age groups in Louisville are 50 to 54 Years (286 | 13.0%) for men and 50 to 54 Years (259 | 12.0%) for women.
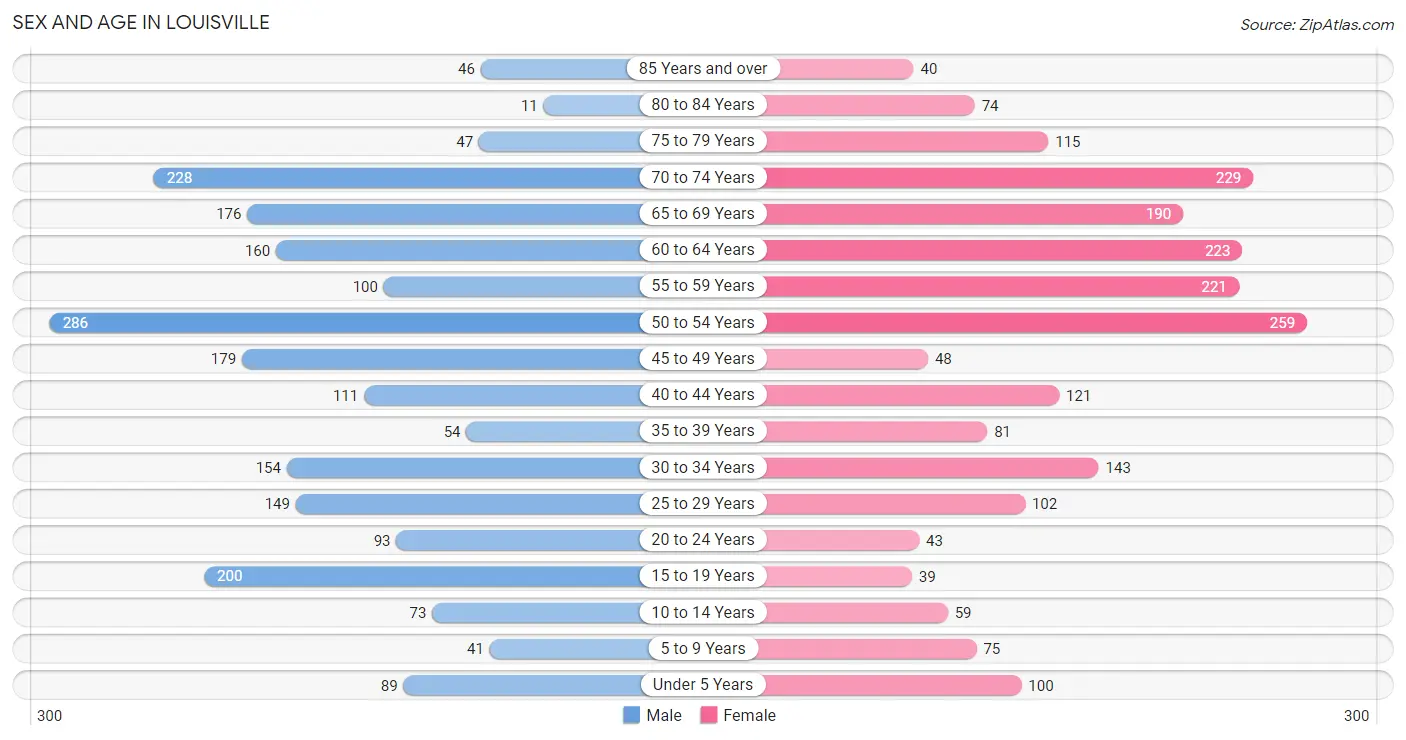
| Age Bracket | Male | Female |
| Under 5 Years | 89 (4.1%) | 100 (4.6%) |
| 5 to 9 Years | 41 (1.9%) | 75 (3.5%) |
| 10 to 14 Years | 73 (3.3%) | 59 (2.7%) |
| 15 to 19 Years | 200 (9.1%) | 39 (1.8%) |
| 20 to 24 Years | 93 (4.2%) | 43 (2.0%) |
| 25 to 29 Years | 149 (6.8%) | 102 (4.7%) |
| 30 to 34 Years | 154 (7.0%) | 143 (6.6%) |
| 35 to 39 Years | 54 (2.5%) | 81 (3.7%) |
| 40 to 44 Years | 111 (5.1%) | 121 (5.6%) |
| 45 to 49 Years | 179 (8.2%) | 48 (2.2%) |
| 50 to 54 Years | 286 (13.0%) | 259 (12.0%) |
| 55 to 59 Years | 100 (4.5%) | 221 (10.2%) |
| 60 to 64 Years | 160 (7.3%) | 223 (10.3%) |
| 65 to 69 Years | 176 (8.0%) | 190 (8.8%) |
| 70 to 74 Years | 228 (10.4%) | 229 (10.6%) |
| 75 to 79 Years | 47 (2.1%) | 115 (5.3%) |
| 80 to 84 Years | 11 (0.5%) | 74 (3.4%) |
| 85 Years and over | 46 (2.1%) | 40 (1.8%) |
| Total | 2,197 (100.0%) | 2,162 (100.0%) |
Families and Households in Louisville
Median Family Size in Louisville
The median family size in Louisville is 2.58 persons per family, with single female/mother families (145 | 10.3%) accounting for the largest median family size of 2.78 persons per family. On the other hand, single male/father families (91 | 6.5%) represent the smallest median family size with 2.14 persons per family.
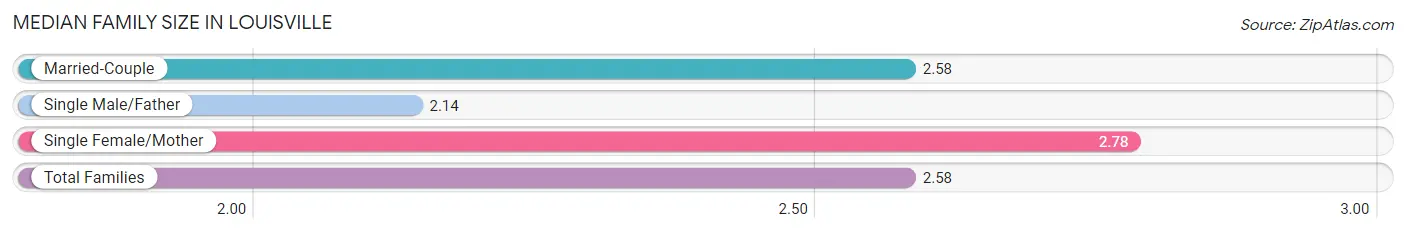
| Family Type | # Families | Family Size |
| Married-Couple | 1,170 (83.2%) | 2.58 |
| Single Male/Father | 91 (6.5%) | 2.14 |
| Single Female/Mother | 145 (10.3%) | 2.78 |
| Total Families | 1,406 (100.0%) | 2.58 |
Median Household Size in Louisville
The median household size in Louisville is 2.29 persons per household, with single female/mother households (145 | 7.7%) accounting for the largest median household size of 2.91 persons per household. non-family households (483 | 25.6%) represent the smallest median household size with 1.13 persons per household.
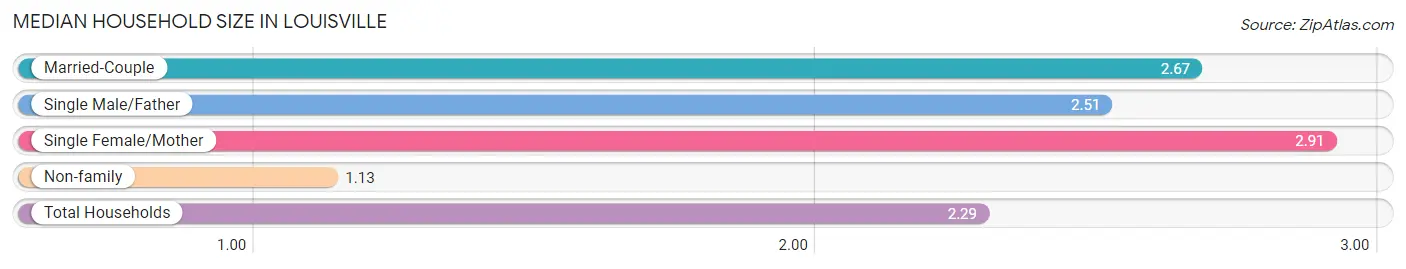
| Household Type | # Households | Household Size |
| Married-Couple | 1,170 (61.9%) | 2.67 |
| Single Male/Father | 91 (4.8%) | 2.51 |
| Single Female/Mother | 145 (7.7%) | 2.91 |
| Non-family | 483 (25.6%) | 1.13 |
| Total Households | 1,889 (100.0%) | 2.29 |
Household Size by Marriage Status in Louisville
Out of a total of 1,889 households in Louisville, 1,406 (74.4%) are family households, while 483 (25.6%) are nonfamily households. The most numerous type of family households are 2-person households, comprising 882, and the most common type of nonfamily households are 1-person households, comprising 421.
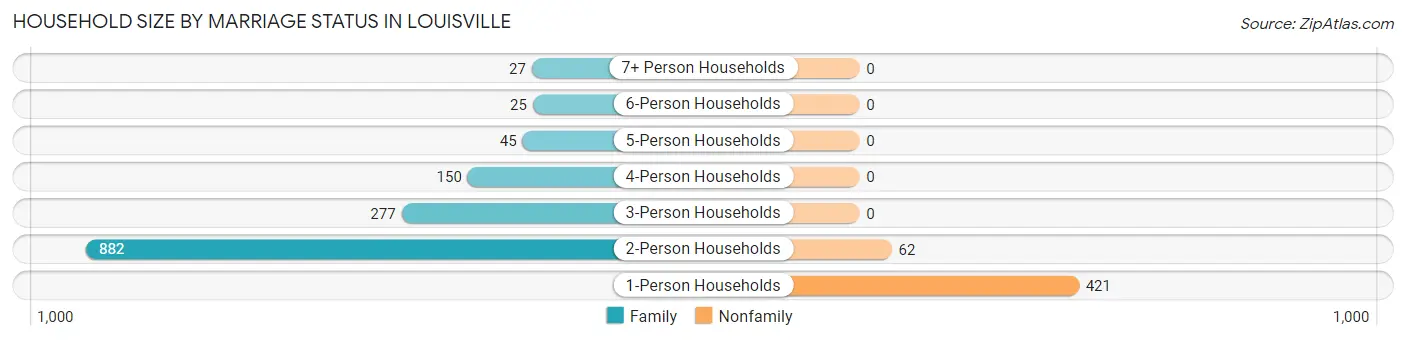
| Household Size | Family Households | Nonfamily Households |
| 1-Person Households | - | 421 (22.3%) |
| 2-Person Households | 882 (46.7%) | 62 (3.3%) |
| 3-Person Households | 277 (14.7%) | 0 (0.0%) |
| 4-Person Households | 150 (7.9%) | 0 (0.0%) |
| 5-Person Households | 45 (2.4%) | 0 (0.0%) |
| 6-Person Households | 25 (1.3%) | 0 (0.0%) |
| 7+ Person Households | 27 (1.4%) | 0 (0.0%) |
| Total | 1,406 (74.4%) | 483 (25.6%) |
Female Fertility in Louisville
Fertility by Age in Louisville
| Age Bracket | Women with Births | Births / 1,000 Women |
| 15 to 19 years | 0 (0.0%) | 0.0 |
| 20 to 34 years | 0 (0.0%) | 0.0 |
| 35 to 50 years | 0 (0.0%) | 0.0 |
| Total | 0 (0.0%) | 0.0 |
Fertility by Age by Marriage Status in Louisville
| Age Bracket | Married | Unmarried |
| 15 to 19 years | 0 (0.0%) | 0 (0.0%) |
| 20 to 34 years | 0 (0.0%) | 0 (0.0%) |
| 35 to 50 years | 0 (0.0%) | 0 (0.0%) |
| Total | 0 (0.0%) | 0 (0.0%) |
Fertility by Education in Louisville
| Educational Attainment | Women with Births | Births / 1,000 Women |
| Less than High School | 0 (0.0%) | 0.0 |
| High School Diploma | 0 (0.0%) | 0.0 |
| College or Associate's Degree | 0 (0.0%) | 0.0 |
| Bachelor's Degree | 0 (0.0%) | 0.0 |
| Graduate Degree | 0 (0.0%) | 0.0 |
| Total | 0 (0.0%) | 0.0 |
Fertility by Education by Marriage Status in Louisville
| Educational Attainment | Married | Unmarried |
| Less than High School | 0 (0.0%) | 0 (0.0%) |
| High School Diploma | 0 (0.0%) | 0 (0.0%) |
| College or Associate's Degree | 0 (0.0%) | 0 (0.0%) |
| Bachelor's Degree | 0 (0.0%) | 0 (0.0%) |
| Graduate Degree | 0 (0.0%) | 0 (0.0%) |
| Total | 0 (0.0%) | 0 (0.0%) |
Employment Characteristics in Louisville
Employment by Class of Employer in Louisville
Among the 2,185 employed individuals in Louisville, private company employees (1,493 | 68.3%), self-employed (not incorporated) (325 | 14.9%), and local government employees (151 | 6.9%) make up the most common classes of employment.
| Employer Class | # Employees | % Employees |
| Private Company Employees | 1,493 | 68.3% |
| Self-Employed (Incorporated) | 74 | 3.4% |
| Self-Employed (Not Incorporated) | 325 | 14.9% |
| Not-for-profit Organizations | 94 | 4.3% |
| Local Government Employees | 151 | 6.9% |
| State Government Employees | 13 | 0.6% |
| Federal Government Employees | 26 | 1.2% |
| Unpaid Family Workers | 9 | 0.4% |
| Total | 2,185 | 100.0% |
Employment Status by Age in Louisville
According to the labor force statistics for Louisville, out of the total population over 16 years of age (3,850), 59.7% or 2,298 individuals are in the labor force, with 4.5% or 103 of them unemployed. The age group with the highest labor force participation rate is 30 to 34 years, with 90.6% or 269 individuals in the labor force. Within the labor force, the 16 to 19 years age range has the highest percentage of unemployed individuals, with 60.4% or 81 of them being unemployed.
| Age Bracket | In Labor Force | Unemployed |
| 16 to 19 Years | 134 (80.2%) | 81 (60.4%) |
| 20 to 24 Years | 119 (87.5%) | 22 (18.5%) |
| 25 to 29 Years | 178 (70.9%) | 0 (0.0%) |
| 30 to 34 Years | 269 (90.6%) | 0 (0.0%) |
| 35 to 44 Years | 298 (81.2%) | 0 (0.0%) |
| 45 to 54 Years | 665 (86.1%) | 0 (0.0%) |
| 55 to 59 Years | 222 (69.2%) | 0 (0.0%) |
| 60 to 64 Years | 197 (51.4%) | 0 (0.0%) |
| 65 to 74 Years | 199 (24.2%) | 0 (0.0%) |
| 75 Years and over | 17 (5.1%) | 0 (0.0%) |
| Total | 2,298 (59.7%) | 103 (4.5%) |
Employment Status by Educational Attainment in Louisville
| Educational Attainment | In Labor Force | Unemployed |
| Less than High School | 175 (64.3%) | 0 (0.0%) |
| High School Diploma | 610 (68.8%) | 0 (0.0%) |
| College / Associate Degree | 565 (84.0%) | 0 (0.0%) |
| Bachelor's Degree or higher | 479 (85.5%) | 0 (0.0%) |
| Total | 1,829 (76.5%) | 0 (0.0%) |
Employment Occupations by Sex in Louisville
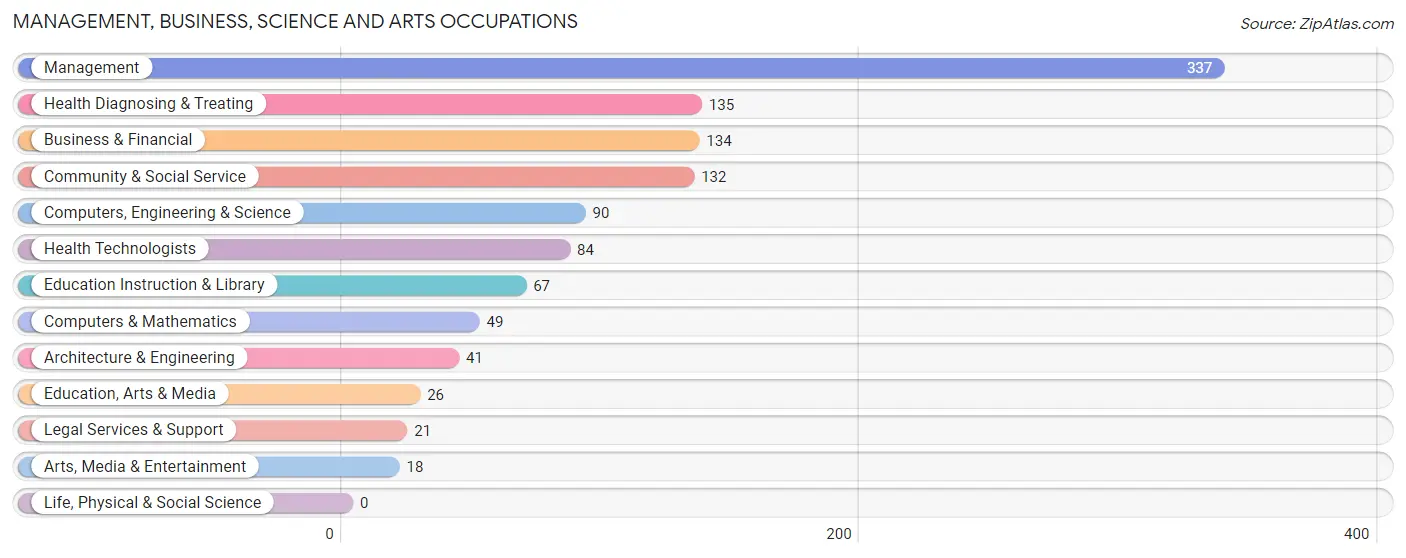
Management, Business, Science and Arts Occupations
The most common Management, Business, Science and Arts occupations in Louisville are Management (337 | 15.3%), Health Diagnosing & Treating (135 | 6.1%), Business & Financial (134 | 6.1%), Community & Social Service (132 | 6.0%), and Computers, Engineering & Science (90 | 4.1%).
Management, Business, Science and Arts Occupations by Sex
Within the Management, Business, Science and Arts occupations in Louisville, the most male-oriented occupations are Computers, Engineering & Science (100.0%), Computers & Mathematics (100.0%), and Architecture & Engineering (100.0%), while the most female-oriented occupations are Health Diagnosing & Treating (66.7%), Health Technologists (61.9%), and Education Instruction & Library (61.2%).
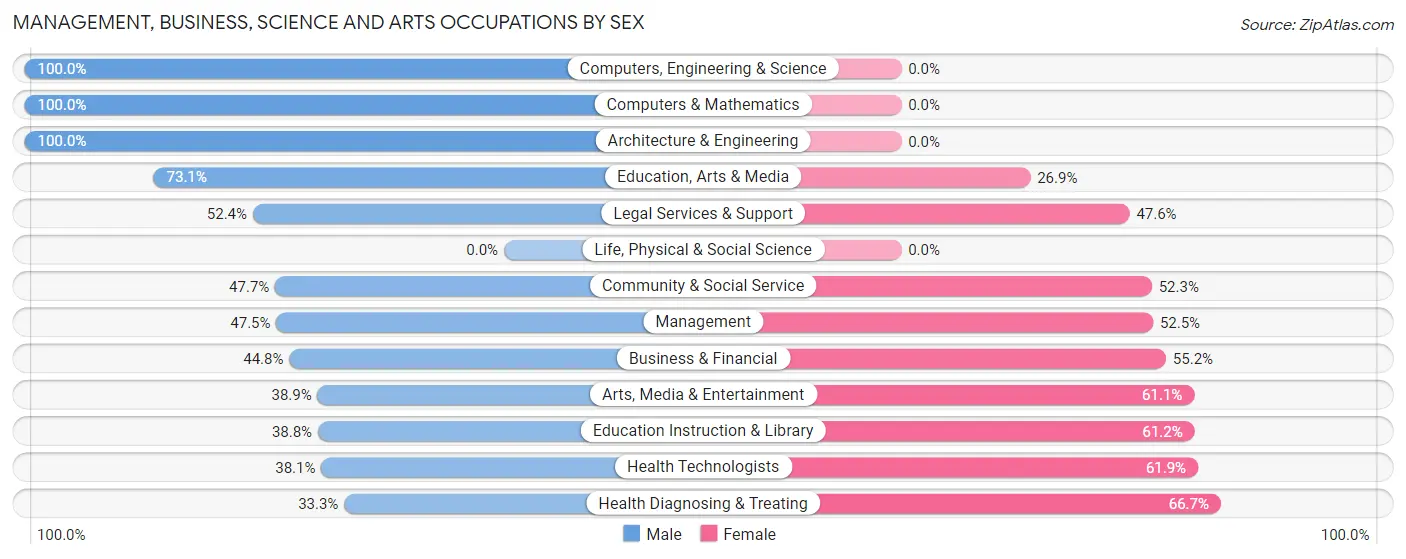
| Occupation | Male | Female |
| Management | 160 (47.5%) | 177 (52.5%) |
| Business & Financial | 60 (44.8%) | 74 (55.2%) |
| Computers, Engineering & Science | 90 (100.0%) | 0 (0.0%) |
| Computers & Mathematics | 49 (100.0%) | 0 (0.0%) |
| Architecture & Engineering | 41 (100.0%) | 0 (0.0%) |
| Life, Physical & Social Science | 0 (0.0%) | 0 (0.0%) |
| Community & Social Service | 63 (47.7%) | 69 (52.3%) |
| Education, Arts & Media | 19 (73.1%) | 7 (26.9%) |
| Legal Services & Support | 11 (52.4%) | 10 (47.6%) |
| Education Instruction & Library | 26 (38.8%) | 41 (61.2%) |
| Arts, Media & Entertainment | 7 (38.9%) | 11 (61.1%) |
| Health Diagnosing & Treating | 45 (33.3%) | 90 (66.7%) |
| Health Technologists | 32 (38.1%) | 52 (61.9%) |
| Total (Category) | 418 (50.5%) | 410 (49.5%) |
| Total (Overall) | 1,270 (57.9%) | 925 (42.1%) |
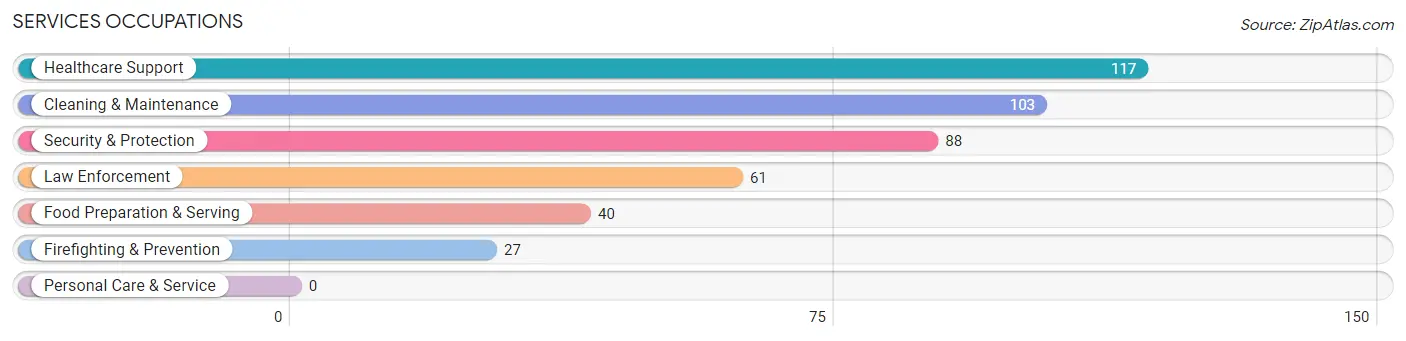
Services Occupations
The most common Services occupations in Louisville are Healthcare Support (117 | 5.3%), Cleaning & Maintenance (103 | 4.7%), Security & Protection (88 | 4.0%), Law Enforcement (61 | 2.8%), and Food Preparation & Serving (40 | 1.8%).
Services Occupations by Sex
Within the Services occupations in Louisville, the most male-oriented occupations are Security & Protection (100.0%), Firefighting & Prevention (100.0%), and Law Enforcement (100.0%), while the most female-oriented occupations are Healthcare Support (94.9%), Food Preparation & Serving (22.5%), and Cleaning & Maintenance (11.7%).
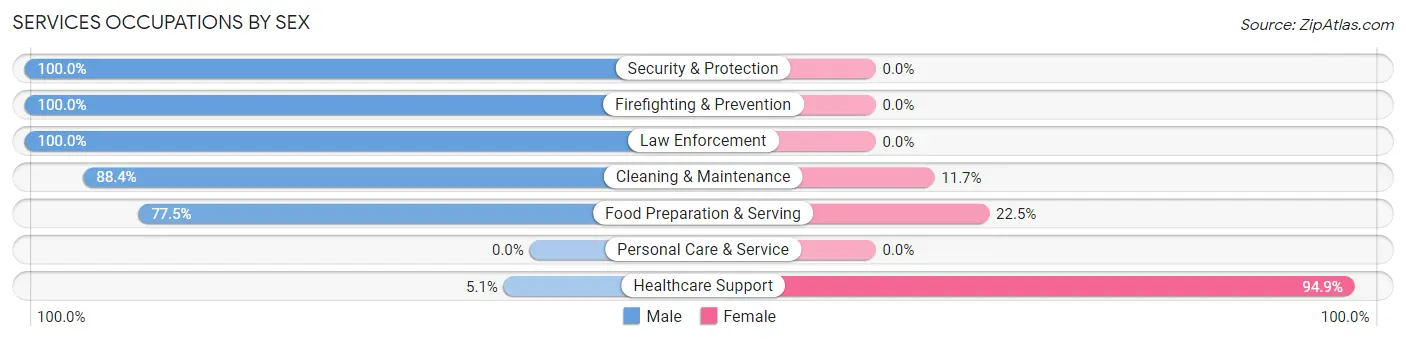
| Occupation | Male | Female |
| Healthcare Support | 6 (5.1%) | 111 (94.9%) |
| Security & Protection | 88 (100.0%) | 0 (0.0%) |
| Firefighting & Prevention | 27 (100.0%) | 0 (0.0%) |
| Law Enforcement | 61 (100.0%) | 0 (0.0%) |
| Food Preparation & Serving | 31 (77.5%) | 9 (22.5%) |
| Cleaning & Maintenance | 91 (88.3%) | 12 (11.7%) |
| Personal Care & Service | 0 (0.0%) | 0 (0.0%) |
| Total (Category) | 216 (62.1%) | 132 (37.9%) |
| Total (Overall) | 1,270 (57.9%) | 925 (42.1%) |
Sales and Office Occupations
The most common Sales and Office occupations in Louisville are Office & Administration (279 | 12.7%), and Sales & Related (161 | 7.3%).

Sales and Office Occupations by Sex
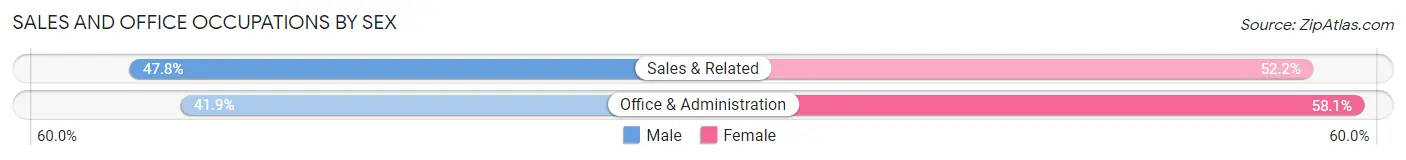
| Occupation | Male | Female |
| Sales & Related | 77 (47.8%) | 84 (52.2%) |
| Office & Administration | 117 (41.9%) | 162 (58.1%) |
| Total (Category) | 194 (44.1%) | 246 (55.9%) |
| Total (Overall) | 1,270 (57.9%) | 925 (42.1%) |
Natural Resources, Construction and Maintenance Occupations
The most common Natural Resources, Construction and Maintenance occupations in Louisville are Construction & Extraction (136 | 6.2%), and Installation, Maintenance & Repair (121 | 5.5%).

Natural Resources, Construction and Maintenance Occupations by Sex

| Occupation | Male | Female |
| Farming, Fishing & Forestry | 0 (0.0%) | 0 (0.0%) |
| Construction & Extraction | 94 (69.1%) | 42 (30.9%) |
| Installation, Maintenance & Repair | 121 (100.0%) | 0 (0.0%) |
| Total (Category) | 215 (83.7%) | 42 (16.3%) |
| Total (Overall) | 1,270 (57.9%) | 925 (42.1%) |
Production, Transportation and Moving Occupations
The most common Production, Transportation and Moving occupations in Louisville are Production (127 | 5.8%), Material Moving (112 | 5.1%), and Transportation (83 | 3.8%).
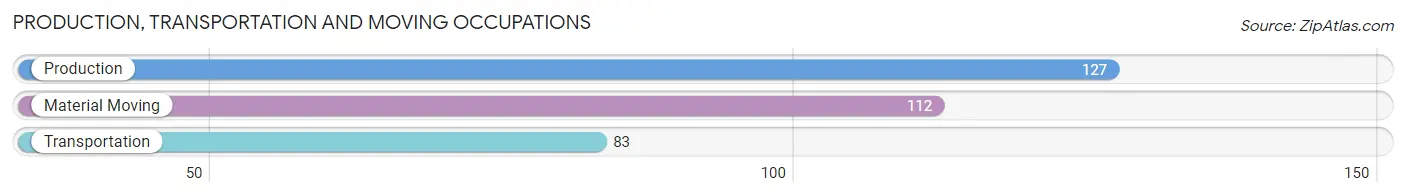
Production, Transportation and Moving Occupations by Sex
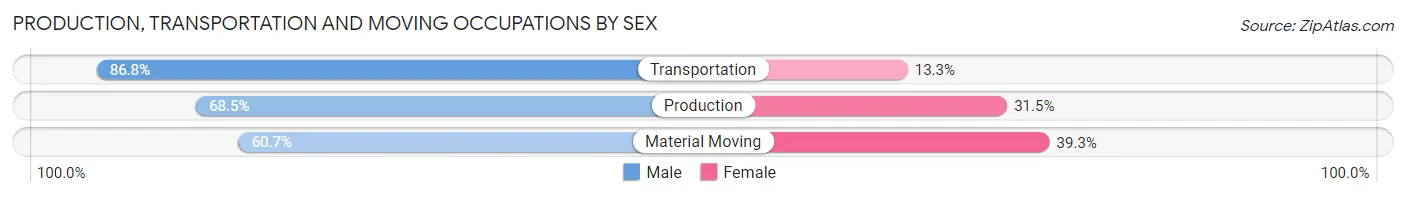
| Occupation | Male | Female |
| Production | 87 (68.5%) | 40 (31.5%) |
| Transportation | 72 (86.8%) | 11 (13.3%) |
| Material Moving | 68 (60.7%) | 44 (39.3%) |
| Total (Category) | 227 (70.5%) | 95 (29.5%) |
| Total (Overall) | 1,270 (57.9%) | 925 (42.1%) |
Employment Industries by Sex in Louisville
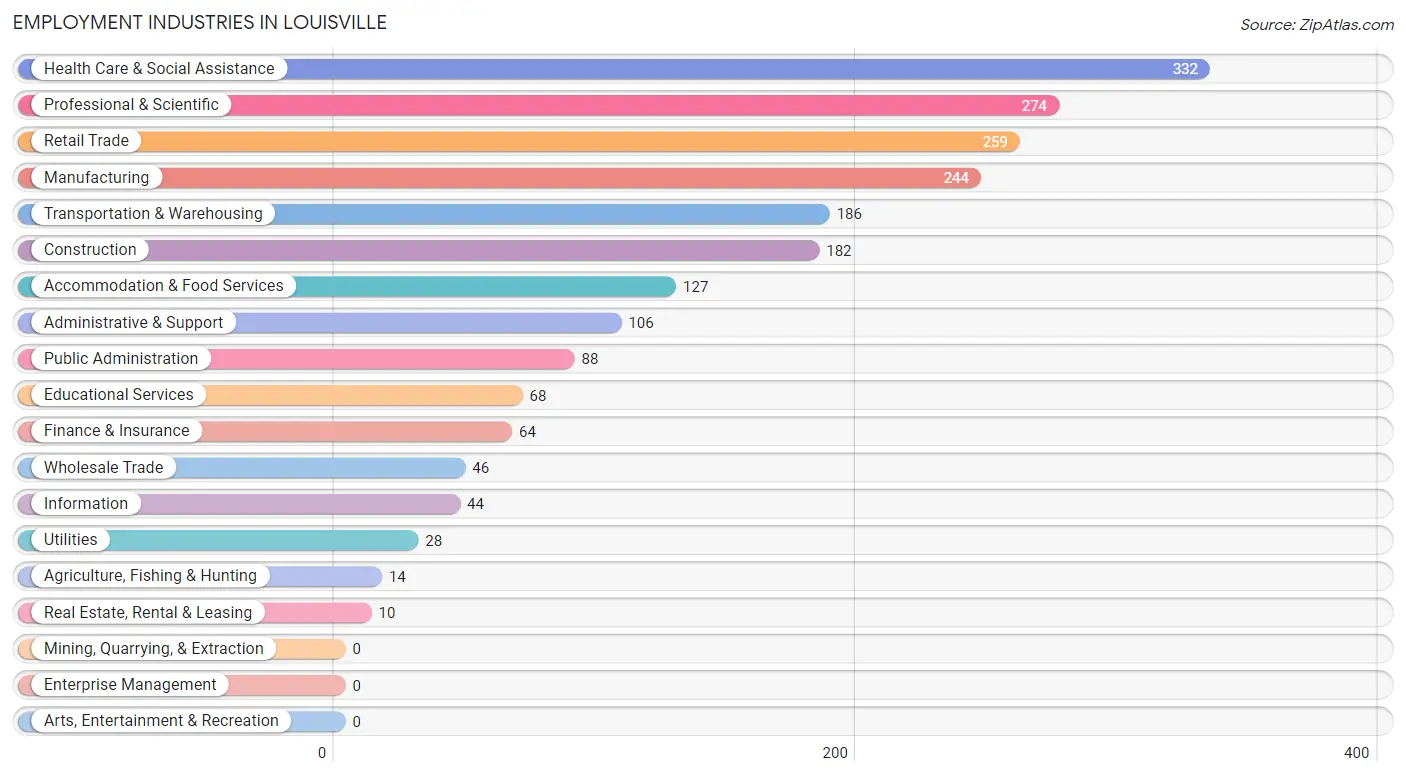
Employment Industries in Louisville
The major employment industries in Louisville include Health Care & Social Assistance (332 | 15.1%), Professional & Scientific (274 | 12.5%), Retail Trade (259 | 11.8%), Manufacturing (244 | 11.1%), and Transportation & Warehousing (186 | 8.5%).
Employment Industries by Sex in Louisville
The Louisville industries that see more men than women are Agriculture, Fishing & Hunting (100.0%), Wholesale Trade (100.0%), and Utilities (100.0%), whereas the industries that tend to have a higher number of women are Real Estate, Rental & Leasing (100.0%), Health Care & Social Assistance (72.9%), and Retail Trade (69.9%).
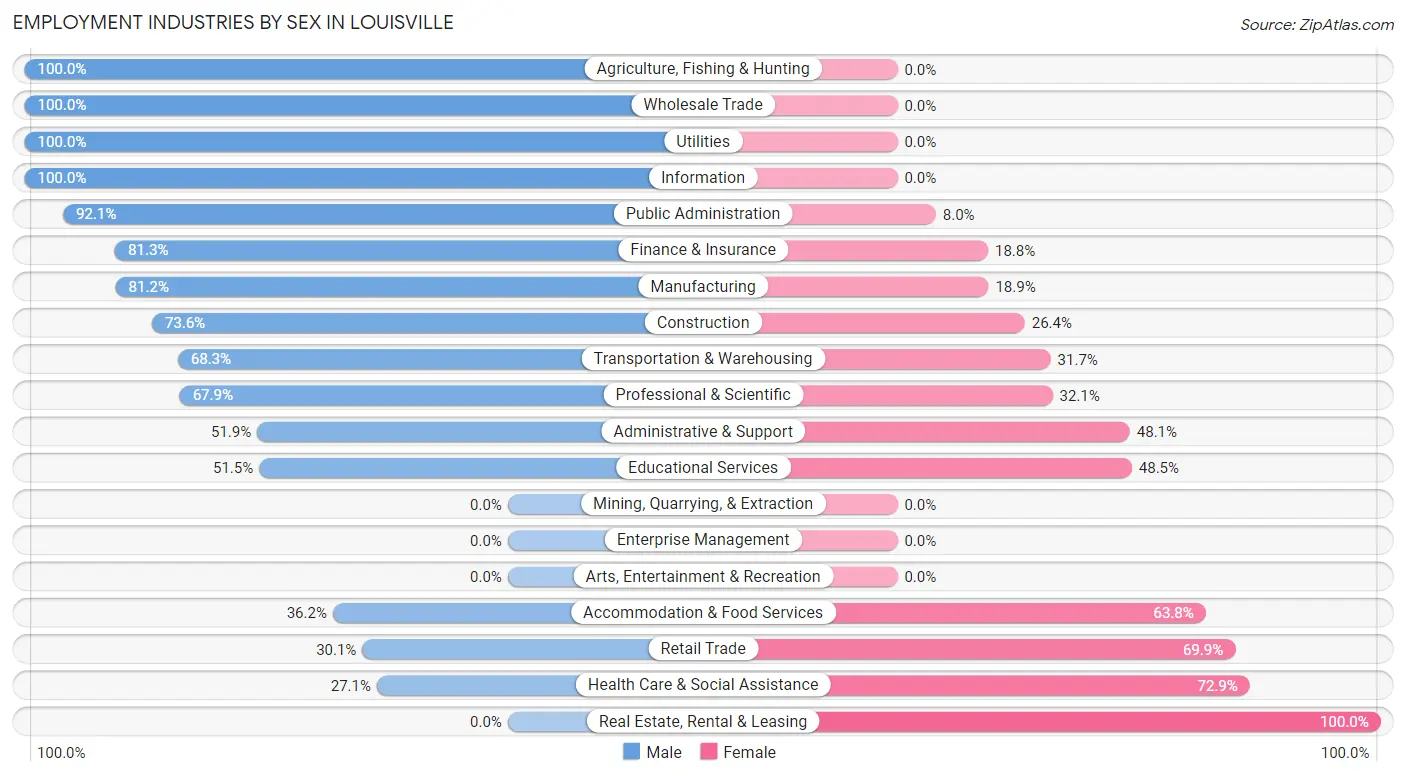
| Industry | Male | Female |
| Agriculture, Fishing & Hunting | 14 (100.0%) | 0 (0.0%) |
| Mining, Quarrying, & Extraction | 0 (0.0%) | 0 (0.0%) |
| Construction | 134 (73.6%) | 48 (26.4%) |
| Manufacturing | 198 (81.1%) | 46 (18.9%) |
| Wholesale Trade | 46 (100.0%) | 0 (0.0%) |
| Retail Trade | 78 (30.1%) | 181 (69.9%) |
| Transportation & Warehousing | 127 (68.3%) | 59 (31.7%) |
| Utilities | 28 (100.0%) | 0 (0.0%) |
| Information | 44 (100.0%) | 0 (0.0%) |
| Finance & Insurance | 52 (81.2%) | 12 (18.8%) |
| Real Estate, Rental & Leasing | 0 (0.0%) | 10 (100.0%) |
| Professional & Scientific | 186 (67.9%) | 88 (32.1%) |
| Enterprise Management | 0 (0.0%) | 0 (0.0%) |
| Administrative & Support | 55 (51.9%) | 51 (48.1%) |
| Educational Services | 35 (51.5%) | 33 (48.5%) |
| Health Care & Social Assistance | 90 (27.1%) | 242 (72.9%) |
| Arts, Entertainment & Recreation | 0 (0.0%) | 0 (0.0%) |
| Accommodation & Food Services | 46 (36.2%) | 81 (63.8%) |
| Public Administration | 81 (92.0%) | 7 (8.0%) |
| Total | 1,270 (57.9%) | 925 (42.1%) |
Education in Louisville
School Enrollment in Louisville
The most common levels of schooling among the 487 students in Louisville are middle school (132 | 27.1%), high school (122 | 25.1%), and elementary school (97 | 19.9%).
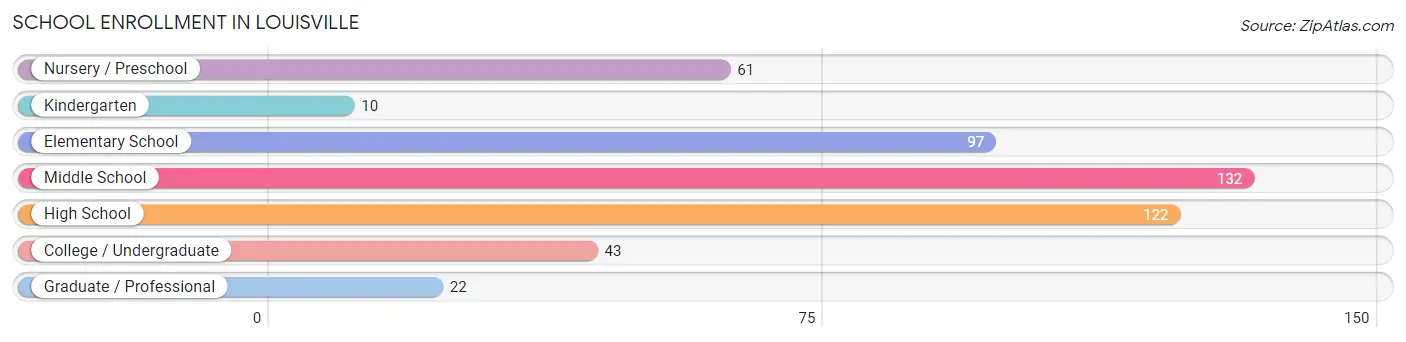
| School Level | # Students | % Students |
| Nursery / Preschool | 61 | 12.5% |
| Kindergarten | 10 | 2.1% |
| Elementary School | 97 | 19.9% |
| Middle School | 132 | 27.1% |
| High School | 122 | 25.1% |
| College / Undergraduate | 43 | 8.8% |
| Graduate / Professional | 22 | 4.5% |
| Total | 487 | 100.0% |
School Enrollment by Age by Funding Source in Louisville
Out of a total of 487 students who are enrolled in schools in Louisville, 106 (21.8%) attend a private institution, while the remaining 381 (78.2%) are enrolled in public schools. The age group of 20 to 24 year olds has the highest likelihood of being enrolled in private schools, with 14 (100.0% in the age bracket) enrolled. Conversely, the age group of 15 to 17 year olds has the lowest likelihood of being enrolled in a private school, with 122 (100.0% in the age bracket) attending a public institution.
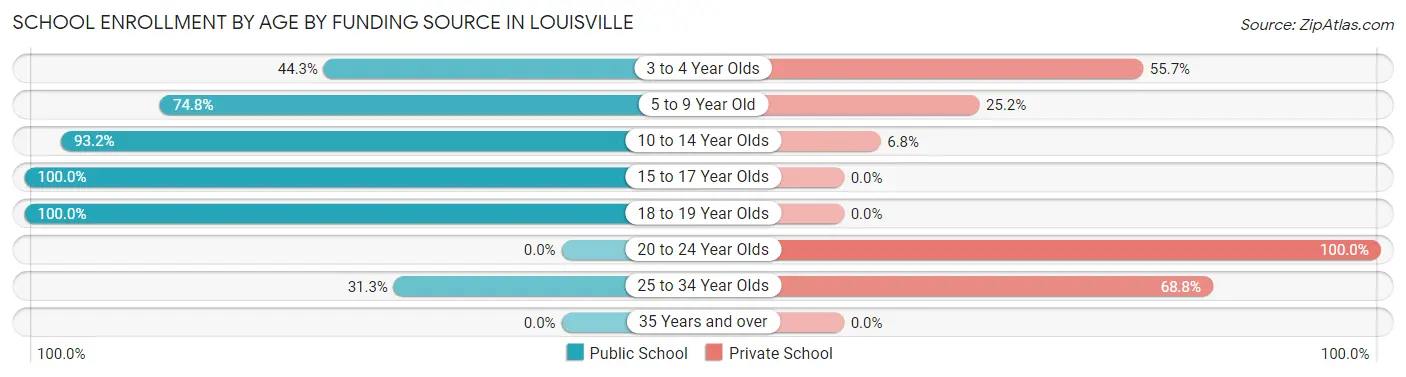
| Age Bracket | Public School | Private School |
| 3 to 4 Year Olds | 27 (44.3%) | 34 (55.7%) |
| 5 to 9 Year Old | 80 (74.8%) | 27 (25.2%) |
| 10 to 14 Year Olds | 123 (93.2%) | 9 (6.8%) |
| 15 to 17 Year Olds | 122 (100.0%) | 0 (0.0%) |
| 18 to 19 Year Olds | 19 (100.0%) | 0 (0.0%) |
| 20 to 24 Year Olds | 0 (0.0%) | 14 (100.0%) |
| 25 to 34 Year Olds | 10 (31.2%) | 22 (68.8%) |
| 35 Years and over | 0 (0.0%) | 0 (0.0%) |
| Total | 381 (78.2%) | 106 (21.8%) |
Educational Attainment by Field of Study in Louisville
Business (393 | 35.0%), education (132 | 11.8%), science & technology (96 | 8.6%), psychology (88 | 7.8%), and bio, nature & agricultural (83 | 7.4%) are the most common fields of study among 1,122 individuals in Louisville who have obtained a bachelor's degree or higher.
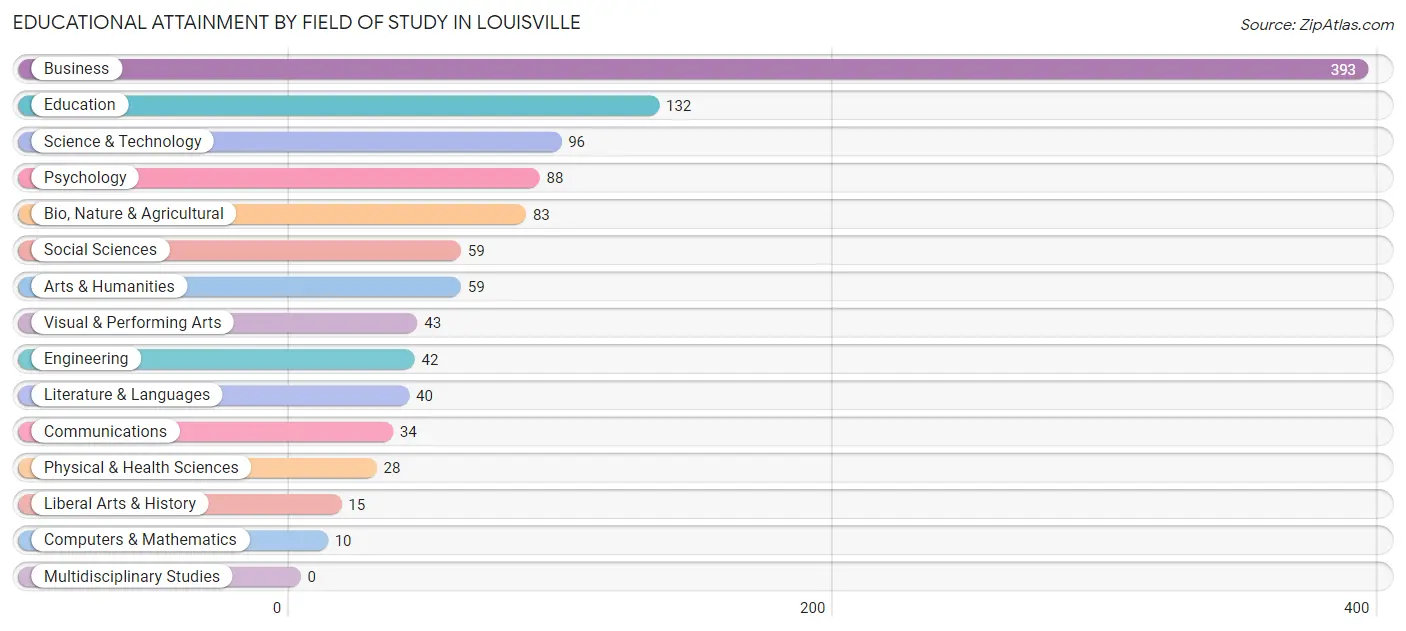
| Field of Study | # Graduates | % Graduates |
| Computers & Mathematics | 10 | 0.9% |
| Bio, Nature & Agricultural | 83 | 7.4% |
| Physical & Health Sciences | 28 | 2.5% |
| Psychology | 88 | 7.8% |
| Social Sciences | 59 | 5.3% |
| Engineering | 42 | 3.7% |
| Multidisciplinary Studies | 0 | 0.0% |
| Science & Technology | 96 | 8.6% |
| Business | 393 | 35.0% |
| Education | 132 | 11.8% |
| Literature & Languages | 40 | 3.6% |
| Liberal Arts & History | 15 | 1.3% |
| Visual & Performing Arts | 43 | 3.8% |
| Communications | 34 | 3.0% |
| Arts & Humanities | 59 | 5.3% |
| Total | 1,122 | 100.0% |
Transportation & Commute in Louisville
Vehicle Availability by Sex in Louisville
The most prevalent vehicle ownership categories in Louisville are males with 2 vehicles (376, accounting for 29.7%) and females with 2 vehicles (354, making up 41.1%).
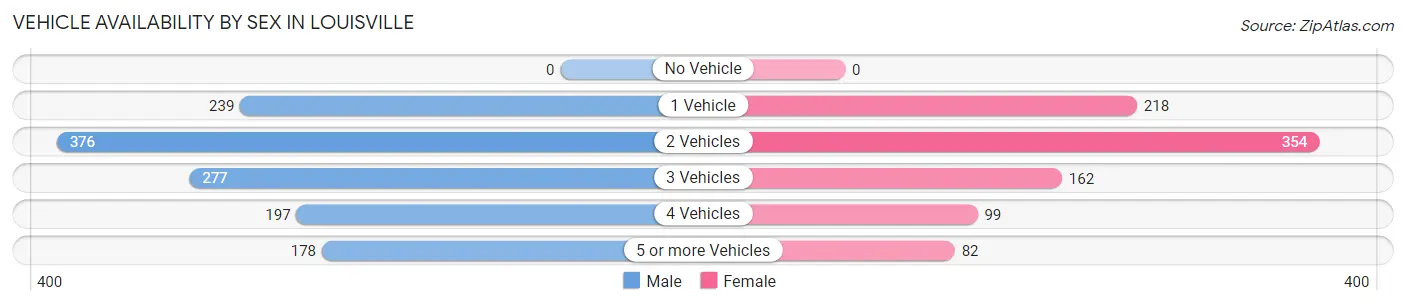
| Vehicles Available | Male | Female |
| No Vehicle | 0 (0.0%) | 0 (0.0%) |
| 1 Vehicle | 239 (18.9%) | 218 (23.8%) |
| 2 Vehicles | 376 (29.7%) | 354 (38.7%) |
| 3 Vehicles | 277 (21.9%) | 162 (17.7%) |
| 4 Vehicles | 197 (15.5%) | 99 (10.8%) |
| 5 or more Vehicles | 178 (14.1%) | 82 (9.0%) |
| Total | 1,267 (100.0%) | 915 (100.0%) |
Commute Time in Louisville
The most frequently occuring commute durations in Louisville are 30 to 34 minutes (599 commuters, 29.7%), 20 to 24 minutes (371 commuters, 18.4%), and 10 to 14 minutes (282 commuters, 14.0%).
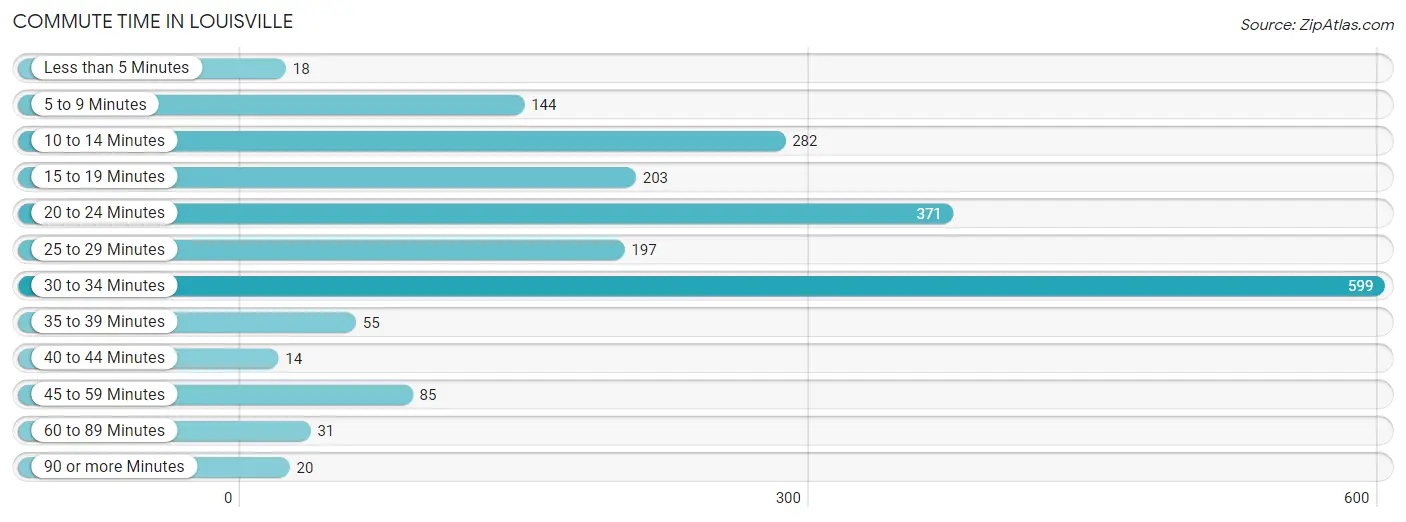
| Commute Time | # Commuters | % Commuters |
| Less than 5 Minutes | 18 | 0.9% |
| 5 to 9 Minutes | 144 | 7.1% |
| 10 to 14 Minutes | 282 | 14.0% |
| 15 to 19 Minutes | 203 | 10.1% |
| 20 to 24 Minutes | 371 | 18.4% |
| 25 to 29 Minutes | 197 | 9.8% |
| 30 to 34 Minutes | 599 | 29.7% |
| 35 to 39 Minutes | 55 | 2.7% |
| 40 to 44 Minutes | 14 | 0.7% |
| 45 to 59 Minutes | 85 | 4.2% |
| 60 to 89 Minutes | 31 | 1.5% |
| 90 or more Minutes | 20 | 1.0% |
Commute Time by Sex in Louisville
The most common commute times in Louisville are 30 to 34 minutes (341 commuters, 28.6%) for males and 30 to 34 minutes (258 commuters, 31.2%) for females.
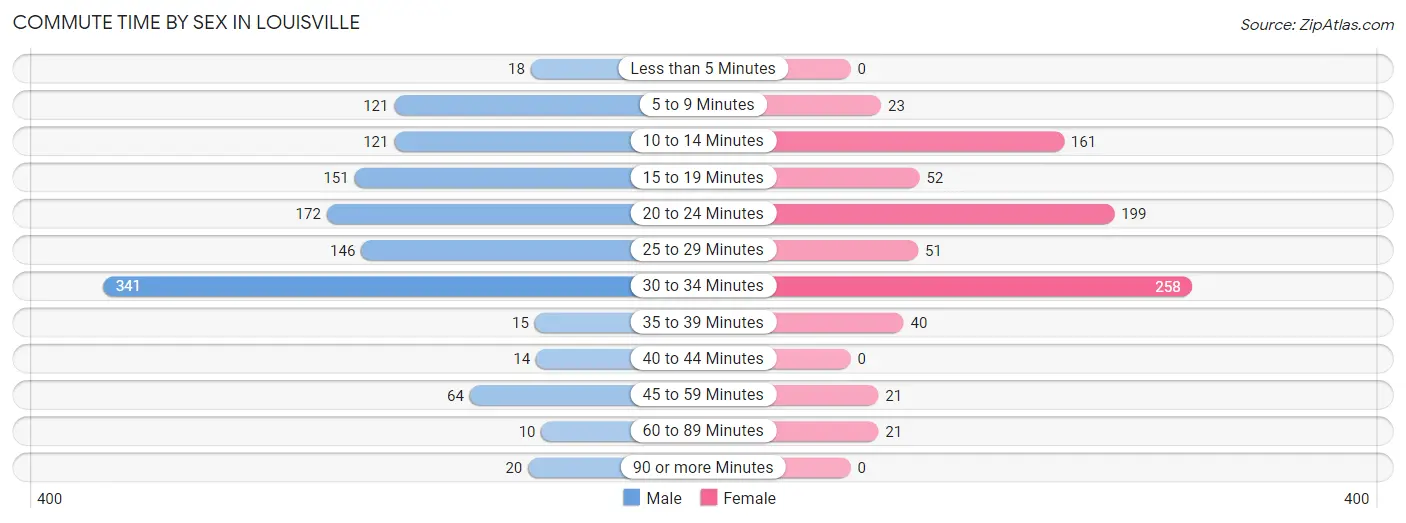
| Commute Time | Male | Female |
| Less than 5 Minutes | 18 (1.5%) | 0 (0.0%) |
| 5 to 9 Minutes | 121 (10.1%) | 23 (2.8%) |
| 10 to 14 Minutes | 121 (10.1%) | 161 (19.5%) |
| 15 to 19 Minutes | 151 (12.7%) | 52 (6.3%) |
| 20 to 24 Minutes | 172 (14.4%) | 199 (24.1%) |
| 25 to 29 Minutes | 146 (12.2%) | 51 (6.2%) |
| 30 to 34 Minutes | 341 (28.6%) | 258 (31.2%) |
| 35 to 39 Minutes | 15 (1.3%) | 40 (4.8%) |
| 40 to 44 Minutes | 14 (1.2%) | 0 (0.0%) |
| 45 to 59 Minutes | 64 (5.4%) | 21 (2.5%) |
| 60 to 89 Minutes | 10 (0.8%) | 21 (2.5%) |
| 90 or more Minutes | 20 (1.7%) | 0 (0.0%) |
Time of Departure to Work by Sex in Louisville
The most frequent times of departure to work in Louisville are 8:00 AM to 8:29 AM (215, 18.0%) for males and 8:00 AM to 8:29 AM (193, 23.4%) for females.
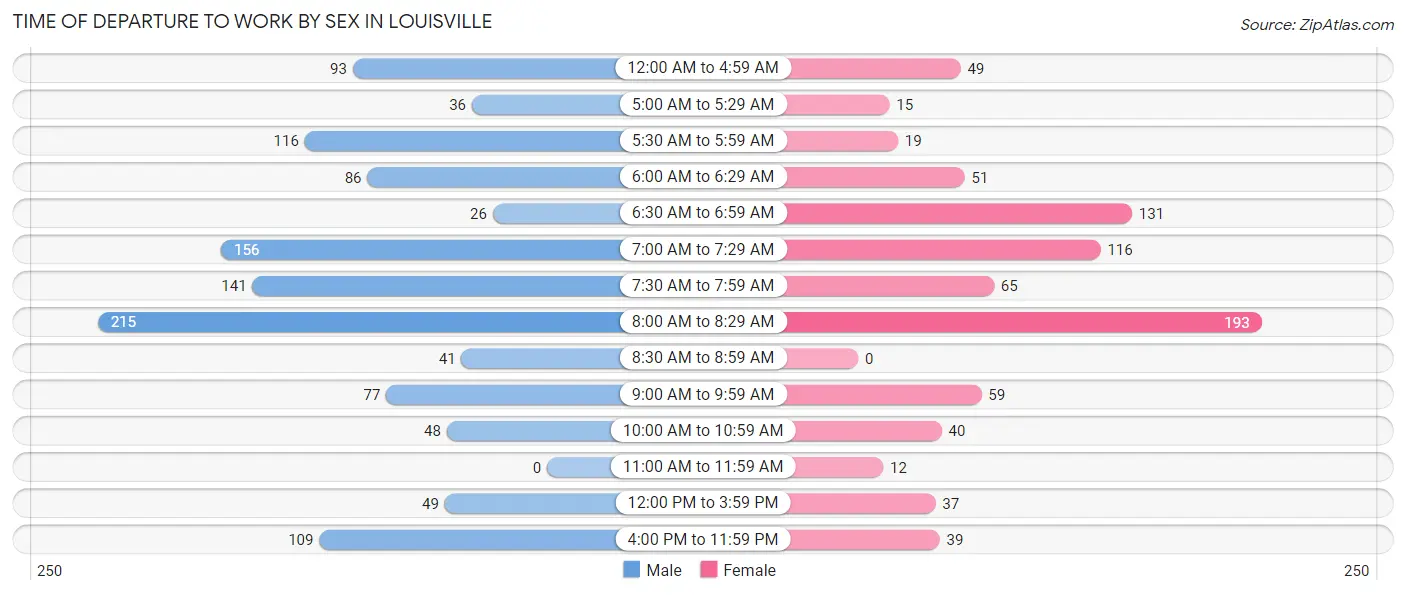
| Time of Departure | Male | Female |
| 12:00 AM to 4:59 AM | 93 (7.8%) | 49 (5.9%) |
| 5:00 AM to 5:29 AM | 36 (3.0%) | 15 (1.8%) |
| 5:30 AM to 5:59 AM | 116 (9.7%) | 19 (2.3%) |
| 6:00 AM to 6:29 AM | 86 (7.2%) | 51 (6.2%) |
| 6:30 AM to 6:59 AM | 26 (2.2%) | 131 (15.9%) |
| 7:00 AM to 7:29 AM | 156 (13.1%) | 116 (14.0%) |
| 7:30 AM to 7:59 AM | 141 (11.8%) | 65 (7.9%) |
| 8:00 AM to 8:29 AM | 215 (18.0%) | 193 (23.4%) |
| 8:30 AM to 8:59 AM | 41 (3.4%) | 0 (0.0%) |
| 9:00 AM to 9:59 AM | 77 (6.5%) | 59 (7.1%) |
| 10:00 AM to 10:59 AM | 48 (4.0%) | 40 (4.8%) |
| 11:00 AM to 11:59 AM | 0 (0.0%) | 12 (1.5%) |
| 12:00 PM to 3:59 PM | 49 (4.1%) | 37 (4.5%) |
| 4:00 PM to 11:59 PM | 109 (9.1%) | 39 (4.7%) |
| Total | 1,193 (100.0%) | 826 (100.0%) |
Housing Occupancy in Louisville
Occupancy by Ownership in Louisville
Of the total 1,889 dwellings in Louisville, owner-occupied units account for 1,662 (88.0%), while renter-occupied units make up 227 (12.0%).
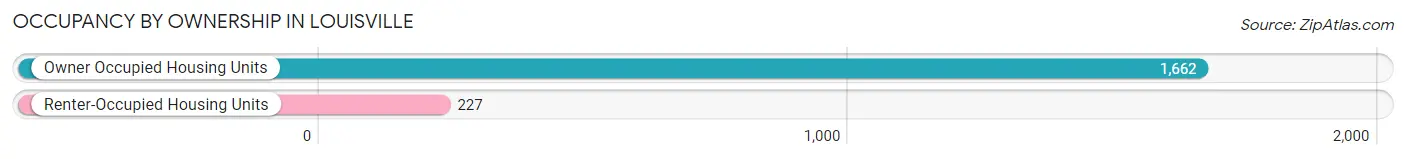
| Occupancy | # Housing Units | % Housing Units |
| Owner Occupied Housing Units | 1,662 | 88.0% |
| Renter-Occupied Housing Units | 227 | 12.0% |
| Total Occupied Housing Units | 1,889 | 100.0% |
Occupancy by Household Size in Louisville
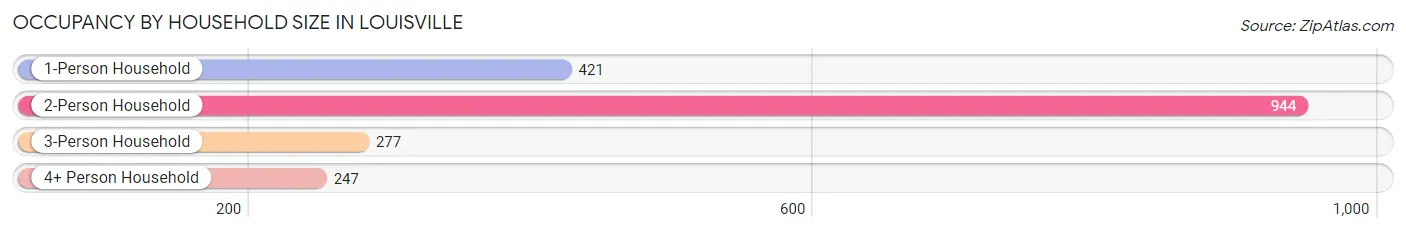
| Household Size | # Housing Units | % Housing Units |
| 1-Person Household | 421 | 22.3% |
| 2-Person Household | 944 | 50.0% |
| 3-Person Household | 277 | 14.7% |
| 4+ Person Household | 247 | 13.1% |
| Total Housing Units | 1,889 | 100.0% |
Occupancy by Ownership by Household Size in Louisville
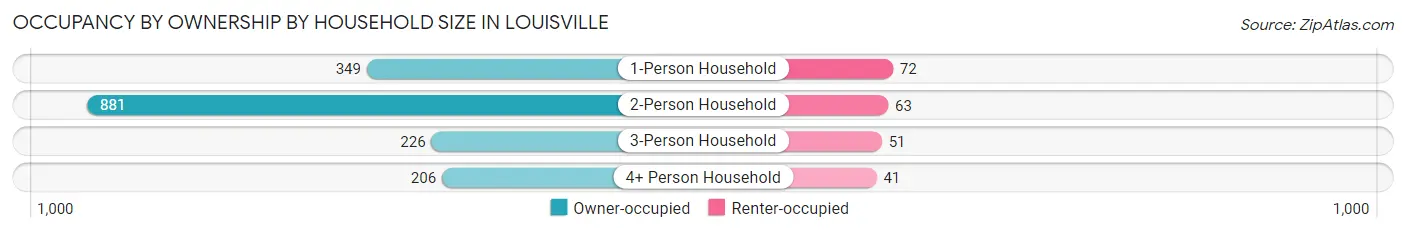
| Household Size | Owner-occupied | Renter-occupied |
| 1-Person Household | 349 (82.9%) | 72 (17.1%) |
| 2-Person Household | 881 (93.3%) | 63 (6.7%) |
| 3-Person Household | 226 (81.6%) | 51 (18.4%) |
| 4+ Person Household | 206 (83.4%) | 41 (16.6%) |
| Total Housing Units | 1,662 (88.0%) | 227 (12.0%) |
Occupancy by Educational Attainment in Louisville
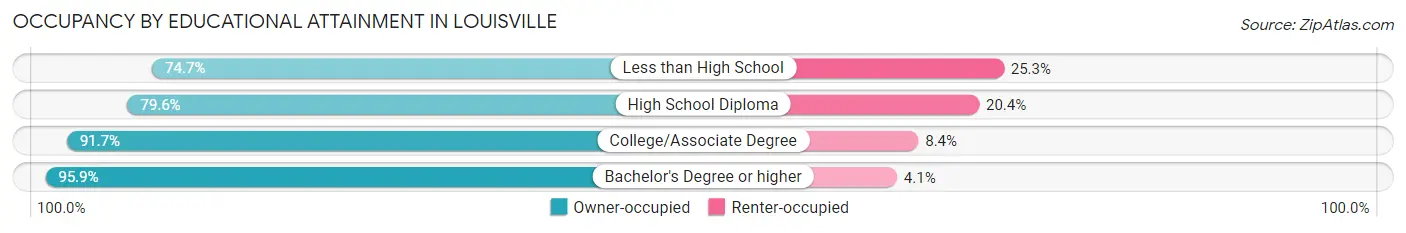
| Household Size | Owner-occupied | Renter-occupied |
| Less than High School | 124 (74.7%) | 42 (25.3%) |
| High School Diploma | 449 (79.6%) | 115 (20.4%) |
| College/Associate Degree | 483 (91.6%) | 44 (8.4%) |
| Bachelor's Degree or higher | 606 (95.9%) | 26 (4.1%) |
Occupancy by Age of Householder in Louisville
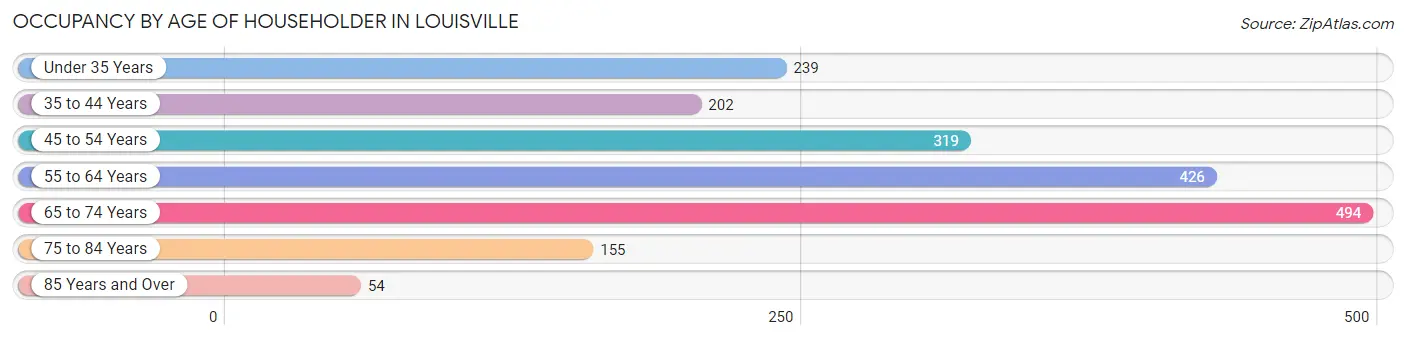
| Age Bracket | # Households | % Households |
| Under 35 Years | 239 | 12.7% |
| 35 to 44 Years | 202 | 10.7% |
| 45 to 54 Years | 319 | 16.9% |
| 55 to 64 Years | 426 | 22.6% |
| 65 to 74 Years | 494 | 26.2% |
| 75 to 84 Years | 155 | 8.2% |
| 85 Years and Over | 54 | 2.9% |
| Total | 1,889 | 100.0% |
Housing Finances in Louisville
Median Income by Occupancy in Louisville
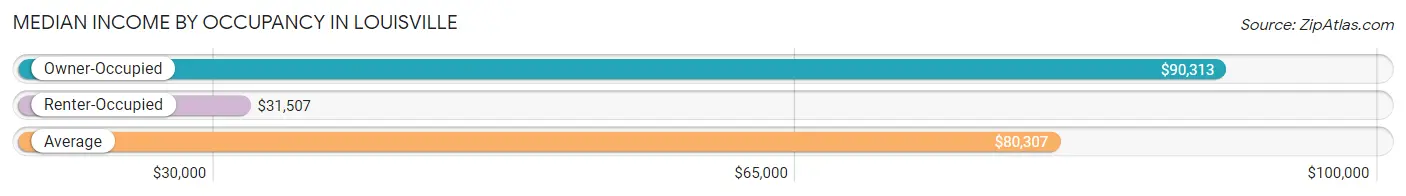
| Occupancy Type | # Households | Median Income |
| Owner-Occupied | 1,662 (88.0%) | $90,313 |
| Renter-Occupied | 227 (12.0%) | $31,507 |
| Average | 1,889 (100.0%) | $80,307 |
Occupancy by Householder Income Bracket in Louisville
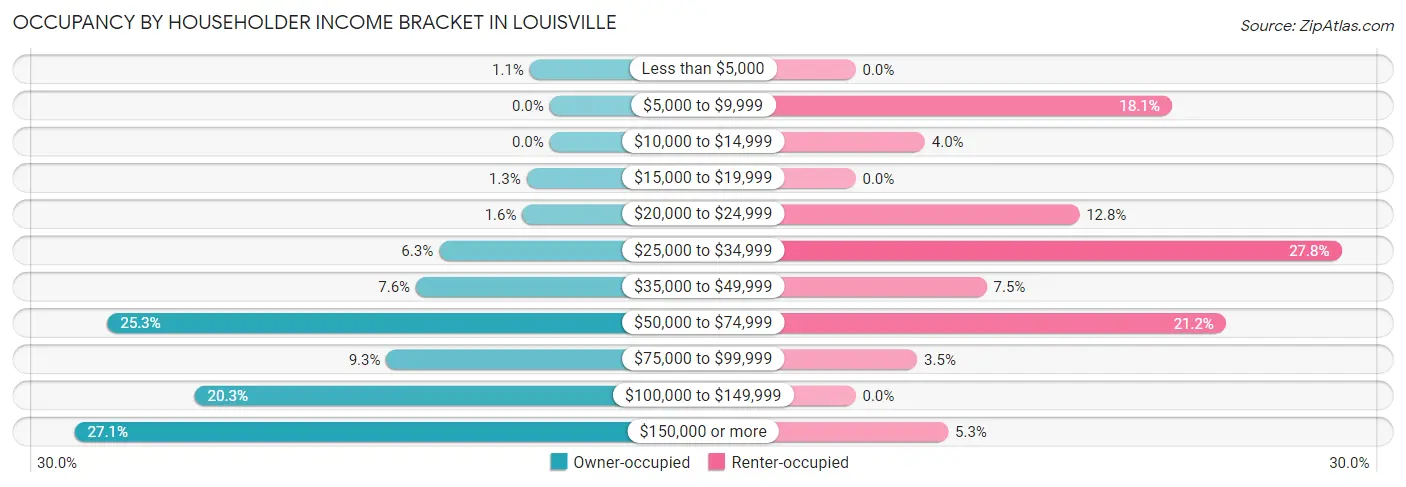
| Income Bracket | Owner-occupied | Renter-occupied |
| Less than $5,000 | 19 (1.1%) | 0 (0.0%) |
| $5,000 to $9,999 | 0 (0.0%) | 41 (18.1%) |
| $10,000 to $14,999 | 0 (0.0%) | 9 (4.0%) |
| $15,000 to $19,999 | 22 (1.3%) | 0 (0.0%) |
| $20,000 to $24,999 | 26 (1.6%) | 29 (12.8%) |
| $25,000 to $34,999 | 105 (6.3%) | 63 (27.8%) |
| $35,000 to $49,999 | 127 (7.6%) | 17 (7.5%) |
| $50,000 to $74,999 | 420 (25.3%) | 48 (21.1%) |
| $75,000 to $99,999 | 155 (9.3%) | 8 (3.5%) |
| $100,000 to $149,999 | 337 (20.3%) | 0 (0.0%) |
| $150,000 or more | 451 (27.1%) | 12 (5.3%) |
| Total | 1,662 (100.0%) | 227 (100.0%) |
Monthly Housing Cost Tiers in Louisville
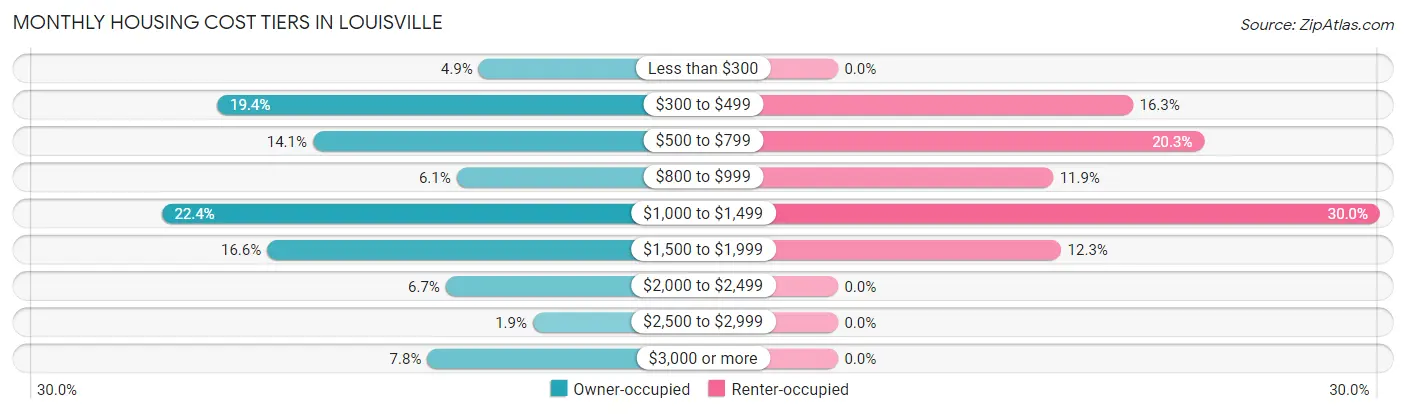
| Monthly Cost | Owner-occupied | Renter-occupied |
| Less than $300 | 82 (4.9%) | 0 (0.0%) |
| $300 to $499 | 322 (19.4%) | 37 (16.3%) |
| $500 to $799 | 234 (14.1%) | 46 (20.3%) |
| $800 to $999 | 102 (6.1%) | 27 (11.9%) |
| $1,000 to $1,499 | 373 (22.4%) | 68 (30.0%) |
| $1,500 to $1,999 | 276 (16.6%) | 28 (12.3%) |
| $2,000 to $2,499 | 112 (6.7%) | 0 (0.0%) |
| $2,500 to $2,999 | 32 (1.9%) | 0 (0.0%) |
| $3,000 or more | 129 (7.8%) | 0 (0.0%) |
| Total | 1,662 (100.0%) | 227 (100.0%) |
Physical Housing Characteristics in Louisville
Housing Structures in Louisville
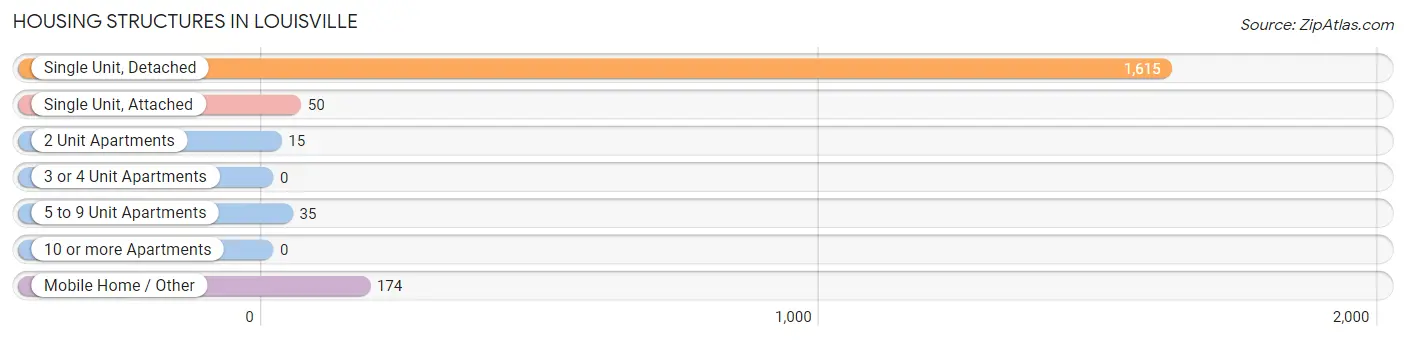
| Structure Type | # Housing Units | % Housing Units |
| Single Unit, Detached | 1,615 | 85.5% |
| Single Unit, Attached | 50 | 2.6% |
| 2 Unit Apartments | 15 | 0.8% |
| 3 or 4 Unit Apartments | 0 | 0.0% |
| 5 to 9 Unit Apartments | 35 | 1.8% |
| 10 or more Apartments | 0 | 0.0% |
| Mobile Home / Other | 174 | 9.2% |
| Total | 1,889 | 100.0% |
Housing Structures by Occupancy in Louisville
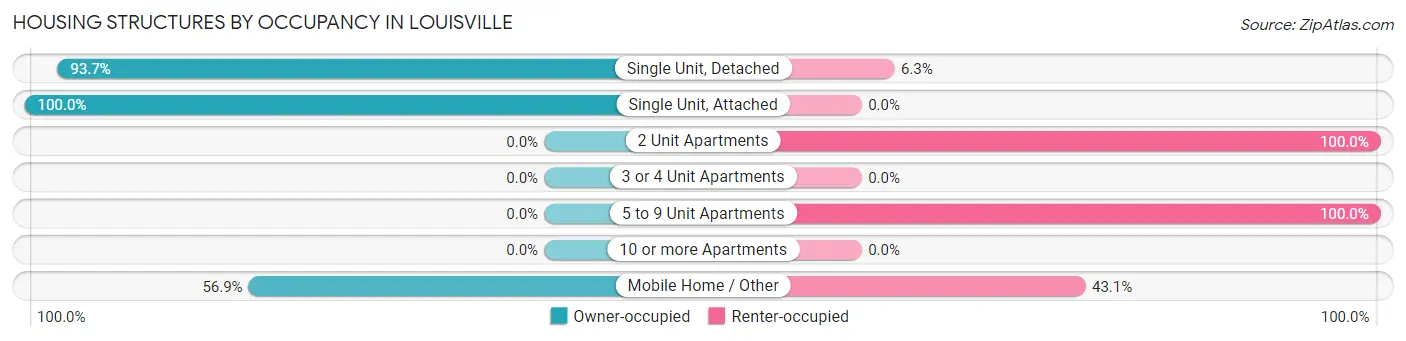
| Structure Type | Owner-occupied | Renter-occupied |
| Single Unit, Detached | 1,513 (93.7%) | 102 (6.3%) |
| Single Unit, Attached | 50 (100.0%) | 0 (0.0%) |
| 2 Unit Apartments | 0 (0.0%) | 15 (100.0%) |
| 3 or 4 Unit Apartments | 0 (0.0%) | 0 (0.0%) |
| 5 to 9 Unit Apartments | 0 (0.0%) | 35 (100.0%) |
| 10 or more Apartments | 0 (0.0%) | 0 (0.0%) |
| Mobile Home / Other | 99 (56.9%) | 75 (43.1%) |
| Total | 1,662 (88.0%) | 227 (12.0%) |
Housing Structures by Number of Rooms in Louisville
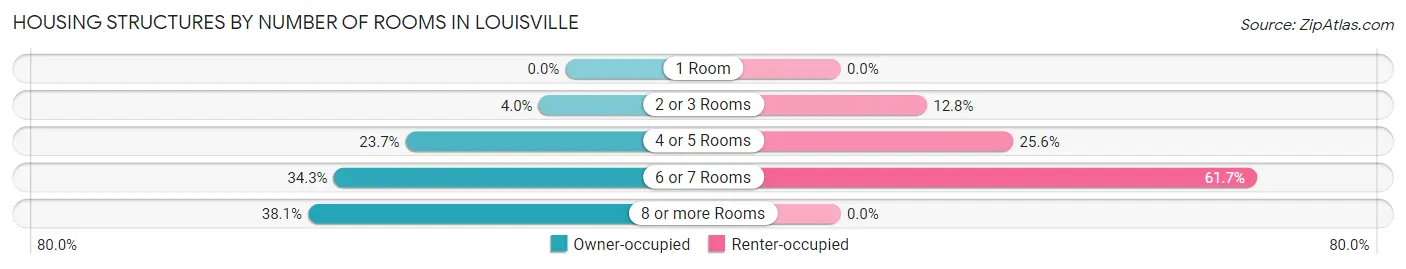
| Number of Rooms | Owner-occupied | Renter-occupied |
| 1 Room | 0 (0.0%) | 0 (0.0%) |
| 2 or 3 Rooms | 66 (4.0%) | 29 (12.8%) |
| 4 or 5 Rooms | 393 (23.6%) | 58 (25.6%) |
| 6 or 7 Rooms | 570 (34.3%) | 140 (61.7%) |
| 8 or more Rooms | 633 (38.1%) | 0 (0.0%) |
| Total | 1,662 (100.0%) | 227 (100.0%) |
Housing Structure by Heating Type in Louisville
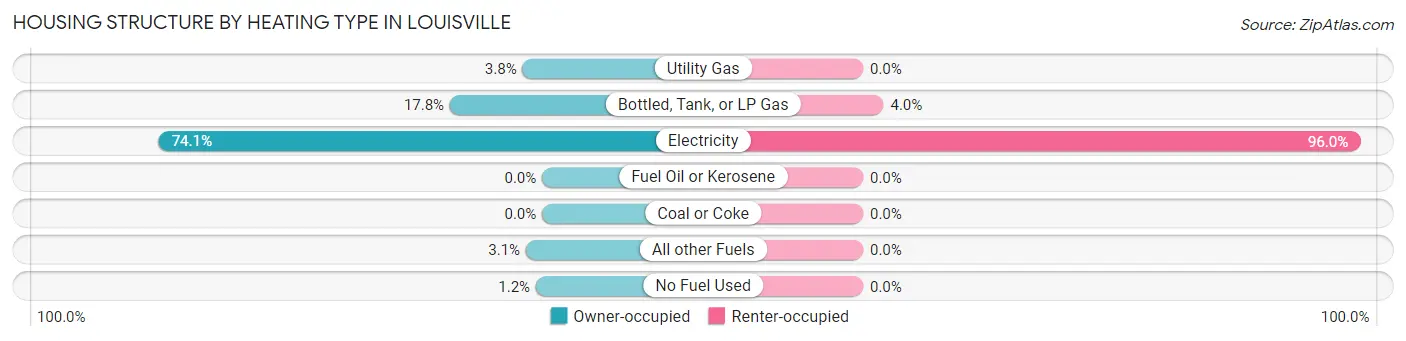
| Heating Type | Owner-occupied | Renter-occupied |
| Utility Gas | 63 (3.8%) | 0 (0.0%) |
| Bottled, Tank, or LP Gas | 296 (17.8%) | 9 (4.0%) |
| Electricity | 1,231 (74.1%) | 218 (96.0%) |
| Fuel Oil or Kerosene | 0 (0.0%) | 0 (0.0%) |
| Coal or Coke | 0 (0.0%) | 0 (0.0%) |
| All other Fuels | 52 (3.1%) | 0 (0.0%) |
| No Fuel Used | 20 (1.2%) | 0 (0.0%) |
| Total | 1,662 (100.0%) | 227 (100.0%) |
Household Vehicle Usage in Louisville
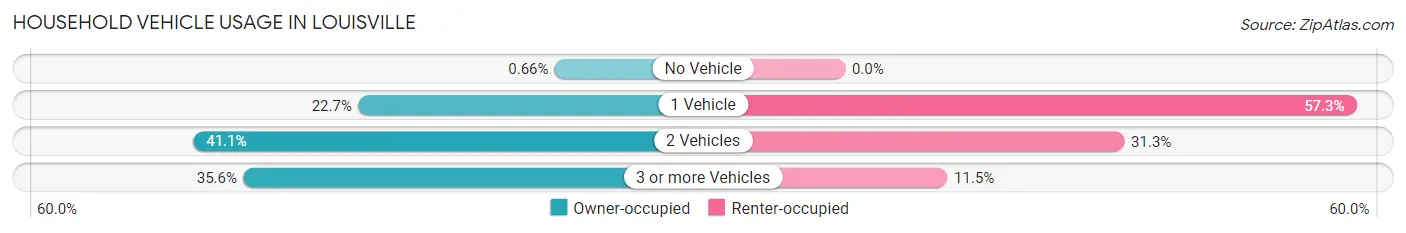
| Vehicles per Household | Owner-occupied | Renter-occupied |
| No Vehicle | 11 (0.7%) | 0 (0.0%) |
| 1 Vehicle | 377 (22.7%) | 130 (57.3%) |
| 2 Vehicles | 683 (41.1%) | 71 (31.3%) |
| 3 or more Vehicles | 591 (35.6%) | 26 (11.5%) |
| Total | 1,662 (100.0%) | 227 (100.0%) |
Real Estate & Mortgages in Louisville
Real Estate and Mortgage Overview in Louisville
| Characteristic | Without Mortgage | With Mortgage |
| Housing Units | 823 | 839 |
| Median Property Value | $308,200 | $263,800 |
| Median Household Income | $80,481 | $243 |
| Monthly Housing Costs | $513 | $129 |
| Real Estate Taxes | $1,283 | $12 |
Property Value by Mortgage Status in Louisville
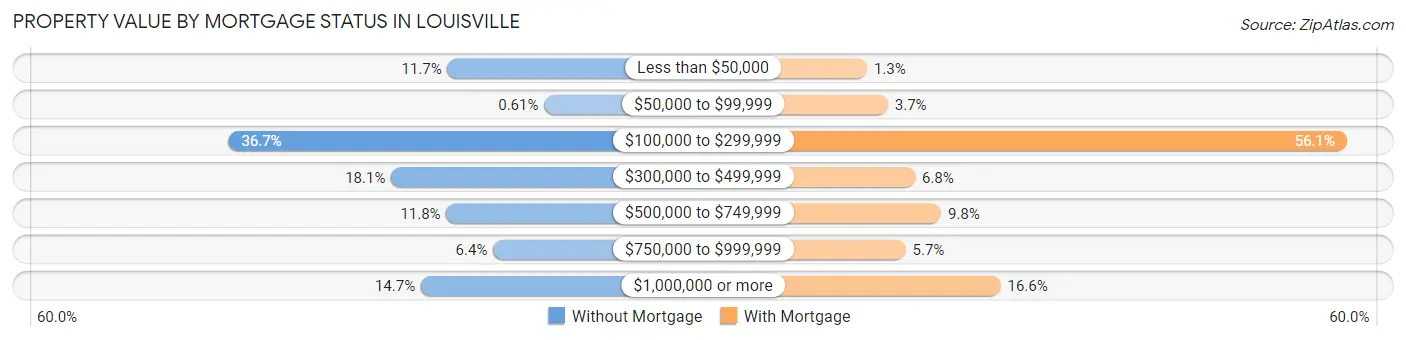
| Property Value | Without Mortgage | With Mortgage |
| Less than $50,000 | 96 (11.7%) | 11 (1.3%) |
| $50,000 to $99,999 | 5 (0.6%) | 31 (3.7%) |
| $100,000 to $299,999 | 302 (36.7%) | 471 (56.1%) |
| $300,000 to $499,999 | 149 (18.1%) | 57 (6.8%) |
| $500,000 to $749,999 | 97 (11.8%) | 82 (9.8%) |
| $750,000 to $999,999 | 53 (6.4%) | 48 (5.7%) |
| $1,000,000 or more | 121 (14.7%) | 139 (16.6%) |
| Total | 823 (100.0%) | 839 (100.0%) |
Household Income by Mortgage Status in Louisville
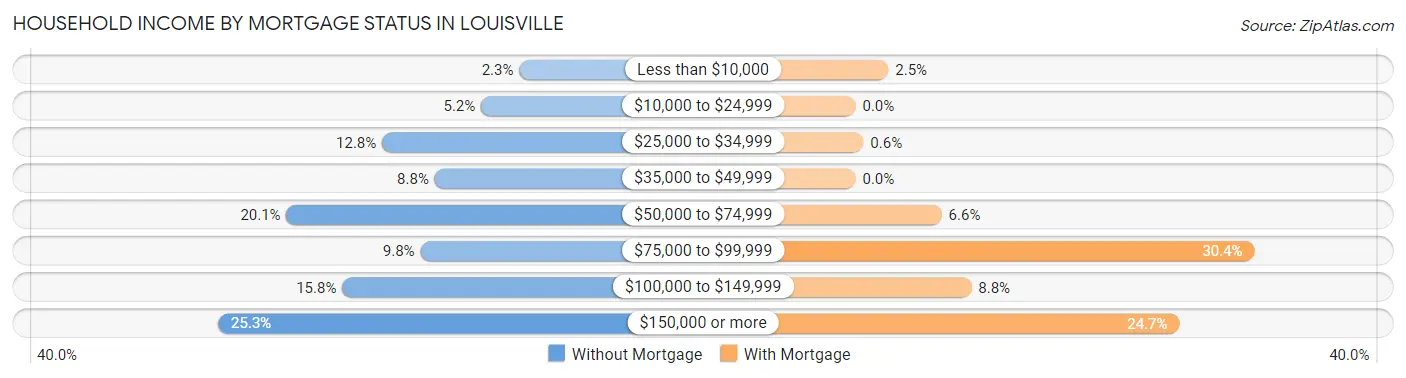
| Household Income | Without Mortgage | With Mortgage |
| Less than $10,000 | 19 (2.3%) | 21 (2.5%) |
| $10,000 to $24,999 | 43 (5.2%) | 0 (0.0%) |
| $25,000 to $34,999 | 105 (12.8%) | 5 (0.6%) |
| $35,000 to $49,999 | 72 (8.7%) | 0 (0.0%) |
| $50,000 to $74,999 | 165 (20.1%) | 55 (6.6%) |
| $75,000 to $99,999 | 81 (9.8%) | 255 (30.4%) |
| $100,000 to $149,999 | 130 (15.8%) | 74 (8.8%) |
| $150,000 or more | 208 (25.3%) | 207 (24.7%) |
| Total | 823 (100.0%) | 839 (100.0%) |
Property Value to Household Income Ratio in Louisville
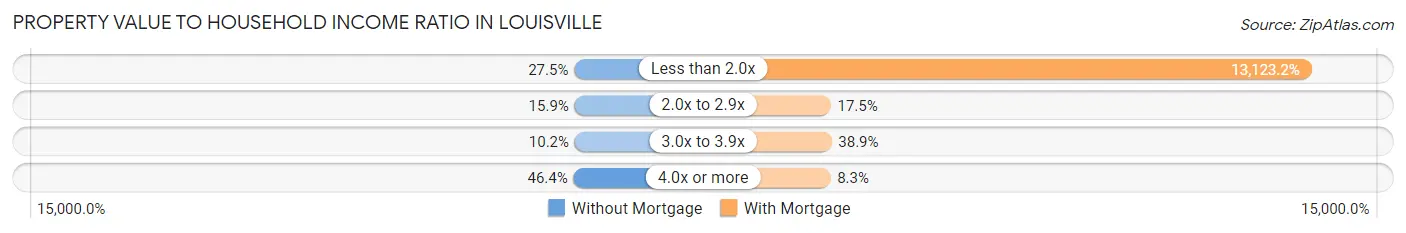
| Value-to-Income Ratio | Without Mortgage | With Mortgage |
| Less than 2.0x | 226 (27.5%) | 110,104 (13,123.2%) |
| 2.0x to 2.9x | 131 (15.9%) | 147 (17.5%) |
| 3.0x to 3.9x | 84 (10.2%) | 326 (38.9%) |
| 4.0x or more | 382 (46.4%) | 70 (8.3%) |
| Total | 823 (100.0%) | 839 (100.0%) |
Real Estate Taxes by Mortgage Status in Louisville
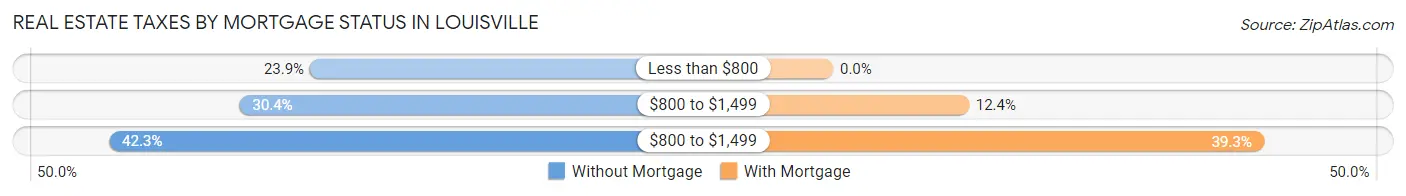
| Property Taxes | Without Mortgage | With Mortgage |
| Less than $800 | 197 (23.9%) | 0 (0.0%) |
| $800 to $1,499 | 250 (30.4%) | 104 (12.4%) |
| $800 to $1,499 | 348 (42.3%) | 330 (39.3%) |
| Total | 823 (100.0%) | 839 (100.0%) |
Health & Disability in Louisville
Health Insurance Coverage by Age in Louisville
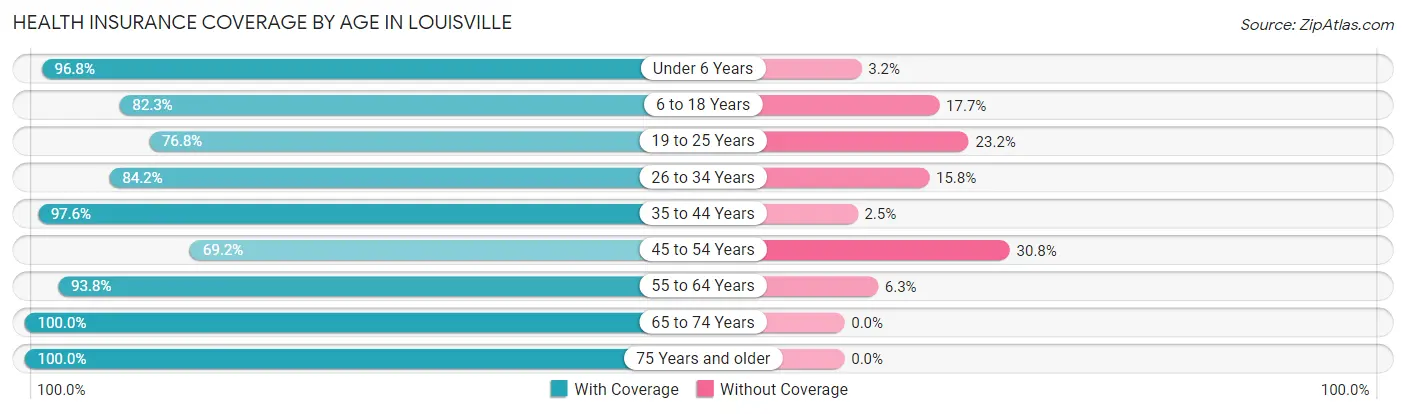
| Age Bracket | With Coverage | Without Coverage |
| Under 6 Years | 183 (96.8%) | 6 (3.2%) |
| 6 to 18 Years | 377 (82.3%) | 81 (17.7%) |
| 19 to 25 Years | 159 (76.8%) | 48 (23.2%) |
| 26 to 34 Years | 426 (84.2%) | 80 (15.8%) |
| 35 to 44 Years | 358 (97.6%) | 9 (2.5%) |
| 45 to 54 Years | 534 (69.2%) | 238 (30.8%) |
| 55 to 64 Years | 660 (93.8%) | 44 (6.2%) |
| 65 to 74 Years | 823 (100.0%) | 0 (0.0%) |
| 75 Years and older | 333 (100.0%) | 0 (0.0%) |
| Total | 3,853 (88.4%) | 506 (11.6%) |
Health Insurance Coverage by Citizenship Status in Louisville
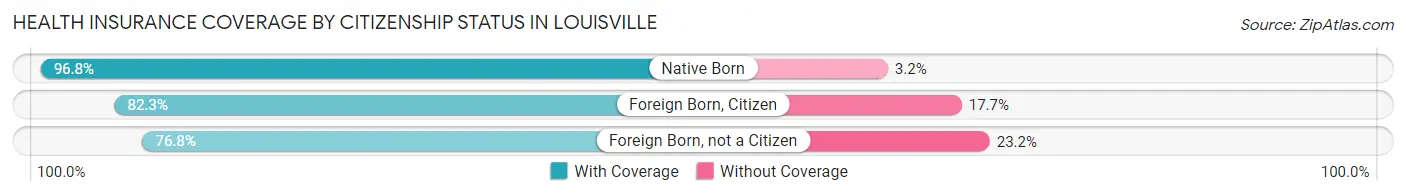
| Citizenship Status | With Coverage | Without Coverage |
| Native Born | 183 (96.8%) | 6 (3.2%) |
| Foreign Born, Citizen | 377 (82.3%) | 81 (17.7%) |
| Foreign Born, not a Citizen | 159 (76.8%) | 48 (23.2%) |
Health Insurance Coverage by Household Income in Louisville
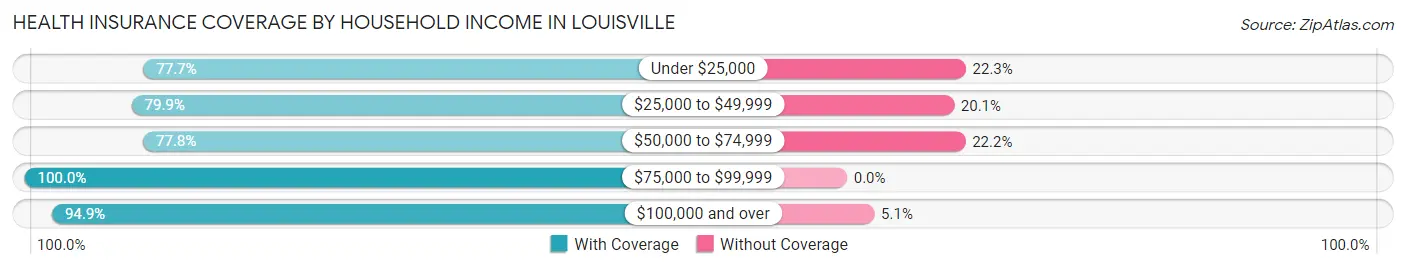
| Household Income | With Coverage | Without Coverage |
| Under $25,000 | 213 (77.7%) | 61 (22.3%) |
| $25,000 to $49,999 | 498 (79.9%) | 125 (20.1%) |
| $50,000 to $74,999 | 733 (77.8%) | 209 (22.2%) |
| $75,000 to $99,999 | 323 (100.0%) | 0 (0.0%) |
| $100,000 and over | 2,051 (94.9%) | 111 (5.1%) |
Public vs Private Health Insurance Coverage by Age in Louisville
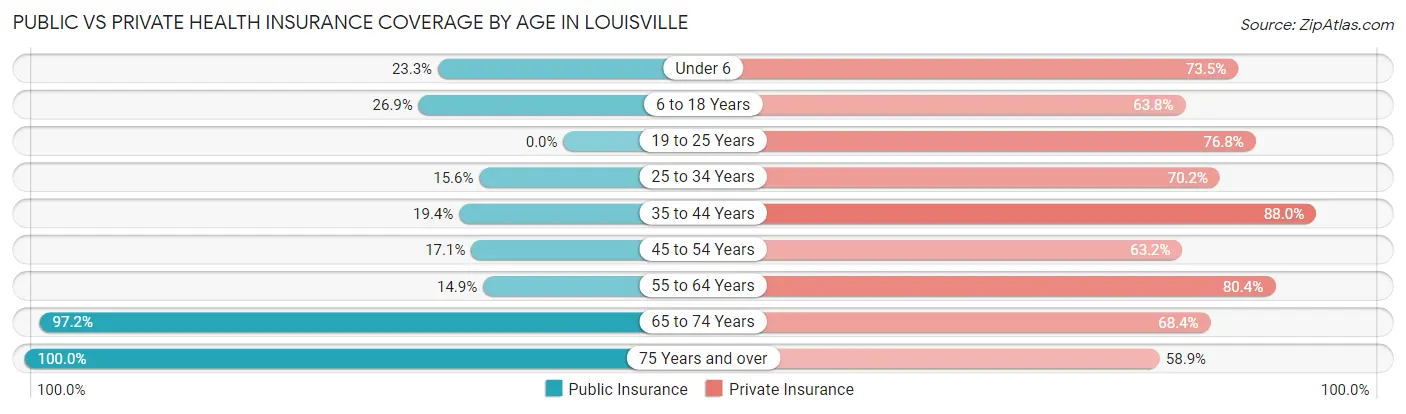
| Age Bracket | Public Insurance | Private Insurance |
| Under 6 | 44 (23.3%) | 139 (73.5%) |
| 6 to 18 Years | 123 (26.9%) | 292 (63.8%) |
| 19 to 25 Years | 0 (0.0%) | 159 (76.8%) |
| 25 to 34 Years | 79 (15.6%) | 355 (70.2%) |
| 35 to 44 Years | 71 (19.4%) | 323 (88.0%) |
| 45 to 54 Years | 132 (17.1%) | 488 (63.2%) |
| 55 to 64 Years | 105 (14.9%) | 566 (80.4%) |
| 65 to 74 Years | 800 (97.2%) | 563 (68.4%) |
| 75 Years and over | 333 (100.0%) | 196 (58.9%) |
| Total | 1,687 (38.7%) | 3,081 (70.7%) |
Disability Status by Sex by Age in Louisville
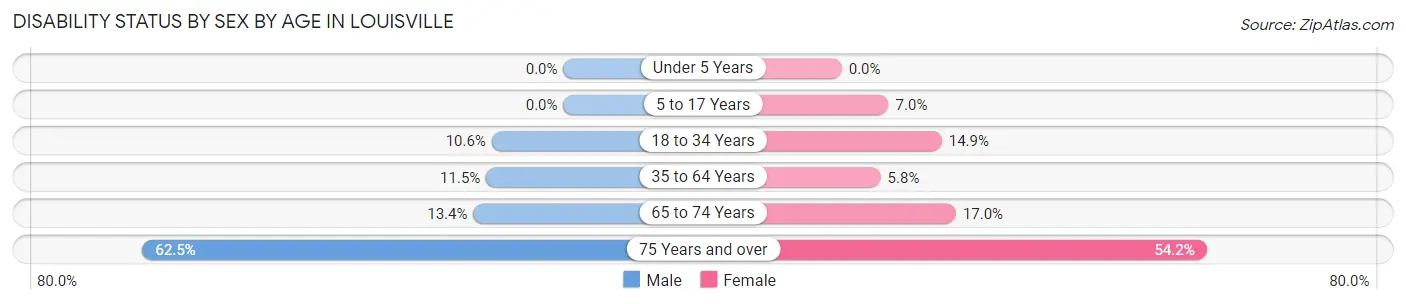
| Age Bracket | Male | Female |
| Under 5 Years | 0 (0.0%) | 0 (0.0%) |
| 5 to 17 Years | 0 (0.0%) | 11 (7.0%) |
| 18 to 34 Years | 53 (10.6%) | 45 (14.8%) |
| 35 to 64 Years | 102 (11.5%) | 55 (5.8%) |
| 65 to 74 Years | 54 (13.4%) | 71 (17.0%) |
| 75 Years and over | 65 (62.5%) | 124 (54.1%) |
Disability Class by Sex by Age in Louisville
Disability Class: Hearing Difficulty
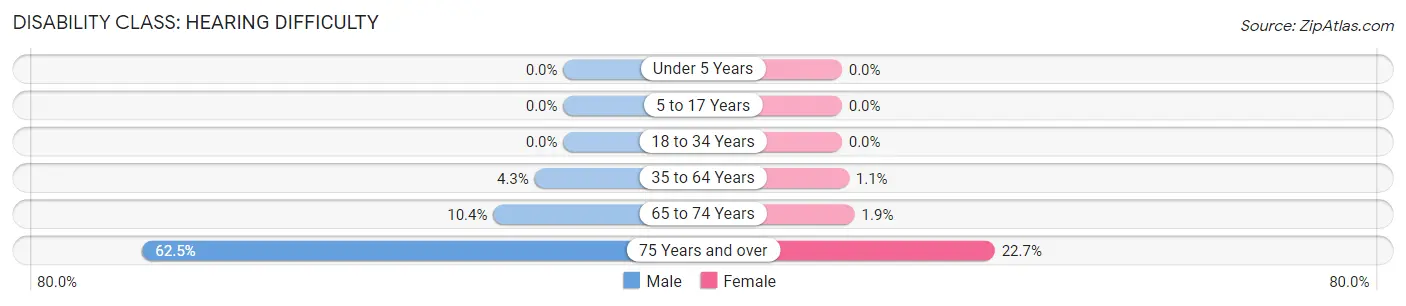
| Age Bracket | Male | Female |
| Under 5 Years | 0 (0.0%) | 0 (0.0%) |
| 5 to 17 Years | 0 (0.0%) | 0 (0.0%) |
| 18 to 34 Years | 0 (0.0%) | 0 (0.0%) |
| 35 to 64 Years | 38 (4.3%) | 10 (1.1%) |
| 65 to 74 Years | 42 (10.4%) | 8 (1.9%) |
| 75 Years and over | 65 (62.5%) | 52 (22.7%) |
Disability Class: Vision Difficulty
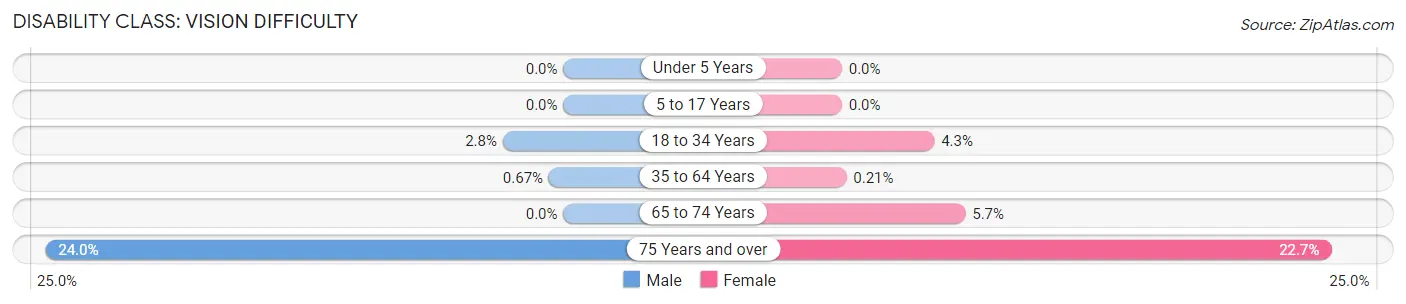
| Age Bracket | Male | Female |
| Under 5 Years | 0 (0.0%) | 0 (0.0%) |
| 5 to 17 Years | 0 (0.0%) | 0 (0.0%) |
| 18 to 34 Years | 14 (2.8%) | 13 (4.3%) |
| 35 to 64 Years | 6 (0.7%) | 2 (0.2%) |
| 65 to 74 Years | 0 (0.0%) | 24 (5.7%) |
| 75 Years and over | 25 (24.0%) | 52 (22.7%) |
Disability Class: Cognitive Difficulty
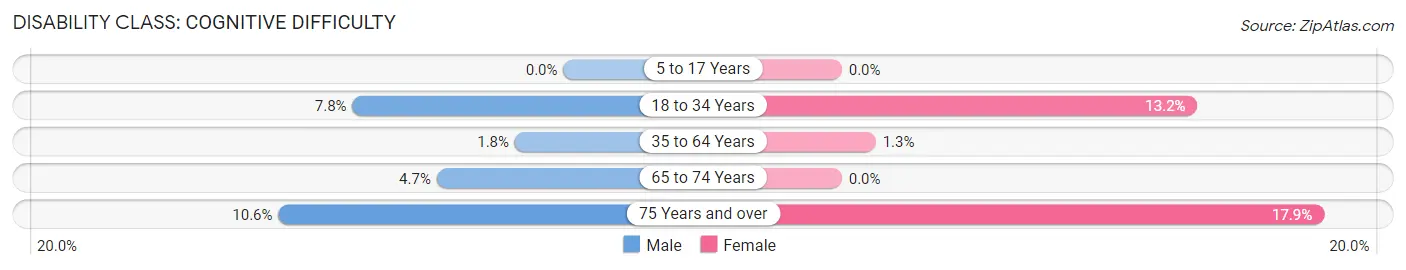
| Age Bracket | Male | Female |
| 5 to 17 Years | 0 (0.0%) | 0 (0.0%) |
| 18 to 34 Years | 39 (7.8%) | 40 (13.2%) |
| 35 to 64 Years | 16 (1.8%) | 12 (1.3%) |
| 65 to 74 Years | 19 (4.7%) | 0 (0.0%) |
| 75 Years and over | 11 (10.6%) | 41 (17.9%) |
Disability Class: Ambulatory Difficulty
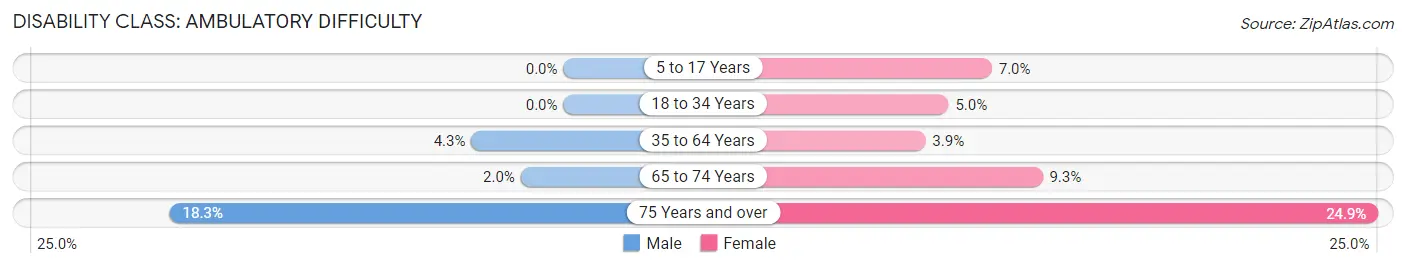
| Age Bracket | Male | Female |
| 5 to 17 Years | 0 (0.0%) | 11 (7.0%) |
| 18 to 34 Years | 0 (0.0%) | 15 (5.0%) |
| 35 to 64 Years | 38 (4.3%) | 37 (3.9%) |
| 65 to 74 Years | 8 (2.0%) | 39 (9.3%) |
| 75 Years and over | 19 (18.3%) | 57 (24.9%) |
Disability Class: Self-Care Difficulty
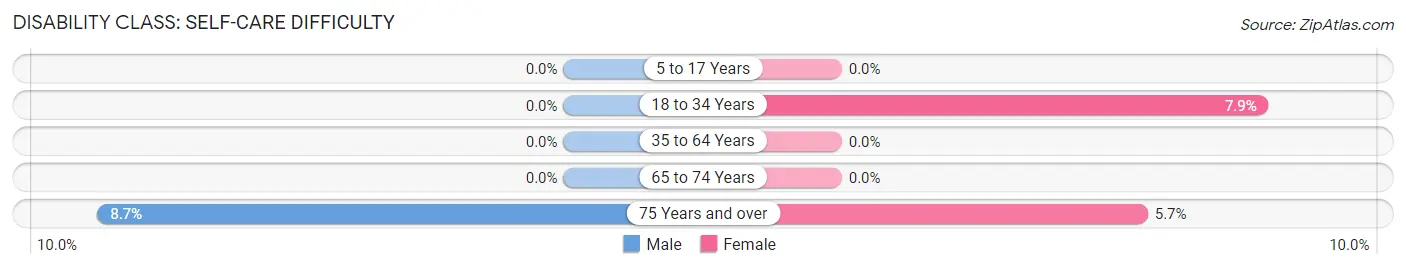
| Age Bracket | Male | Female |
| 5 to 17 Years | 0 (0.0%) | 0 (0.0%) |
| 18 to 34 Years | 0 (0.0%) | 24 (7.9%) |
| 35 to 64 Years | 0 (0.0%) | 0 (0.0%) |
| 65 to 74 Years | 0 (0.0%) | 0 (0.0%) |
| 75 Years and over | 9 (8.6%) | 13 (5.7%) |
Technology Access in Louisville
Computing Device Access in Louisville
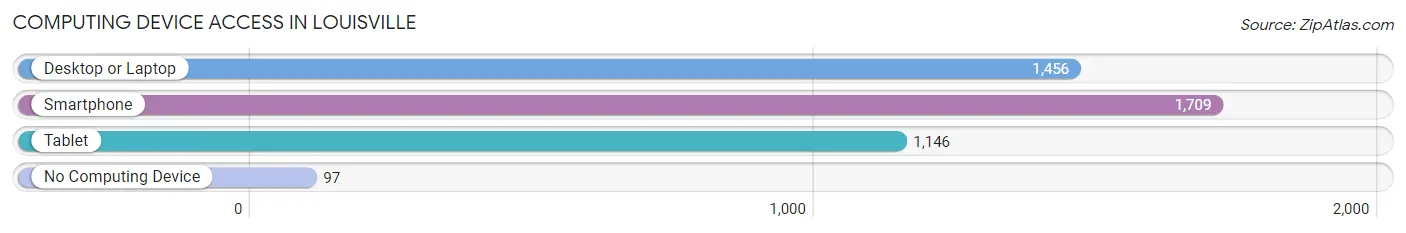
| Device Type | # Households | % Households |
| Desktop or Laptop | 1,456 | 77.1% |
| Smartphone | 1,709 | 90.5% |
| Tablet | 1,146 | 60.7% |
| No Computing Device | 97 | 5.1% |
| Total | 1,889 | 100.0% |
Internet Access in Louisville
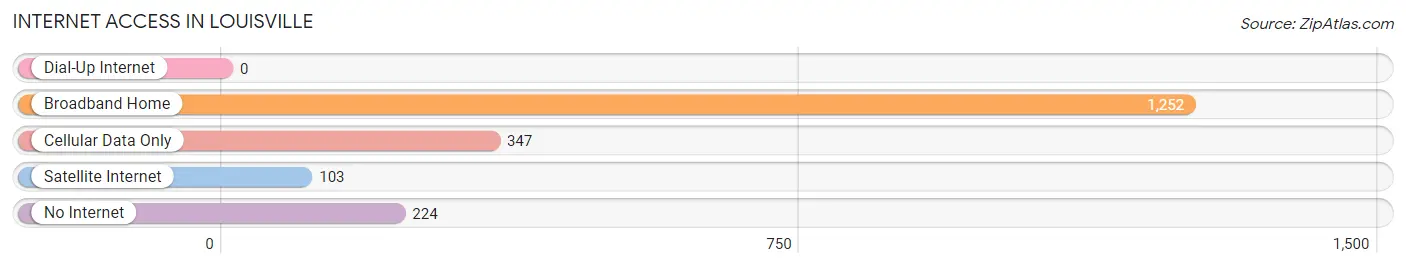
| Internet Type | # Households | % Households |
| Dial-Up Internet | 0 | 0.0% |
| Broadband Home | 1,252 | 66.3% |
| Cellular Data Only | 347 | 18.4% |
| Satellite Internet | 103 | 5.4% |
| No Internet | 224 | 11.9% |
| Total | 1,889 | 100.0% |
Louisville Summary
Louisville, Tennessee is a small town located in Blount County, Tennessee. It is situated in the foothills of the Great Smoky Mountains, and is part of the Knoxville Metropolitan Statistical Area. The town has a population of approximately 1,000 people, and is known for its rural charm and friendly atmosphere.
History
The area that is now Louisville was first settled in the late 1700s by a group of settlers from North Carolina. The town was originally known as “Mud Creek”, and was later renamed “Louisville” in honor of the French King Louis XVI. The town was officially incorporated in 1819, and was the first town in Blount County.
In the early 1800s, Louisville was a thriving agricultural community, with many of the town’s residents working in the local cotton and tobacco industries. The town was also home to several mills, including a grist mill, a saw mill, and a cotton gin.
In the late 1800s, Louisville began to experience a period of growth and prosperity. The town was home to several businesses, including a bank, a hotel, and a newspaper. The town also had a railroad station, which connected Louisville to the larger cities of Knoxville and Chattanooga.
Geography
Louisville is located in the foothills of the Great Smoky Mountains, and is situated in the eastern part of Blount County. The town is located at the intersection of US Highway 411 and State Route 33. The town is surrounded by several small towns and villages, including Walland, Townsend, and Maryville.
The town is situated at an elevation of 1,000 feet, and is located in a temperate climate zone. The average temperature in Louisville is around 70 degrees Fahrenheit in the summer and 40 degrees Fahrenheit in the winter. The town receives an average of 45 inches of rain per year, and is known for its mild winters and hot summers.
Economy
The economy of Louisville is largely based on agriculture and tourism. The town is home to several farms, which produce a variety of crops, including corn, soybeans, and tobacco. The town is also home to several small businesses, including restaurants, shops, and a local newspaper.
The town is also a popular tourist destination, and is home to several attractions, including the Great Smoky Mountains National Park, the Appalachian Trail, and the historic Louisville-Blount County Museum. The town is also home to several festivals and events, including the annual Louisville Music Festival and the Louisville Fall Festival.
Demographics
As of the 2010 census, the population of Louisville was 1,000 people. The town is predominantly white, with approximately 95% of the population identifying as Caucasian. The town also has a small African American population, with approximately 4% of the population identifying as African American. The town also has a small Hispanic population, with approximately 1% of the population identifying as Hispanic or Latino.
The median household income in Louisville is approximately $35,000, and the median home value is approximately $150,000. The town has a low unemployment rate, with approximately 4% of the population unemployed. The town also has a low poverty rate, with approximately 8% of the population living below the poverty line.
Common Questions
What is Per Capita Income in Louisville?
Per Capita income in Louisville is $60,428.
What is the Median Family Income in Louisville?
Median Family Income in Louisville is $101,818.
What is the Median Household income in Louisville?
Median Household Income in Louisville is $80,307.
What is Income or Wage Gap in Louisville?
Income or Wage Gap in Louisville is 17.5%.
Women in Louisville earn 82.5 cents for every dollar earned by a man.
What is Inequality or Gini Index in Louisville?
Inequality or Gini Index in Louisville is 0.52.
What is the Total Population of Louisville?
Total Population of Louisville is 4,359.
What is the Total Male Population of Louisville?
Total Male Population of Louisville is 2,197.
What is the Total Female Population of Louisville?
Total Female Population of Louisville is 2,162.
What is the Ratio of Males per 100 Females in Louisville?
There are 101.62 Males per 100 Females in Louisville.
What is the Ratio of Females per 100 Males in Louisville?
There are 98.41 Females per 100 Males in Louisville.
What is the Median Population Age in Louisville?
Median Population Age in Louisville is 51.9 Years.
What is the Average Family Size in Louisville
Average Family Size in Louisville is 2.6 People.
What is the Average Household Size in Louisville
Average Household Size in Louisville is 2.3 People.
How Large is the Labor Force in Louisville?
There are 2,298 People in the Labor Forcein in Louisville.
What is the Percentage of People in the Labor Force in Louisville?
59.7% of People are in the Labor Force in Louisville.
What is the Unemployment Rate in Louisville?
Unemployment Rate in Louisville is 4.5%.