Rockwood, TN Map & Demographics
Rockwood Map
Rockwood Overview
$28,667
PER CAPITA INCOME
$59,318
AVG FAMILY INCOME
$43,309
AVG HOUSEHOLD INCOME
54.8%
WAGE / INCOME GAP [ % ]
45.2¢/ $1
WAGE / INCOME GAP [ $ ]
0.54
INEQUALITY / GINI INDEX
5,468
TOTAL POPULATION
2,510
MALE POPULATION
2,958
FEMALE POPULATION
84.85
MALES / 100 FEMALES
117.85
FEMALES / 100 MALES
45.5
MEDIAN AGE
3.0
AVG FAMILY SIZE
2.3
AVG HOUSEHOLD SIZE
2,178
LABOR FORCE [ PEOPLE ]
47.8%
PERCENT IN LABOR FORCE
7.6%
UNEMPLOYMENT RATE
Rockwood Zip Codes
Rockwood Area Codes
Income in Rockwood
Income Overview in Rockwood
Per Capita Income in Rockwood is $28,667, while median incomes of families and households are $59,318 and $43,309 respectively.
| Characteristic | Number | Measure |
| Per Capita Income | 5,468 | $28,667 |
| Median Family Income | 1,344 | $59,318 |
| Mean Family Income | 1,344 | $91,008 |
| Median Household Income | 2,239 | $43,309 |
| Mean Household Income | 2,239 | $68,029 |
| Income Deficit | 1,344 | $0 |
| Wage / Income Gap (%) | 5,468 | 54.82% |
| Wage / Income Gap ($) | 5,468 | 45.18¢ per $1 |
| Gini / Inequality Index | 5,468 | 0.54 |
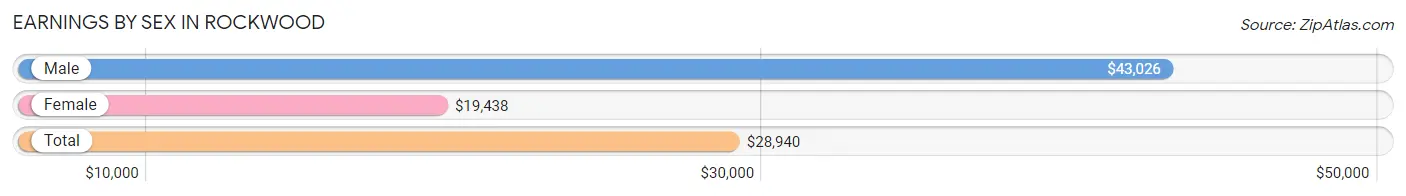
Earnings by Sex in Rockwood
Average Earnings in Rockwood are $28,940, $43,026 for men and $19,438 for women, a difference of 54.8%.
| Sex | Number | Average Earnings |
| Male | 1,092 (49.0%) | $43,026 |
| Female | 1,135 (51.0%) | $19,438 |
| Total | 2,227 (100.0%) | $28,940 |
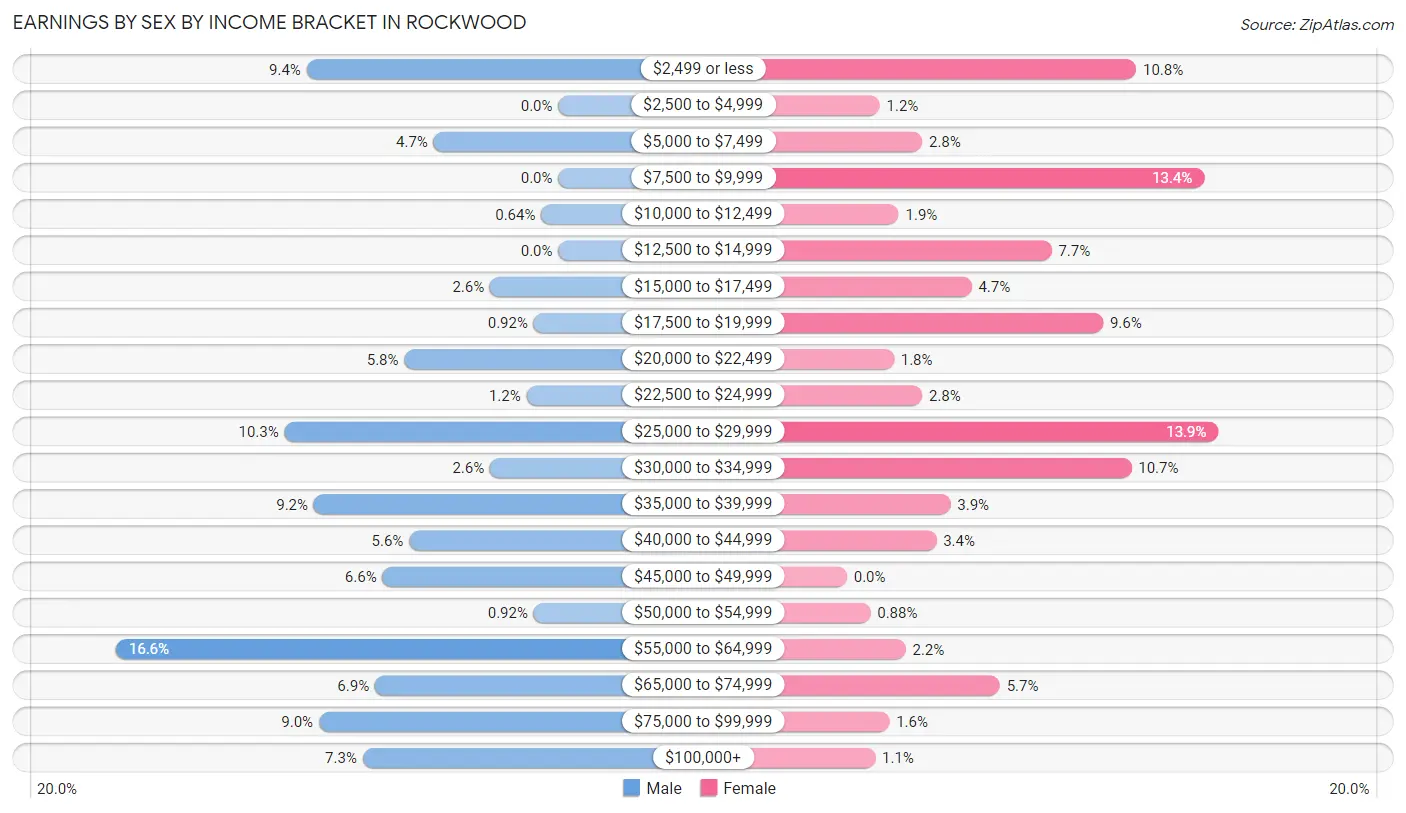
Earnings by Sex by Income Bracket in Rockwood
The most common earnings brackets in Rockwood are $55,000 to $64,999 for men (181 | 16.6%) and $25,000 to $29,999 for women (158 | 13.9%).
| Income | Male | Female |
| $2,499 or less | 103 (9.4%) | 123 (10.8%) |
| $2,500 to $4,999 | 0 (0.0%) | 14 (1.2%) |
| $5,000 to $7,499 | 51 (4.7%) | 32 (2.8%) |
| $7,500 to $9,999 | 0 (0.0%) | 152 (13.4%) |
| $10,000 to $12,499 | 7 (0.6%) | 22 (1.9%) |
| $12,500 to $14,999 | 0 (0.0%) | 87 (7.7%) |
| $15,000 to $17,499 | 28 (2.6%) | 53 (4.7%) |
| $17,500 to $19,999 | 10 (0.9%) | 109 (9.6%) |
| $20,000 to $22,499 | 63 (5.8%) | 20 (1.8%) |
| $22,500 to $24,999 | 13 (1.2%) | 32 (2.8%) |
| $25,000 to $29,999 | 112 (10.3%) | 158 (13.9%) |
| $30,000 to $34,999 | 28 (2.6%) | 121 (10.7%) |
| $35,000 to $39,999 | 100 (9.2%) | 44 (3.9%) |
| $40,000 to $44,999 | 61 (5.6%) | 38 (3.4%) |
| $45,000 to $49,999 | 72 (6.6%) | 0 (0.0%) |
| $50,000 to $54,999 | 10 (0.9%) | 10 (0.9%) |
| $55,000 to $64,999 | 181 (16.6%) | 25 (2.2%) |
| $65,000 to $74,999 | 75 (6.9%) | 65 (5.7%) |
| $75,000 to $99,999 | 98 (9.0%) | 18 (1.6%) |
| $100,000+ | 80 (7.3%) | 12 (1.1%) |
| Total | 1,092 (100.0%) | 1,135 (100.0%) |
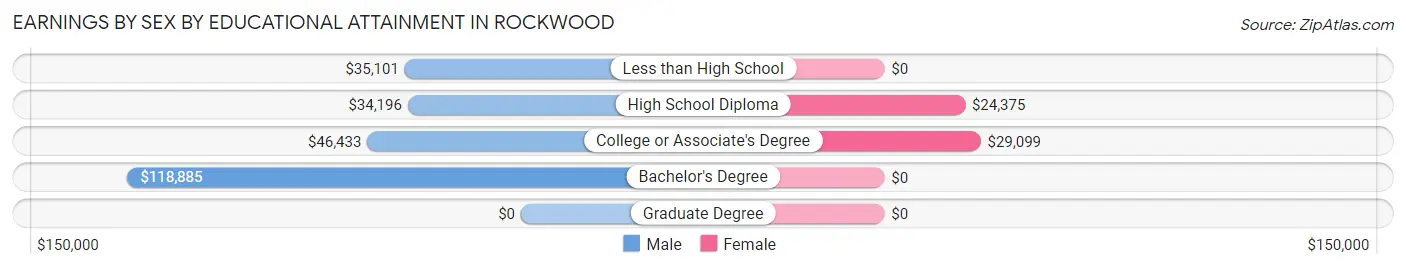
Earnings by Sex by Educational Attainment in Rockwood
Average earnings in Rockwood are $45,000 for men and $25,519 for women, a difference of 43.3%. Men with an educational attainment of bachelor's degree enjoy the highest average annual earnings of $118,885, while those with high school diploma education earn the least with $34,196. Women with an educational attainment of college or associate's degree earn the most with the average annual earnings of $29,099, while those with high school diploma education have the smallest earnings of $24,375.
| Educational Attainment | Male Income | Female Income |
| Less than High School | $35,101 | $0 |
| High School Diploma | $34,196 | $24,375 |
| College or Associate's Degree | $46,433 | $29,099 |
| Bachelor's Degree | $118,885 | $0 |
| Graduate Degree | - | - |
| Total | $45,000 | $25,519 |
Family Income in Rockwood
Family Income Brackets in Rockwood
According to the Rockwood family income data, there are 250 families falling into the $50,000 to $74,999 income range, which is the most common income bracket and makes up 18.6% of all families.
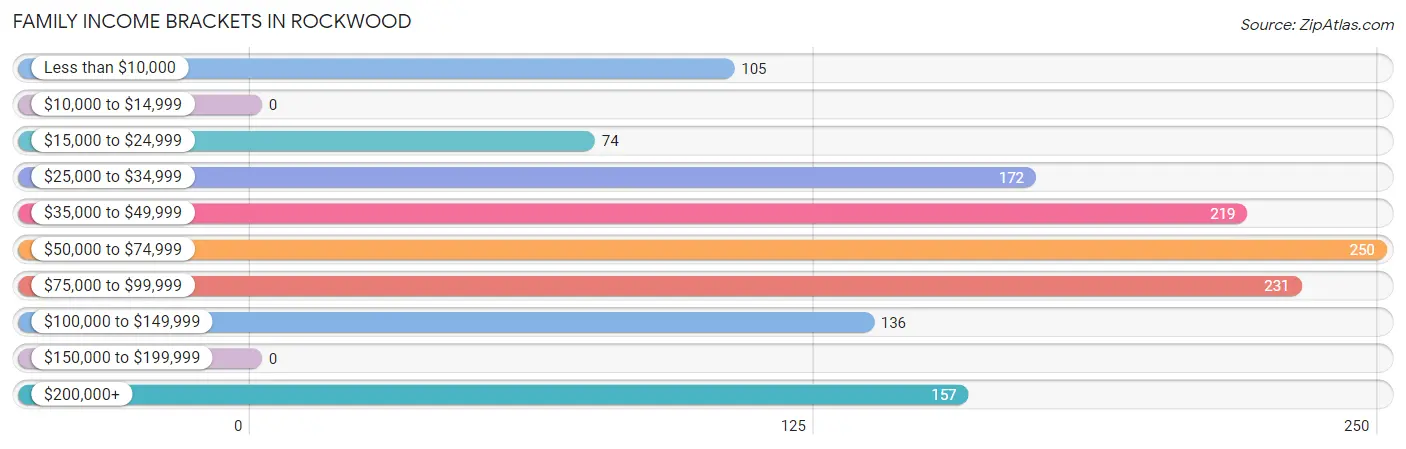
| Income Bracket | # Families | % Families |
| Less than $10,000 | 105 | 7.8% |
| $10,000 to $14,999 | 0 | 0.0% |
| $15,000 to $24,999 | 74 | 5.5% |
| $25,000 to $34,999 | 172 | 12.8% |
| $35,000 to $49,999 | 219 | 16.3% |
| $50,000 to $74,999 | 250 | 18.6% |
| $75,000 to $99,999 | 231 | 17.2% |
| $100,000 to $149,999 | 136 | 10.1% |
| $150,000 to $199,999 | 0 | 0.0% |
| $200,000+ | 157 | 11.7% |
Family Income by Famaliy Size in Rockwood
3-person families (286 | 21.3%) account for the highest median family income in Rockwood with $86,458 per family, while 3-person families (286 | 21.3%) have the highest median income of $28,819 per family member.
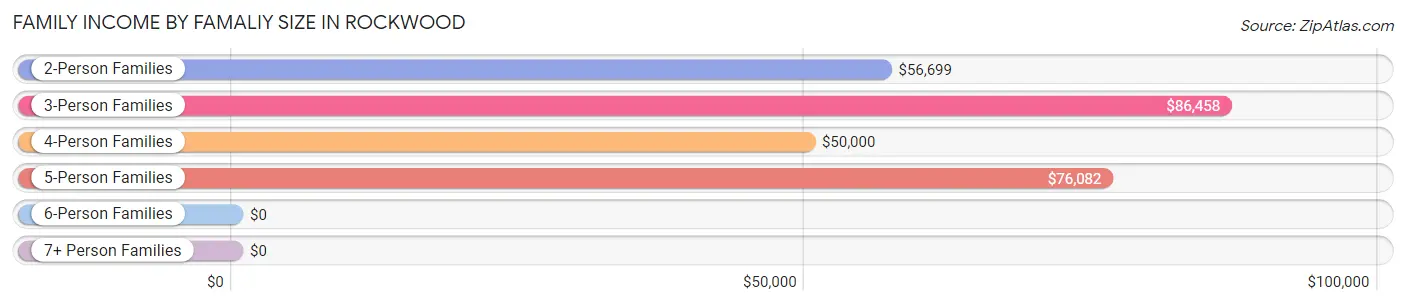
| Income Bracket | # Families | Median Income |
| 2-Person Families | 729 (54.2%) | $56,699 |
| 3-Person Families | 286 (21.3%) | $86,458 |
| 4-Person Families | 228 (17.0%) | $50,000 |
| 5-Person Families | 91 (6.8%) | $76,082 |
| 6-Person Families | 0 (0.0%) | $0 |
| 7+ Person Families | 10 (0.7%) | $0 |
| Total | 1,344 (100.0%) | $59,318 |
Family Income by Number of Earners in Rockwood
The median family income in Rockwood is $59,318, with families comprising 3+ earners (82) having the highest median family income of $129,750, while families with no earners (270) have the lowest median family income of $29,167, accounting for 6.1% and 20.1% of families, respectively.
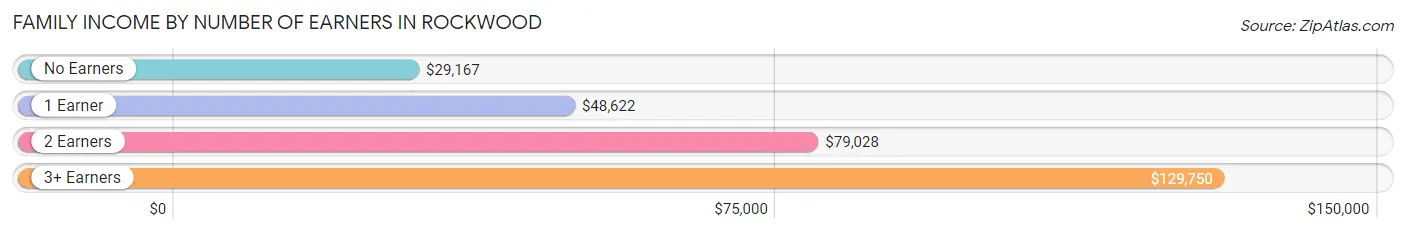
| Number of Earners | # Families | Median Income |
| No Earners | 270 (20.1%) | $29,167 |
| 1 Earner | 550 (40.9%) | $48,622 |
| 2 Earners | 442 (32.9%) | $79,028 |
| 3+ Earners | 82 (6.1%) | $129,750 |
| Total | 1,344 (100.0%) | $59,318 |
Household Income in Rockwood
Household Income Brackets in Rockwood
With 376 households falling in the category, the $50,000 to $74,999 income range is the most frequent in Rockwood, accounting for 16.8% of all households.
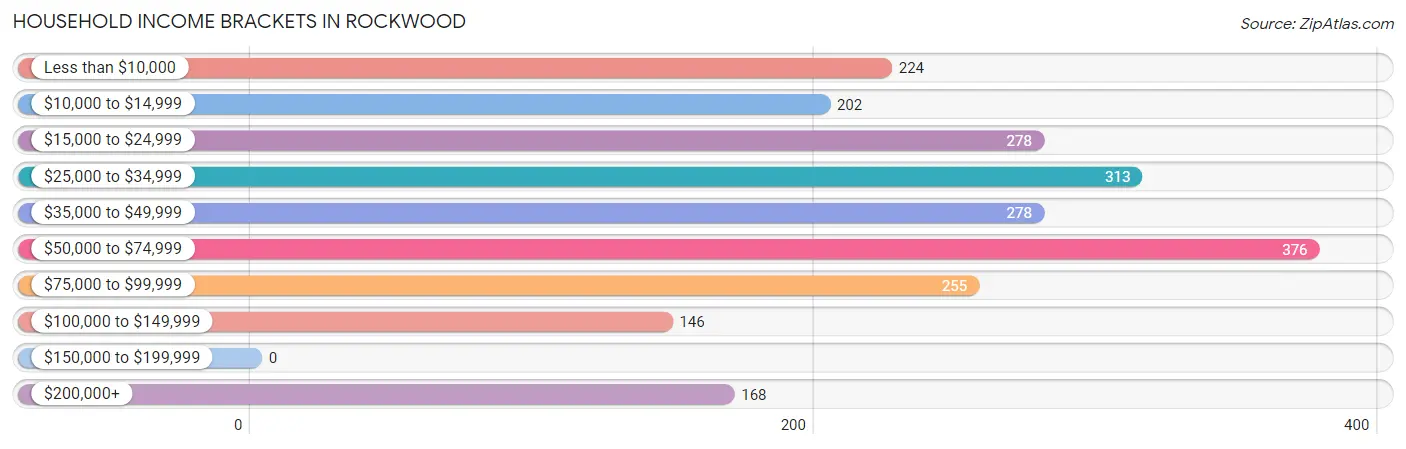
| Income Bracket | # Households | % Households |
| Less than $10,000 | 224 | 10.0% |
| $10,000 to $14,999 | 202 | 9.0% |
| $15,000 to $24,999 | 278 | 12.4% |
| $25,000 to $34,999 | 313 | 14.0% |
| $35,000 to $49,999 | 278 | 12.4% |
| $50,000 to $74,999 | 376 | 16.8% |
| $75,000 to $99,999 | 255 | 11.4% |
| $100,000 to $149,999 | 146 | 6.5% |
| $150,000 to $199,999 | 0 | 0.0% |
| $200,000+ | 168 | 7.5% |
Household Income by Householder Age in Rockwood
The median household income in Rockwood is $43,309, with the highest median household income of $66,622 found in the 25 to 44 years age bracket for the primary householder. A total of 611 households (27.3%) fall into this category. Meanwhile, the 15 to 24 years age bracket for the primary householder has the lowest median household income of $0, with 14 households (0.6%) in this group.
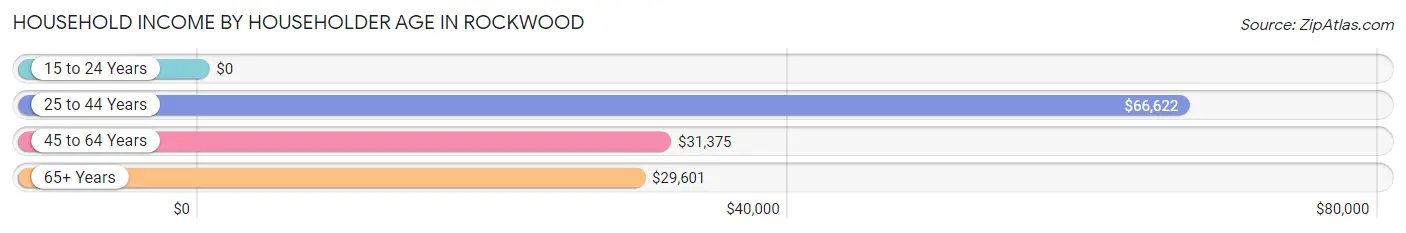
| Income Bracket | # Households | Median Income |
| 15 to 24 Years | 14 (0.6%) | $0 |
| 25 to 44 Years | 611 (27.3%) | $66,622 |
| 45 to 64 Years | 834 (37.2%) | $31,375 |
| 65+ Years | 780 (34.8%) | $29,601 |
| Total | 2,239 (100.0%) | $43,309 |
Poverty in Rockwood
Income Below Poverty by Sex and Age in Rockwood
With 12.2% poverty level for males and 22.6% for females among the residents of Rockwood, 18 to 24 year old males and 18 to 24 year old females are the most vulnerable to poverty, with 48 males (42.1%) and 102 females (40.0%) in their respective age groups living below the poverty level.
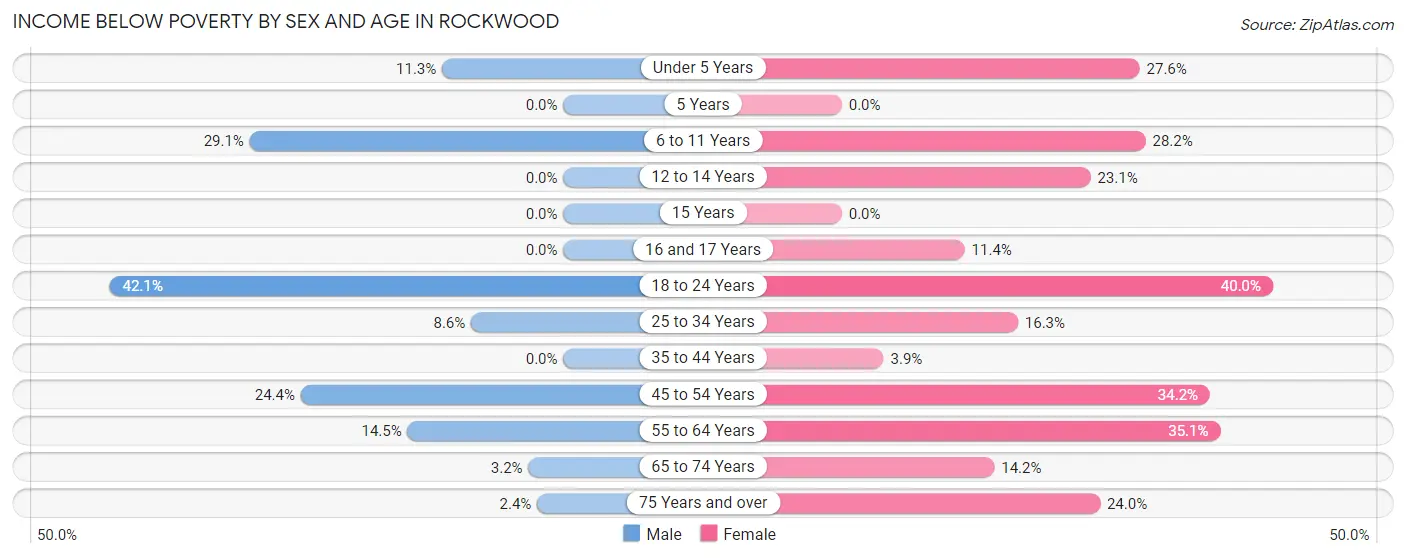
| Age Bracket | Male | Female |
| Under 5 Years | 27 (11.3%) | 34 (27.6%) |
| 5 Years | 0 (0.0%) | 0 (0.0%) |
| 6 to 11 Years | 23 (29.1%) | 42 (28.2%) |
| 12 to 14 Years | 0 (0.0%) | 18 (23.1%) |
| 15 Years | 0 (0.0%) | 0 (0.0%) |
| 16 and 17 Years | 0 (0.0%) | 13 (11.4%) |
| 18 to 24 Years | 48 (42.1%) | 102 (40.0%) |
| 25 to 34 Years | 32 (8.6%) | 42 (16.3%) |
| 35 to 44 Years | 0 (0.0%) | 10 (3.9%) |
| 45 to 54 Years | 107 (24.4%) | 137 (34.2%) |
| 55 to 64 Years | 48 (14.5%) | 118 (35.1%) |
| 65 to 74 Years | 6 (3.2%) | 61 (14.1%) |
| 75 Years and over | 5 (2.4%) | 75 (24.0%) |
| Total | 296 (12.2%) | 652 (22.6%) |
Income Above Poverty by Sex and Age in Rockwood
According to the poverty statistics in Rockwood, males aged 12 to 14 years and females aged 5 years are the age groups that are most secure financially, with 100.0% of males and 100.0% of females in these age groups living above the poverty line.
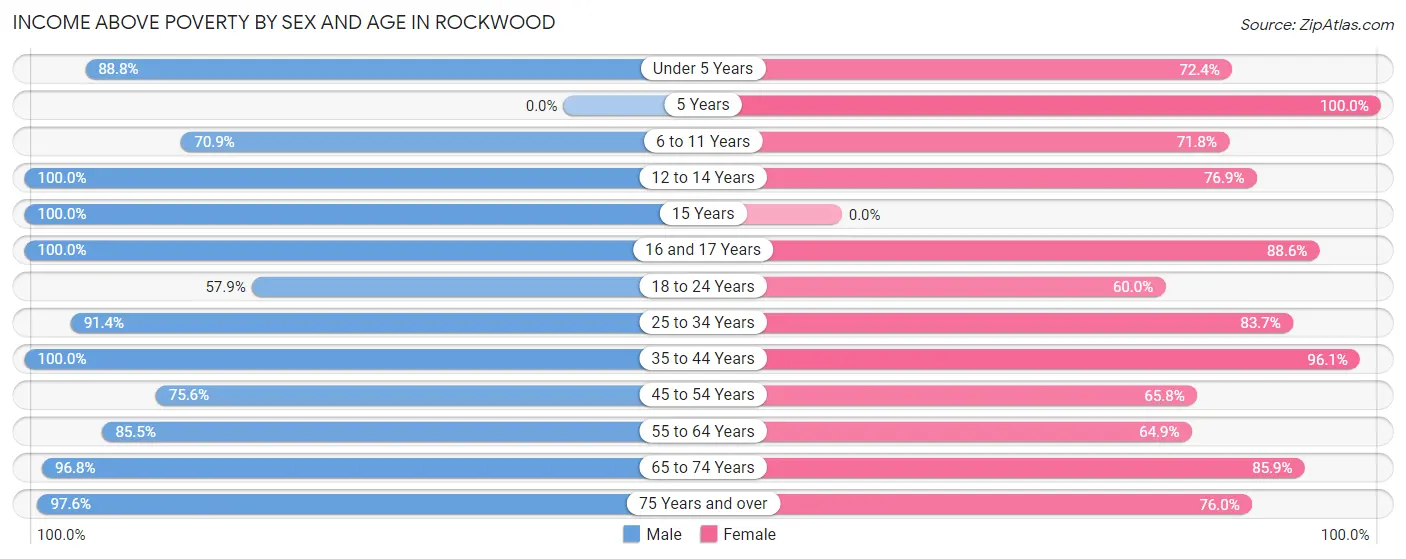
| Age Bracket | Male | Female |
| Under 5 Years | 213 (88.7%) | 89 (72.4%) |
| 5 Years | 0 (0.0%) | 175 (100.0%) |
| 6 to 11 Years | 56 (70.9%) | 107 (71.8%) |
| 12 to 14 Years | 45 (100.0%) | 60 (76.9%) |
| 15 Years | 22 (100.0%) | 0 (0.0%) |
| 16 and 17 Years | 202 (100.0%) | 101 (88.6%) |
| 18 to 24 Years | 66 (57.9%) | 153 (60.0%) |
| 25 to 34 Years | 342 (91.4%) | 215 (83.7%) |
| 35 to 44 Years | 193 (100.0%) | 248 (96.1%) |
| 45 to 54 Years | 332 (75.6%) | 264 (65.8%) |
| 55 to 64 Years | 284 (85.5%) | 218 (64.9%) |
| 65 to 74 Years | 179 (96.8%) | 370 (85.9%) |
| 75 Years and over | 201 (97.6%) | 238 (76.0%) |
| Total | 2,135 (87.8%) | 2,238 (77.4%) |
Income Below Poverty Among Married-Couple Families in Rockwood
The poverty statistics for married-couple families in Rockwood show that 5.0% or 47 of the total 939 families live below the poverty line. Families with 5 or more children have the highest poverty rate of 100.0%, comprising of 10 families. On the other hand, families with 3 or 4 children have the lowest poverty rate of 0.0%, which includes 0 families.
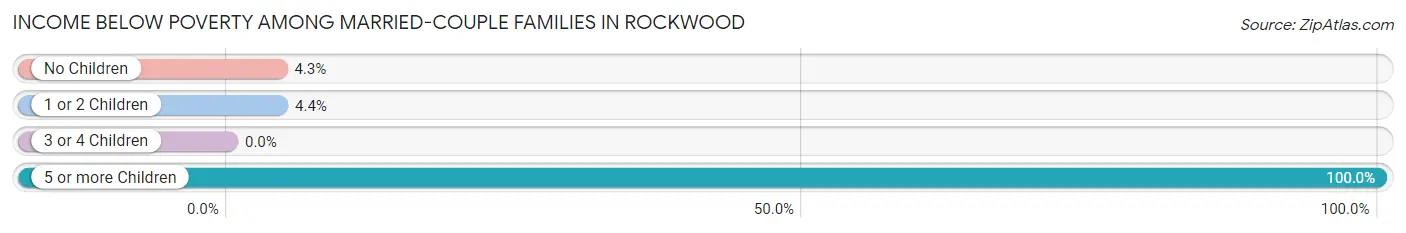
| Children | Above Poverty | Below Poverty |
| No Children | 488 (95.7%) | 22 (4.3%) |
| 1 or 2 Children | 329 (95.6%) | 15 (4.4%) |
| 3 or 4 Children | 75 (100.0%) | 0 (0.0%) |
| 5 or more Children | 0 (0.0%) | 10 (100.0%) |
| Total | 892 (95.0%) | 47 (5.0%) |
Income Below Poverty Among Single-Parent Households in Rockwood
According to the poverty data in Rockwood, 15.4% or 24 single-father households and 28.1% or 70 single-mother households are living below the poverty line. Among single-father households, those with no children have the highest poverty rate, with 6 households (24.0%) experiencing poverty. Likewise, among single-mother households, those with 1 or 2 children have the highest poverty rate, with 61 households (54.0%) falling below the poverty line.
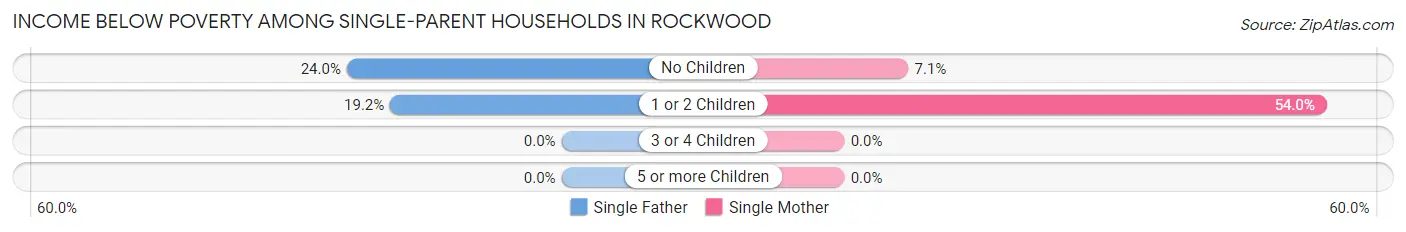
| Children | Single Father | Single Mother |
| No Children | 6 (24.0%) | 9 (7.1%) |
| 1 or 2 Children | 18 (19.2%) | 61 (54.0%) |
| 3 or 4 Children | 0 (0.0%) | 0 (0.0%) |
| 5 or more Children | 0 (0.0%) | 0 (0.0%) |
| Total | 24 (15.4%) | 70 (28.1%) |
Income Below Poverty Among Married-Couple vs Single-Parent Households in Rockwood
The poverty data for Rockwood shows that 47 of the married-couple family households (5.0%) and 94 of the single-parent households (23.2%) are living below the poverty level. Within the married-couple family households, those with 5 or more children have the highest poverty rate, with 10 households (100.0%) falling below the poverty line. Among the single-parent households, those with 1 or 2 children have the highest poverty rate, with 79 household (38.2%) living below poverty.
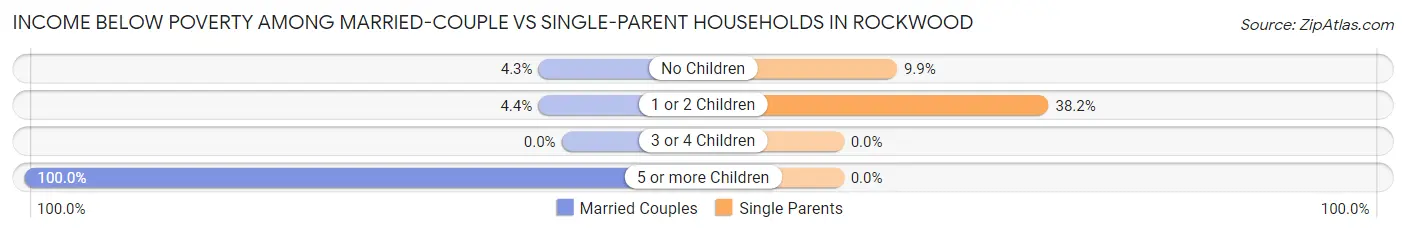
| Children | Married-Couple Families | Single-Parent Households |
| No Children | 22 (4.3%) | 15 (9.9%) |
| 1 or 2 Children | 15 (4.4%) | 79 (38.2%) |
| 3 or 4 Children | 0 (0.0%) | 0 (0.0%) |
| 5 or more Children | 10 (100.0%) | 0 (0.0%) |
| Total | 47 (5.0%) | 94 (23.2%) |
Race in Rockwood
The most populous races in Rockwood are White / Caucasian (5,034 | 92.1%), Two or more Races (262 | 4.8%), and Hispanic or Latino (65 | 1.2%).
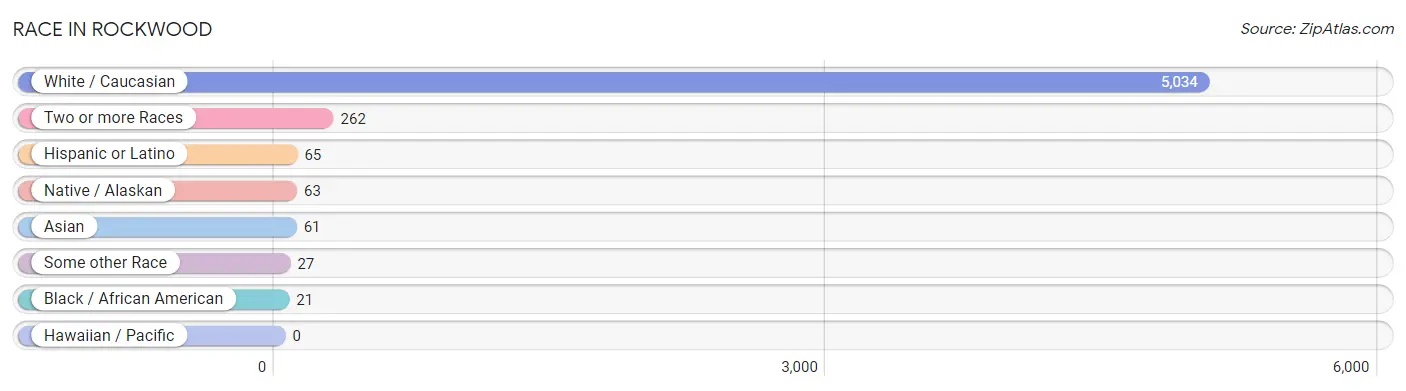
| Race | # Population | % Population |
| Asian | 61 | 1.1% |
| Black / African American | 21 | 0.4% |
| Hawaiian / Pacific | 0 | 0.0% |
| Hispanic or Latino | 65 | 1.2% |
| Native / Alaskan | 63 | 1.1% |
| White / Caucasian | 5,034 | 92.1% |
| Two or more Races | 262 | 4.8% |
| Some other Race | 27 | 0.5% |
| Total | 5,468 | 100.0% |
Ancestry in Rockwood
The most populous ancestries reported in Rockwood are English (801 | 14.6%), American (760 | 13.9%), Irish (709 | 13.0%), German (539 | 9.9%), and Scotch-Irish (211 | 3.9%), together accounting for 55.2% of all Rockwood residents.
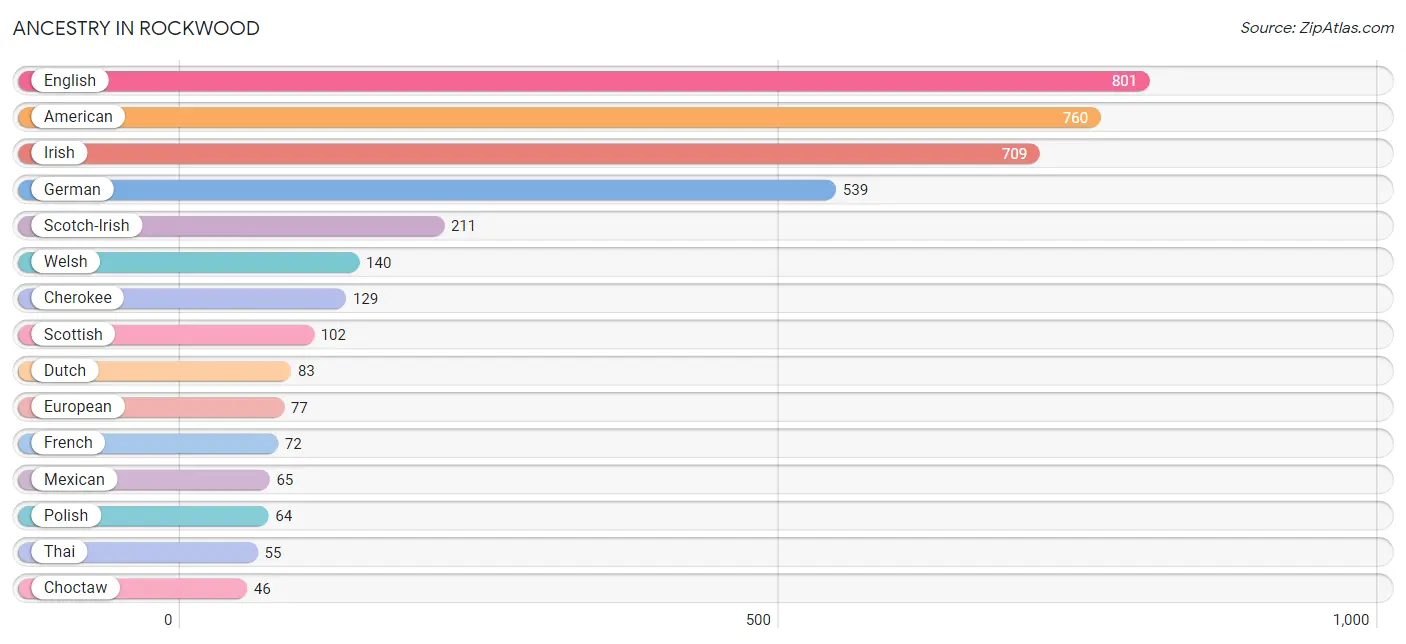
| Ancestry | # Population | % Population |
| American | 760 | 13.9% |
| Bhutanese | 45 | 0.8% |
| Cherokee | 129 | 2.4% |
| Choctaw | 46 | 0.8% |
| Dutch | 83 | 1.5% |
| Eastern European | 16 | 0.3% |
| English | 801 | 14.6% |
| European | 77 | 1.4% |
| Finnish | 9 | 0.2% |
| French | 72 | 1.3% |
| French Canadian | 27 | 0.5% |
| German | 539 | 9.9% |
| Irish | 709 | 13.0% |
| Italian | 10 | 0.2% |
| Mexican | 65 | 1.2% |
| Norwegian | 35 | 0.6% |
| Polish | 64 | 1.2% |
| Scotch-Irish | 211 | 3.9% |
| Scottish | 102 | 1.9% |
| Thai | 55 | 1.0% |
| Welsh | 140 | 2.6% | View All 21 Rows |
Immigrants in Rockwood
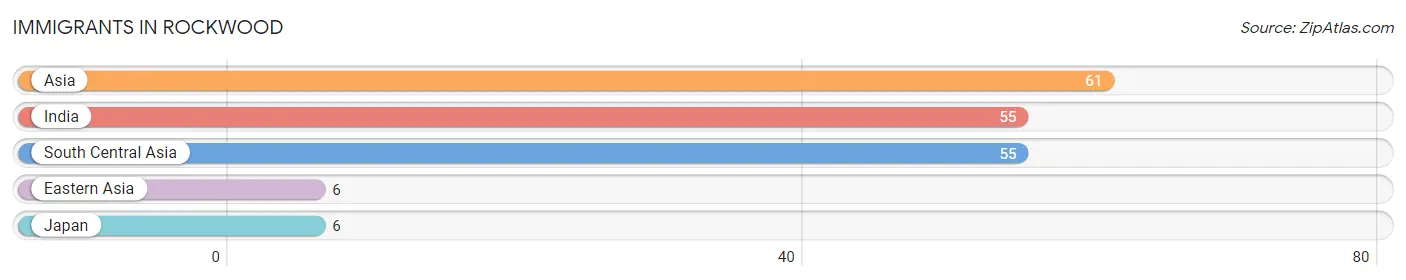
The most numerous immigrant groups reported in Rockwood came from Asia (61 | 1.1%), India (55 | 1.0%), South Central Asia (55 | 1.0%), Eastern Asia (6 | 0.1%), and Japan (6 | 0.1%), together accounting for 3.4% of all Rockwood residents.
| Immigration Origin | # Population | % Population |
| Asia | 61 | 1.1% |
| Eastern Asia | 6 | 0.1% |
| India | 55 | 1.0% |
| Japan | 6 | 0.1% |
| South Central Asia | 55 | 1.0% | View All 5 Rows |
Sex and Age in Rockwood
Sex and Age in Rockwood
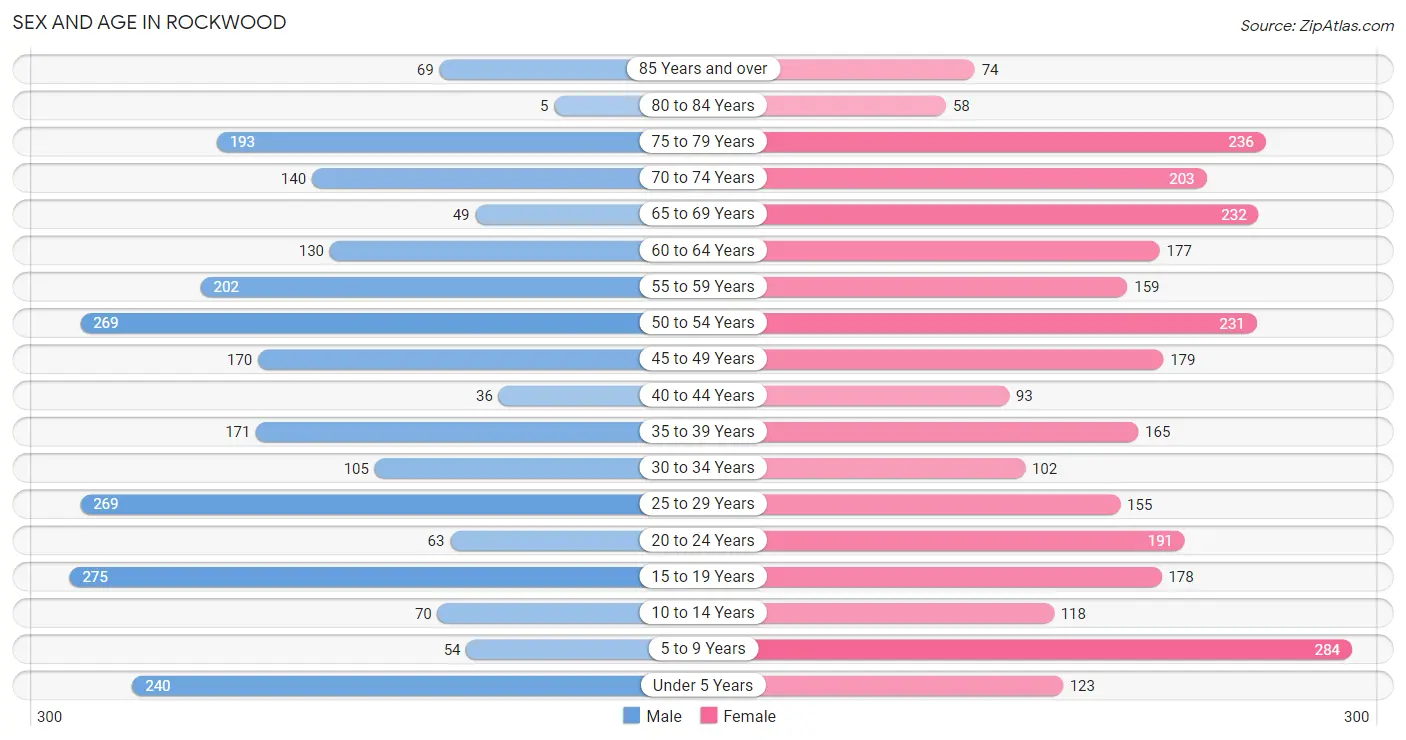
The most populous age groups in Rockwood are 15 to 19 Years (275 | 11.0%) for men and 5 to 9 Years (284 | 9.6%) for women.
| Age Bracket | Male | Female |
| Under 5 Years | 240 (9.6%) | 123 (4.2%) |
| 5 to 9 Years | 54 (2.1%) | 284 (9.6%) |
| 10 to 14 Years | 70 (2.8%) | 118 (4.0%) |
| 15 to 19 Years | 275 (11.0%) | 178 (6.0%) |
| 20 to 24 Years | 63 (2.5%) | 191 (6.5%) |
| 25 to 29 Years | 269 (10.7%) | 155 (5.2%) |
| 30 to 34 Years | 105 (4.2%) | 102 (3.5%) |
| 35 to 39 Years | 171 (6.8%) | 165 (5.6%) |
| 40 to 44 Years | 36 (1.4%) | 93 (3.1%) |
| 45 to 49 Years | 170 (6.8%) | 179 (6.0%) |
| 50 to 54 Years | 269 (10.7%) | 231 (7.8%) |
| 55 to 59 Years | 202 (8.1%) | 159 (5.4%) |
| 60 to 64 Years | 130 (5.2%) | 177 (6.0%) |
| 65 to 69 Years | 49 (1.9%) | 232 (7.8%) |
| 70 to 74 Years | 140 (5.6%) | 203 (6.9%) |
| 75 to 79 Years | 193 (7.7%) | 236 (8.0%) |
| 80 to 84 Years | 5 (0.2%) | 58 (2.0%) |
| 85 Years and over | 69 (2.8%) | 74 (2.5%) |
| Total | 2,510 (100.0%) | 2,958 (100.0%) |
Families and Households in Rockwood
Median Family Size in Rockwood
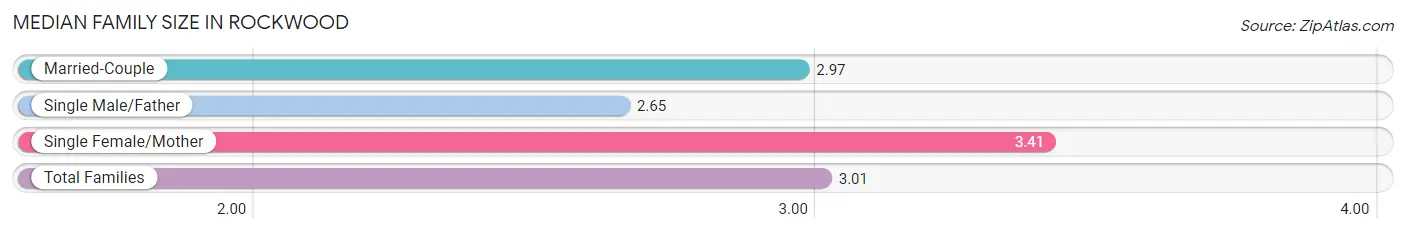
The median family size in Rockwood is 3.01 persons per family, with single female/mother families (249 | 18.5%) accounting for the largest median family size of 3.41 persons per family. On the other hand, single male/father families (156 | 11.6%) represent the smallest median family size with 2.65 persons per family.
| Family Type | # Families | Family Size |
| Married-Couple | 939 (69.9%) | 2.97 |
| Single Male/Father | 156 (11.6%) | 2.65 |
| Single Female/Mother | 249 (18.5%) | 3.41 |
| Total Families | 1,344 (100.0%) | 3.01 |
Median Household Size in Rockwood
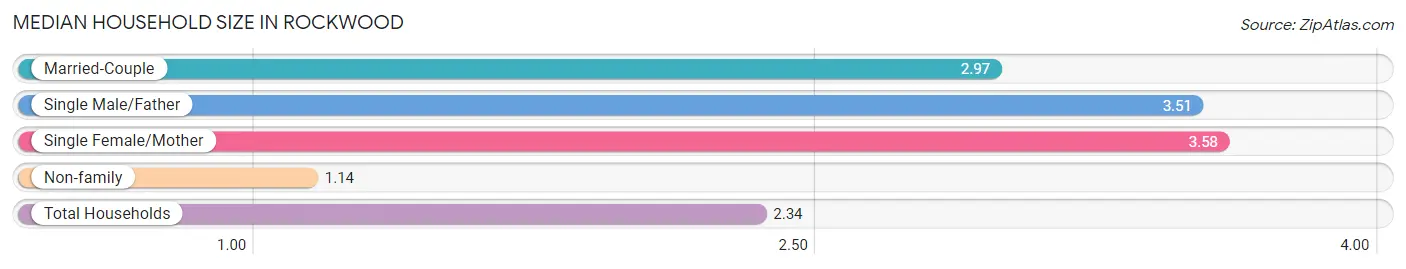
The median household size in Rockwood is 2.34 persons per household, with single female/mother households (249 | 11.1%) accounting for the largest median household size of 3.58 persons per household. non-family households (895 | 40.0%) represent the smallest median household size with 1.14 persons per household.
| Household Type | # Households | Household Size |
| Married-Couple | 939 (41.9%) | 2.97 |
| Single Male/Father | 156 (7.0%) | 3.51 |
| Single Female/Mother | 249 (11.1%) | 3.58 |
| Non-family | 895 (40.0%) | 1.14 |
| Total Households | 2,239 (100.0%) | 2.34 |
Household Size by Marriage Status in Rockwood
Out of a total of 2,239 households in Rockwood, 1,344 (60.0%) are family households, while 895 (40.0%) are nonfamily households. The most numerous type of family households are 2-person households, comprising 629, and the most common type of nonfamily households are 1-person households, comprising 780.
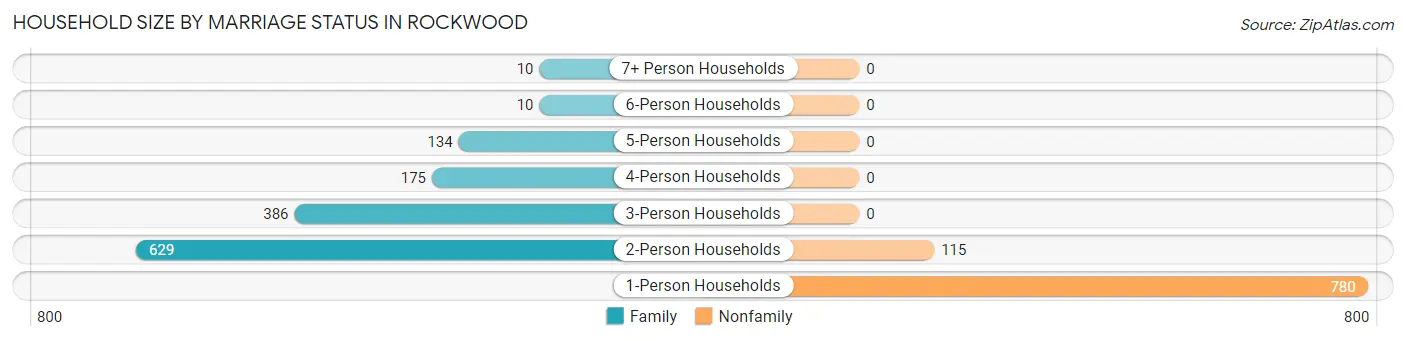
| Household Size | Family Households | Nonfamily Households |
| 1-Person Households | - | 780 (34.8%) |
| 2-Person Households | 629 (28.1%) | 115 (5.1%) |
| 3-Person Households | 386 (17.2%) | 0 (0.0%) |
| 4-Person Households | 175 (7.8%) | 0 (0.0%) |
| 5-Person Households | 134 (6.0%) | 0 (0.0%) |
| 6-Person Households | 10 (0.4%) | 0 (0.0%) |
| 7+ Person Households | 10 (0.4%) | 0 (0.0%) |
| Total | 1,344 (60.0%) | 895 (40.0%) |
Female Fertility in Rockwood
Fertility by Age in Rockwood
Average fertility rate in Rockwood is 40.0 births per 1,000 women. Women in the age bracket of 20 to 34 years have the highest fertility rate with 78.0 births per 1,000 women. Women in the age bracket of 20 to 34 years acount for 77.8% of all women with births.
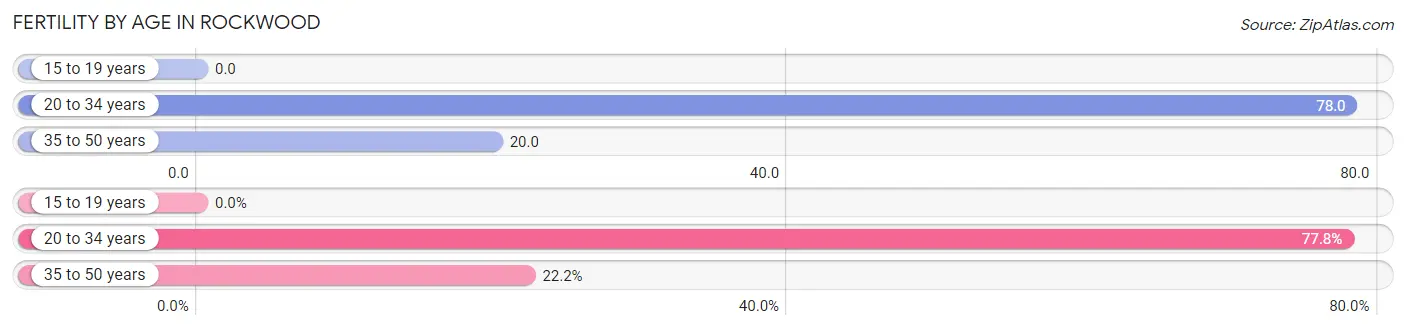
| Age Bracket | Women with Births | Births / 1,000 Women |
| 15 to 19 years | 0 (0.0%) | 0.0 |
| 20 to 34 years | 35 (77.8%) | 78.0 |
| 35 to 50 years | 10 (22.2%) | 20.0 |
| Total | 45 (100.0%) | 40.0 |
Fertility by Age by Marriage Status in Rockwood
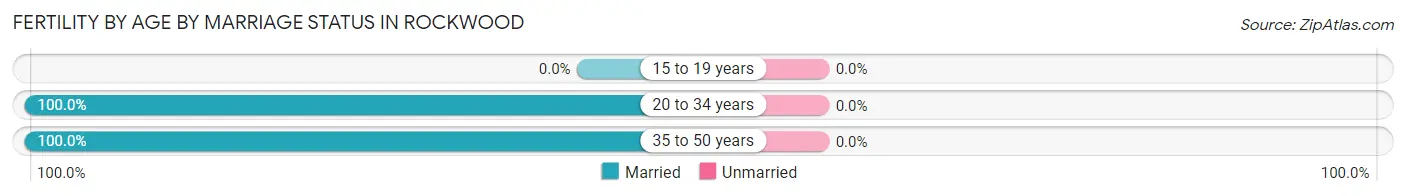
| Age Bracket | Married | Unmarried |
| 15 to 19 years | 0 (0.0%) | 0 (0.0%) |
| 20 to 34 years | 35 (100.0%) | 0 (0.0%) |
| 35 to 50 years | 10 (100.0%) | 0 (0.0%) |
| Total | 45 (100.0%) | 0 (0.0%) |
Fertility by Education in Rockwood
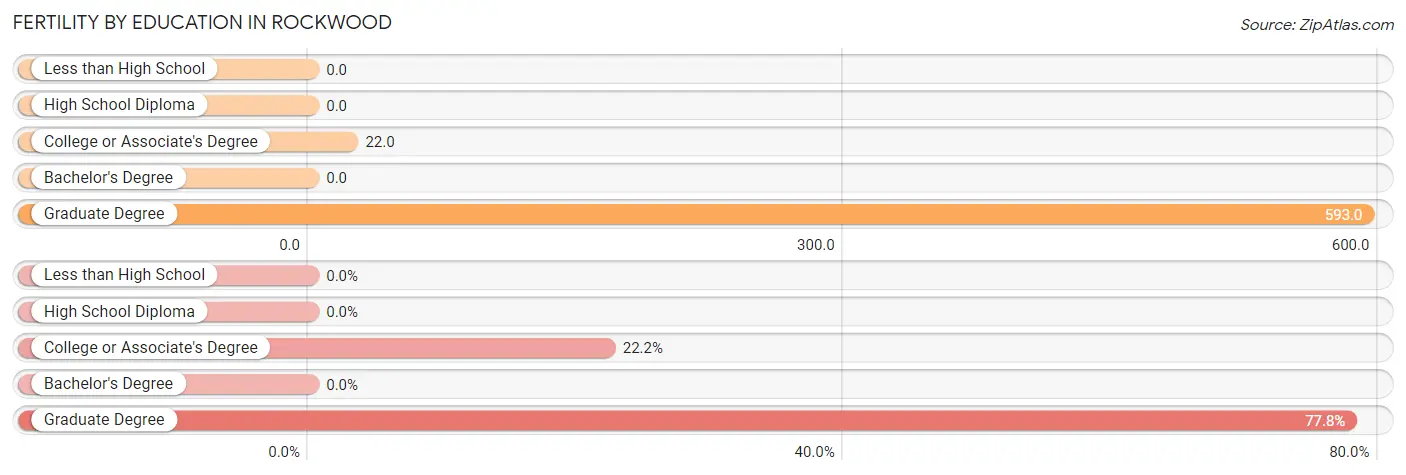
| Educational Attainment | Women with Births | Births / 1,000 Women |
| Less than High School | 0 (0.0%) | 0.0 |
| High School Diploma | 0 (0.0%) | 0.0 |
| College or Associate's Degree | 10 (22.2%) | 22.0 |
| Bachelor's Degree | 0 (0.0%) | 0.0 |
| Graduate Degree | 35 (77.8%) | 593.0 |
| Total | 45 (100.0%) | 40.0 |
Fertility by Education by Marriage Status in Rockwood
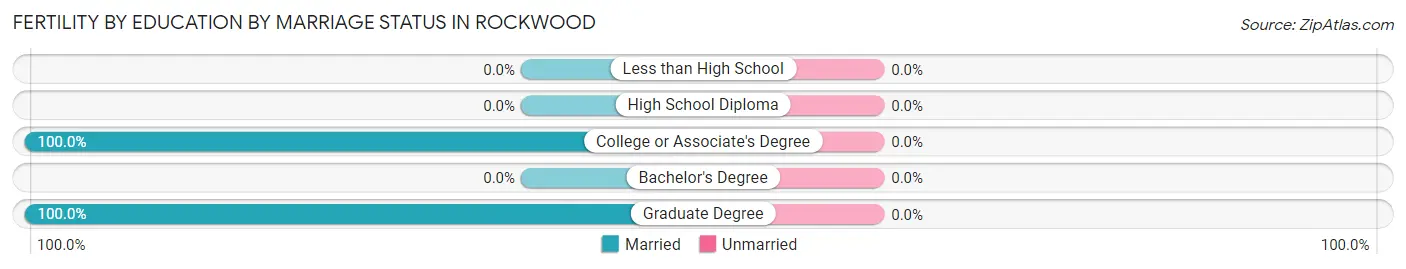
| Educational Attainment | Married | Unmarried |
| Less than High School | 0 (0.0%) | 0 (0.0%) |
| High School Diploma | 0 (0.0%) | 0 (0.0%) |
| College or Associate's Degree | 10 (100.0%) | 0 (0.0%) |
| Bachelor's Degree | 0 (0.0%) | 0 (0.0%) |
| Graduate Degree | 35 (100.0%) | 0 (0.0%) |
| Total | 45 (100.0%) | 0 (0.0%) |
Employment Characteristics in Rockwood
Employment by Class of Employer in Rockwood
Among the 1,946 employed individuals in Rockwood, private company employees (1,370 | 70.4%), self-employed (not incorporated) (205 | 10.5%), and local government employees (195 | 10.0%) make up the most common classes of employment.
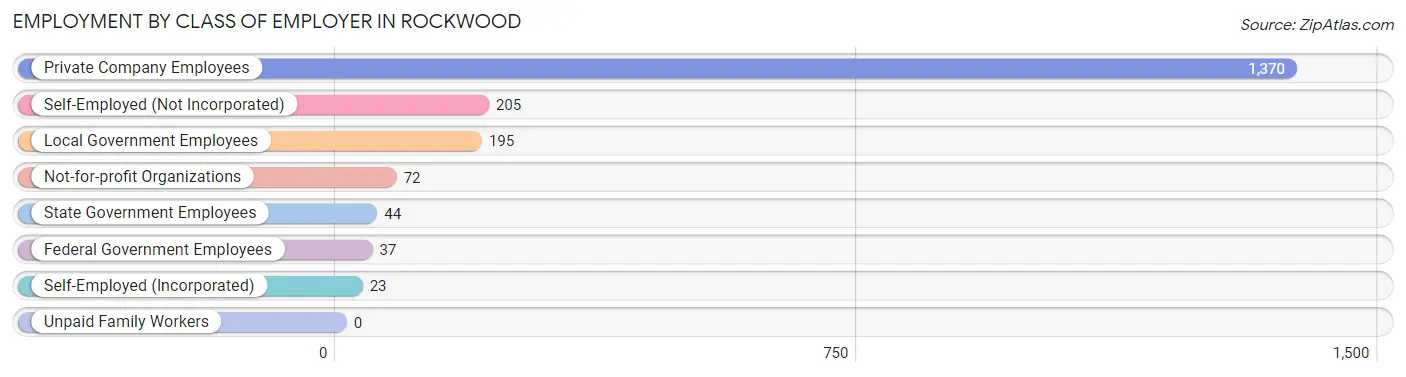
| Employer Class | # Employees | % Employees |
| Private Company Employees | 1,370 | 70.4% |
| Self-Employed (Incorporated) | 23 | 1.2% |
| Self-Employed (Not Incorporated) | 205 | 10.5% |
| Not-for-profit Organizations | 72 | 3.7% |
| Local Government Employees | 195 | 10.0% |
| State Government Employees | 44 | 2.3% |
| Federal Government Employees | 37 | 1.9% |
| Unpaid Family Workers | 0 | 0.0% |
| Total | 1,946 | 100.0% |
Employment Status by Age in Rockwood
According to the labor force statistics for Rockwood, out of the total population over 16 years of age (4,557), 47.8% or 2,178 individuals are in the labor force, with 7.6% or 166 of them unemployed. The age group with the highest labor force participation rate is 25 to 29 years, with 88.4% or 375 individuals in the labor force. Within the labor force, the 30 to 34 years age range has the highest percentage of unemployed individuals, with 19.0% or 34 of them being unemployed.
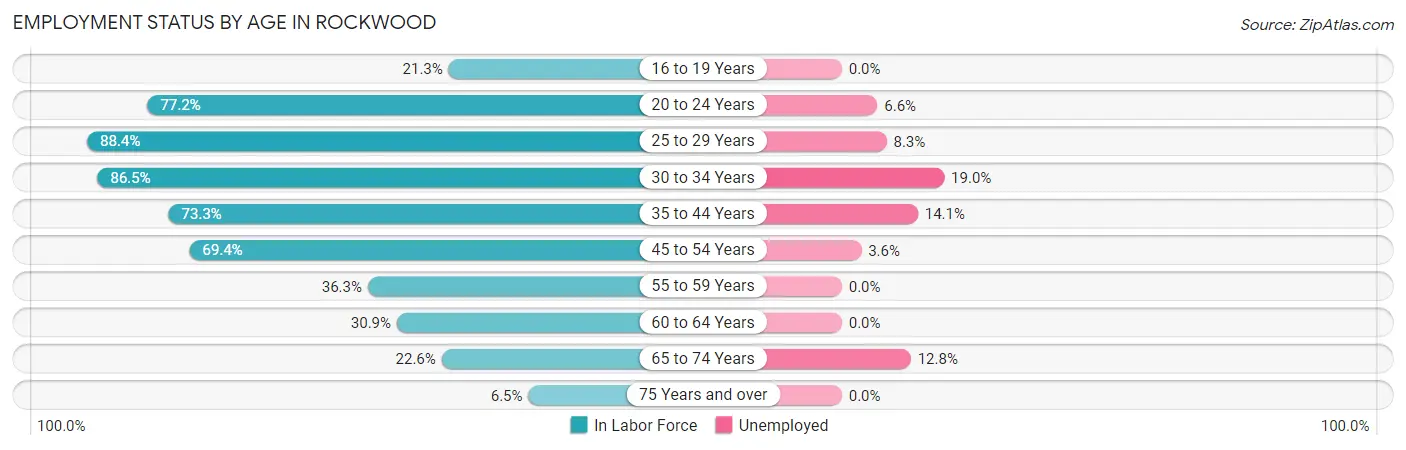
| Age Bracket | In Labor Force | Unemployed |
| 16 to 19 Years | 92 (21.3%) | 0 (0.0%) |
| 20 to 24 Years | 196 (77.2%) | 13 (6.6%) |
| 25 to 29 Years | 375 (88.4%) | 31 (8.3%) |
| 30 to 34 Years | 179 (86.5%) | 34 (19.0%) |
| 35 to 44 Years | 341 (73.3%) | 48 (14.1%) |
| 45 to 54 Years | 589 (69.4%) | 21 (3.6%) |
| 55 to 59 Years | 131 (36.3%) | 0 (0.0%) |
| 60 to 64 Years | 95 (30.9%) | 0 (0.0%) |
| 65 to 74 Years | 141 (22.6%) | 18 (12.8%) |
| 75 Years and over | 41 (6.5%) | 0 (0.0%) |
| Total | 2,178 (47.8%) | 166 (7.6%) |
Employment Status by Educational Attainment in Rockwood
According to labor force statistics for Rockwood, 65.4% of individuals (1,709) out of the total population between 25 and 64 years of age (2,613) are in the labor force, with 7.8% or 133 of them being unemployed. The group with the highest labor force participation rate are those with the educational attainment of bachelor's degree or higher, with 88.2% or 291 individuals in the labor force. Within the labor force, individuals with less than high school education have the highest percentage of unemployment, with 11.0% or 16 of them being unemployed.
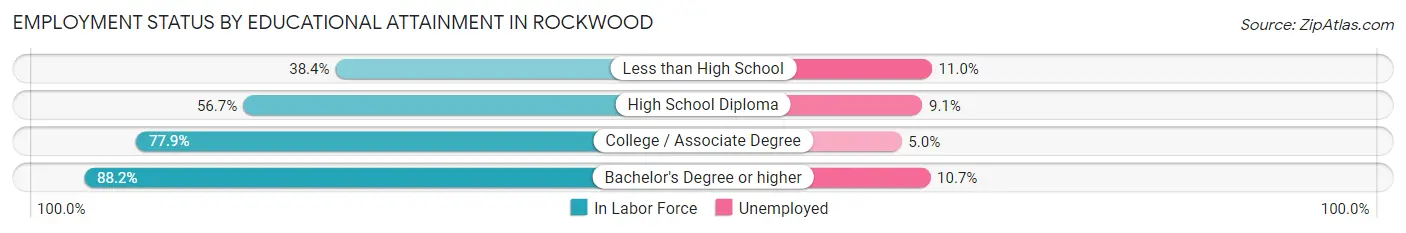
| Educational Attainment | In Labor Force | Unemployed |
| Less than High School | 146 (38.4%) | 42 (11.0%) |
| High School Diploma | 560 (56.7%) | 90 (9.1%) |
| College / Associate Degree | 713 (77.9%) | 46 (5.0%) |
| Bachelor's Degree or higher | 291 (88.2%) | 35 (10.7%) |
| Total | 1,709 (65.4%) | 204 (7.8%) |
Employment Occupations by Sex in Rockwood
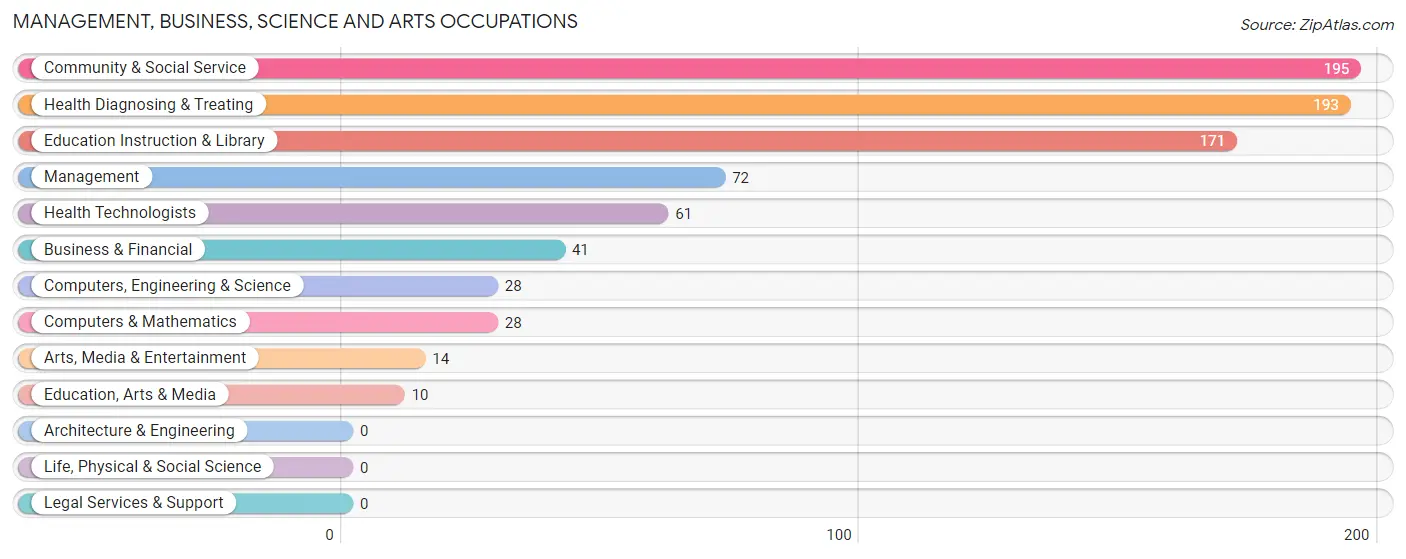
Management, Business, Science and Arts Occupations
The most common Management, Business, Science and Arts occupations in Rockwood are Community & Social Service (195 | 9.7%), Health Diagnosing & Treating (193 | 9.6%), Education Instruction & Library (171 | 8.5%), Management (72 | 3.6%), and Health Technologists (61 | 3.0%).
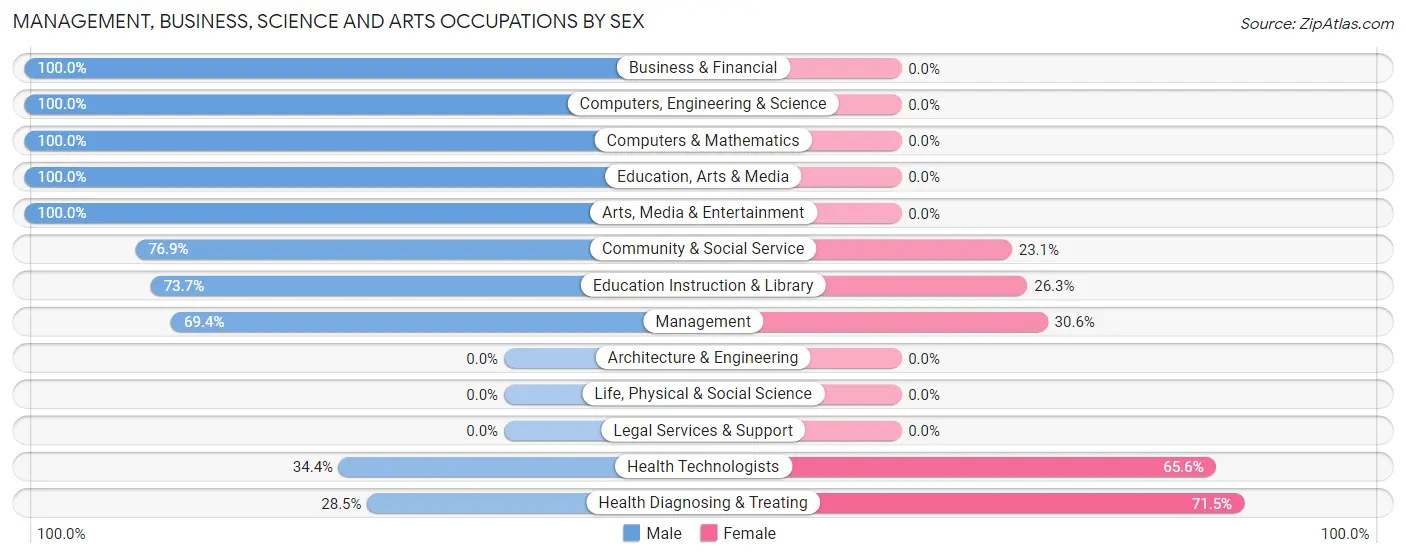
Management, Business, Science and Arts Occupations by Sex
Within the Management, Business, Science and Arts occupations in Rockwood, the most male-oriented occupations are Business & Financial (100.0%), Computers, Engineering & Science (100.0%), and Computers & Mathematics (100.0%), while the most female-oriented occupations are Health Diagnosing & Treating (71.5%), Health Technologists (65.6%), and Management (30.6%).
| Occupation | Male | Female |
| Management | 50 (69.4%) | 22 (30.6%) |
| Business & Financial | 41 (100.0%) | 0 (0.0%) |
| Computers, Engineering & Science | 28 (100.0%) | 0 (0.0%) |
| Computers & Mathematics | 28 (100.0%) | 0 (0.0%) |
| Architecture & Engineering | 0 (0.0%) | 0 (0.0%) |
| Life, Physical & Social Science | 0 (0.0%) | 0 (0.0%) |
| Community & Social Service | 150 (76.9%) | 45 (23.1%) |
| Education, Arts & Media | 10 (100.0%) | 0 (0.0%) |
| Legal Services & Support | 0 (0.0%) | 0 (0.0%) |
| Education Instruction & Library | 126 (73.7%) | 45 (26.3%) |
| Arts, Media & Entertainment | 14 (100.0%) | 0 (0.0%) |
| Health Diagnosing & Treating | 55 (28.5%) | 138 (71.5%) |
| Health Technologists | 21 (34.4%) | 40 (65.6%) |
| Total (Category) | 324 (61.3%) | 205 (38.8%) |
| Total (Overall) | 931 (46.2%) | 1,084 (53.8%) |
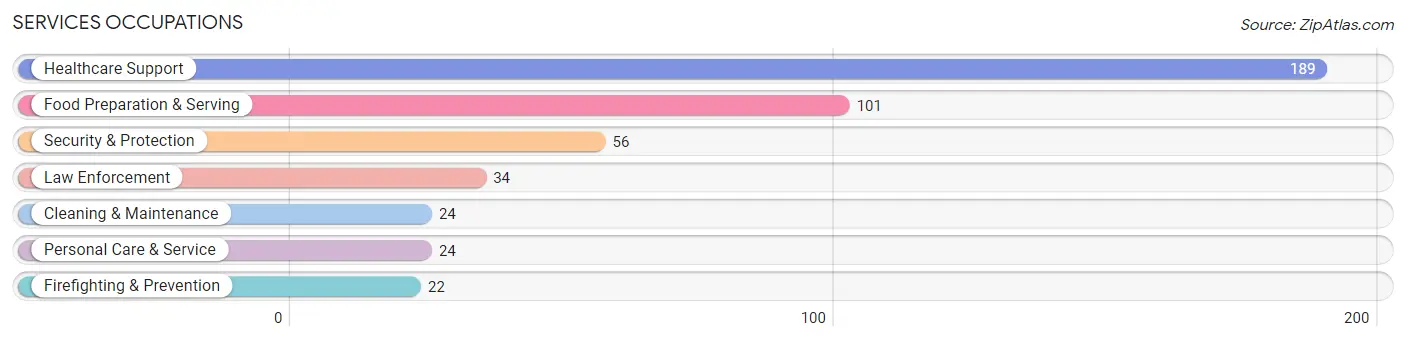
Services Occupations
The most common Services occupations in Rockwood are Healthcare Support (189 | 9.4%), Food Preparation & Serving (101 | 5.0%), Security & Protection (56 | 2.8%), Law Enforcement (34 | 1.7%), and Cleaning & Maintenance (24 | 1.2%).
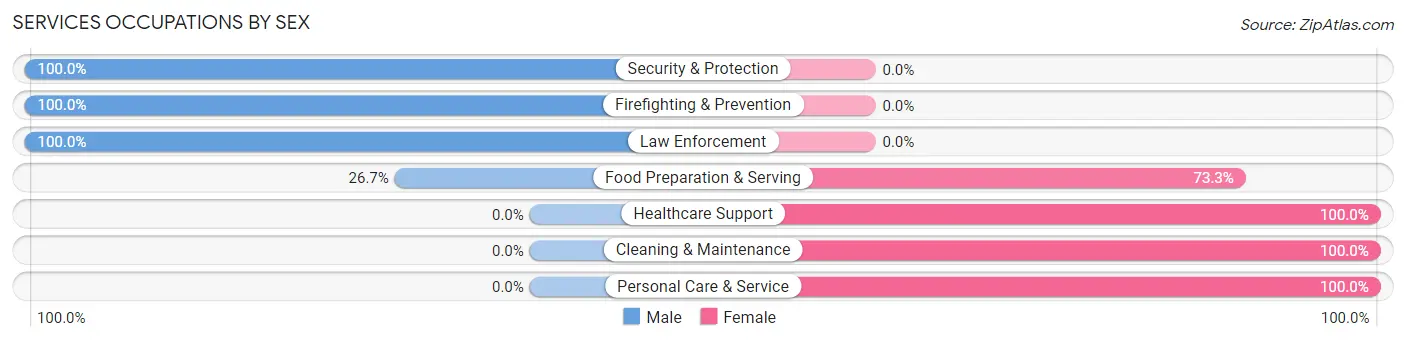
Services Occupations by Sex
Within the Services occupations in Rockwood, the most male-oriented occupations are Security & Protection (100.0%), Firefighting & Prevention (100.0%), and Law Enforcement (100.0%), while the most female-oriented occupations are Healthcare Support (100.0%), Cleaning & Maintenance (100.0%), and Personal Care & Service (100.0%).
| Occupation | Male | Female |
| Healthcare Support | 0 (0.0%) | 189 (100.0%) |
| Security & Protection | 56 (100.0%) | 0 (0.0%) |
| Firefighting & Prevention | 22 (100.0%) | 0 (0.0%) |
| Law Enforcement | 34 (100.0%) | 0 (0.0%) |
| Food Preparation & Serving | 27 (26.7%) | 74 (73.3%) |
| Cleaning & Maintenance | 0 (0.0%) | 24 (100.0%) |
| Personal Care & Service | 0 (0.0%) | 24 (100.0%) |
| Total (Category) | 83 (21.1%) | 311 (78.9%) |
| Total (Overall) | 931 (46.2%) | 1,084 (53.8%) |
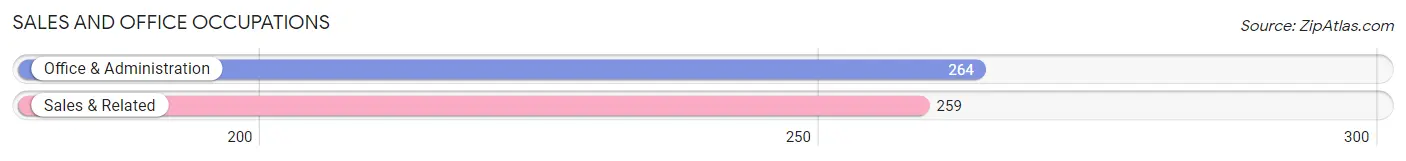
Sales and Office Occupations
The most common Sales and Office occupations in Rockwood are Office & Administration (264 | 13.1%), and Sales & Related (259 | 12.9%).
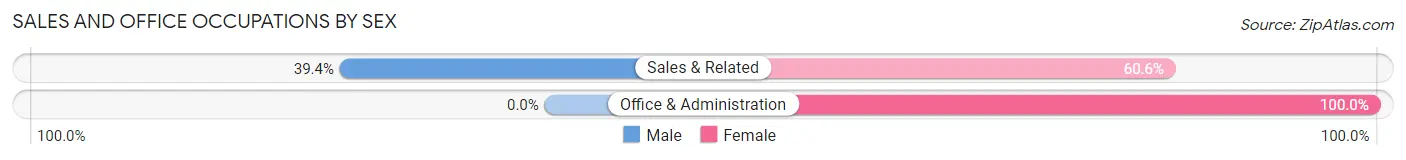
Sales and Office Occupations by Sex
| Occupation | Male | Female |
| Sales & Related | 102 (39.4%) | 157 (60.6%) |
| Office & Administration | 0 (0.0%) | 264 (100.0%) |
| Total (Category) | 102 (19.5%) | 421 (80.5%) |
| Total (Overall) | 931 (46.2%) | 1,084 (53.8%) |
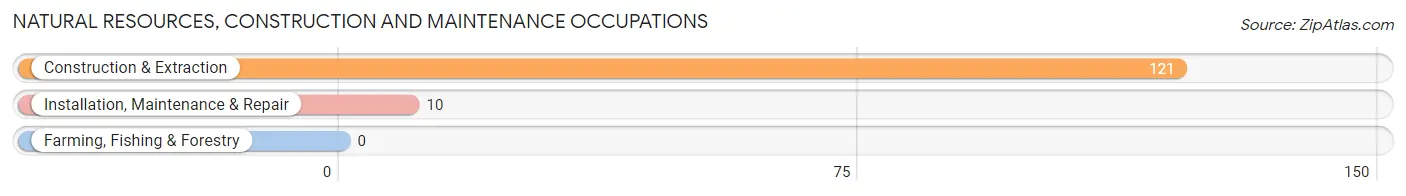
Natural Resources, Construction and Maintenance Occupations
The most common Natural Resources, Construction and Maintenance occupations in Rockwood are Construction & Extraction (121 | 6.0%), and Installation, Maintenance & Repair (10 | 0.5%).
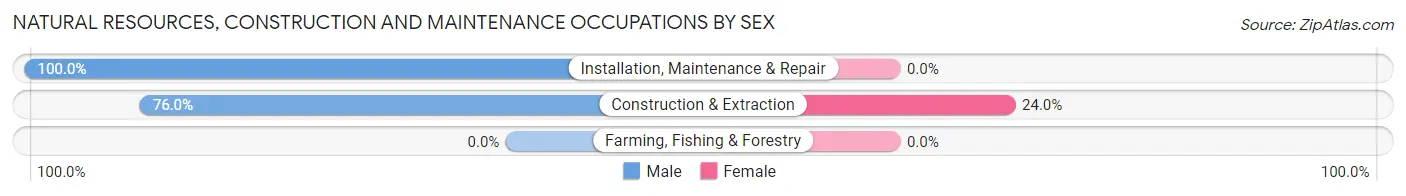
Natural Resources, Construction and Maintenance Occupations by Sex
| Occupation | Male | Female |
| Farming, Fishing & Forestry | 0 (0.0%) | 0 (0.0%) |
| Construction & Extraction | 92 (76.0%) | 29 (24.0%) |
| Installation, Maintenance & Repair | 10 (100.0%) | 0 (0.0%) |
| Total (Category) | 102 (77.9%) | 29 (22.1%) |
| Total (Overall) | 931 (46.2%) | 1,084 (53.8%) |
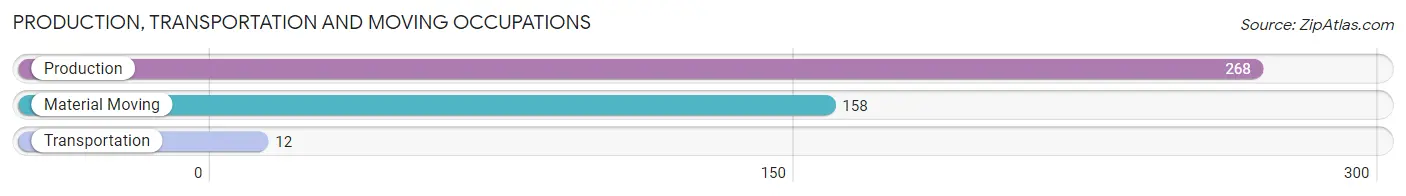
Production, Transportation and Moving Occupations
The most common Production, Transportation and Moving occupations in Rockwood are Production (268 | 13.3%), Material Moving (158 | 7.8%), and Transportation (12 | 0.6%).
Production, Transportation and Moving Occupations by Sex
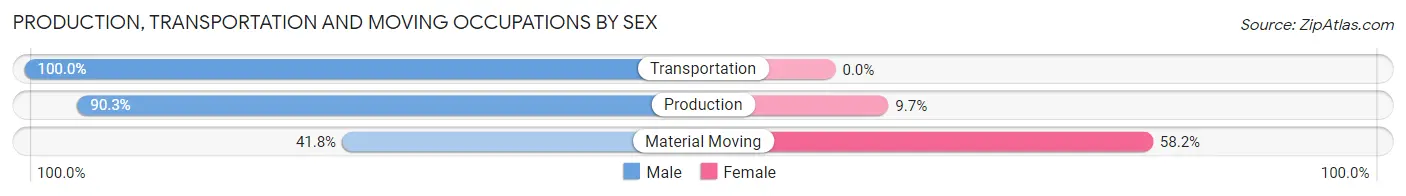
| Occupation | Male | Female |
| Production | 242 (90.3%) | 26 (9.7%) |
| Transportation | 12 (100.0%) | 0 (0.0%) |
| Material Moving | 66 (41.8%) | 92 (58.2%) |
| Total (Category) | 320 (73.1%) | 118 (26.9%) |
| Total (Overall) | 931 (46.2%) | 1,084 (53.8%) |
Employment Industries by Sex in Rockwood
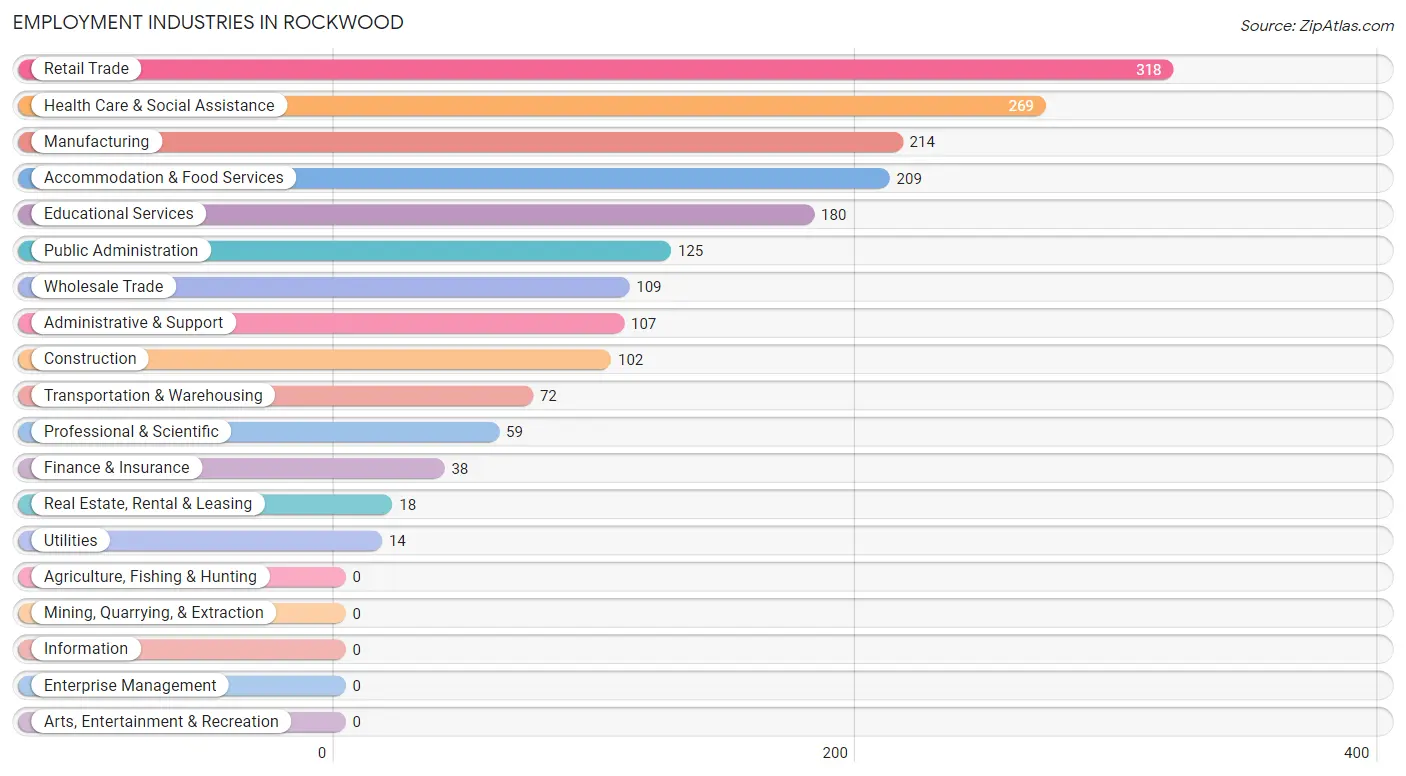
Employment Industries in Rockwood
The major employment industries in Rockwood include Retail Trade (318 | 15.8%), Health Care & Social Assistance (269 | 13.4%), Manufacturing (214 | 10.6%), Accommodation & Food Services (209 | 10.4%), and Educational Services (180 | 8.9%).
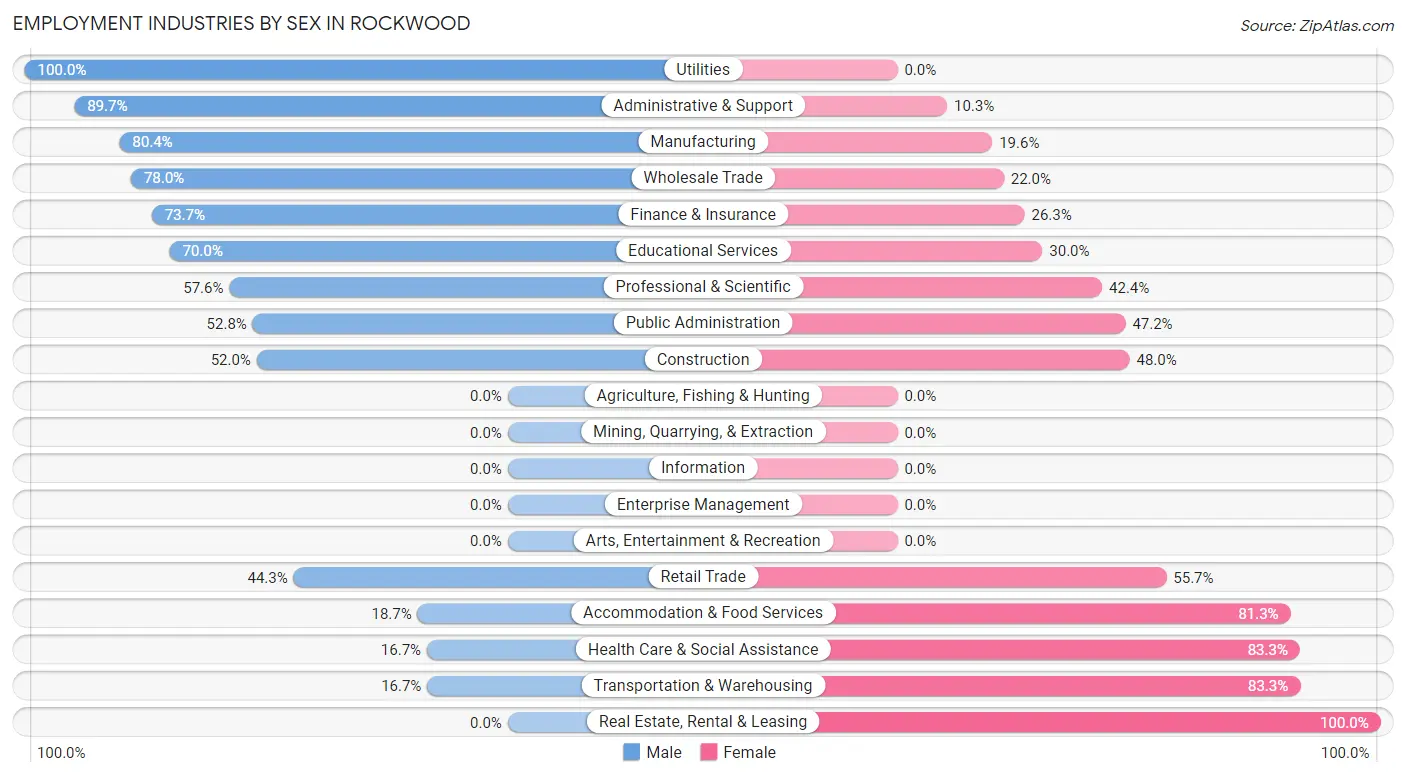
Employment Industries by Sex in Rockwood
The Rockwood industries that see more men than women are Utilities (100.0%), Administrative & Support (89.7%), and Manufacturing (80.4%), whereas the industries that tend to have a higher number of women are Real Estate, Rental & Leasing (100.0%), Transportation & Warehousing (83.3%), and Health Care & Social Assistance (83.3%).
| Industry | Male | Female |
| Agriculture, Fishing & Hunting | 0 (0.0%) | 0 (0.0%) |
| Mining, Quarrying, & Extraction | 0 (0.0%) | 0 (0.0%) |
| Construction | 53 (52.0%) | 49 (48.0%) |
| Manufacturing | 172 (80.4%) | 42 (19.6%) |
| Wholesale Trade | 85 (78.0%) | 24 (22.0%) |
| Retail Trade | 141 (44.3%) | 177 (55.7%) |
| Transportation & Warehousing | 12 (16.7%) | 60 (83.3%) |
| Utilities | 14 (100.0%) | 0 (0.0%) |
| Information | 0 (0.0%) | 0 (0.0%) |
| Finance & Insurance | 28 (73.7%) | 10 (26.3%) |
| Real Estate, Rental & Leasing | 0 (0.0%) | 18 (100.0%) |
| Professional & Scientific | 34 (57.6%) | 25 (42.4%) |
| Enterprise Management | 0 (0.0%) | 0 (0.0%) |
| Administrative & Support | 96 (89.7%) | 11 (10.3%) |
| Educational Services | 126 (70.0%) | 54 (30.0%) |
| Health Care & Social Assistance | 45 (16.7%) | 224 (83.3%) |
| Arts, Entertainment & Recreation | 0 (0.0%) | 0 (0.0%) |
| Accommodation & Food Services | 39 (18.7%) | 170 (81.3%) |
| Public Administration | 66 (52.8%) | 59 (47.2%) |
| Total | 931 (46.2%) | 1,084 (53.8%) |
Education in Rockwood
School Enrollment in Rockwood
The most common levels of schooling among the 937 students in Rockwood are high school (349 | 37.2%), elementary school (173 | 18.5%), and middle school (171 | 18.2%).
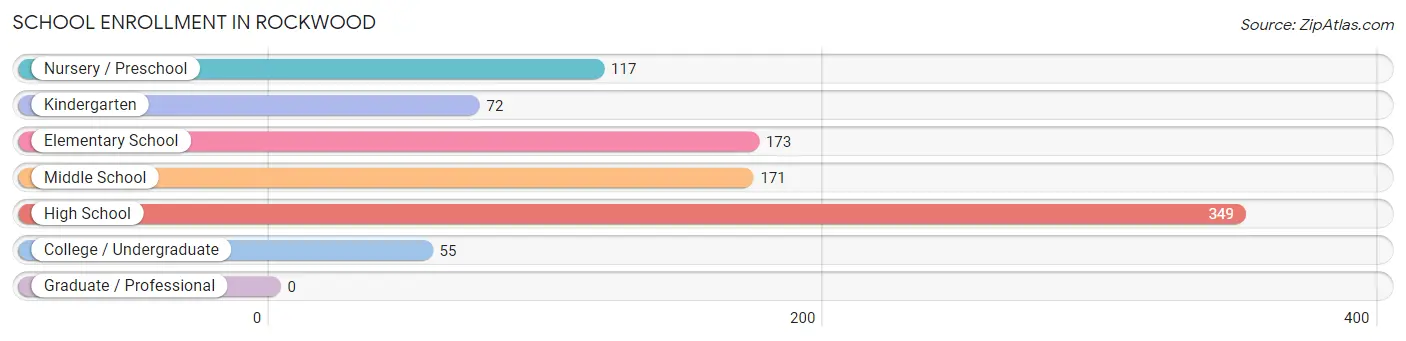
| School Level | # Students | % Students |
| Nursery / Preschool | 117 | 12.5% |
| Kindergarten | 72 | 7.7% |
| Elementary School | 173 | 18.5% |
| Middle School | 171 | 18.2% |
| High School | 349 | 37.2% |
| College / Undergraduate | 55 | 5.9% |
| Graduate / Professional | 0 | 0.0% |
| Total | 937 | 100.0% |
School Enrollment by Age by Funding Source in Rockwood
Out of a total of 937 students who are enrolled in schools in Rockwood, 263 (28.1%) attend a private institution, while the remaining 674 (71.9%) are enrolled in public schools. The age group of 15 to 17 year olds has the highest likelihood of being enrolled in private schools, with 196 (58.0% in the age bracket) enrolled. Conversely, the age group of 3 to 4 year olds has the lowest likelihood of being enrolled in a private school, with 7 (100.0% in the age bracket) attending a public institution.
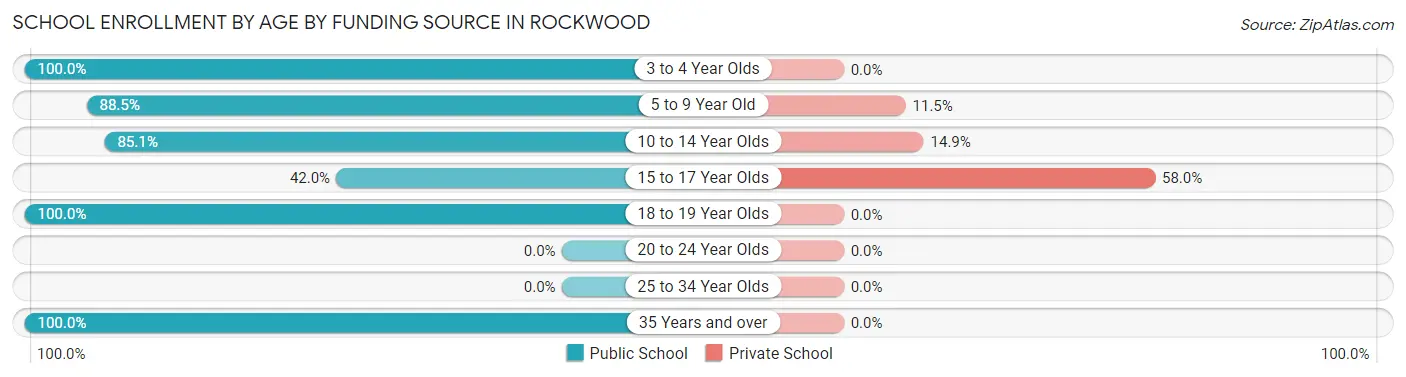
| Age Bracket | Public School | Private School |
| 3 to 4 Year Olds | 7 (100.0%) | 0 (0.0%) |
| 5 to 9 Year Old | 299 (88.5%) | 39 (11.5%) |
| 10 to 14 Year Olds | 160 (85.1%) | 28 (14.9%) |
| 15 to 17 Year Olds | 142 (42.0%) | 196 (58.0%) |
| 18 to 19 Year Olds | 56 (100.0%) | 0 (0.0%) |
| 20 to 24 Year Olds | 0 (0.0%) | 0 (0.0%) |
| 25 to 34 Year Olds | 0 (0.0%) | 0 (0.0%) |
| 35 Years and over | 10 (100.0%) | 0 (0.0%) |
| Total | 674 (71.9%) | 263 (28.1%) |
Educational Attainment by Field of Study in Rockwood
Education (294 | 43.6%), computers & mathematics (105 | 15.6%), visual & performing arts (105 | 15.6%), arts & humanities (45 | 6.7%), and science & technology (41 | 6.1%) are the most common fields of study among 675 individuals in Rockwood who have obtained a bachelor's degree or higher.
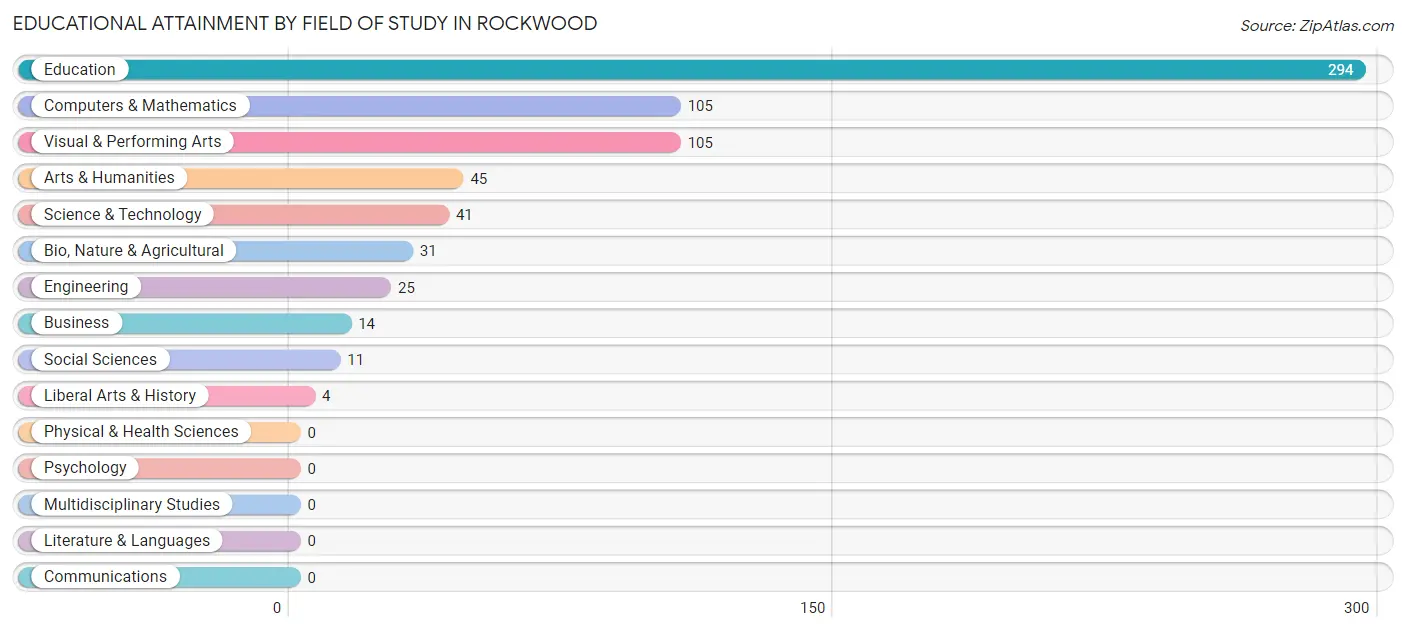
| Field of Study | # Graduates | % Graduates |
| Computers & Mathematics | 105 | 15.6% |
| Bio, Nature & Agricultural | 31 | 4.6% |
| Physical & Health Sciences | 0 | 0.0% |
| Psychology | 0 | 0.0% |
| Social Sciences | 11 | 1.6% |
| Engineering | 25 | 3.7% |
| Multidisciplinary Studies | 0 | 0.0% |
| Science & Technology | 41 | 6.1% |
| Business | 14 | 2.1% |
| Education | 294 | 43.6% |
| Literature & Languages | 0 | 0.0% |
| Liberal Arts & History | 4 | 0.6% |
| Visual & Performing Arts | 105 | 15.6% |
| Communications | 0 | 0.0% |
| Arts & Humanities | 45 | 6.7% |
| Total | 675 | 100.0% |
Transportation & Commute in Rockwood
Vehicle Availability by Sex in Rockwood
The most prevalent vehicle ownership categories in Rockwood are males with 3 vehicles (311, accounting for 35.4%) and females with 3 vehicles (250, making up 29.1%).
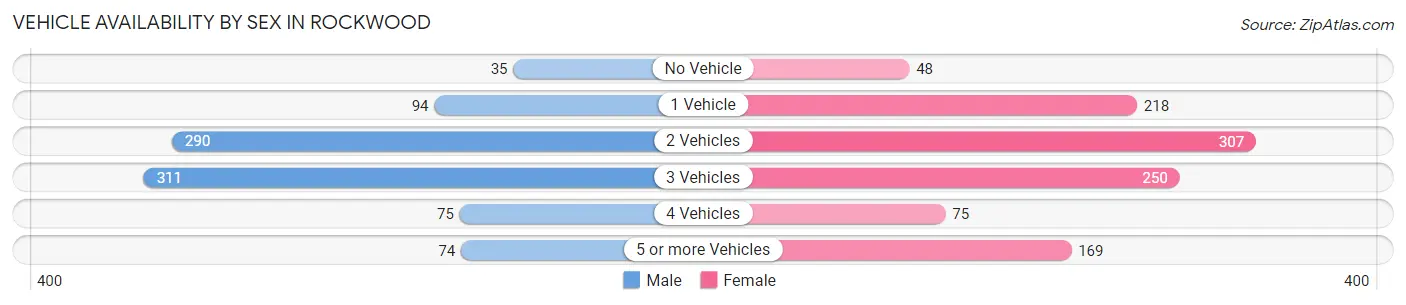
| Vehicles Available | Male | Female |
| No Vehicle | 35 (4.0%) | 48 (4.5%) |
| 1 Vehicle | 94 (10.7%) | 218 (20.4%) |
| 2 Vehicles | 290 (33.0%) | 307 (28.8%) |
| 3 Vehicles | 311 (35.4%) | 250 (23.4%) |
| 4 Vehicles | 75 (8.5%) | 75 (7.0%) |
| 5 or more Vehicles | 74 (8.4%) | 169 (15.8%) |
| Total | 879 (100.0%) | 1,067 (100.0%) |
Commute Time in Rockwood
The most frequently occuring commute durations in Rockwood are 5 to 9 minutes (292 commuters, 17.0%), 45 to 59 minutes (213 commuters, 12.4%), and 15 to 19 minutes (200 commuters, 11.6%).
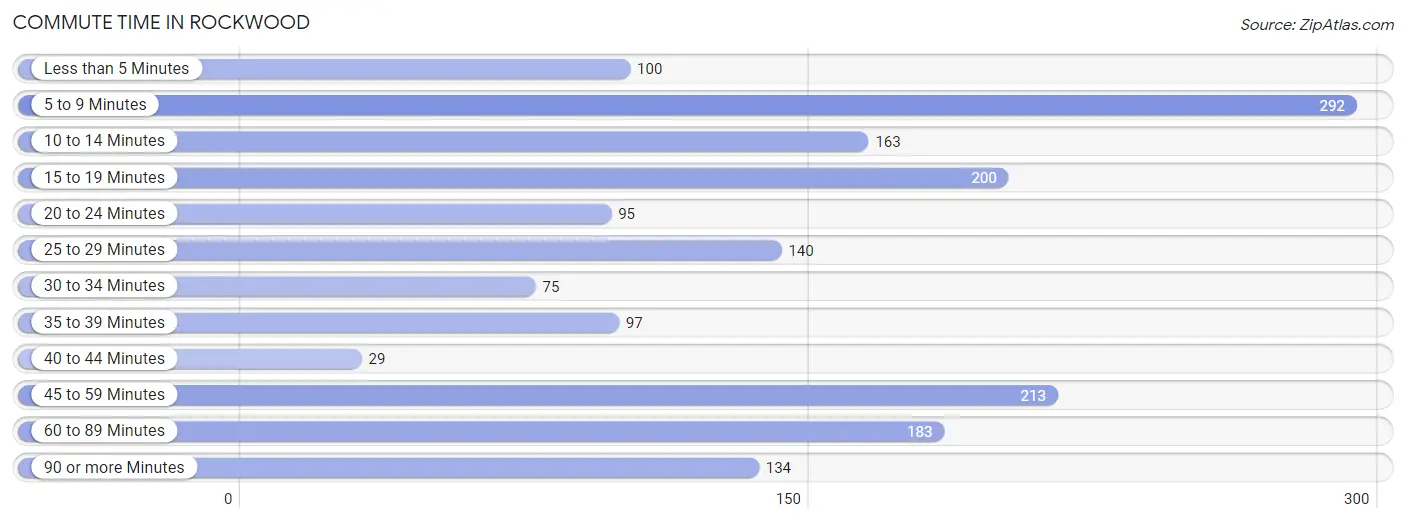
| Commute Time | # Commuters | % Commuters |
| Less than 5 Minutes | 100 | 5.8% |
| 5 to 9 Minutes | 292 | 17.0% |
| 10 to 14 Minutes | 163 | 9.5% |
| 15 to 19 Minutes | 200 | 11.6% |
| 20 to 24 Minutes | 95 | 5.5% |
| 25 to 29 Minutes | 140 | 8.1% |
| 30 to 34 Minutes | 75 | 4.4% |
| 35 to 39 Minutes | 97 | 5.6% |
| 40 to 44 Minutes | 29 | 1.7% |
| 45 to 59 Minutes | 213 | 12.4% |
| 60 to 89 Minutes | 183 | 10.6% |
| 90 or more Minutes | 134 | 7.8% |
Commute Time by Sex in Rockwood
The most common commute times in Rockwood are 5 to 9 minutes (144 commuters, 20.0%) for males and 15 to 19 minutes (165 commuters, 16.5%) for females.
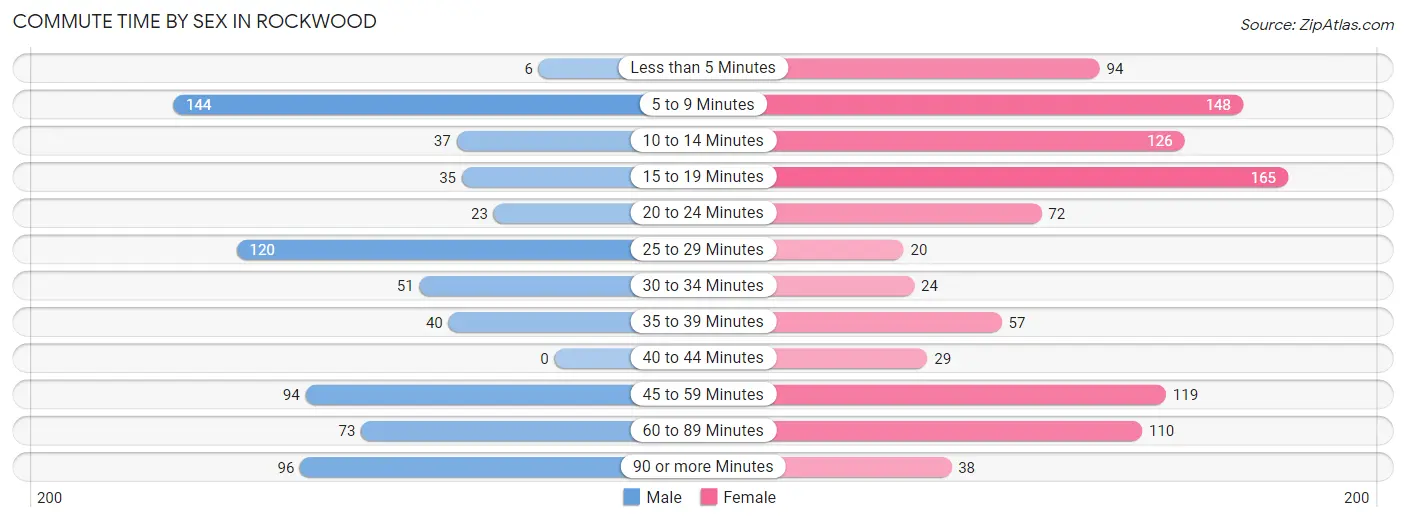
| Commute Time | Male | Female |
| Less than 5 Minutes | 6 (0.8%) | 94 (9.4%) |
| 5 to 9 Minutes | 144 (20.0%) | 148 (14.8%) |
| 10 to 14 Minutes | 37 (5.1%) | 126 (12.6%) |
| 15 to 19 Minutes | 35 (4.9%) | 165 (16.5%) |
| 20 to 24 Minutes | 23 (3.2%) | 72 (7.2%) |
| 25 to 29 Minutes | 120 (16.7%) | 20 (2.0%) |
| 30 to 34 Minutes | 51 (7.1%) | 24 (2.4%) |
| 35 to 39 Minutes | 40 (5.6%) | 57 (5.7%) |
| 40 to 44 Minutes | 0 (0.0%) | 29 (2.9%) |
| 45 to 59 Minutes | 94 (13.1%) | 119 (11.9%) |
| 60 to 89 Minutes | 73 (10.2%) | 110 (11.0%) |
| 90 or more Minutes | 96 (13.4%) | 38 (3.8%) |
Time of Departure to Work by Sex in Rockwood
The most frequent times of departure to work in Rockwood are 12:00 AM to 4:59 AM (161, 22.4%) for males and 7:00 AM to 7:29 AM (172, 17.2%) for females.
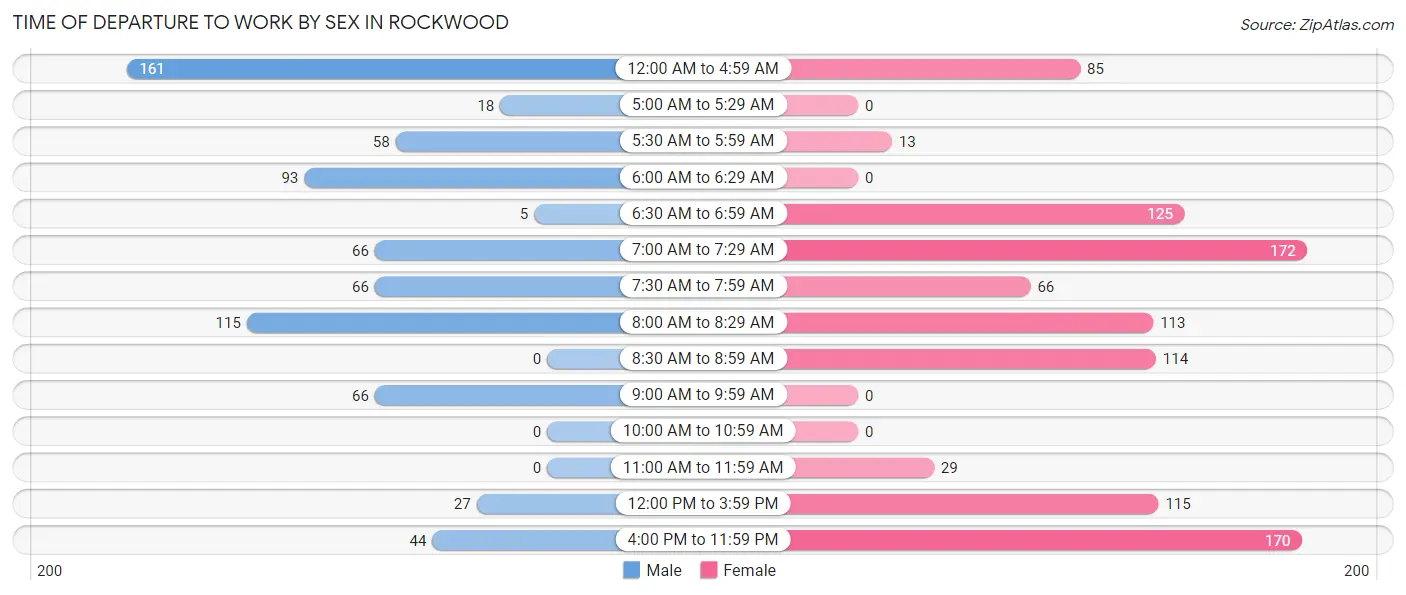
| Time of Departure | Male | Female |
| 12:00 AM to 4:59 AM | 161 (22.4%) | 85 (8.5%) |
| 5:00 AM to 5:29 AM | 18 (2.5%) | 0 (0.0%) |
| 5:30 AM to 5:59 AM | 58 (8.1%) | 13 (1.3%) |
| 6:00 AM to 6:29 AM | 93 (12.9%) | 0 (0.0%) |
| 6:30 AM to 6:59 AM | 5 (0.7%) | 125 (12.5%) |
| 7:00 AM to 7:29 AM | 66 (9.2%) | 172 (17.2%) |
| 7:30 AM to 7:59 AM | 66 (9.2%) | 66 (6.6%) |
| 8:00 AM to 8:29 AM | 115 (16.0%) | 113 (11.3%) |
| 8:30 AM to 8:59 AM | 0 (0.0%) | 114 (11.4%) |
| 9:00 AM to 9:59 AM | 66 (9.2%) | 0 (0.0%) |
| 10:00 AM to 10:59 AM | 0 (0.0%) | 0 (0.0%) |
| 11:00 AM to 11:59 AM | 0 (0.0%) | 29 (2.9%) |
| 12:00 PM to 3:59 PM | 27 (3.8%) | 115 (11.5%) |
| 4:00 PM to 11:59 PM | 44 (6.1%) | 170 (17.0%) |
| Total | 719 (100.0%) | 1,002 (100.0%) |
Housing Occupancy in Rockwood
Occupancy by Ownership in Rockwood
Of the total 2,239 dwellings in Rockwood, owner-occupied units account for 1,285 (57.4%), while renter-occupied units make up 954 (42.6%).
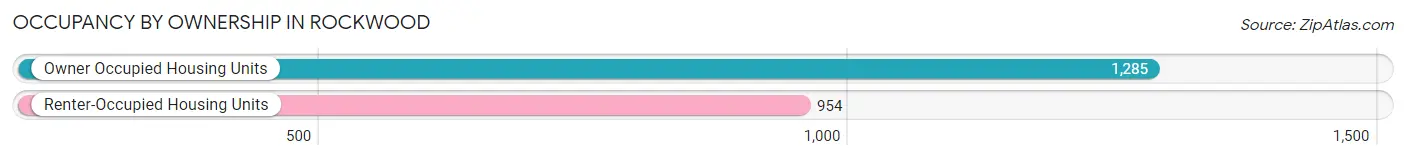
| Occupancy | # Housing Units | % Housing Units |
| Owner Occupied Housing Units | 1,285 | 57.4% |
| Renter-Occupied Housing Units | 954 | 42.6% |
| Total Occupied Housing Units | 2,239 | 100.0% |
Occupancy by Household Size in Rockwood
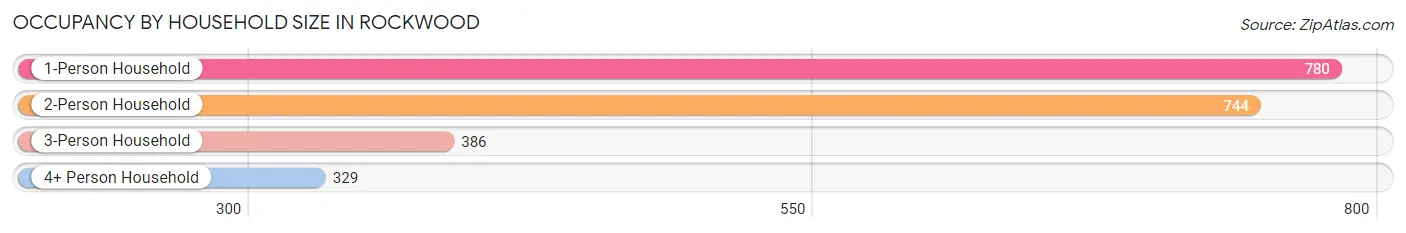
| Household Size | # Housing Units | % Housing Units |
| 1-Person Household | 780 | 34.8% |
| 2-Person Household | 744 | 33.2% |
| 3-Person Household | 386 | 17.2% |
| 4+ Person Household | 329 | 14.7% |
| Total Housing Units | 2,239 | 100.0% |
Occupancy by Ownership by Household Size in Rockwood
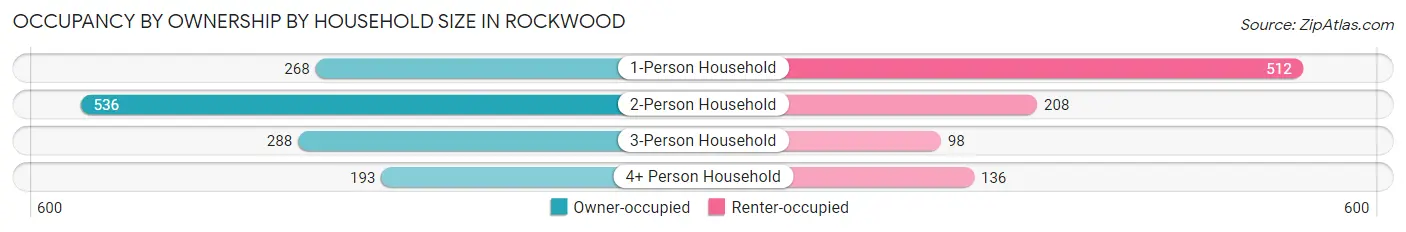
| Household Size | Owner-occupied | Renter-occupied |
| 1-Person Household | 268 (34.4%) | 512 (65.6%) |
| 2-Person Household | 536 (72.0%) | 208 (28.0%) |
| 3-Person Household | 288 (74.6%) | 98 (25.4%) |
| 4+ Person Household | 193 (58.7%) | 136 (41.3%) |
| Total Housing Units | 1,285 (57.4%) | 954 (42.6%) |
Occupancy by Educational Attainment in Rockwood
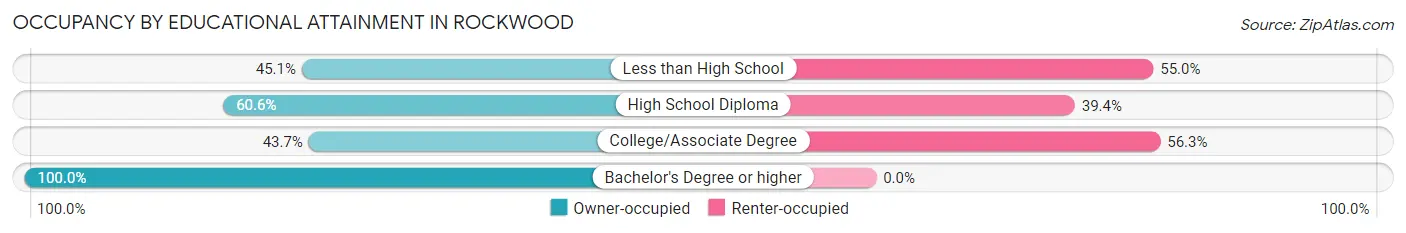
| Household Size | Owner-occupied | Renter-occupied |
| Less than High School | 82 (45.1%) | 100 (54.9%) |
| High School Diploma | 568 (60.6%) | 369 (39.4%) |
| College/Associate Degree | 376 (43.7%) | 485 (56.3%) |
| Bachelor's Degree or higher | 259 (100.0%) | 0 (0.0%) |
Occupancy by Age of Householder in Rockwood
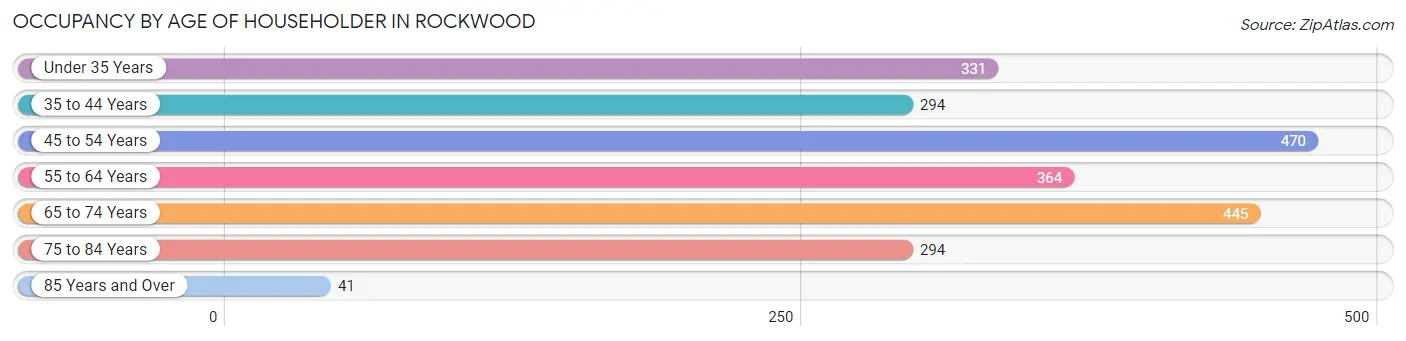
| Age Bracket | # Households | % Households |
| Under 35 Years | 331 | 14.8% |
| 35 to 44 Years | 294 | 13.1% |
| 45 to 54 Years | 470 | 21.0% |
| 55 to 64 Years | 364 | 16.3% |
| 65 to 74 Years | 445 | 19.9% |
| 75 to 84 Years | 294 | 13.1% |
| 85 Years and Over | 41 | 1.8% |
| Total | 2,239 | 100.0% |
Housing Finances in Rockwood
Median Income by Occupancy in Rockwood
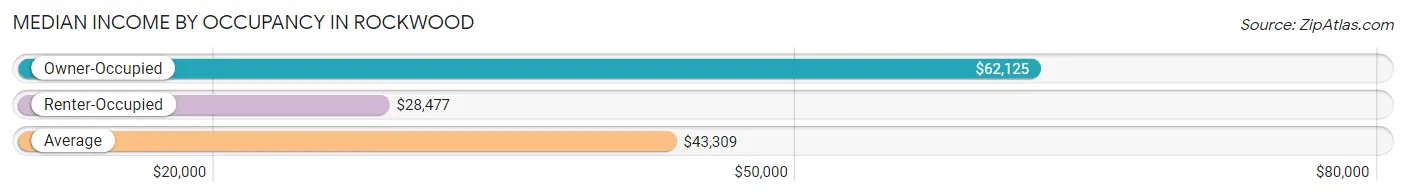
| Occupancy Type | # Households | Median Income |
| Owner-Occupied | 1,285 (57.4%) | $62,125 |
| Renter-Occupied | 954 (42.6%) | $28,477 |
| Average | 2,239 (100.0%) | $43,309 |
Occupancy by Householder Income Bracket in Rockwood
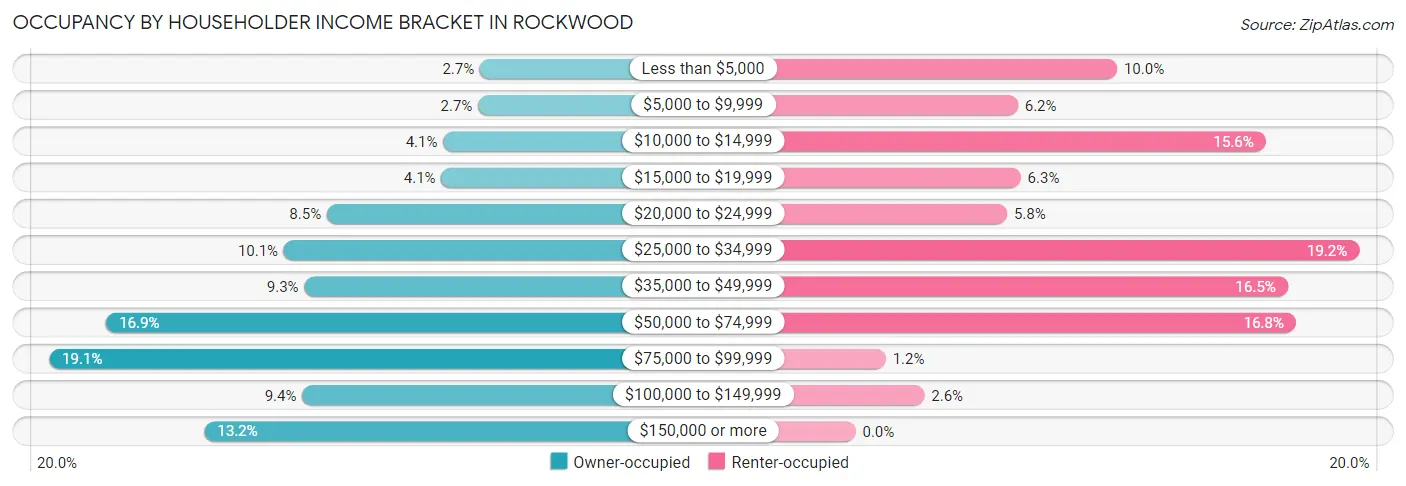
| Income Bracket | Owner-occupied | Renter-occupied |
| Less than $5,000 | 34 (2.6%) | 95 (10.0%) |
| $5,000 to $9,999 | 35 (2.7%) | 59 (6.2%) |
| $10,000 to $14,999 | 52 (4.1%) | 149 (15.6%) |
| $15,000 to $19,999 | 53 (4.1%) | 60 (6.3%) |
| $20,000 to $24,999 | 109 (8.5%) | 55 (5.8%) |
| $25,000 to $34,999 | 130 (10.1%) | 183 (19.2%) |
| $35,000 to $49,999 | 120 (9.3%) | 157 (16.5%) |
| $50,000 to $74,999 | 217 (16.9%) | 160 (16.8%) |
| $75,000 to $99,999 | 245 (19.1%) | 11 (1.1%) |
| $100,000 to $149,999 | 121 (9.4%) | 25 (2.6%) |
| $150,000 or more | 169 (13.2%) | 0 (0.0%) |
| Total | 1,285 (100.0%) | 954 (100.0%) |
Monthly Housing Cost Tiers in Rockwood
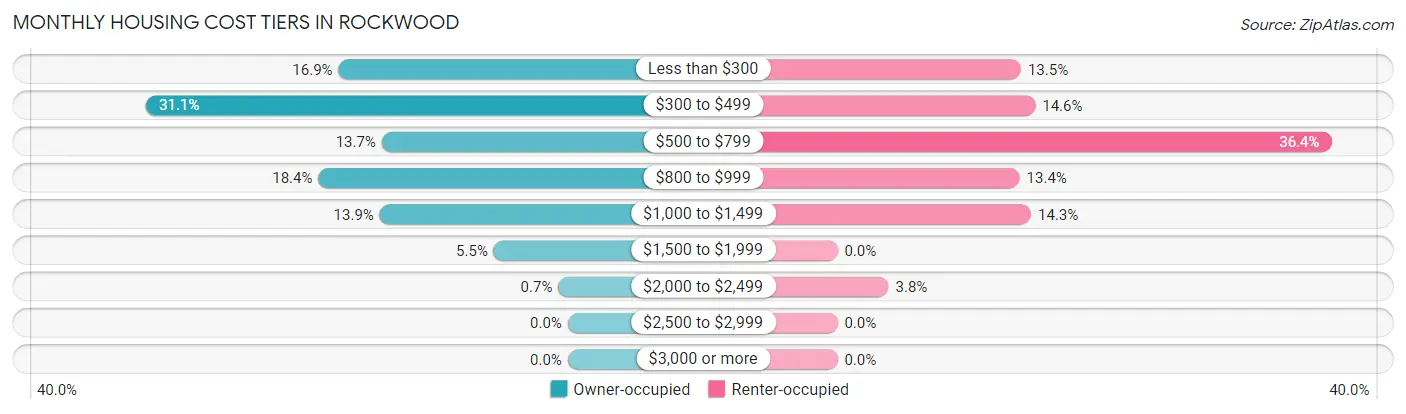
| Monthly Cost | Owner-occupied | Renter-occupied |
| Less than $300 | 217 (16.9%) | 129 (13.5%) |
| $300 to $499 | 399 (31.0%) | 139 (14.6%) |
| $500 to $799 | 176 (13.7%) | 347 (36.4%) |
| $800 to $999 | 236 (18.4%) | 128 (13.4%) |
| $1,000 to $1,499 | 178 (13.9%) | 136 (14.3%) |
| $1,500 to $1,999 | 70 (5.4%) | 0 (0.0%) |
| $2,000 to $2,499 | 9 (0.7%) | 36 (3.8%) |
| $2,500 to $2,999 | 0 (0.0%) | 0 (0.0%) |
| $3,000 or more | 0 (0.0%) | 0 (0.0%) |
| Total | 1,285 (100.0%) | 954 (100.0%) |
Physical Housing Characteristics in Rockwood
Housing Structures in Rockwood
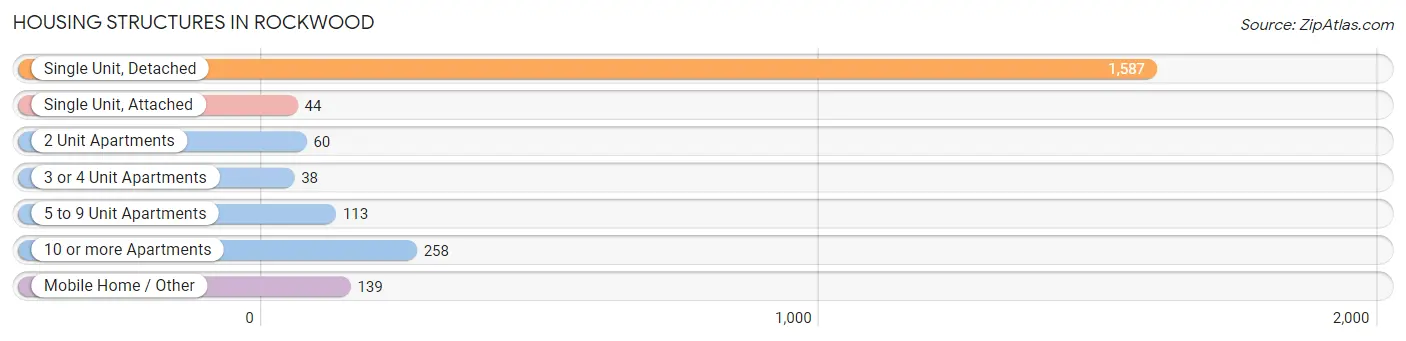
| Structure Type | # Housing Units | % Housing Units |
| Single Unit, Detached | 1,587 | 70.9% |
| Single Unit, Attached | 44 | 2.0% |
| 2 Unit Apartments | 60 | 2.7% |
| 3 or 4 Unit Apartments | 38 | 1.7% |
| 5 to 9 Unit Apartments | 113 | 5.1% |
| 10 or more Apartments | 258 | 11.5% |
| Mobile Home / Other | 139 | 6.2% |
| Total | 2,239 | 100.0% |
Housing Structures by Occupancy in Rockwood
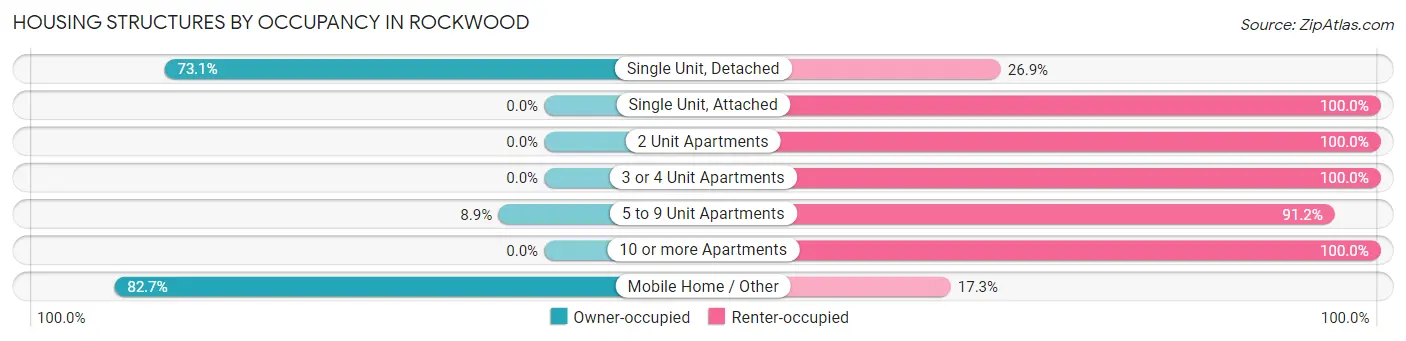
| Structure Type | Owner-occupied | Renter-occupied |
| Single Unit, Detached | 1,160 (73.1%) | 427 (26.9%) |
| Single Unit, Attached | 0 (0.0%) | 44 (100.0%) |
| 2 Unit Apartments | 0 (0.0%) | 60 (100.0%) |
| 3 or 4 Unit Apartments | 0 (0.0%) | 38 (100.0%) |
| 5 to 9 Unit Apartments | 10 (8.8%) | 103 (91.1%) |
| 10 or more Apartments | 0 (0.0%) | 258 (100.0%) |
| Mobile Home / Other | 115 (82.7%) | 24 (17.3%) |
| Total | 1,285 (57.4%) | 954 (42.6%) |
Housing Structures by Number of Rooms in Rockwood
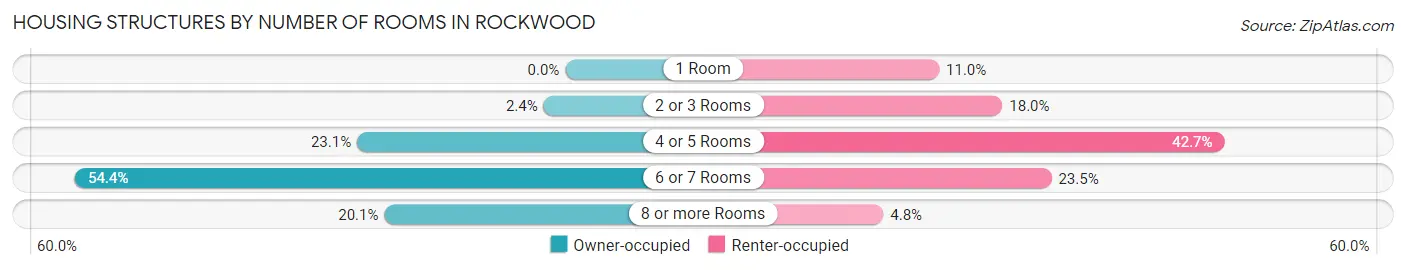
| Number of Rooms | Owner-occupied | Renter-occupied |
| 1 Room | 0 (0.0%) | 105 (11.0%) |
| 2 or 3 Rooms | 31 (2.4%) | 172 (18.0%) |
| 4 or 5 Rooms | 297 (23.1%) | 407 (42.7%) |
| 6 or 7 Rooms | 699 (54.4%) | 224 (23.5%) |
| 8 or more Rooms | 258 (20.1%) | 46 (4.8%) |
| Total | 1,285 (100.0%) | 954 (100.0%) |
Housing Structure by Heating Type in Rockwood
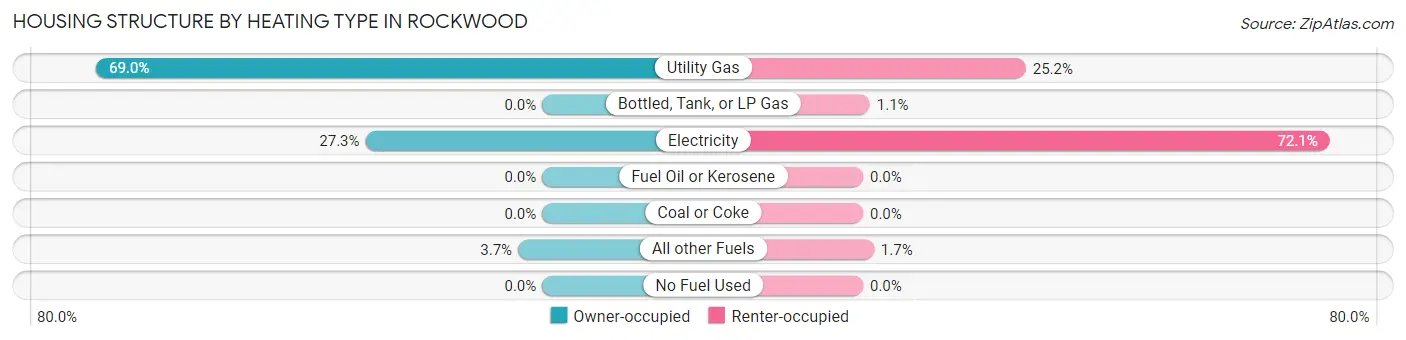
| Heating Type | Owner-occupied | Renter-occupied |
| Utility Gas | 886 (69.0%) | 240 (25.2%) |
| Bottled, Tank, or LP Gas | 0 (0.0%) | 10 (1.1%) |
| Electricity | 351 (27.3%) | 688 (72.1%) |
| Fuel Oil or Kerosene | 0 (0.0%) | 0 (0.0%) |
| Coal or Coke | 0 (0.0%) | 0 (0.0%) |
| All other Fuels | 48 (3.7%) | 16 (1.7%) |
| No Fuel Used | 0 (0.0%) | 0 (0.0%) |
| Total | 1,285 (100.0%) | 954 (100.0%) |
Household Vehicle Usage in Rockwood
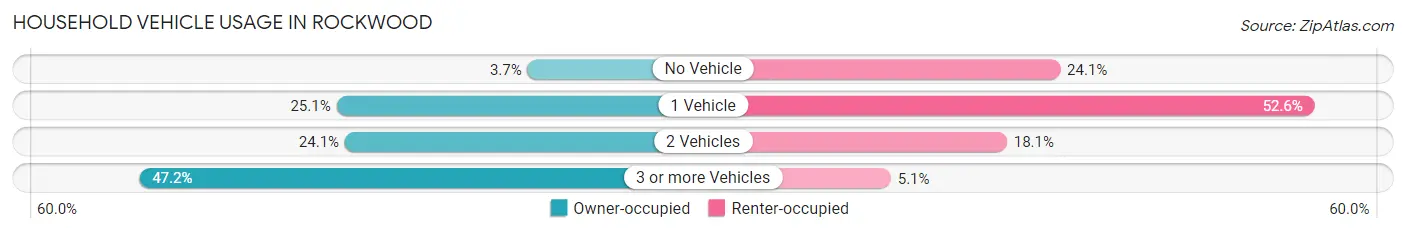
| Vehicles per Household | Owner-occupied | Renter-occupied |
| No Vehicle | 47 (3.7%) | 230 (24.1%) |
| 1 Vehicle | 322 (25.1%) | 502 (52.6%) |
| 2 Vehicles | 310 (24.1%) | 173 (18.1%) |
| 3 or more Vehicles | 606 (47.2%) | 49 (5.1%) |
| Total | 1,285 (100.0%) | 954 (100.0%) |
Real Estate & Mortgages in Rockwood
Real Estate and Mortgage Overview in Rockwood
| Characteristic | Without Mortgage | With Mortgage |
| Housing Units | 702 | 583 |
| Median Property Value | $108,200 | $139,400 |
| Median Household Income | $43,587 | $46 |
| Monthly Housing Costs | $355 | $0 |
| Real Estate Taxes | $652 | $52 |
Property Value by Mortgage Status in Rockwood
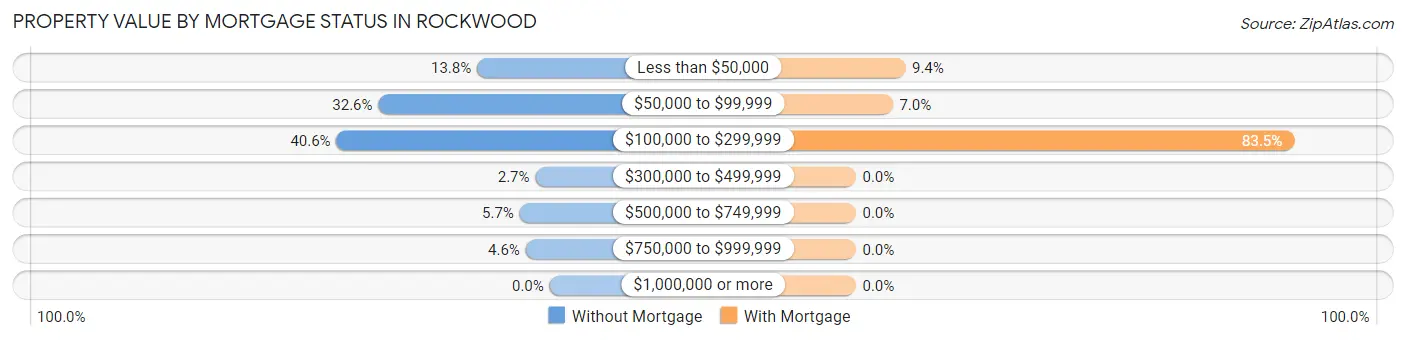
| Property Value | Without Mortgage | With Mortgage |
| Less than $50,000 | 97 (13.8%) | 55 (9.4%) |
| $50,000 to $99,999 | 229 (32.6%) | 41 (7.0%) |
| $100,000 to $299,999 | 285 (40.6%) | 487 (83.5%) |
| $300,000 to $499,999 | 19 (2.7%) | 0 (0.0%) |
| $500,000 to $749,999 | 40 (5.7%) | 0 (0.0%) |
| $750,000 to $999,999 | 32 (4.6%) | 0 (0.0%) |
| $1,000,000 or more | 0 (0.0%) | 0 (0.0%) |
| Total | 702 (100.0%) | 583 (100.0%) |
Household Income by Mortgage Status in Rockwood
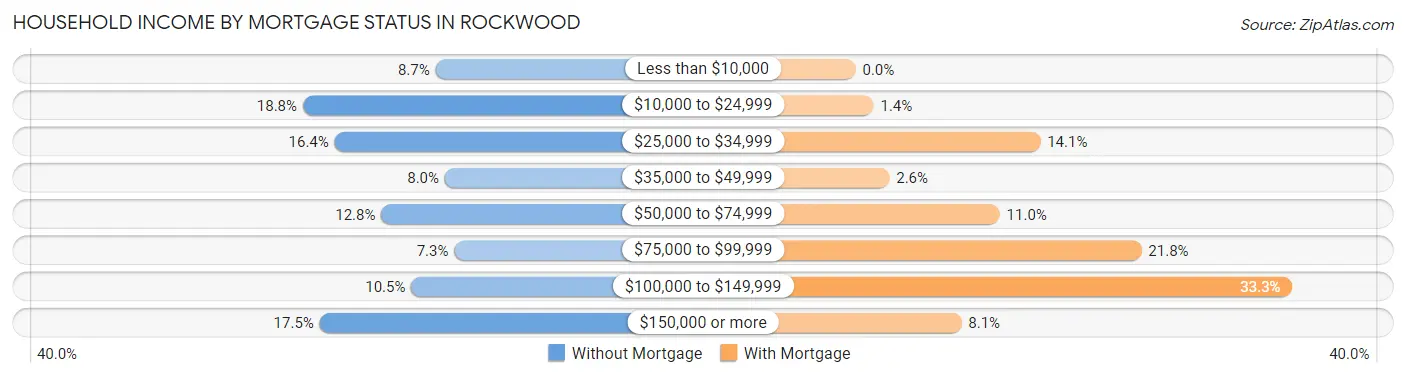
| Household Income | Without Mortgage | With Mortgage |
| Less than $10,000 | 61 (8.7%) | 0 (0.0%) |
| $10,000 to $24,999 | 132 (18.8%) | 8 (1.4%) |
| $25,000 to $34,999 | 115 (16.4%) | 82 (14.1%) |
| $35,000 to $49,999 | 56 (8.0%) | 15 (2.6%) |
| $50,000 to $74,999 | 90 (12.8%) | 64 (11.0%) |
| $75,000 to $99,999 | 51 (7.3%) | 127 (21.8%) |
| $100,000 to $149,999 | 74 (10.5%) | 194 (33.3%) |
| $150,000 or more | 123 (17.5%) | 47 (8.1%) |
| Total | 702 (100.0%) | 583 (100.0%) |
Property Value to Household Income Ratio in Rockwood
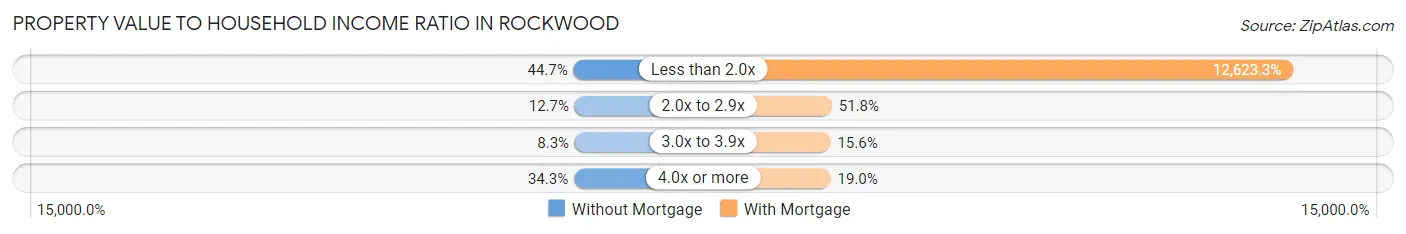
| Value-to-Income Ratio | Without Mortgage | With Mortgage |
| Less than 2.0x | 314 (44.7%) | 73,594 (12,623.3%) |
| 2.0x to 2.9x | 89 (12.7%) | 302 (51.8%) |
| 3.0x to 3.9x | 58 (8.3%) | 91 (15.6%) |
| 4.0x or more | 241 (34.3%) | 111 (19.0%) |
| Total | 702 (100.0%) | 583 (100.0%) |
Real Estate Taxes by Mortgage Status in Rockwood
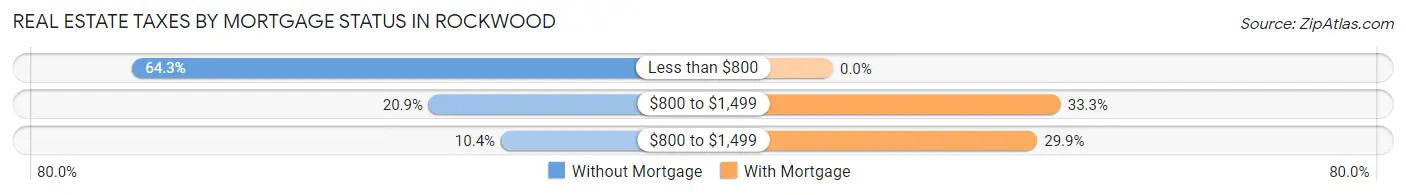
| Property Taxes | Without Mortgage | With Mortgage |
| Less than $800 | 451 (64.2%) | 0 (0.0%) |
| $800 to $1,499 | 147 (20.9%) | 194 (33.3%) |
| $800 to $1,499 | 73 (10.4%) | 174 (29.8%) |
| Total | 702 (100.0%) | 583 (100.0%) |
Health & Disability in Rockwood
Health Insurance Coverage by Age in Rockwood
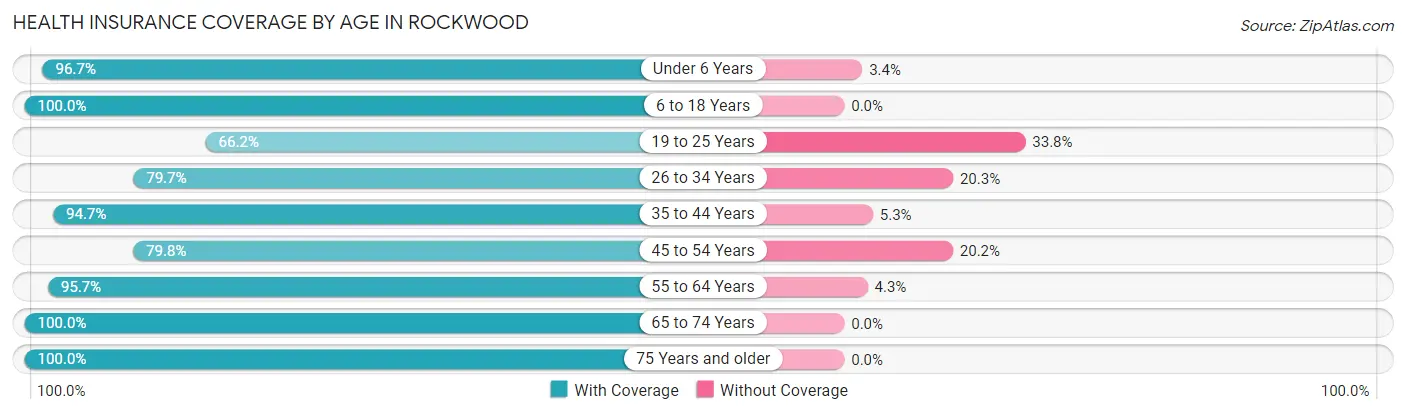
| Age Bracket | With Coverage | Without Coverage |
| Under 6 Years | 520 (96.7%) | 18 (3.4%) |
| 6 to 18 Years | 767 (100.0%) | 0 (0.0%) |
| 19 to 25 Years | 261 (66.2%) | 133 (33.8%) |
| 26 to 34 Years | 421 (79.7%) | 107 (20.3%) |
| 35 to 44 Years | 427 (94.7%) | 24 (5.3%) |
| 45 to 54 Years | 670 (79.8%) | 170 (20.2%) |
| 55 to 64 Years | 639 (95.7%) | 29 (4.3%) |
| 65 to 74 Years | 616 (100.0%) | 0 (0.0%) |
| 75 Years and older | 519 (100.0%) | 0 (0.0%) |
| Total | 4,840 (91.0%) | 481 (9.0%) |
Health Insurance Coverage by Citizenship Status in Rockwood
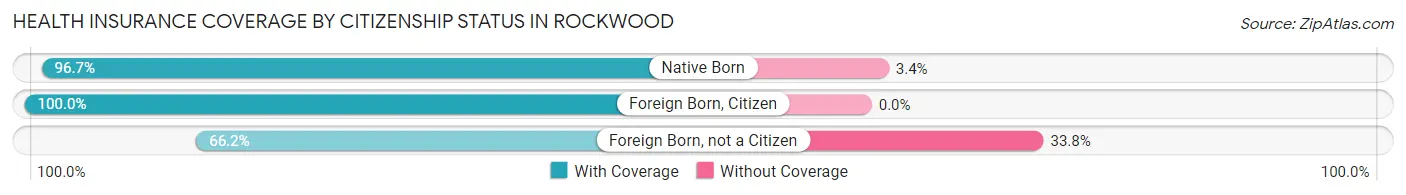
| Citizenship Status | With Coverage | Without Coverage |
| Native Born | 520 (96.7%) | 18 (3.4%) |
| Foreign Born, Citizen | 767 (100.0%) | 0 (0.0%) |
| Foreign Born, not a Citizen | 261 (66.2%) | 133 (33.8%) |
Health Insurance Coverage by Household Income in Rockwood
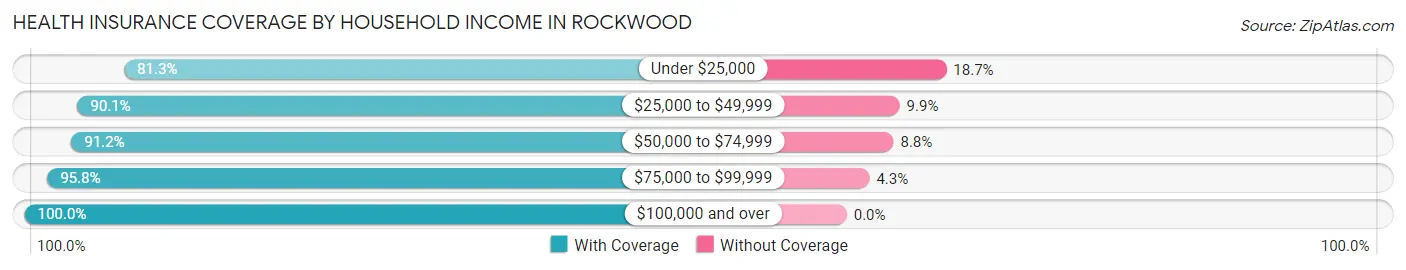
| Household Income | With Coverage | Without Coverage |
| Under $25,000 | 898 (81.3%) | 206 (18.7%) |
| $25,000 to $49,999 | 1,402 (90.1%) | 154 (9.9%) |
| $50,000 to $74,999 | 896 (91.2%) | 86 (8.8%) |
| $75,000 to $99,999 | 789 (95.8%) | 35 (4.3%) |
| $100,000 and over | 775 (100.0%) | 0 (0.0%) |
Public vs Private Health Insurance Coverage by Age in Rockwood
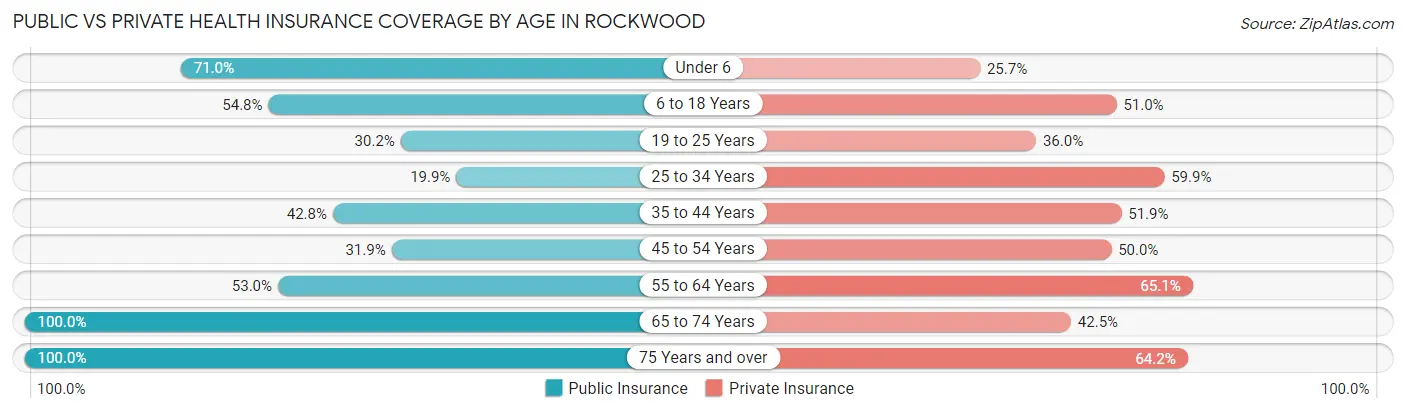
| Age Bracket | Public Insurance | Private Insurance |
| Under 6 | 382 (71.0%) | 138 (25.7%) |
| 6 to 18 Years | 420 (54.8%) | 391 (51.0%) |
| 19 to 25 Years | 119 (30.2%) | 142 (36.0%) |
| 25 to 34 Years | 105 (19.9%) | 316 (59.9%) |
| 35 to 44 Years | 193 (42.8%) | 234 (51.9%) |
| 45 to 54 Years | 268 (31.9%) | 420 (50.0%) |
| 55 to 64 Years | 354 (53.0%) | 435 (65.1%) |
| 65 to 74 Years | 616 (100.0%) | 262 (42.5%) |
| 75 Years and over | 519 (100.0%) | 333 (64.2%) |
| Total | 2,976 (55.9%) | 2,671 (50.2%) |
Disability Status by Sex by Age in Rockwood
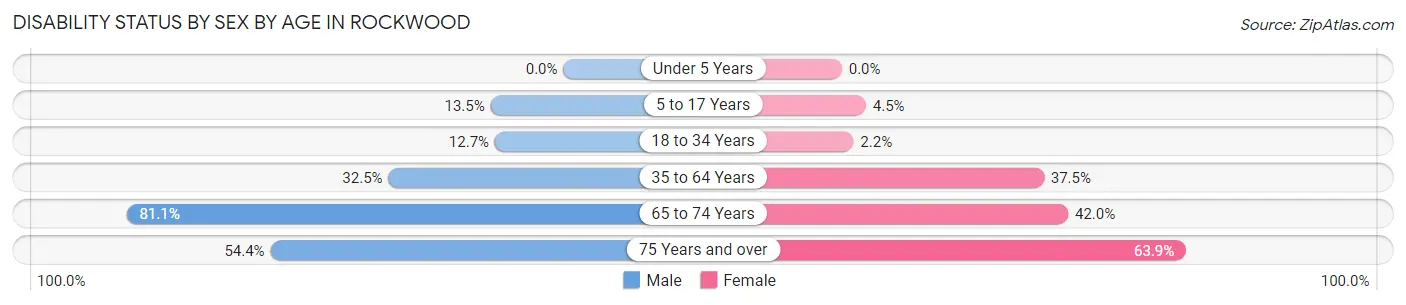
| Age Bracket | Male | Female |
| Under 5 Years | 0 (0.0%) | 0 (0.0%) |
| 5 to 17 Years | 47 (13.5%) | 23 (4.5%) |
| 18 to 34 Years | 62 (12.7%) | 11 (2.1%) |
| 35 to 64 Years | 313 (32.5%) | 373 (37.5%) |
| 65 to 74 Years | 150 (81.1%) | 181 (42.0%) |
| 75 Years and over | 112 (54.4%) | 200 (63.9%) |
Disability Class by Sex by Age in Rockwood
Disability Class: Hearing Difficulty
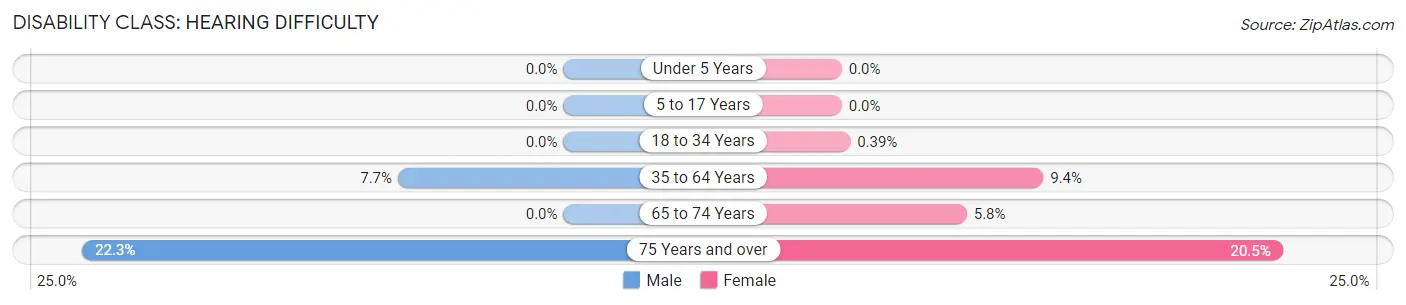
| Age Bracket | Male | Female |
| Under 5 Years | 0 (0.0%) | 0 (0.0%) |
| 5 to 17 Years | 0 (0.0%) | 0 (0.0%) |
| 18 to 34 Years | 0 (0.0%) | 2 (0.4%) |
| 35 to 64 Years | 74 (7.7%) | 93 (9.3%) |
| 65 to 74 Years | 0 (0.0%) | 25 (5.8%) |
| 75 Years and over | 46 (22.3%) | 64 (20.4%) |
Disability Class: Vision Difficulty
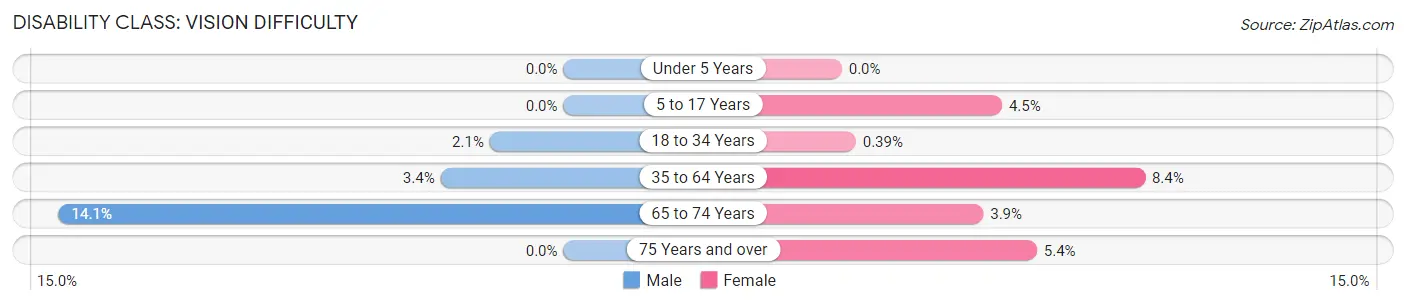
| Age Bracket | Male | Female |
| Under 5 Years | 0 (0.0%) | 0 (0.0%) |
| 5 to 17 Years | 0 (0.0%) | 23 (4.5%) |
| 18 to 34 Years | 10 (2.1%) | 2 (0.4%) |
| 35 to 64 Years | 33 (3.4%) | 84 (8.4%) |
| 65 to 74 Years | 26 (14.1%) | 17 (3.9%) |
| 75 Years and over | 0 (0.0%) | 17 (5.4%) |
Disability Class: Cognitive Difficulty
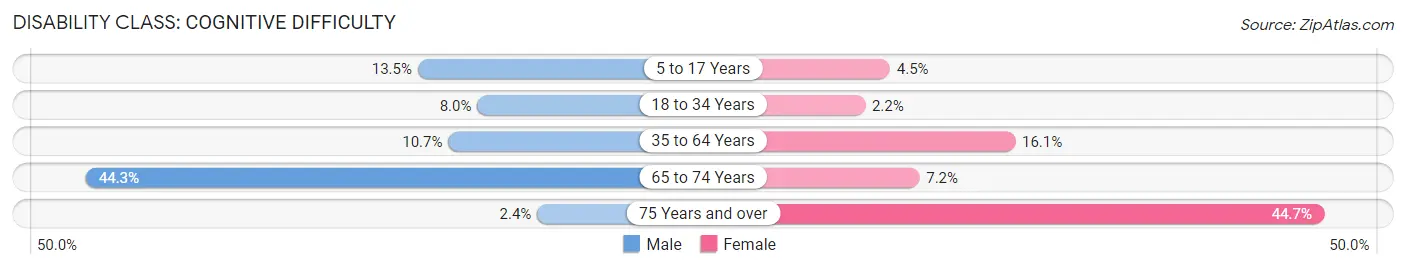
| Age Bracket | Male | Female |
| 5 to 17 Years | 47 (13.5%) | 23 (4.5%) |
| 18 to 34 Years | 39 (8.0%) | 11 (2.1%) |
| 35 to 64 Years | 103 (10.7%) | 160 (16.1%) |
| 65 to 74 Years | 82 (44.3%) | 31 (7.2%) |
| 75 Years and over | 5 (2.4%) | 140 (44.7%) |
Disability Class: Ambulatory Difficulty
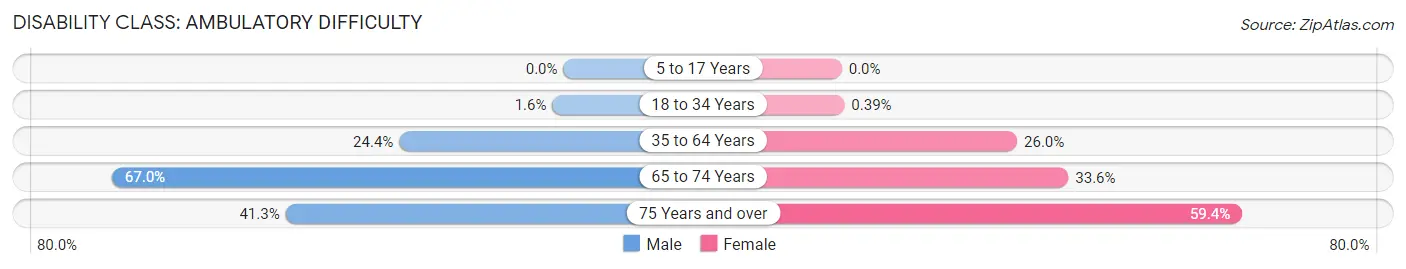
| Age Bracket | Male | Female |
| 5 to 17 Years | 0 (0.0%) | 0 (0.0%) |
| 18 to 34 Years | 8 (1.6%) | 2 (0.4%) |
| 35 to 64 Years | 235 (24.4%) | 259 (26.0%) |
| 65 to 74 Years | 124 (67.0%) | 145 (33.6%) |
| 75 Years and over | 85 (41.3%) | 186 (59.4%) |
Disability Class: Self-Care Difficulty
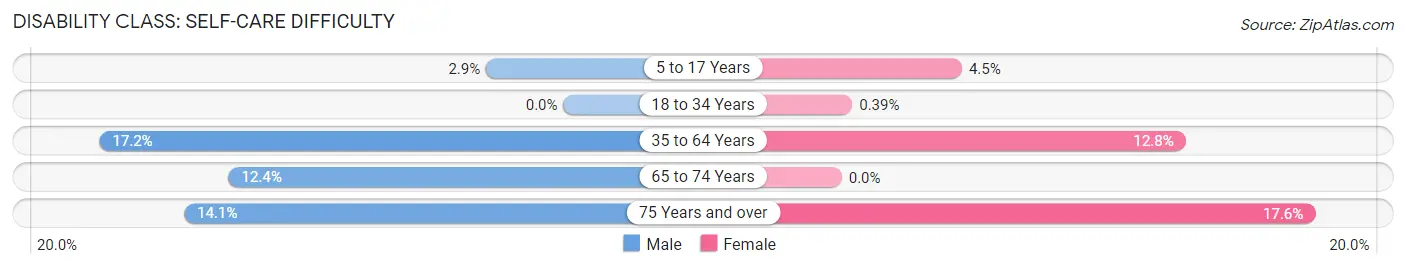
| Age Bracket | Male | Female |
| 5 to 17 Years | 10 (2.9%) | 23 (4.5%) |
| 18 to 34 Years | 0 (0.0%) | 2 (0.4%) |
| 35 to 64 Years | 166 (17.2%) | 127 (12.8%) |
| 65 to 74 Years | 23 (12.4%) | 0 (0.0%) |
| 75 Years and over | 29 (14.1%) | 55 (17.6%) |
Technology Access in Rockwood
Computing Device Access in Rockwood
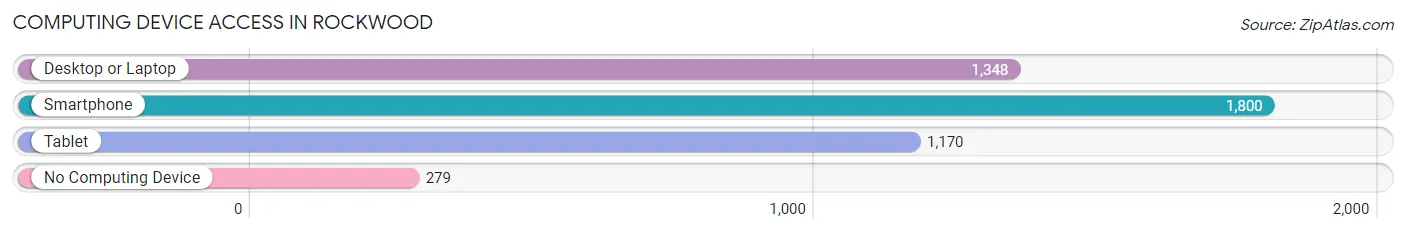
| Device Type | # Households | % Households |
| Desktop or Laptop | 1,348 | 60.2% |
| Smartphone | 1,800 | 80.4% |
| Tablet | 1,170 | 52.3% |
| No Computing Device | 279 | 12.5% |
| Total | 2,239 | 100.0% |
Internet Access in Rockwood
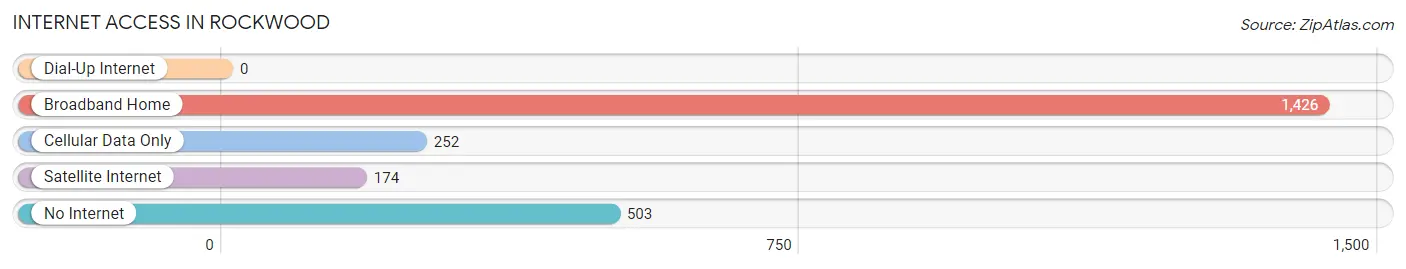
| Internet Type | # Households | % Households |
| Dial-Up Internet | 0 | 0.0% |
| Broadband Home | 1,426 | 63.7% |
| Cellular Data Only | 252 | 11.3% |
| Satellite Internet | 174 | 7.8% |
| No Internet | 503 | 22.5% |
| Total | 2,239 | 100.0% |
Rockwood Summary
Wood, Tennessee is a small town located in Roane County, Tennessee. It is situated on the banks of the Clinch River, and is part of the Knoxville Metropolitan Statistical Area. The town has a population of approximately 5,000 people, and is known for its rural charm and friendly atmosphere.
History
The area that is now Rockwood was first settled in the early 1800s by settlers from North Carolina and Virginia. The town was originally known as “Rocky Point”, and was later renamed “Rockwood” in 1854. The town was incorporated in 1856, and the first post office was established in 1858.
The town was an important stop on the East Tennessee and Georgia Railroad, which ran from Chattanooga to Knoxville. The railroad brought economic growth to the area, and the town quickly became a center for industry and commerce. The town was also home to several coal mines, which provided employment for many of the town’s residents.
In the early 1900s, Rockwood was a popular tourist destination, and many of the town’s buildings were built in the Victorian style. The town was also home to several resorts, including the Rockwood Hotel, which was built in the late 1800s.
Geography
Rockwood is located in Roane County, Tennessee, and is situated on the banks of the Clinch River. The town is located approximately 25 miles west of Knoxville, and is part of the Knoxville Metropolitan Statistical Area. The town is located in the foothills of the Great Smoky Mountains, and is surrounded by rolling hills and lush forests.
The town has a humid subtropical climate, with hot summers and mild winters. The average annual temperature is around 60 degrees Fahrenheit, and the average annual precipitation is around 45 inches.
Economy
The economy of Rockwood is largely based on tourism and manufacturing. The town is home to several tourist attractions, including the Rockwood Hotel, which is a popular destination for visitors. The town is also home to several manufacturing companies, including a paper mill and a furniture factory.
The town is also home to several small businesses, including restaurants, shops, and other services. The town is also home to several farms, which produce a variety of crops, including corn, soybeans, and hay.
Demographics
As of the 2010 census, the population of Rockwood was 5,039. The racial makeup of the town was 95.3% White, 1.3% African American, 0.3% Native American, 0.3% Asian, 0.1% Pacific Islander, and 2.7% from other races. The median household income was $35,945, and the median family income was $41,945.
Conclusion
Rockwood, Tennessee is a small town located in Roane County, Tennessee. It is situated on the banks of the Clinch River, and is part of the Knoxville Metropolitan Statistical Area. The town has a population of approximately 5,000 people, and is known for its rural charm and friendly atmosphere. The economy of Rockwood is largely based on tourism and manufacturing, and the town is home to several tourist attractions, manufacturing companies, and small businesses. The racial makeup of the town is predominantly White, with a small percentage of African American, Native American, Asian, and Pacific Islander residents.
Common Questions
What is Per Capita Income in Rockwood?
Per Capita income in Rockwood is $28,667.
What is the Median Family Income in Rockwood?
Median Family Income in Rockwood is $59,318.
What is the Median Household income in Rockwood?
Median Household Income in Rockwood is $43,309.
What is Income or Wage Gap in Rockwood?
Income or Wage Gap in Rockwood is 54.8%.
Women in Rockwood earn 45.2 cents for every dollar earned by a man.
What is Inequality or Gini Index in Rockwood?
Inequality or Gini Index in Rockwood is 0.54.
What is the Total Population of Rockwood?
Total Population of Rockwood is 5,468.
What is the Total Male Population of Rockwood?
Total Male Population of Rockwood is 2,510.
What is the Total Female Population of Rockwood?
Total Female Population of Rockwood is 2,958.
What is the Ratio of Males per 100 Females in Rockwood?
There are 84.85 Males per 100 Females in Rockwood.
What is the Ratio of Females per 100 Males in Rockwood?
There are 117.85 Females per 100 Males in Rockwood.
What is the Median Population Age in Rockwood?
Median Population Age in Rockwood is 45.5 Years.
What is the Average Family Size in Rockwood
Average Family Size in Rockwood is 3.0 People.
What is the Average Household Size in Rockwood
Average Household Size in Rockwood is 2.3 People.
How Large is the Labor Force in Rockwood?
There are 2,178 People in the Labor Forcein in Rockwood.
What is the Percentage of People in the Labor Force in Rockwood?
47.8% of People are in the Labor Force in Rockwood.
What is the Unemployment Rate in Rockwood?
Unemployment Rate in Rockwood is 7.6%.