Kingston Springs, TN Map & Demographics
Kingston Springs Map
Kingston Springs Overview
$44,830
PER CAPITA INCOME
$99,432
AVG FAMILY INCOME
$92,159
AVG HOUSEHOLD INCOME
38.9%
WAGE / INCOME GAP [ % ]
61.1¢/ $1
WAGE / INCOME GAP [ $ ]
0.44
INEQUALITY / GINI INDEX
2,798
TOTAL POPULATION
1,360
MALE POPULATION
1,438
FEMALE POPULATION
94.58
MALES / 100 FEMALES
105.74
FEMALES / 100 MALES
38.7
MEDIAN AGE
2.9
AVG FAMILY SIZE
2.7
AVG HOUSEHOLD SIZE
1,437
LABOR FORCE [ PEOPLE ]
65.0%
PERCENT IN LABOR FORCE
3.8%
UNEMPLOYMENT RATE
Kingston Springs Zip Codes
Kingston Springs Area Codes
Income in Kingston Springs
Income Overview in Kingston Springs
Per Capita Income in Kingston Springs is $44,830, while median incomes of families and households are $99,432 and $92,159 respectively.
| Characteristic | Number | Measure |
| Per Capita Income | 2,798 | $44,830 |
| Median Family Income | 795 | $99,432 |
| Mean Family Income | 795 | $123,067 |
| Median Household Income | 1,029 | $92,159 |
| Mean Household Income | 1,029 | $118,169 |
| Income Deficit | 795 | $0 |
| Wage / Income Gap (%) | 2,798 | 38.88% |
| Wage / Income Gap ($) | 2,798 | 61.12¢ per $1 |
| Gini / Inequality Index | 2,798 | 0.44 |
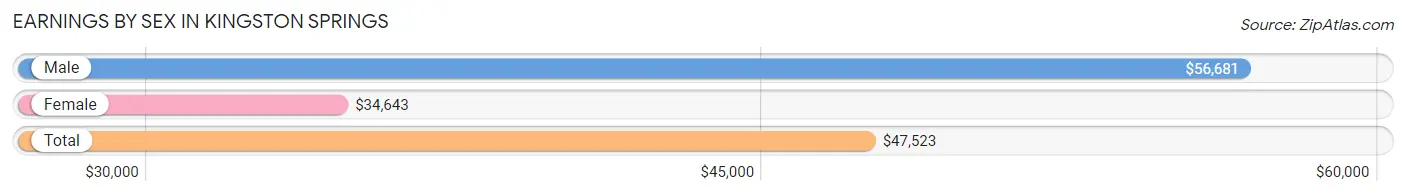
Earnings by Sex in Kingston Springs
Average Earnings in Kingston Springs are $47,523, $56,681 for men and $34,643 for women, a difference of 38.9%.
| Sex | Number | Average Earnings |
| Male | 769 (50.5%) | $56,681 |
| Female | 754 (49.5%) | $34,643 |
| Total | 1,523 (100.0%) | $47,523 |
Earnings by Sex by Income Bracket in Kingston Springs
The most common earnings brackets in Kingston Springs are $100,000+ for men (153 | 19.9%) and $75,000 to $99,999 for women (78 | 10.3%).
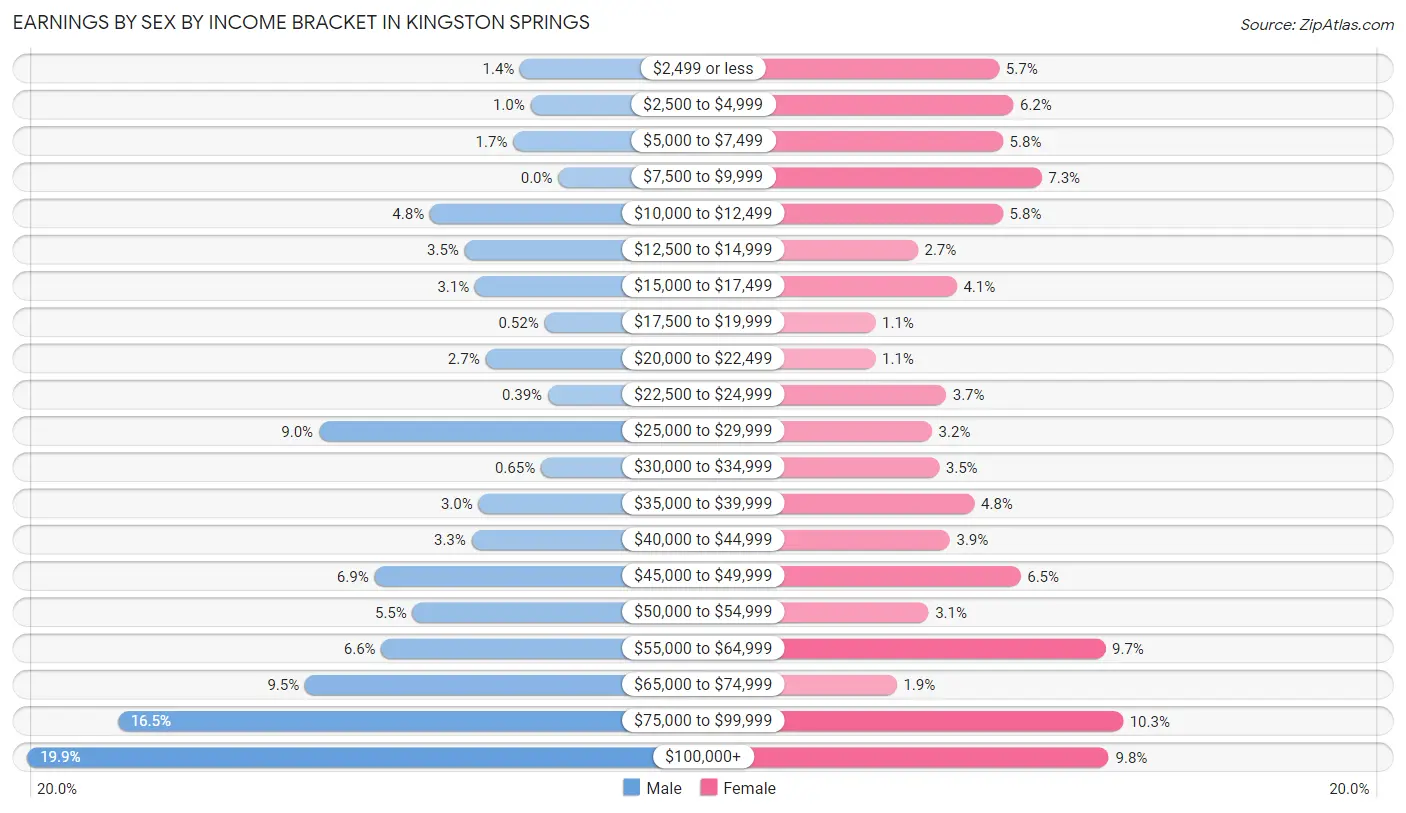
| Income | Male | Female |
| $2,499 or less | 11 (1.4%) | 43 (5.7%) |
| $2,500 to $4,999 | 8 (1.0%) | 47 (6.2%) |
| $5,000 to $7,499 | 13 (1.7%) | 44 (5.8%) |
| $7,500 to $9,999 | 0 (0.0%) | 55 (7.3%) |
| $10,000 to $12,499 | 37 (4.8%) | 44 (5.8%) |
| $12,500 to $14,999 | 27 (3.5%) | 20 (2.6%) |
| $15,000 to $17,499 | 24 (3.1%) | 31 (4.1%) |
| $17,500 to $19,999 | 4 (0.5%) | 8 (1.1%) |
| $20,000 to $22,499 | 21 (2.7%) | 8 (1.1%) |
| $22,500 to $24,999 | 3 (0.4%) | 28 (3.7%) |
| $25,000 to $29,999 | 69 (9.0%) | 24 (3.2%) |
| $30,000 to $34,999 | 5 (0.6%) | 26 (3.5%) |
| $35,000 to $39,999 | 23 (3.0%) | 36 (4.8%) |
| $40,000 to $44,999 | 25 (3.3%) | 29 (3.8%) |
| $45,000 to $49,999 | 53 (6.9%) | 49 (6.5%) |
| $50,000 to $54,999 | 42 (5.5%) | 23 (3.0%) |
| $55,000 to $64,999 | 51 (6.6%) | 73 (9.7%) |
| $65,000 to $74,999 | 73 (9.5%) | 14 (1.9%) |
| $75,000 to $99,999 | 127 (16.5%) | 78 (10.3%) |
| $100,000+ | 153 (19.9%) | 74 (9.8%) |
| Total | 769 (100.0%) | 754 (100.0%) |
Earnings by Sex by Educational Attainment in Kingston Springs
Average earnings in Kingston Springs are $62,292 for men and $44,408 for women, a difference of 28.7%. Men with an educational attainment of college or associate's degree enjoy the highest average annual earnings of $81,500, while those with less than high school education earn the least with $45,515. Women with an educational attainment of bachelor's degree earn the most with the average annual earnings of $59,038, while those with college or associate's degree education have the smallest earnings of $29,773.
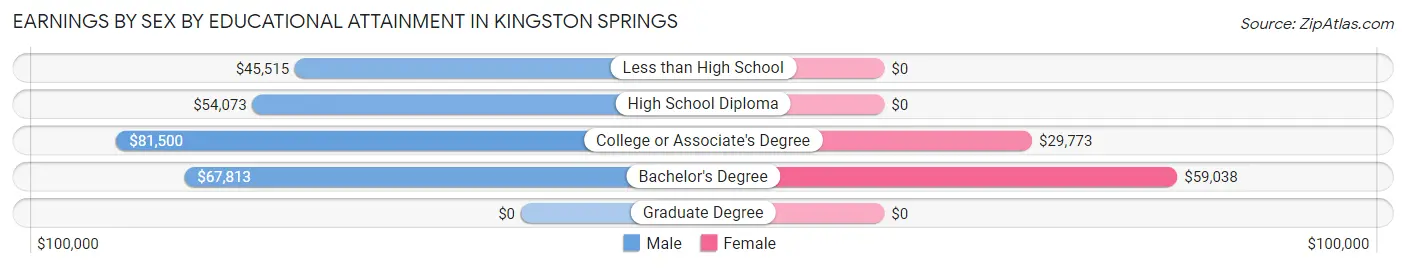
| Educational Attainment | Male Income | Female Income |
| Less than High School | $45,515 | $0 |
| High School Diploma | $54,073 | $0 |
| College or Associate's Degree | $81,500 | $29,773 |
| Bachelor's Degree | $67,813 | $59,038 |
| Graduate Degree | - | - |
| Total | $62,292 | $44,408 |
Family Income in Kingston Springs
Family Income Brackets in Kingston Springs
According to the Kingston Springs family income data, there are 226 families falling into the $100,000 to $149,999 income range, which is the most common income bracket and makes up 28.4% of all families. Conversely, the $10,000 to $14,999 income bracket is the least frequent group with only 6 families (0.7%) belonging to this category.
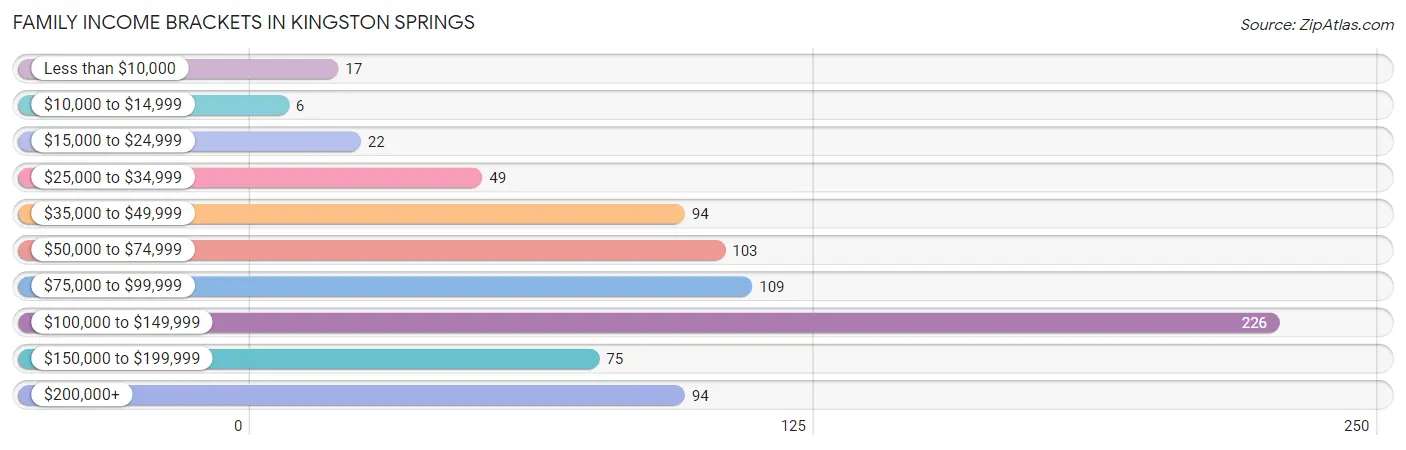
| Income Bracket | # Families | % Families |
| Less than $10,000 | 17 | 2.1% |
| $10,000 to $14,999 | 6 | 0.8% |
| $15,000 to $24,999 | 22 | 2.8% |
| $25,000 to $34,999 | 49 | 6.2% |
| $35,000 to $49,999 | 94 | 11.8% |
| $50,000 to $74,999 | 103 | 13.0% |
| $75,000 to $99,999 | 109 | 13.7% |
| $100,000 to $149,999 | 226 | 28.4% |
| $150,000 to $199,999 | 75 | 9.4% |
| $200,000+ | 94 | 11.8% |
Family Income by Famaliy Size in Kingston Springs
6-person families (21 | 2.6%) account for the highest median family income in Kingston Springs with $196,750 per family, while 3-person families (177 | 22.3%) have the highest median income of $38,694 per family member.
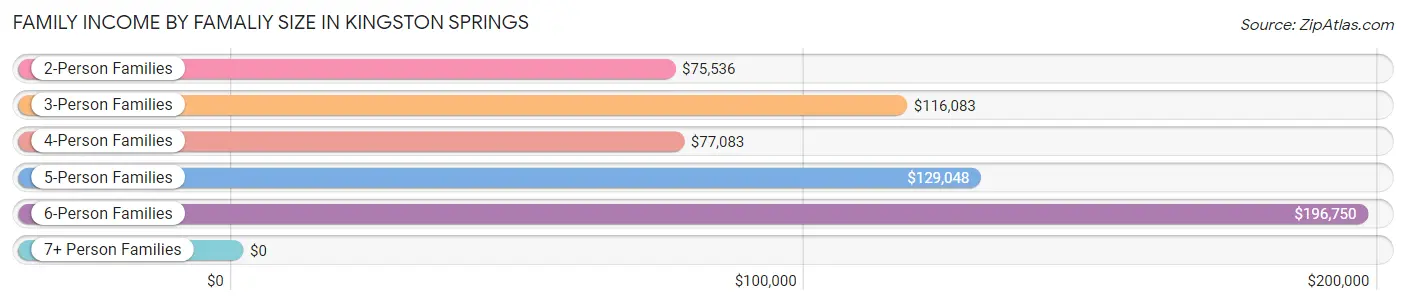
| Income Bracket | # Families | Median Income |
| 2-Person Families | 405 (50.9%) | $75,536 |
| 3-Person Families | 177 (22.3%) | $116,083 |
| 4-Person Families | 144 (18.1%) | $77,083 |
| 5-Person Families | 48 (6.0%) | $129,048 |
| 6-Person Families | 21 (2.6%) | $196,750 |
| 7+ Person Families | 0 (0.0%) | $0 |
| Total | 795 (100.0%) | $99,432 |
Family Income by Number of Earners in Kingston Springs
The median family income in Kingston Springs is $99,432, with families comprising 3+ earners (68) having the highest median family income of $196,944, while families with no earners (146) have the lowest median family income of $54,688, accounting for 8.6% and 18.4% of families, respectively.
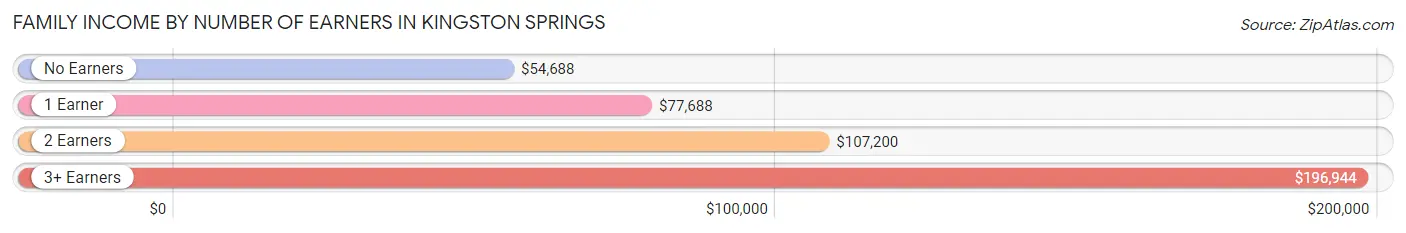
| Number of Earners | # Families | Median Income |
| No Earners | 146 (18.4%) | $54,688 |
| 1 Earner | 213 (26.8%) | $77,688 |
| 2 Earners | 368 (46.3%) | $107,200 |
| 3+ Earners | 68 (8.6%) | $196,944 |
| Total | 795 (100.0%) | $99,432 |
Household Income in Kingston Springs
Household Income Brackets in Kingston Springs
With 253 households falling in the category, the $100,000 to $149,999 income range is the most frequent in Kingston Springs, accounting for 24.6% of all households. In contrast, only 6 households (0.6%) fall into the $10,000 to $14,999 income bracket, making it the least populous group.
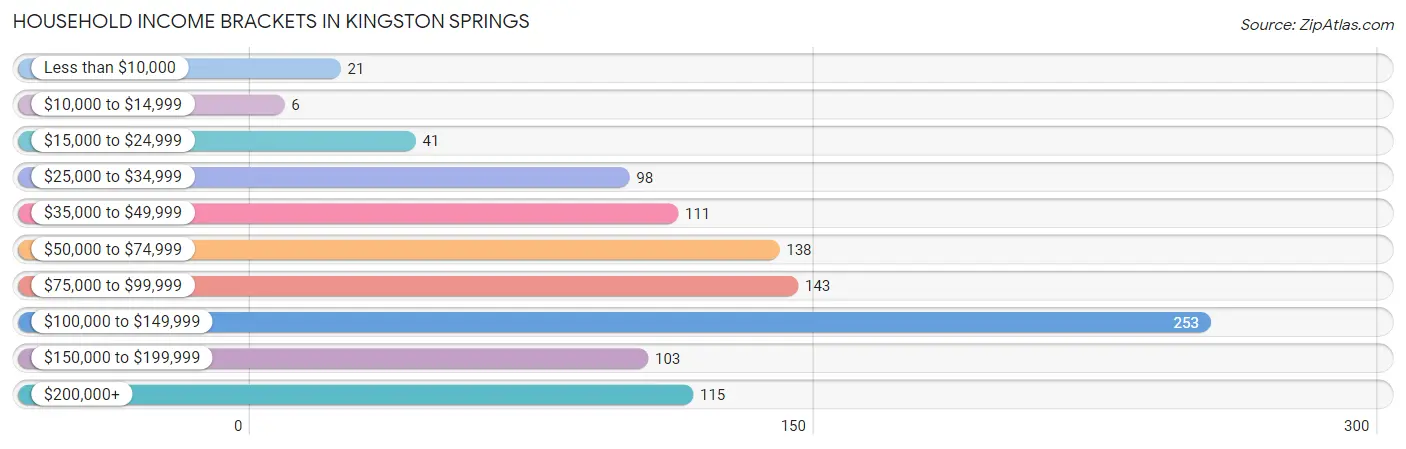
| Income Bracket | # Households | % Households |
| Less than $10,000 | 21 | 2.0% |
| $10,000 to $14,999 | 6 | 0.6% |
| $15,000 to $24,999 | 41 | 4.0% |
| $25,000 to $34,999 | 98 | 9.5% |
| $35,000 to $49,999 | 111 | 10.8% |
| $50,000 to $74,999 | 138 | 13.4% |
| $75,000 to $99,999 | 143 | 13.9% |
| $100,000 to $149,999 | 253 | 24.6% |
| $150,000 to $199,999 | 103 | 10.0% |
| $200,000+ | 115 | 11.2% |
Household Income by Householder Age in Kingston Springs
The median household income in Kingston Springs is $92,159, with the highest median household income of $108,750 found in the 25 to 44 years age bracket for the primary householder. A total of 326 households (31.7%) fall into this category. Meanwhile, the 65+ years age bracket for the primary householder has the lowest median household income of $53,529, with 332 households (32.3%) in this group.
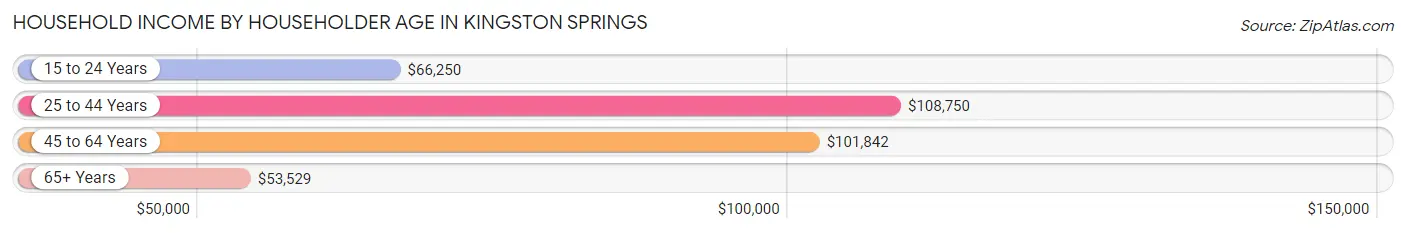
| Income Bracket | # Households | Median Income |
| 15 to 24 Years | 17 (1.7%) | $66,250 |
| 25 to 44 Years | 326 (31.7%) | $108,750 |
| 45 to 64 Years | 354 (34.4%) | $101,842 |
| 65+ Years | 332 (32.3%) | $53,529 |
| Total | 1,029 (100.0%) | $92,159 |
Poverty in Kingston Springs
Income Below Poverty by Sex and Age in Kingston Springs
With 3.1% poverty level for males and 11.7% for females among the residents of Kingston Springs, 45 to 54 year old males and 18 to 24 year old females are the most vulnerable to poverty, with 27 males (16.4%) and 76 females (40.0%) in their respective age groups living below the poverty level.
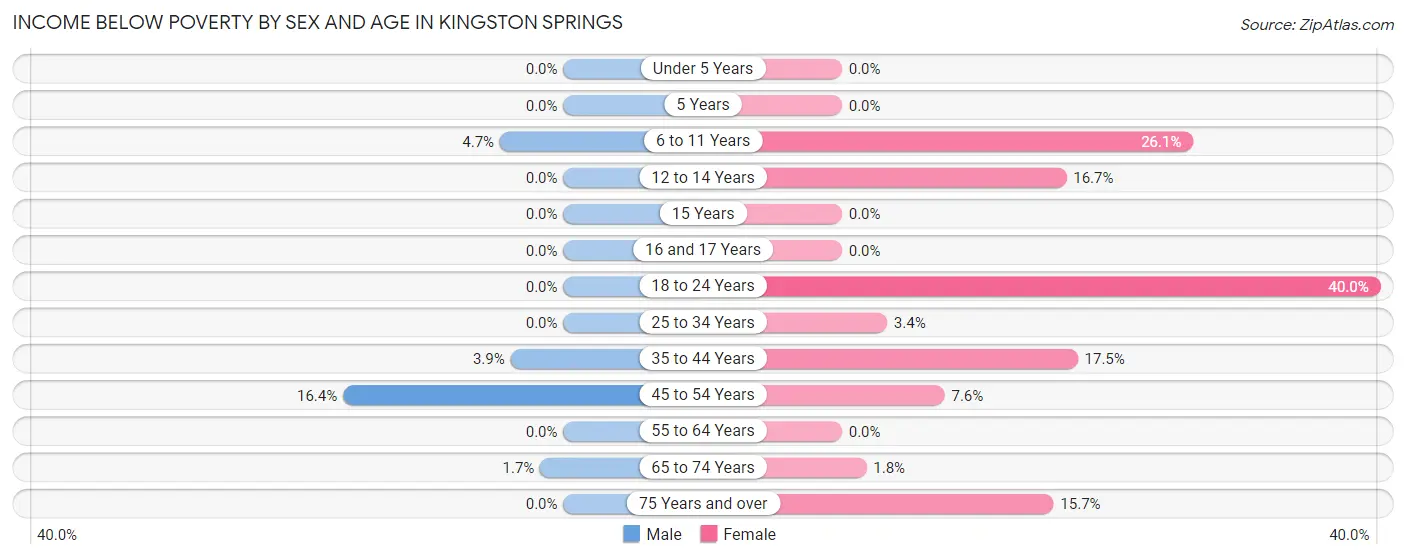
| Age Bracket | Male | Female |
| Under 5 Years | 0 (0.0%) | 0 (0.0%) |
| 5 Years | 0 (0.0%) | 0 (0.0%) |
| 6 to 11 Years | 4 (4.7%) | 18 (26.1%) |
| 12 to 14 Years | 0 (0.0%) | 9 (16.7%) |
| 15 Years | 0 (0.0%) | 0 (0.0%) |
| 16 and 17 Years | 0 (0.0%) | 0 (0.0%) |
| 18 to 24 Years | 0 (0.0%) | 76 (40.0%) |
| 25 to 34 Years | 0 (0.0%) | 6 (3.4%) |
| 35 to 44 Years | 8 (3.9%) | 31 (17.5%) |
| 45 to 54 Years | 27 (16.4%) | 10 (7.6%) |
| 55 to 64 Years | 0 (0.0%) | 0 (0.0%) |
| 65 to 74 Years | 3 (1.7%) | 4 (1.8%) |
| 75 Years and over | 0 (0.0%) | 11 (15.7%) |
| Total | 42 (3.1%) | 165 (11.7%) |
Income Above Poverty by Sex and Age in Kingston Springs
According to the poverty statistics in Kingston Springs, males aged under 5 years and females aged under 5 years are the age groups that are most secure financially, with 100.0% of males and 100.0% of females in these age groups living above the poverty line.
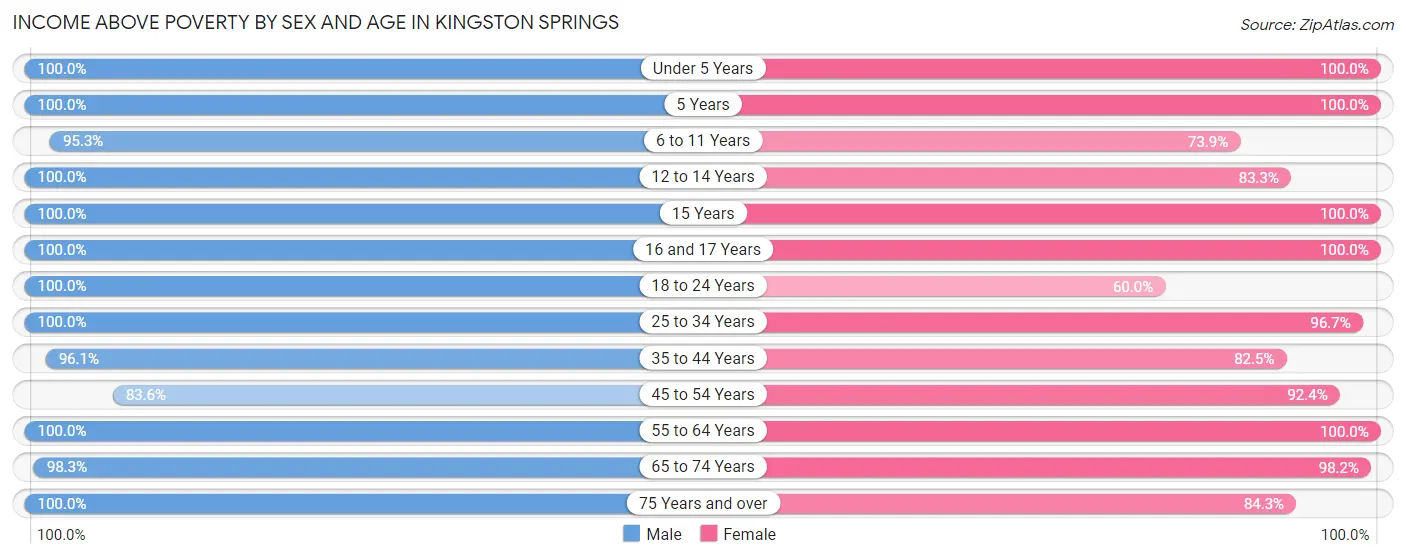
| Age Bracket | Male | Female |
| Under 5 Years | 73 (100.0%) | 122 (100.0%) |
| 5 Years | 17 (100.0%) | 13 (100.0%) |
| 6 to 11 Years | 81 (95.3%) | 51 (73.9%) |
| 12 to 14 Years | 89 (100.0%) | 45 (83.3%) |
| 15 Years | 4 (100.0%) | 16 (100.0%) |
| 16 and 17 Years | 18 (100.0%) | 33 (100.0%) |
| 18 to 24 Years | 88 (100.0%) | 114 (60.0%) |
| 25 to 34 Years | 169 (100.0%) | 173 (96.7%) |
| 35 to 44 Years | 196 (96.1%) | 146 (82.5%) |
| 45 to 54 Years | 138 (83.6%) | 121 (92.4%) |
| 55 to 64 Years | 157 (100.0%) | 141 (100.0%) |
| 65 to 74 Years | 171 (98.3%) | 216 (98.2%) |
| 75 Years and over | 95 (100.0%) | 59 (84.3%) |
| Total | 1,296 (96.9%) | 1,250 (88.3%) |
Income Below Poverty Among Married-Couple Families in Kingston Springs
The poverty statistics for married-couple families in Kingston Springs show that 1.1% or 6 of the total 533 families live below the poverty line. Families with no children have the highest poverty rate of 1.8%, comprising of 6 families. On the other hand, families with 1 or 2 children have the lowest poverty rate of 0.0%, which includes 0 families.
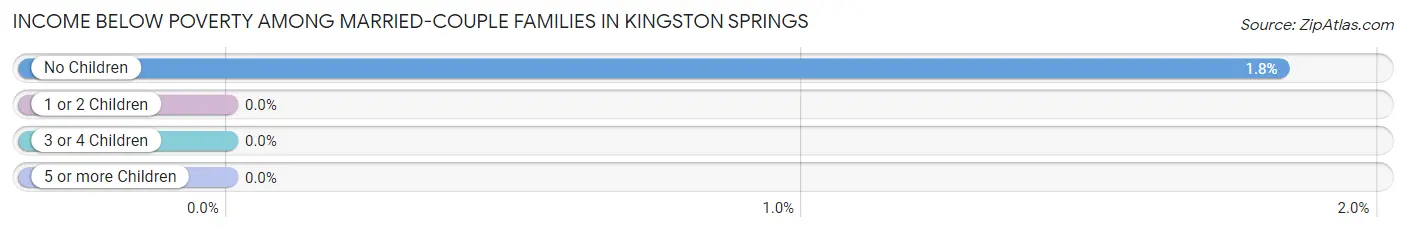
| Children | Above Poverty | Below Poverty |
| No Children | 321 (98.2%) | 6 (1.8%) |
| 1 or 2 Children | 156 (100.0%) | 0 (0.0%) |
| 3 or 4 Children | 50 (100.0%) | 0 (0.0%) |
| 5 or more Children | 0 (0.0%) | 0 (0.0%) |
| Total | 527 (98.9%) | 6 (1.1%) |
Income Below Poverty Among Single-Parent Households in Kingston Springs
According to the poverty data in Kingston Springs, 6.0% or 9 single-father households and 16.8% or 19 single-mother households are living below the poverty line. Among single-father households, those with 1 or 2 children have the highest poverty rate, with 9 households (7.5%) experiencing poverty. Likewise, among single-mother households, those with 3 or 4 children have the highest poverty rate, with 4 households (100.0%) falling below the poverty line.
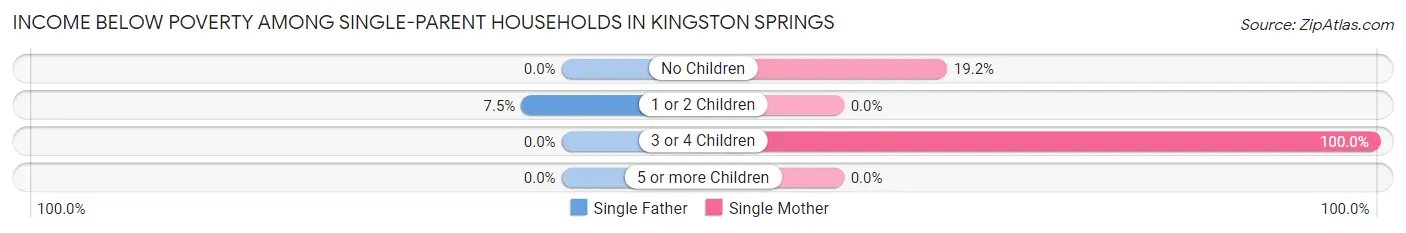
| Children | Single Father | Single Mother |
| No Children | 0 (0.0%) | 15 (19.2%) |
| 1 or 2 Children | 9 (7.5%) | 0 (0.0%) |
| 3 or 4 Children | 0 (0.0%) | 4 (100.0%) |
| 5 or more Children | 0 (0.0%) | 0 (0.0%) |
| Total | 9 (6.0%) | 19 (16.8%) |
Income Below Poverty Among Married-Couple vs Single-Parent Households in Kingston Springs
The poverty data for Kingston Springs shows that 6 of the married-couple family households (1.1%) and 28 of the single-parent households (10.7%) are living below the poverty level. Within the married-couple family households, those with no children have the highest poverty rate, with 6 households (1.8%) falling below the poverty line. Among the single-parent households, those with 3 or 4 children have the highest poverty rate, with 4 household (50.0%) living below poverty.
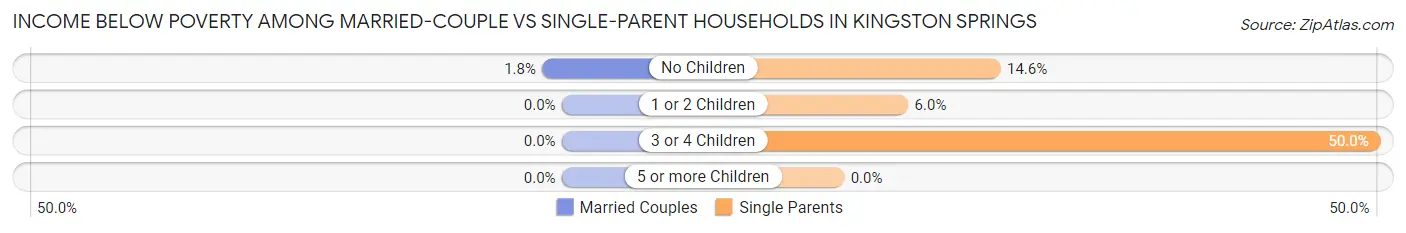
| Children | Married-Couple Families | Single-Parent Households |
| No Children | 6 (1.8%) | 15 (14.6%) |
| 1 or 2 Children | 0 (0.0%) | 9 (6.0%) |
| 3 or 4 Children | 0 (0.0%) | 4 (50.0%) |
| 5 or more Children | 0 (0.0%) | 0 (0.0%) |
| Total | 6 (1.1%) | 28 (10.7%) |
Race in Kingston Springs
The most populous races in Kingston Springs are White / Caucasian (2,554 | 91.3%), Two or more Races (174 | 6.2%), and Hispanic or Latino (91 | 3.3%).
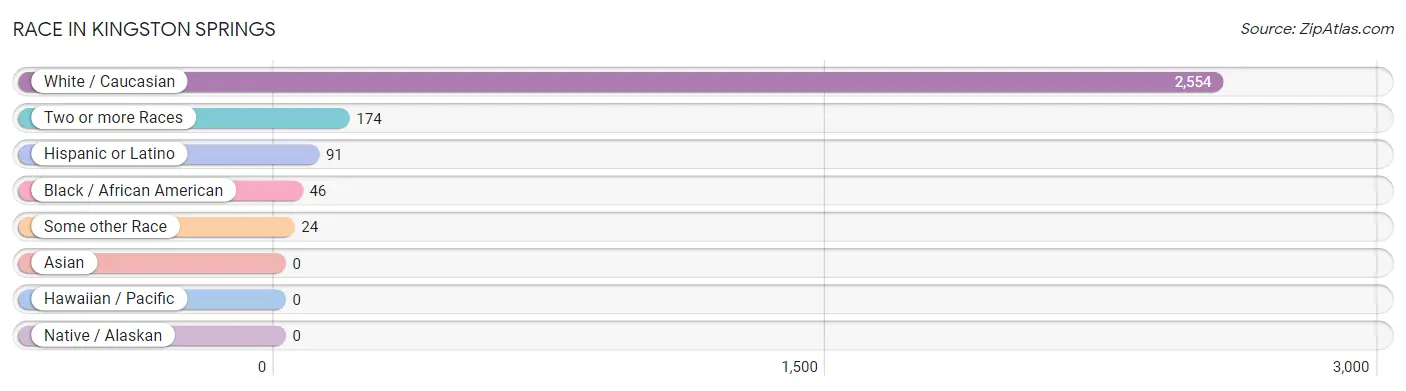
| Race | # Population | % Population |
| Asian | 0 | 0.0% |
| Black / African American | 46 | 1.6% |
| Hawaiian / Pacific | 0 | 0.0% |
| Hispanic or Latino | 91 | 3.3% |
| Native / Alaskan | 0 | 0.0% |
| White / Caucasian | 2,554 | 91.3% |
| Two or more Races | 174 | 6.2% |
| Some other Race | 24 | 0.9% |
| Total | 2,798 | 100.0% |
Ancestry in Kingston Springs
The most populous ancestries reported in Kingston Springs are German (458 | 16.4%), English (398 | 14.2%), Irish (304 | 10.9%), American (214 | 7.6%), and Italian (93 | 3.3%), together accounting for 52.4% of all Kingston Springs residents.
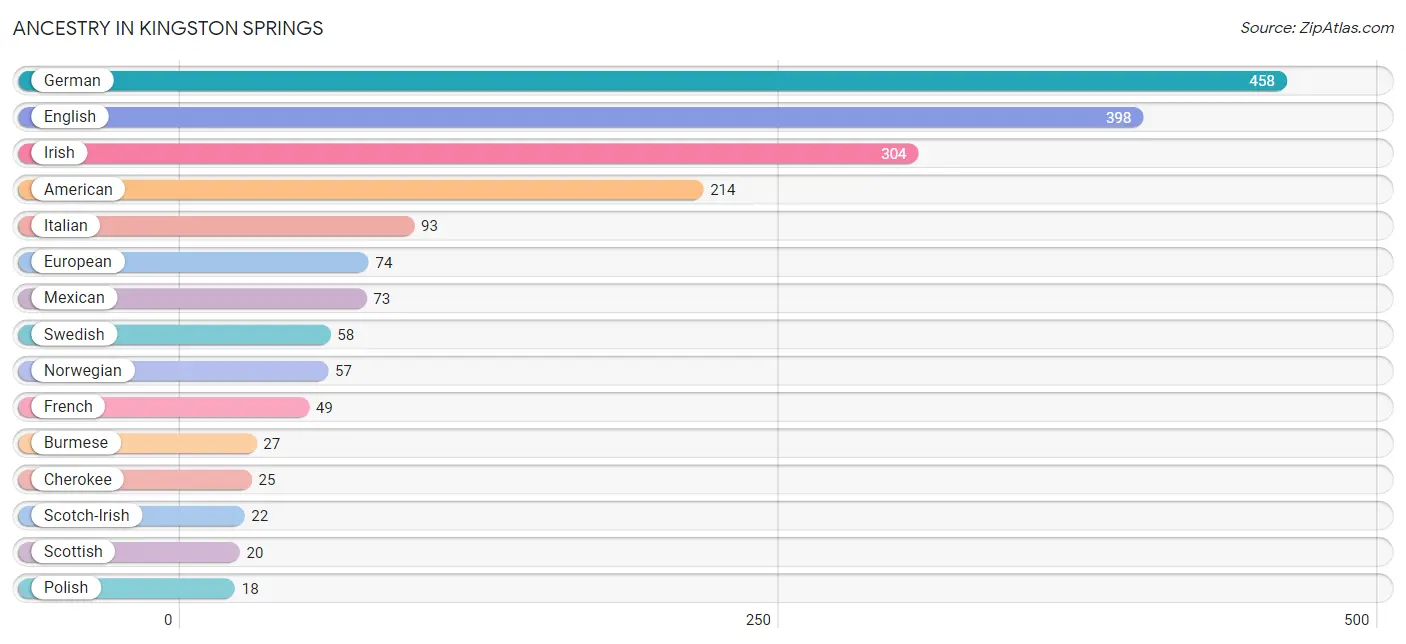
| Ancestry | # Population | % Population |
| American | 214 | 7.6% |
| Arab | 5 | 0.2% |
| Austrian | 7 | 0.3% |
| British | 16 | 0.6% |
| Burmese | 27 | 1.0% |
| Central American | 15 | 0.5% |
| Cherokee | 25 | 0.9% |
| Choctaw | 12 | 0.4% |
| Colombian | 3 | 0.1% |
| Croatian | 8 | 0.3% |
| Czechoslovakian | 4 | 0.1% |
| Danish | 3 | 0.1% |
| English | 398 | 14.2% |
| European | 74 | 2.6% |
| French | 49 | 1.8% |
| German | 458 | 16.4% |
| Greek | 3 | 0.1% |
| Guatemalan | 15 | 0.5% |
| Houma | 12 | 0.4% |
| Hungarian | 3 | 0.1% |
| Iranian | 5 | 0.2% |
| Irish | 304 | 10.9% |
| Italian | 93 | 3.3% |
| Mexican | 73 | 2.6% |
| Norwegian | 57 | 2.0% |
| Polish | 18 | 0.6% |
| Russian | 3 | 0.1% |
| Scandinavian | 4 | 0.1% |
| Scotch-Irish | 22 | 0.8% |
| Scottish | 20 | 0.7% |
| South American | 3 | 0.1% |
| Swedish | 58 | 2.1% |
| Thai | 2 | 0.1% |
| Welsh | 8 | 0.3% | View All 34 Rows |
Immigrants in Kingston Springs
The most numerous immigrant groups reported in Kingston Springs came from Latin America (51 | 1.8%), Central America (48 | 1.7%), Mexico (33 | 1.2%), Guatemala (15 | 0.5%), and Asia (10 | 0.4%), together accounting for 5.6% of all Kingston Springs residents.
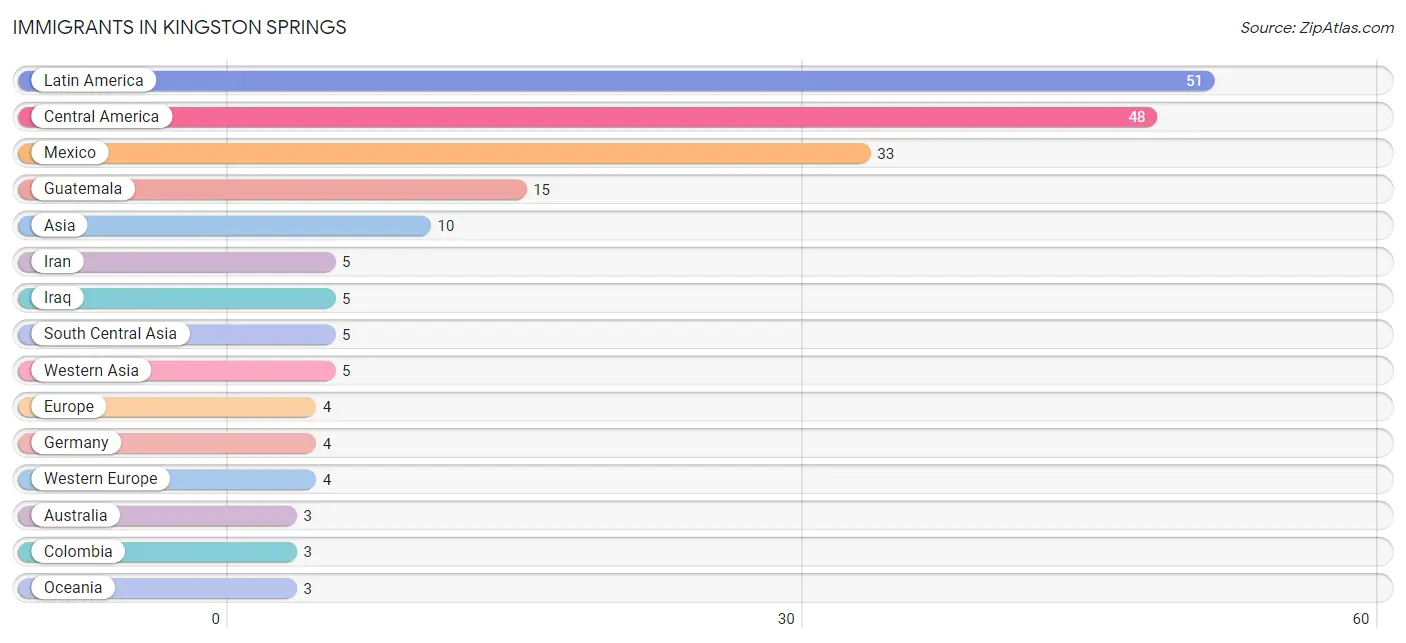
| Immigration Origin | # Population | % Population |
| Asia | 10 | 0.4% |
| Australia | 3 | 0.1% |
| Central America | 48 | 1.7% |
| Colombia | 3 | 0.1% |
| Europe | 4 | 0.1% |
| Germany | 4 | 0.1% |
| Guatemala | 15 | 0.5% |
| Iran | 5 | 0.2% |
| Iraq | 5 | 0.2% |
| Latin America | 51 | 1.8% |
| Mexico | 33 | 1.2% |
| Oceania | 3 | 0.1% |
| South America | 3 | 0.1% |
| South Central Asia | 5 | 0.2% |
| Western Asia | 5 | 0.2% |
| Western Europe | 4 | 0.1% | View All 16 Rows |
Sex and Age in Kingston Springs
Sex and Age in Kingston Springs
The most populous age groups in Kingston Springs are 40 to 44 Years (117 | 8.6%) for men and 20 to 24 Years (142 | 9.9%) for women.
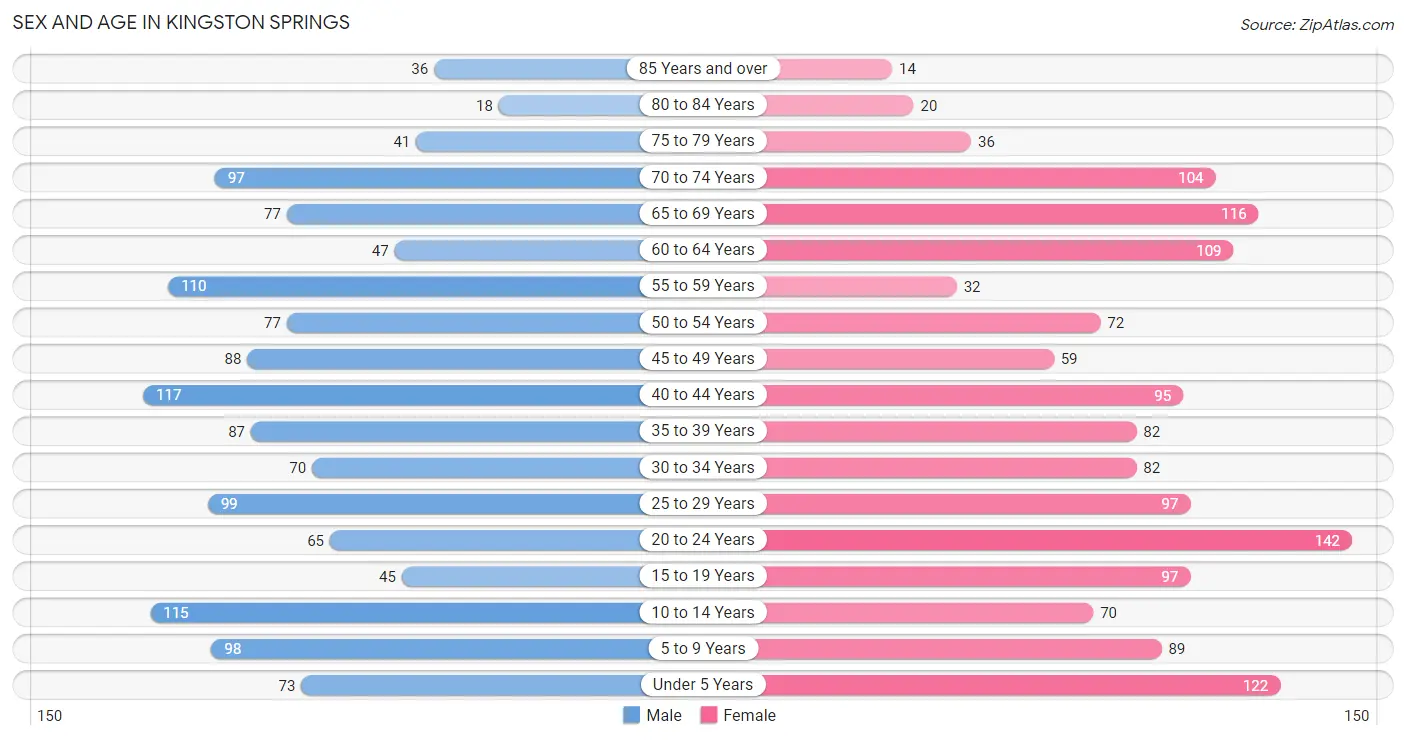
| Age Bracket | Male | Female |
| Under 5 Years | 73 (5.4%) | 122 (8.5%) |
| 5 to 9 Years | 98 (7.2%) | 89 (6.2%) |
| 10 to 14 Years | 115 (8.5%) | 70 (4.9%) |
| 15 to 19 Years | 45 (3.3%) | 97 (6.8%) |
| 20 to 24 Years | 65 (4.8%) | 142 (9.9%) |
| 25 to 29 Years | 99 (7.3%) | 97 (6.8%) |
| 30 to 34 Years | 70 (5.1%) | 82 (5.7%) |
| 35 to 39 Years | 87 (6.4%) | 82 (5.7%) |
| 40 to 44 Years | 117 (8.6%) | 95 (6.6%) |
| 45 to 49 Years | 88 (6.5%) | 59 (4.1%) |
| 50 to 54 Years | 77 (5.7%) | 72 (5.0%) |
| 55 to 59 Years | 110 (8.1%) | 32 (2.2%) |
| 60 to 64 Years | 47 (3.5%) | 109 (7.6%) |
| 65 to 69 Years | 77 (5.7%) | 116 (8.1%) |
| 70 to 74 Years | 97 (7.1%) | 104 (7.2%) |
| 75 to 79 Years | 41 (3.0%) | 36 (2.5%) |
| 80 to 84 Years | 18 (1.3%) | 20 (1.4%) |
| 85 Years and over | 36 (2.6%) | 14 (1.0%) |
| Total | 1,360 (100.0%) | 1,438 (100.0%) |
Families and Households in Kingston Springs
Median Family Size in Kingston Springs
The median family size in Kingston Springs is 2.93 persons per family, with married-couple families (533 | 67.0%) accounting for the largest median family size of 3.1 persons per family. On the other hand, single female/mother families (113 | 14.2%) represent the smallest median family size with 2.48 persons per family.
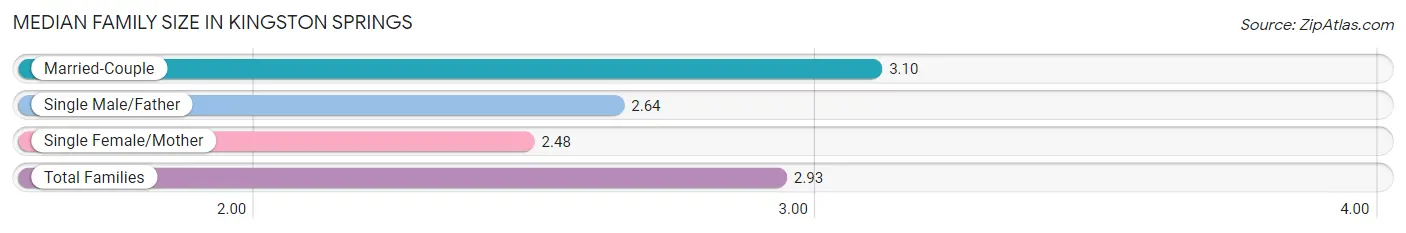
| Family Type | # Families | Family Size |
| Married-Couple | 533 (67.0%) | 3.10 |
| Single Male/Father | 149 (18.7%) | 2.64 |
| Single Female/Mother | 113 (14.2%) | 2.48 |
| Total Families | 795 (100.0%) | 2.93 |
Median Household Size in Kingston Springs
The median household size in Kingston Springs is 2.72 persons per household, with single male/father households (149 | 14.5%) accounting for the largest median household size of 3.25 persons per household. non-family households (234 | 22.7%) represent the smallest median household size with 1.34 persons per household.
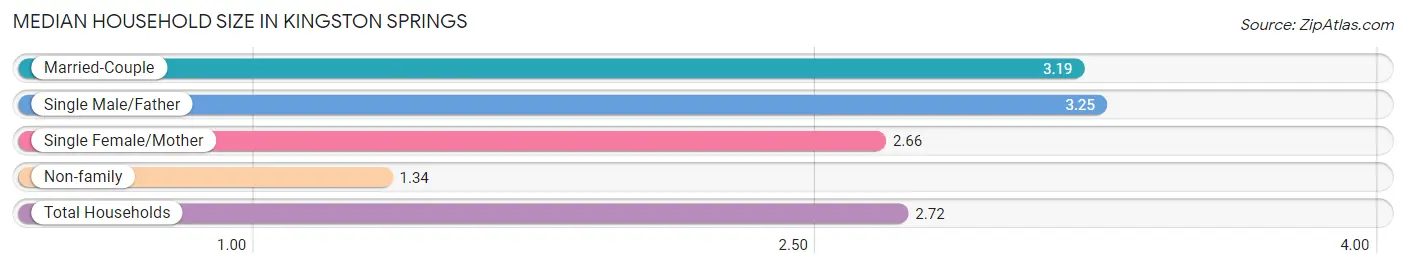
| Household Type | # Households | Household Size |
| Married-Couple | 533 (51.8%) | 3.19 |
| Single Male/Father | 149 (14.5%) | 3.25 |
| Single Female/Mother | 113 (11.0%) | 2.66 |
| Non-family | 234 (22.7%) | 1.34 |
| Total Households | 1,029 (100.0%) | 2.72 |
Household Size by Marriage Status in Kingston Springs
Out of a total of 1,029 households in Kingston Springs, 795 (77.3%) are family households, while 234 (22.7%) are nonfamily households. The most numerous type of family households are 2-person households, comprising 375, and the most common type of nonfamily households are 1-person households, comprising 167.
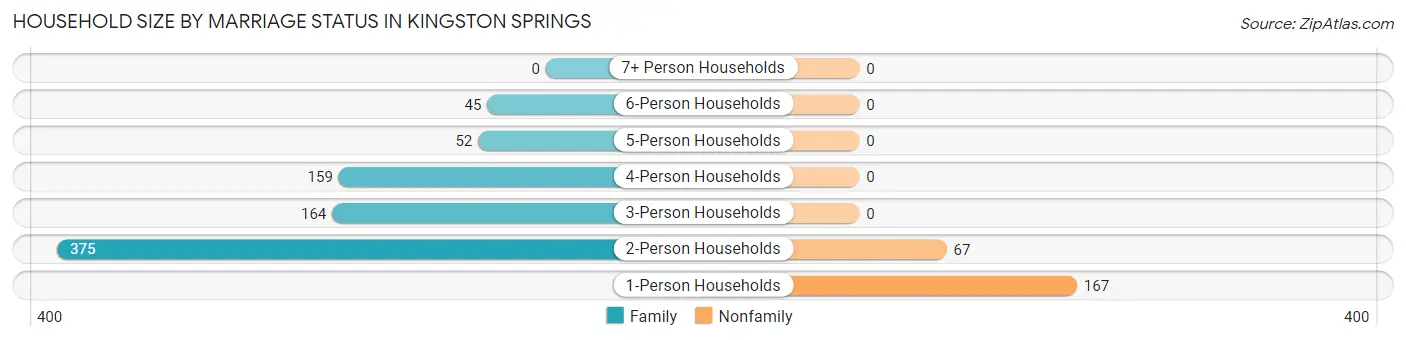
| Household Size | Family Households | Nonfamily Households |
| 1-Person Households | - | 167 (16.2%) |
| 2-Person Households | 375 (36.4%) | 67 (6.5%) |
| 3-Person Households | 164 (15.9%) | 0 (0.0%) |
| 4-Person Households | 159 (15.4%) | 0 (0.0%) |
| 5-Person Households | 52 (5.1%) | 0 (0.0%) |
| 6-Person Households | 45 (4.4%) | 0 (0.0%) |
| 7+ Person Households | 0 (0.0%) | 0 (0.0%) |
| Total | 795 (77.3%) | 234 (22.7%) |
Female Fertility in Kingston Springs
Fertility by Age in Kingston Springs
Average fertility rate in Kingston Springs is 38.0 births per 1,000 women. Women in the age bracket of 20 to 34 years have the highest fertility rate with 65.0 births per 1,000 women. Women in the age bracket of 20 to 34 years acount for 84.0% of all women with births.
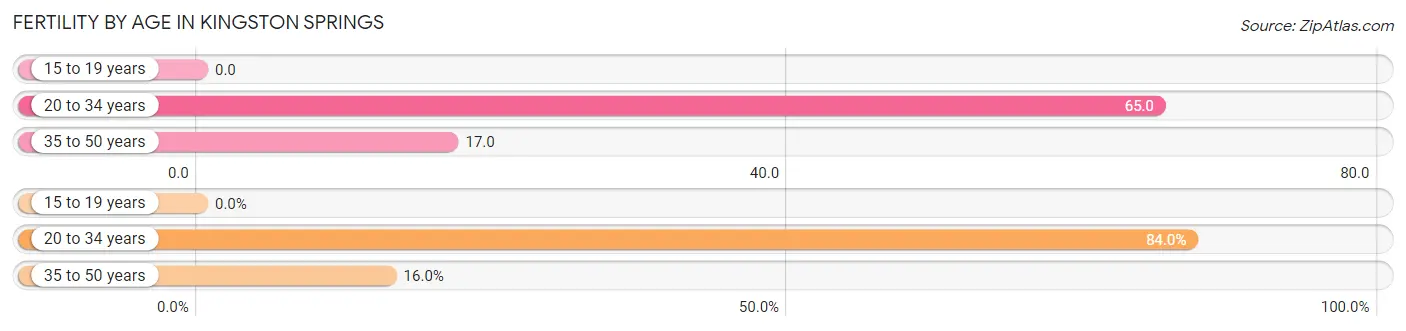
| Age Bracket | Women with Births | Births / 1,000 Women |
| 15 to 19 years | 0 (0.0%) | 0.0 |
| 20 to 34 years | 21 (84.0%) | 65.0 |
| 35 to 50 years | 4 (16.0%) | 17.0 |
| Total | 25 (100.0%) | 38.0 |
Fertility by Age by Marriage Status in Kingston Springs
52.0% of women with births (25) in Kingston Springs are married. The highest percentage of unmarried women with births falls into 35 to 50 years age bracket with 100.0% of them unmarried at the time of birth, while the lowest percentage of unmarried women with births belong to 20 to 34 years age bracket with 38.1% of them unmarried.
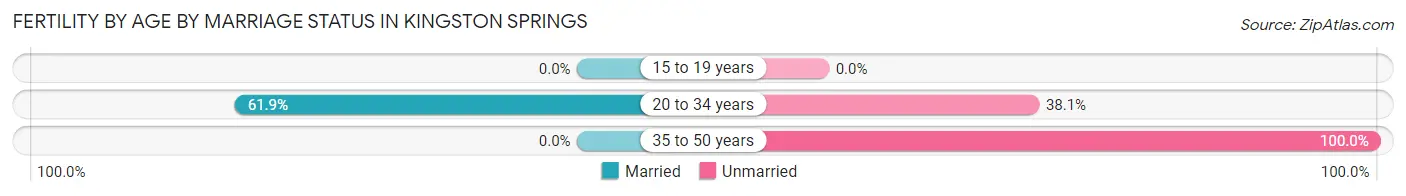
| Age Bracket | Married | Unmarried |
| 15 to 19 years | 0 (0.0%) | 0 (0.0%) |
| 20 to 34 years | 13 (61.9%) | 8 (38.1%) |
| 35 to 50 years | 0 (0.0%) | 4 (100.0%) |
| Total | 13 (52.0%) | 12 (48.0%) |
Fertility by Education in Kingston Springs
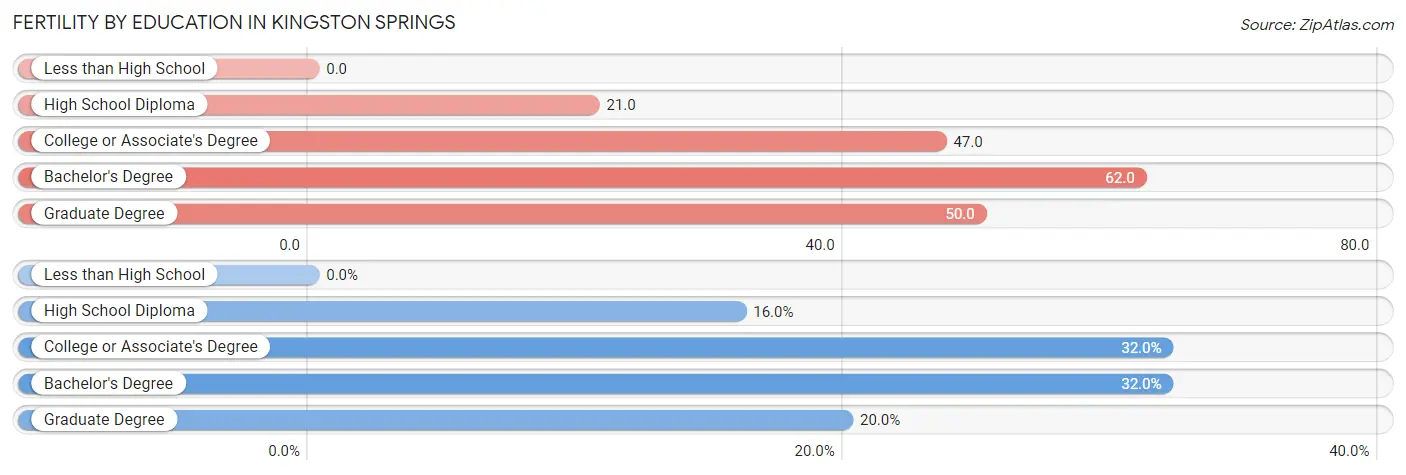
| Educational Attainment | Women with Births | Births / 1,000 Women |
| Less than High School | 0 (0.0%) | 0.0 |
| High School Diploma | 4 (16.0%) | 21.0 |
| College or Associate's Degree | 8 (32.0%) | 47.0 |
| Bachelor's Degree | 8 (32.0%) | 62.0 |
| Graduate Degree | 5 (20.0%) | 50.0 |
| Total | 25 (100.0%) | 38.0 |
Fertility by Education by Marriage Status in Kingston Springs
48.0% of women with births in Kingston Springs are unmarried. Women with the educational attainment of bachelor's degree are most likely to be married with 100.0% of them married at childbirth, while women with the educational attainment of high school diploma are least likely to be married with 100.0% of them unmarried at childbirth.
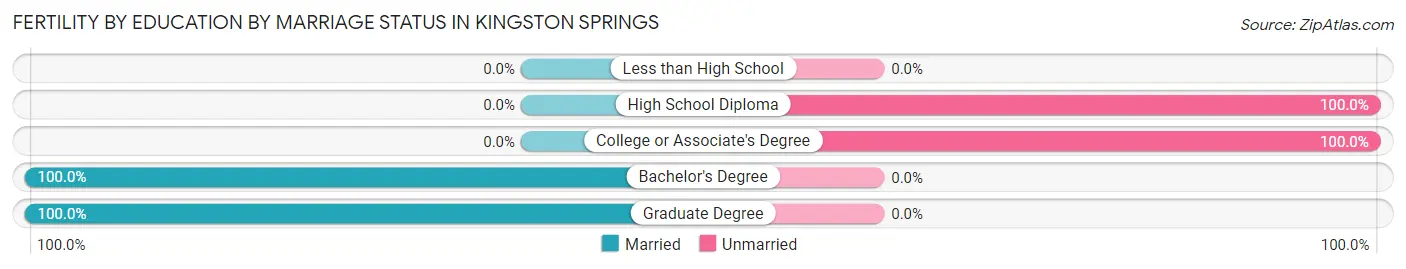
| Educational Attainment | Married | Unmarried |
| Less than High School | 0 (0.0%) | 0 (0.0%) |
| High School Diploma | 0 (0.0%) | 4 (100.0%) |
| College or Associate's Degree | 0 (0.0%) | 8 (100.0%) |
| Bachelor's Degree | 8 (100.0%) | 0 (0.0%) |
| Graduate Degree | 5 (100.0%) | 0 (0.0%) |
| Total | 13 (52.0%) | 12 (48.0%) |
Employment Characteristics in Kingston Springs
Employment by Class of Employer in Kingston Springs
Among the 1,361 employed individuals in Kingston Springs, private company employees (972 | 71.4%), self-employed (not incorporated) (163 | 12.0%), and local government employees (66 | 4.9%) make up the most common classes of employment.
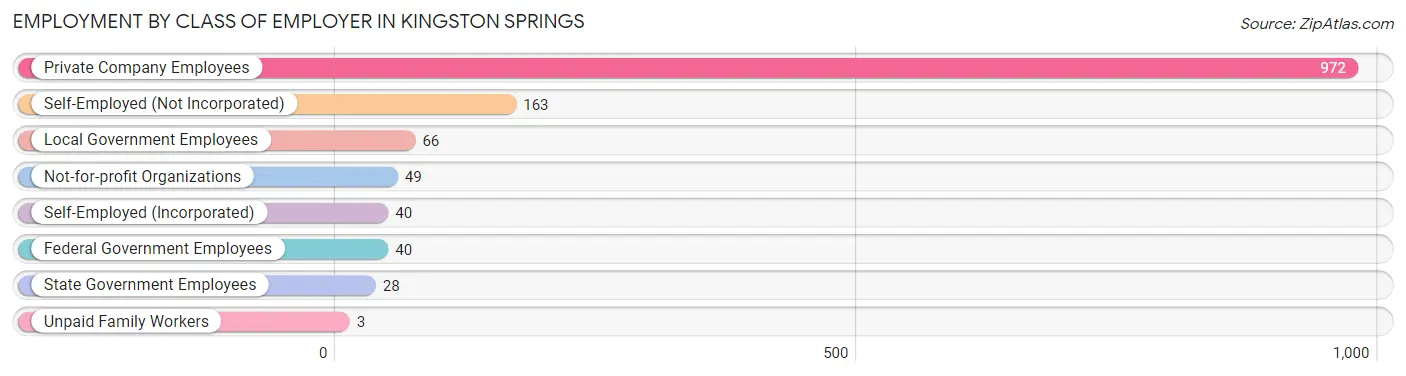
| Employer Class | # Employees | % Employees |
| Private Company Employees | 972 | 71.4% |
| Self-Employed (Incorporated) | 40 | 2.9% |
| Self-Employed (Not Incorporated) | 163 | 12.0% |
| Not-for-profit Organizations | 49 | 3.6% |
| Local Government Employees | 66 | 4.9% |
| State Government Employees | 28 | 2.1% |
| Federal Government Employees | 40 | 2.9% |
| Unpaid Family Workers | 3 | 0.2% |
| Total | 1,361 | 100.0% |
Employment Status by Age in Kingston Springs
According to the labor force statistics for Kingston Springs, out of the total population over 16 years of age (2,211), 65.0% or 1,437 individuals are in the labor force, with 3.8% or 55 of them unemployed. The age group with the highest labor force participation rate is 30 to 34 years, with 100.0% or 152 individuals in the labor force. Within the labor force, the 65 to 74 years age range has the highest percentage of unemployed individuals, with 30.9% or 30 of them being unemployed.
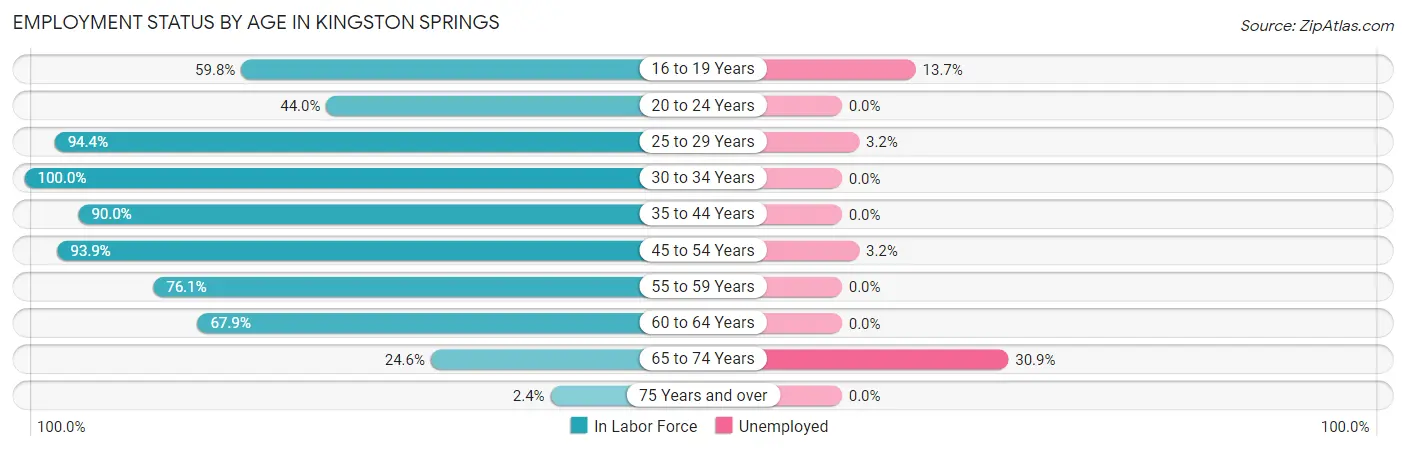
| Age Bracket | In Labor Force | Unemployed |
| 16 to 19 Years | 73 (59.8%) | 10 (13.7%) |
| 20 to 24 Years | 91 (44.0%) | 0 (0.0%) |
| 25 to 29 Years | 185 (94.4%) | 6 (3.2%) |
| 30 to 34 Years | 152 (100.0%) | 0 (0.0%) |
| 35 to 44 Years | 343 (90.0%) | 0 (0.0%) |
| 45 to 54 Years | 278 (93.9%) | 9 (3.2%) |
| 55 to 59 Years | 108 (76.1%) | 0 (0.0%) |
| 60 to 64 Years | 106 (67.9%) | 0 (0.0%) |
| 65 to 74 Years | 97 (24.6%) | 30 (30.9%) |
| 75 Years and over | 4 (2.4%) | 0 (0.0%) |
| Total | 1,437 (65.0%) | 55 (3.8%) |
Employment Status by Educational Attainment in Kingston Springs
According to labor force statistics for Kingston Springs, 88.6% of individuals (1,172) out of the total population between 25 and 64 years of age (1,323) are in the labor force, with 1.3% or 15 of them being unemployed. The group with the highest labor force participation rate are those with the educational attainment of less than high school, with 100.0% or 55 individuals in the labor force. Within the labor force, individuals with less than high school education have the highest percentage of unemployment, with 16.4% or 9 of them being unemployed.
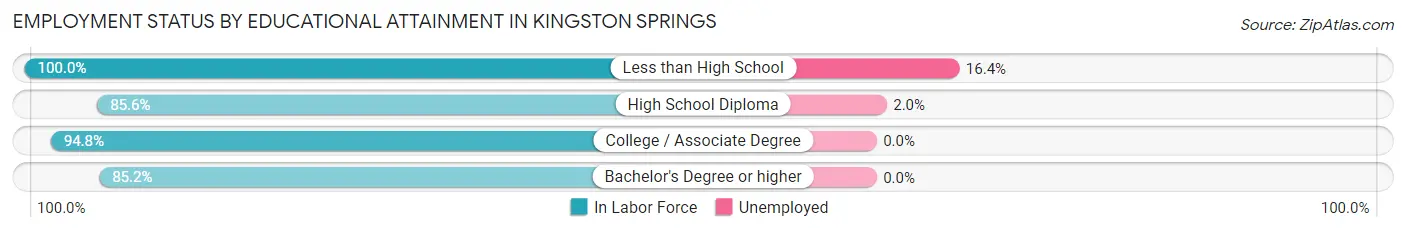
| Educational Attainment | In Labor Force | Unemployed |
| Less than High School | 55 (100.0%) | 9 (16.4%) |
| High School Diploma | 298 (85.6%) | 7 (2.0%) |
| College / Associate Degree | 347 (94.8%) | 0 (0.0%) |
| Bachelor's Degree or higher | 472 (85.2%) | 0 (0.0%) |
| Total | 1,172 (88.6%) | 17 (1.3%) |
Employment Occupations by Sex in Kingston Springs
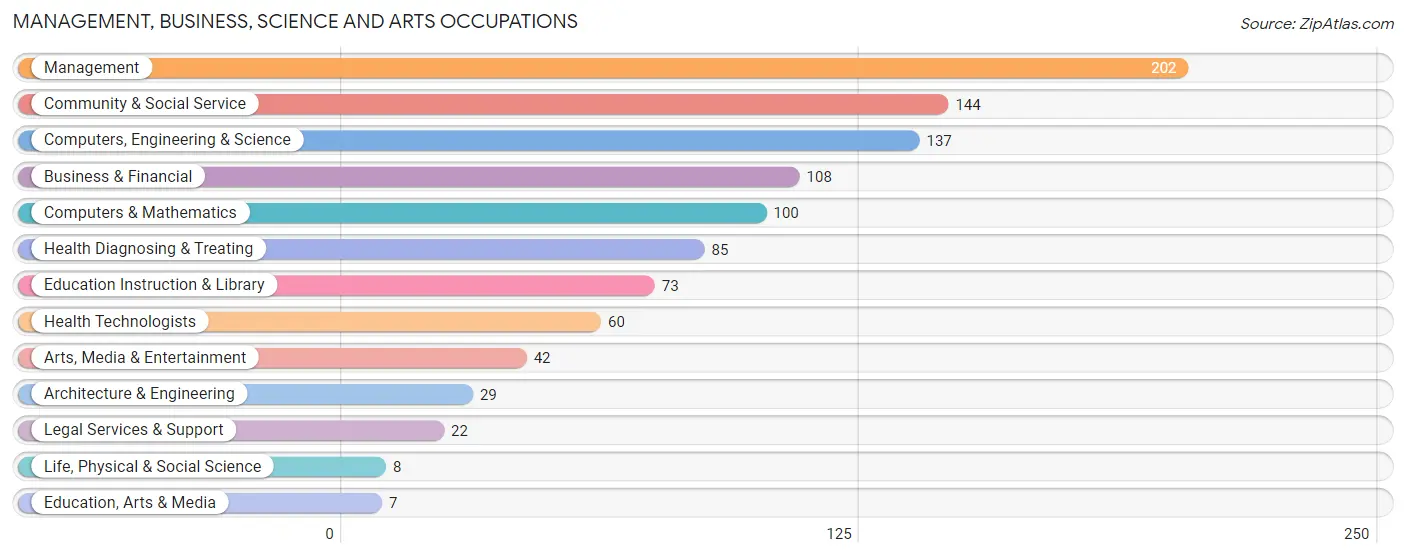
Management, Business, Science and Arts Occupations
The most common Management, Business, Science and Arts occupations in Kingston Springs are Management (202 | 14.6%), Community & Social Service (144 | 10.4%), Computers, Engineering & Science (137 | 9.9%), Business & Financial (108 | 7.8%), and Computers & Mathematics (100 | 7.2%).
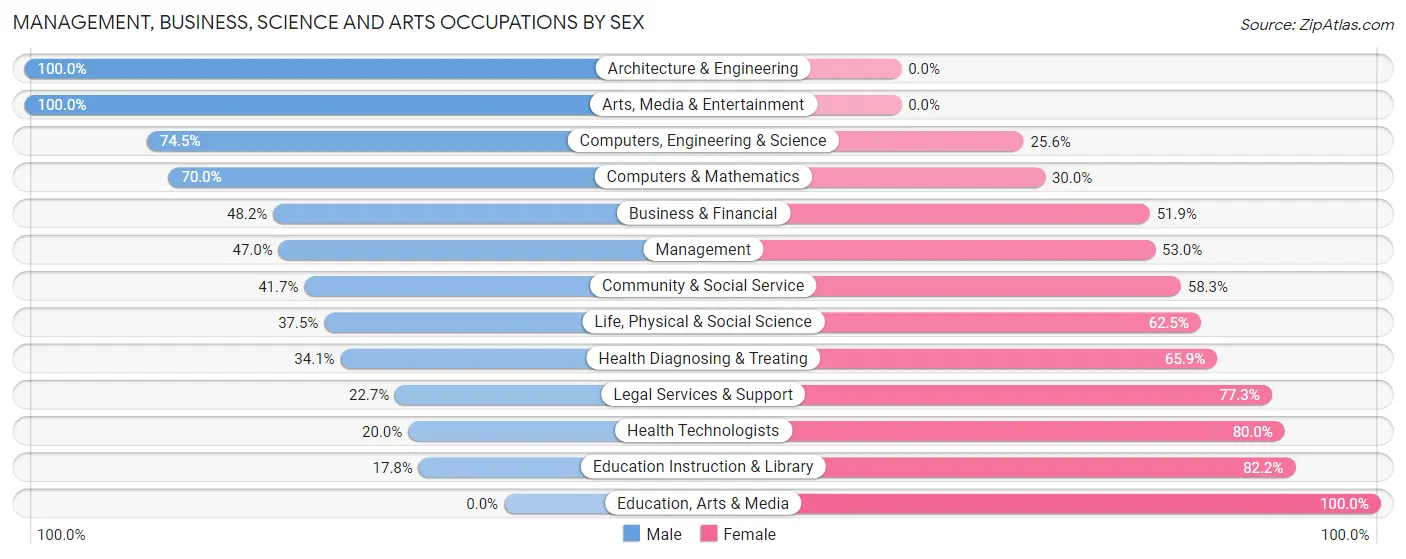
Management, Business, Science and Arts Occupations by Sex
Within the Management, Business, Science and Arts occupations in Kingston Springs, the most male-oriented occupations are Architecture & Engineering (100.0%), Arts, Media & Entertainment (100.0%), and Computers, Engineering & Science (74.5%), while the most female-oriented occupations are Education, Arts & Media (100.0%), Education Instruction & Library (82.2%), and Health Technologists (80.0%).
| Occupation | Male | Female |
| Management | 95 (47.0%) | 107 (53.0%) |
| Business & Financial | 52 (48.1%) | 56 (51.8%) |
| Computers, Engineering & Science | 102 (74.5%) | 35 (25.6%) |
| Computers & Mathematics | 70 (70.0%) | 30 (30.0%) |
| Architecture & Engineering | 29 (100.0%) | 0 (0.0%) |
| Life, Physical & Social Science | 3 (37.5%) | 5 (62.5%) |
| Community & Social Service | 60 (41.7%) | 84 (58.3%) |
| Education, Arts & Media | 0 (0.0%) | 7 (100.0%) |
| Legal Services & Support | 5 (22.7%) | 17 (77.3%) |
| Education Instruction & Library | 13 (17.8%) | 60 (82.2%) |
| Arts, Media & Entertainment | 42 (100.0%) | 0 (0.0%) |
| Health Diagnosing & Treating | 29 (34.1%) | 56 (65.9%) |
| Health Technologists | 12 (20.0%) | 48 (80.0%) |
| Total (Category) | 338 (50.0%) | 338 (50.0%) |
| Total (Overall) | 720 (52.1%) | 662 (47.9%) |
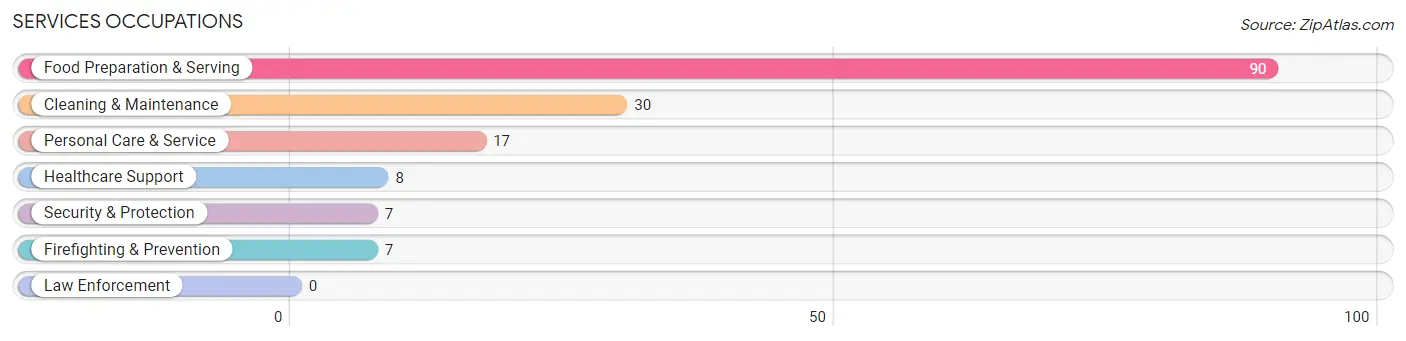
Services Occupations
The most common Services occupations in Kingston Springs are Food Preparation & Serving (90 | 6.5%), Cleaning & Maintenance (30 | 2.2%), Personal Care & Service (17 | 1.2%), Healthcare Support (8 | 0.6%), and Security & Protection (7 | 0.5%).
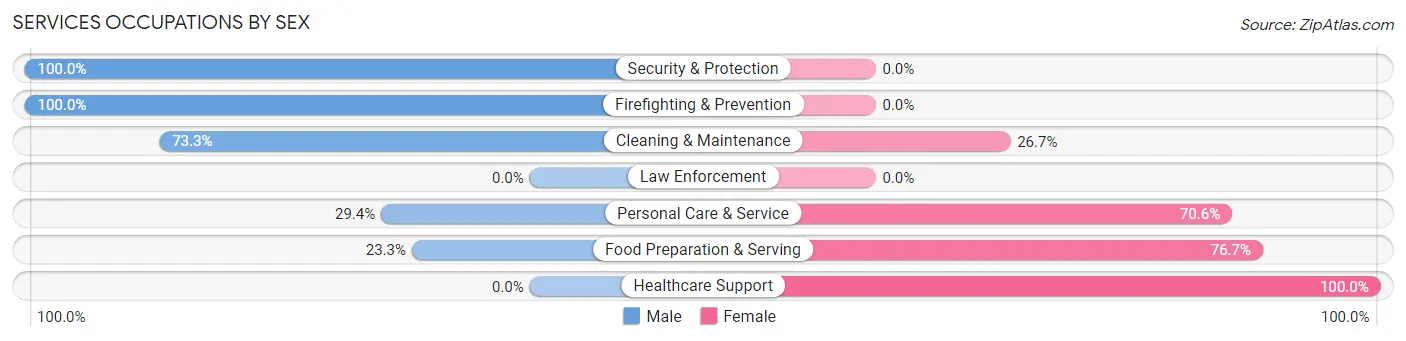
Services Occupations by Sex
Within the Services occupations in Kingston Springs, the most male-oriented occupations are Security & Protection (100.0%), Firefighting & Prevention (100.0%), and Cleaning & Maintenance (73.3%), while the most female-oriented occupations are Healthcare Support (100.0%), Food Preparation & Serving (76.7%), and Personal Care & Service (70.6%).
| Occupation | Male | Female |
| Healthcare Support | 0 (0.0%) | 8 (100.0%) |
| Security & Protection | 7 (100.0%) | 0 (0.0%) |
| Firefighting & Prevention | 7 (100.0%) | 0 (0.0%) |
| Law Enforcement | 0 (0.0%) | 0 (0.0%) |
| Food Preparation & Serving | 21 (23.3%) | 69 (76.7%) |
| Cleaning & Maintenance | 22 (73.3%) | 8 (26.7%) |
| Personal Care & Service | 5 (29.4%) | 12 (70.6%) |
| Total (Category) | 55 (36.2%) | 97 (63.8%) |
| Total (Overall) | 720 (52.1%) | 662 (47.9%) |
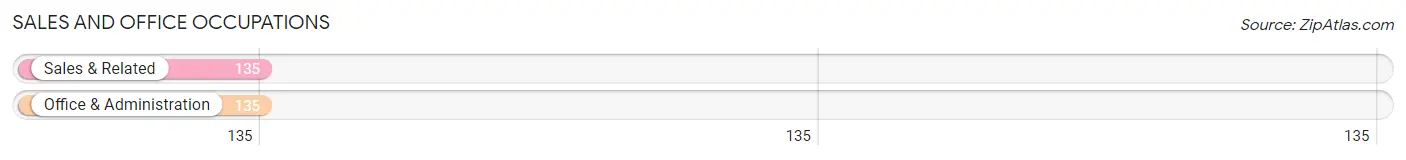
Sales and Office Occupations
The most common Sales and Office occupations in Kingston Springs are Sales & Related (135 | 9.8%), and Office & Administration (135 | 9.8%).
Sales and Office Occupations by Sex
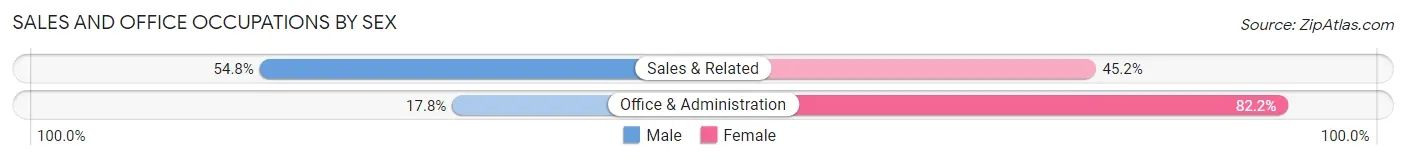
| Occupation | Male | Female |
| Sales & Related | 74 (54.8%) | 61 (45.2%) |
| Office & Administration | 24 (17.8%) | 111 (82.2%) |
| Total (Category) | 98 (36.3%) | 172 (63.7%) |
| Total (Overall) | 720 (52.1%) | 662 (47.9%) |
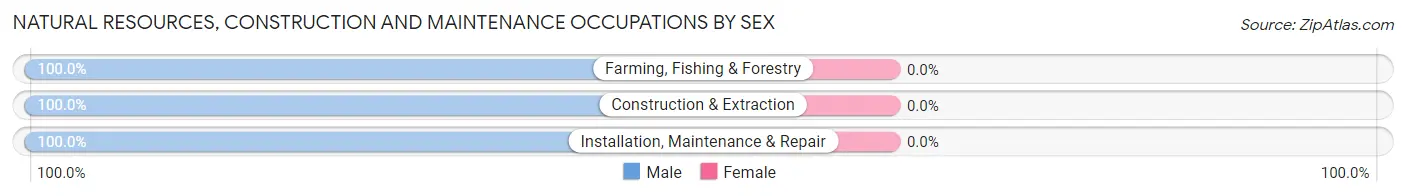
Natural Resources, Construction and Maintenance Occupations
The most common Natural Resources, Construction and Maintenance occupations in Kingston Springs are Construction & Extraction (125 | 9.0%), Installation, Maintenance & Repair (15 | 1.1%), and Farming, Fishing & Forestry (4 | 0.3%).
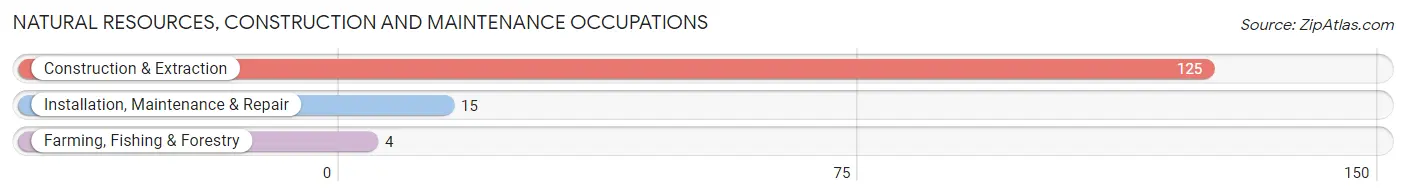
Natural Resources, Construction and Maintenance Occupations by Sex
| Occupation | Male | Female |
| Farming, Fishing & Forestry | 4 (100.0%) | 0 (0.0%) |
| Construction & Extraction | 125 (100.0%) | 0 (0.0%) |
| Installation, Maintenance & Repair | 15 (100.0%) | 0 (0.0%) |
| Total (Category) | 144 (100.0%) | 0 (0.0%) |
| Total (Overall) | 720 (52.1%) | 662 (47.9%) |
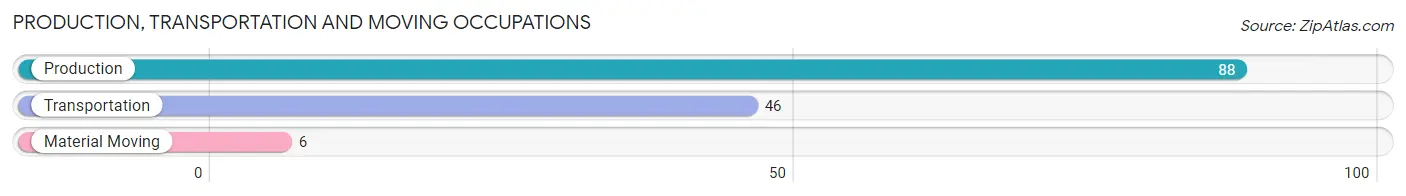
Production, Transportation and Moving Occupations
The most common Production, Transportation and Moving occupations in Kingston Springs are Production (88 | 6.4%), Transportation (46 | 3.3%), and Material Moving (6 | 0.4%).
Production, Transportation and Moving Occupations by Sex
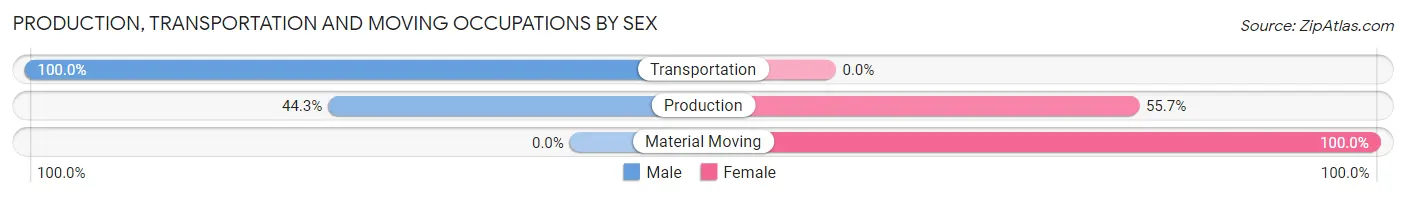
| Occupation | Male | Female |
| Production | 39 (44.3%) | 49 (55.7%) |
| Transportation | 46 (100.0%) | 0 (0.0%) |
| Material Moving | 0 (0.0%) | 6 (100.0%) |
| Total (Category) | 85 (60.7%) | 55 (39.3%) |
| Total (Overall) | 720 (52.1%) | 662 (47.9%) |
Employment Industries by Sex in Kingston Springs
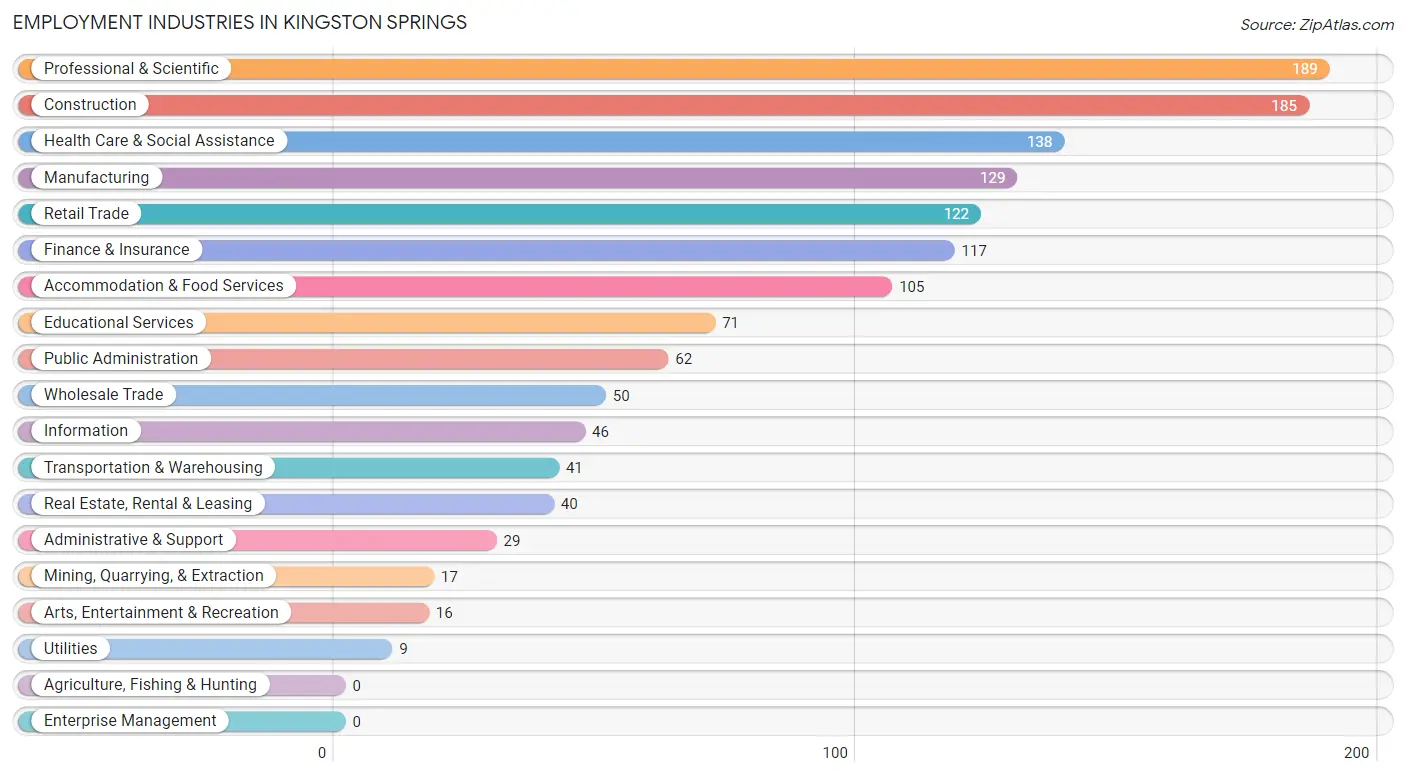
Employment Industries in Kingston Springs
The major employment industries in Kingston Springs include Professional & Scientific (189 | 13.7%), Construction (185 | 13.4%), Health Care & Social Assistance (138 | 10.0%), Manufacturing (129 | 9.3%), and Retail Trade (122 | 8.8%).
Employment Industries by Sex in Kingston Springs
The Kingston Springs industries that see more men than women are Mining, Quarrying, & Extraction (100.0%), Transportation & Warehousing (100.0%), and Real Estate, Rental & Leasing (100.0%), whereas the industries that tend to have a higher number of women are Educational Services (90.1%), Health Care & Social Assistance (79.0%), and Administrative & Support (72.4%).
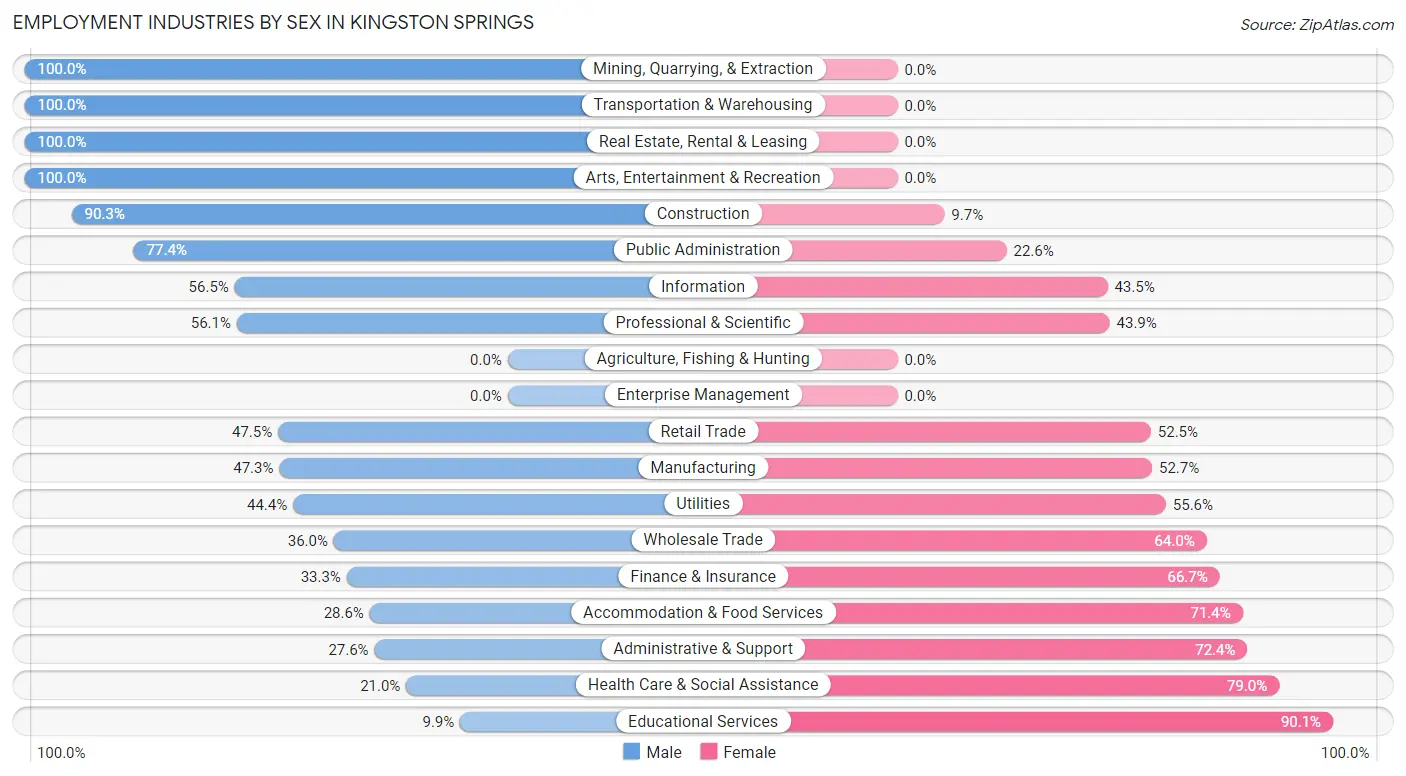
| Industry | Male | Female |
| Agriculture, Fishing & Hunting | 0 (0.0%) | 0 (0.0%) |
| Mining, Quarrying, & Extraction | 17 (100.0%) | 0 (0.0%) |
| Construction | 167 (90.3%) | 18 (9.7%) |
| Manufacturing | 61 (47.3%) | 68 (52.7%) |
| Wholesale Trade | 18 (36.0%) | 32 (64.0%) |
| Retail Trade | 58 (47.5%) | 64 (52.5%) |
| Transportation & Warehousing | 41 (100.0%) | 0 (0.0%) |
| Utilities | 4 (44.4%) | 5 (55.6%) |
| Information | 26 (56.5%) | 20 (43.5%) |
| Finance & Insurance | 39 (33.3%) | 78 (66.7%) |
| Real Estate, Rental & Leasing | 40 (100.0%) | 0 (0.0%) |
| Professional & Scientific | 106 (56.1%) | 83 (43.9%) |
| Enterprise Management | 0 (0.0%) | 0 (0.0%) |
| Administrative & Support | 8 (27.6%) | 21 (72.4%) |
| Educational Services | 7 (9.9%) | 64 (90.1%) |
| Health Care & Social Assistance | 29 (21.0%) | 109 (79.0%) |
| Arts, Entertainment & Recreation | 16 (100.0%) | 0 (0.0%) |
| Accommodation & Food Services | 30 (28.6%) | 75 (71.4%) |
| Public Administration | 48 (77.4%) | 14 (22.6%) |
| Total | 720 (52.1%) | 662 (47.9%) |
Education in Kingston Springs
School Enrollment in Kingston Springs
The most common levels of schooling among the 605 students in Kingston Springs are middle school (160 | 26.5%), elementary school (134 | 22.2%), and high school (115 | 19.0%).
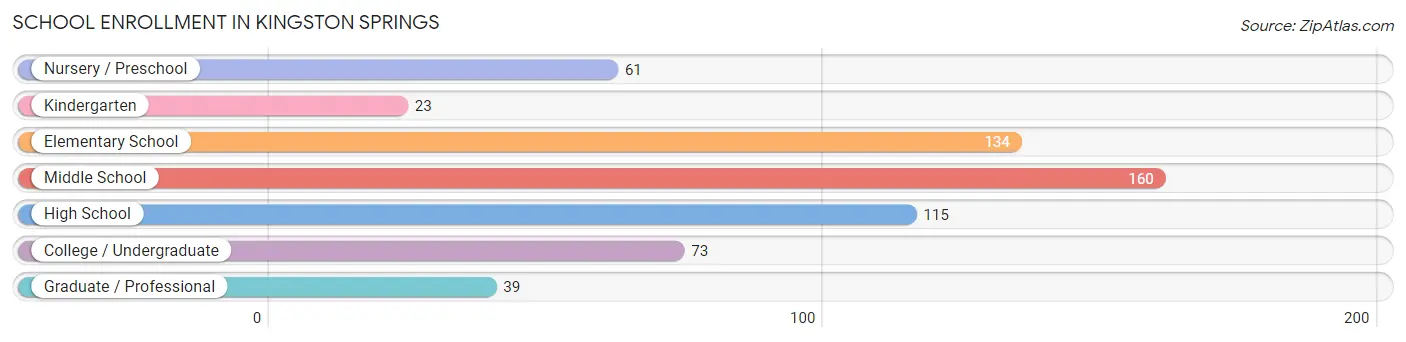
| School Level | # Students | % Students |
| Nursery / Preschool | 61 | 10.1% |
| Kindergarten | 23 | 3.8% |
| Elementary School | 134 | 22.2% |
| Middle School | 160 | 26.5% |
| High School | 115 | 19.0% |
| College / Undergraduate | 73 | 12.1% |
| Graduate / Professional | 39 | 6.5% |
| Total | 605 | 100.0% |
School Enrollment by Age by Funding Source in Kingston Springs
Out of a total of 605 students who are enrolled in schools in Kingston Springs, 206 (34.0%) attend a private institution, while the remaining 399 (66.0%) are enrolled in public schools. The age group of 35 years and over has the highest likelihood of being enrolled in private schools, with 39 (88.6% in the age bracket) enrolled. Conversely, the age group of 5 to 9 year old has the lowest likelihood of being enrolled in a private school, with 172 (92.0% in the age bracket) attending a public institution.
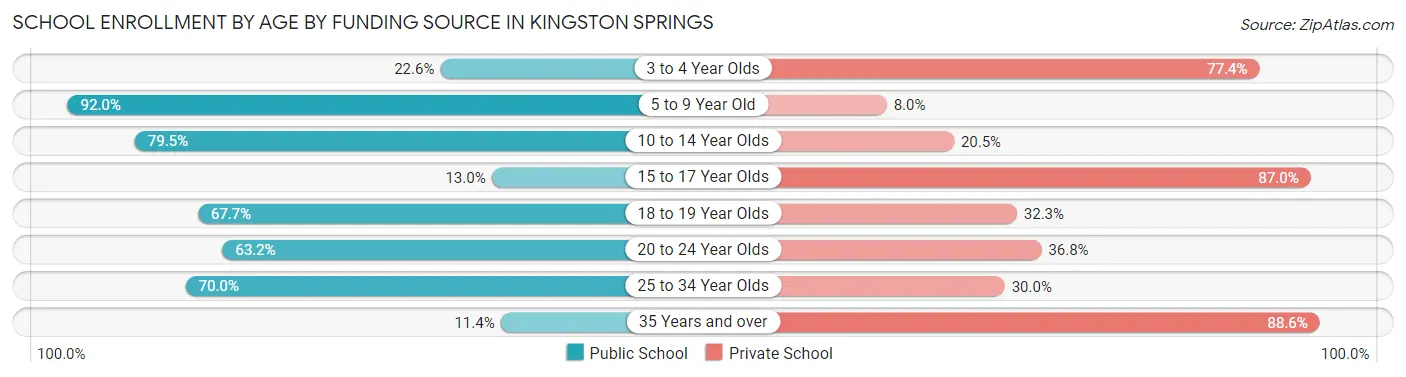
| Age Bracket | Public School | Private School |
| 3 to 4 Year Olds | 7 (22.6%) | 24 (77.4%) |
| 5 to 9 Year Old | 172 (92.0%) | 15 (8.0%) |
| 10 to 14 Year Olds | 147 (79.5%) | 38 (20.5%) |
| 15 to 17 Year Olds | 9 (13.0%) | 60 (87.0%) |
| 18 to 19 Year Olds | 21 (67.7%) | 10 (32.3%) |
| 20 to 24 Year Olds | 24 (63.2%) | 14 (36.8%) |
| 25 to 34 Year Olds | 14 (70.0%) | 6 (30.0%) |
| 35 Years and over | 5 (11.4%) | 39 (88.6%) |
| Total | 399 (66.0%) | 206 (34.0%) |
Educational Attainment by Field of Study in Kingston Springs
Business (147 | 17.8%), education (128 | 15.5%), computers & mathematics (84 | 10.2%), communications (83 | 10.1%), and bio, nature & agricultural (78 | 9.5%) are the most common fields of study among 824 individuals in Kingston Springs who have obtained a bachelor's degree or higher.
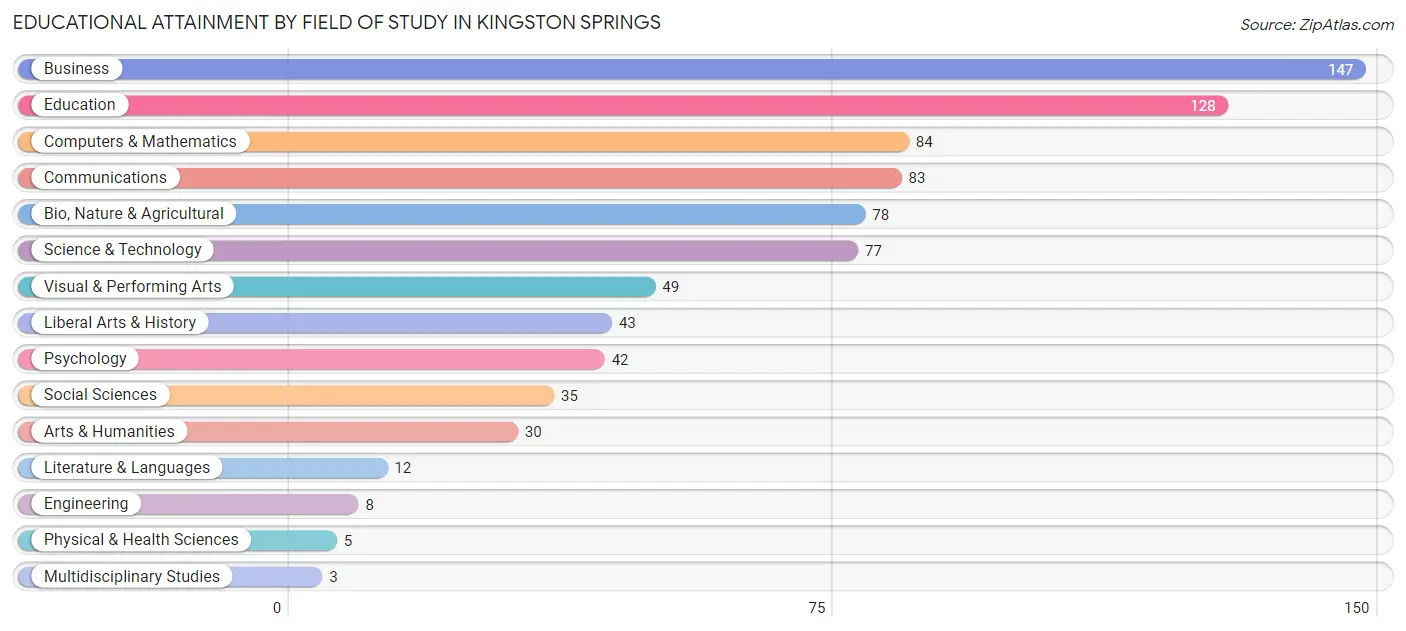
| Field of Study | # Graduates | % Graduates |
| Computers & Mathematics | 84 | 10.2% |
| Bio, Nature & Agricultural | 78 | 9.5% |
| Physical & Health Sciences | 5 | 0.6% |
| Psychology | 42 | 5.1% |
| Social Sciences | 35 | 4.3% |
| Engineering | 8 | 1.0% |
| Multidisciplinary Studies | 3 | 0.4% |
| Science & Technology | 77 | 9.3% |
| Business | 147 | 17.8% |
| Education | 128 | 15.5% |
| Literature & Languages | 12 | 1.5% |
| Liberal Arts & History | 43 | 5.2% |
| Visual & Performing Arts | 49 | 5.9% |
| Communications | 83 | 10.1% |
| Arts & Humanities | 30 | 3.6% |
| Total | 824 | 100.0% |
Transportation & Commute in Kingston Springs
Vehicle Availability by Sex in Kingston Springs
The most prevalent vehicle ownership categories in Kingston Springs are males with 2 vehicles (302, accounting for 42.4%) and females with 2 vehicles (269, making up 46.5%).
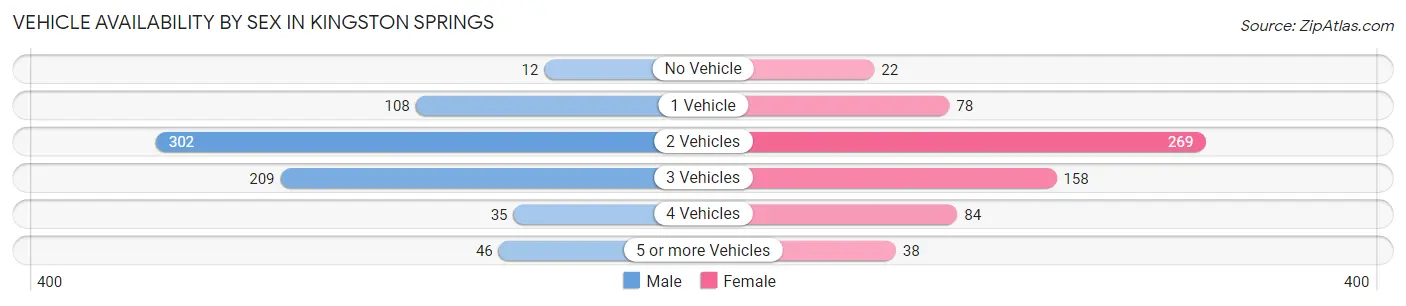
| Vehicles Available | Male | Female |
| No Vehicle | 12 (1.7%) | 22 (3.4%) |
| 1 Vehicle | 108 (15.2%) | 78 (12.0%) |
| 2 Vehicles | 302 (42.4%) | 269 (41.4%) |
| 3 Vehicles | 209 (29.3%) | 158 (24.3%) |
| 4 Vehicles | 35 (4.9%) | 84 (12.9%) |
| 5 or more Vehicles | 46 (6.5%) | 38 (5.9%) |
| Total | 712 (100.0%) | 649 (100.0%) |
Commute Time in Kingston Springs
The most frequently occuring commute durations in Kingston Springs are 30 to 34 minutes (230 commuters, 21.0%), 20 to 24 minutes (153 commuters, 14.0%), and 45 to 59 minutes (137 commuters, 12.5%).
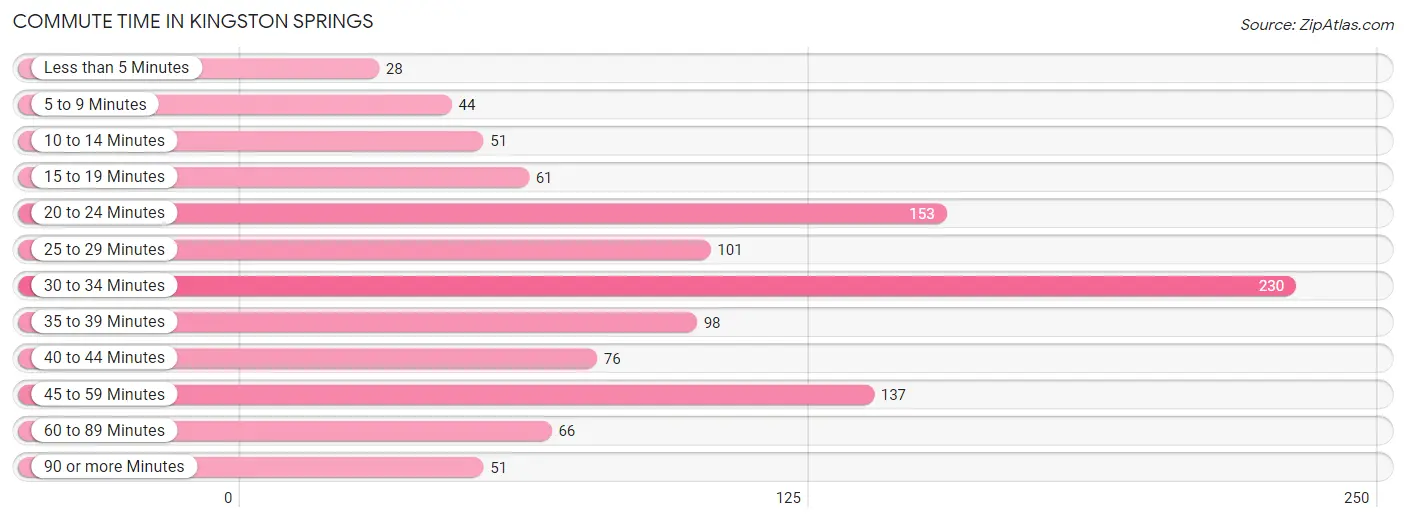
| Commute Time | # Commuters | % Commuters |
| Less than 5 Minutes | 28 | 2.5% |
| 5 to 9 Minutes | 44 | 4.0% |
| 10 to 14 Minutes | 51 | 4.6% |
| 15 to 19 Minutes | 61 | 5.6% |
| 20 to 24 Minutes | 153 | 14.0% |
| 25 to 29 Minutes | 101 | 9.2% |
| 30 to 34 Minutes | 230 | 21.0% |
| 35 to 39 Minutes | 98 | 8.9% |
| 40 to 44 Minutes | 76 | 6.9% |
| 45 to 59 Minutes | 137 | 12.5% |
| 60 to 89 Minutes | 66 | 6.0% |
| 90 or more Minutes | 51 | 4.6% |
Commute Time by Sex in Kingston Springs
The most common commute times in Kingston Springs are 20 to 24 minutes (116 commuters, 20.6%) for males and 30 to 34 minutes (116 commuters, 21.8%) for females.
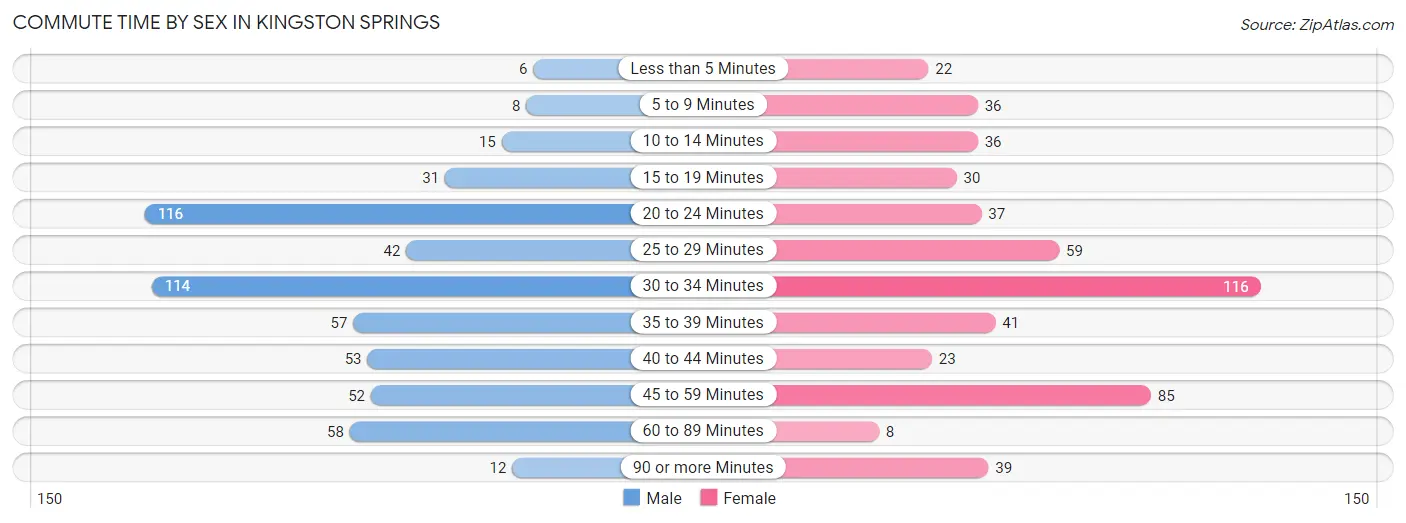
| Commute Time | Male | Female |
| Less than 5 Minutes | 6 (1.1%) | 22 (4.1%) |
| 5 to 9 Minutes | 8 (1.4%) | 36 (6.8%) |
| 10 to 14 Minutes | 15 (2.7%) | 36 (6.8%) |
| 15 to 19 Minutes | 31 (5.5%) | 30 (5.6%) |
| 20 to 24 Minutes | 116 (20.6%) | 37 (7.0%) |
| 25 to 29 Minutes | 42 (7.4%) | 59 (11.1%) |
| 30 to 34 Minutes | 114 (20.2%) | 116 (21.8%) |
| 35 to 39 Minutes | 57 (10.1%) | 41 (7.7%) |
| 40 to 44 Minutes | 53 (9.4%) | 23 (4.3%) |
| 45 to 59 Minutes | 52 (9.2%) | 85 (16.0%) |
| 60 to 89 Minutes | 58 (10.3%) | 8 (1.5%) |
| 90 or more Minutes | 12 (2.1%) | 39 (7.3%) |
Time of Departure to Work by Sex in Kingston Springs
The most frequent times of departure to work in Kingston Springs are 6:30 AM to 6:59 AM (119, 21.1%) for males and 7:00 AM to 7:29 AM (120, 22.6%) for females.
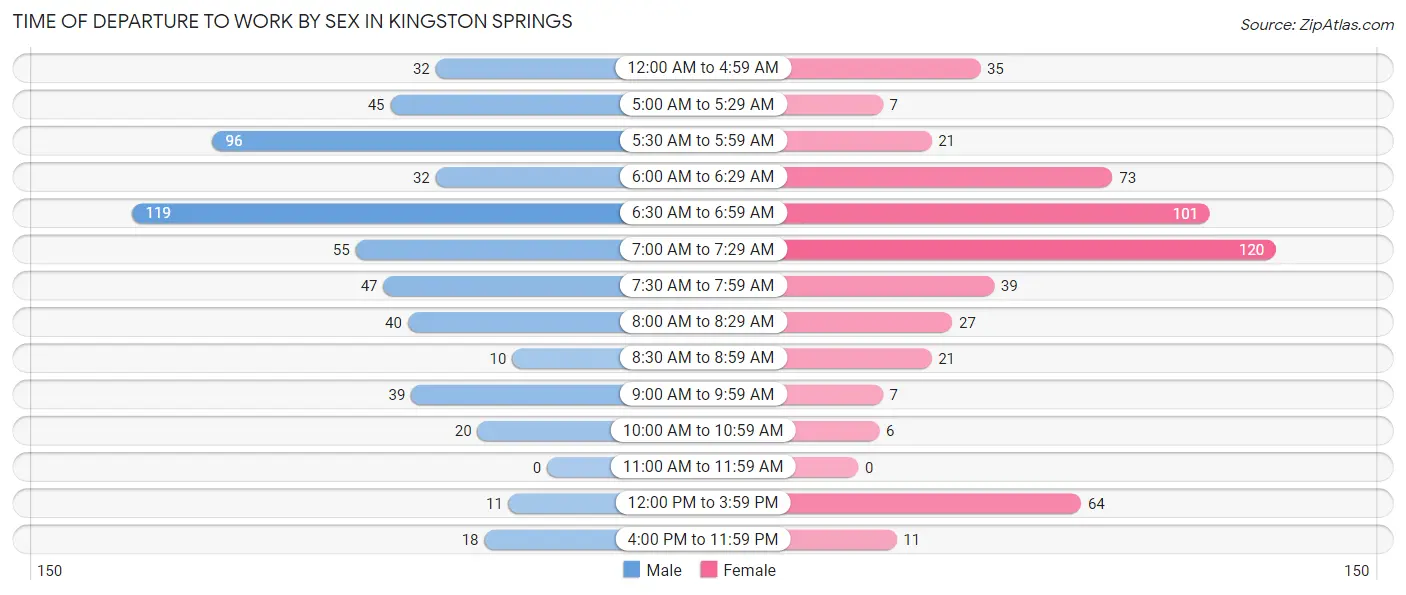
| Time of Departure | Male | Female |
| 12:00 AM to 4:59 AM | 32 (5.7%) | 35 (6.6%) |
| 5:00 AM to 5:29 AM | 45 (8.0%) | 7 (1.3%) |
| 5:30 AM to 5:59 AM | 96 (17.0%) | 21 (4.0%) |
| 6:00 AM to 6:29 AM | 32 (5.7%) | 73 (13.7%) |
| 6:30 AM to 6:59 AM | 119 (21.1%) | 101 (19.0%) |
| 7:00 AM to 7:29 AM | 55 (9.8%) | 120 (22.6%) |
| 7:30 AM to 7:59 AM | 47 (8.3%) | 39 (7.3%) |
| 8:00 AM to 8:29 AM | 40 (7.1%) | 27 (5.1%) |
| 8:30 AM to 8:59 AM | 10 (1.8%) | 21 (4.0%) |
| 9:00 AM to 9:59 AM | 39 (6.9%) | 7 (1.3%) |
| 10:00 AM to 10:59 AM | 20 (3.5%) | 6 (1.1%) |
| 11:00 AM to 11:59 AM | 0 (0.0%) | 0 (0.0%) |
| 12:00 PM to 3:59 PM | 11 (1.9%) | 64 (12.0%) |
| 4:00 PM to 11:59 PM | 18 (3.2%) | 11 (2.1%) |
| Total | 564 (100.0%) | 532 (100.0%) |
Housing Occupancy in Kingston Springs
Occupancy by Ownership in Kingston Springs
Of the total 1,029 dwellings in Kingston Springs, owner-occupied units account for 893 (86.8%), while renter-occupied units make up 136 (13.2%).
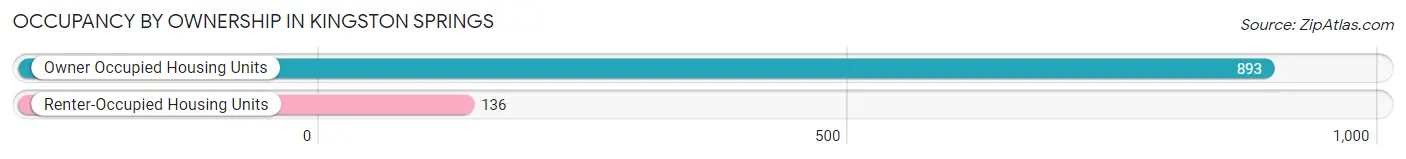
| Occupancy | # Housing Units | % Housing Units |
| Owner Occupied Housing Units | 893 | 86.8% |
| Renter-Occupied Housing Units | 136 | 13.2% |
| Total Occupied Housing Units | 1,029 | 100.0% |
Occupancy by Household Size in Kingston Springs
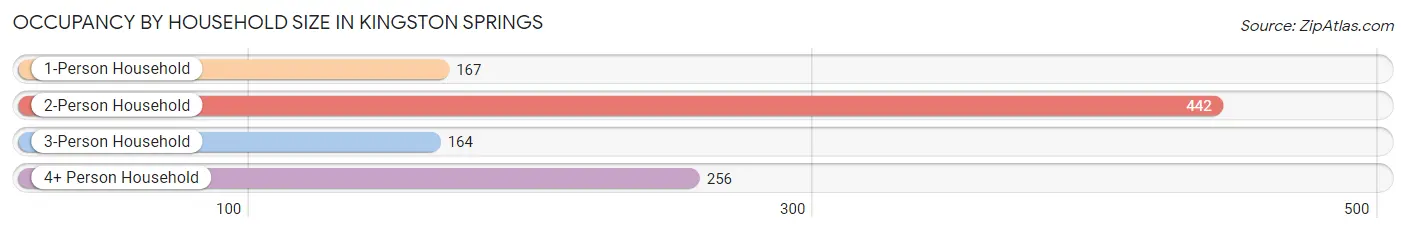
| Household Size | # Housing Units | % Housing Units |
| 1-Person Household | 167 | 16.2% |
| 2-Person Household | 442 | 42.9% |
| 3-Person Household | 164 | 15.9% |
| 4+ Person Household | 256 | 24.9% |
| Total Housing Units | 1,029 | 100.0% |
Occupancy by Ownership by Household Size in Kingston Springs
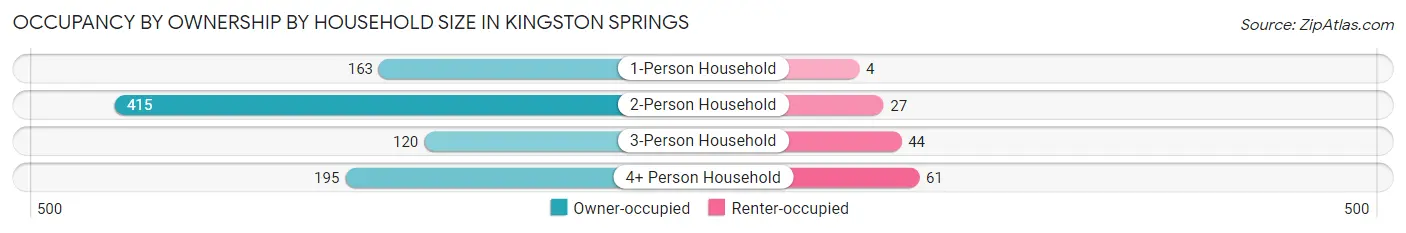
| Household Size | Owner-occupied | Renter-occupied |
| 1-Person Household | 163 (97.6%) | 4 (2.4%) |
| 2-Person Household | 415 (93.9%) | 27 (6.1%) |
| 3-Person Household | 120 (73.2%) | 44 (26.8%) |
| 4+ Person Household | 195 (76.2%) | 61 (23.8%) |
| Total Housing Units | 893 (86.8%) | 136 (13.2%) |
Occupancy by Educational Attainment in Kingston Springs
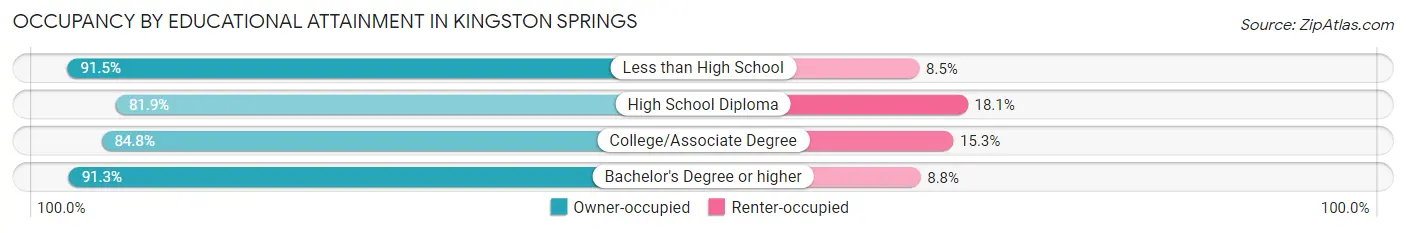
| Household Size | Owner-occupied | Renter-occupied |
| Less than High School | 43 (91.5%) | 4 (8.5%) |
| High School Diploma | 235 (81.9%) | 52 (18.1%) |
| College/Associate Degree | 250 (84.8%) | 45 (15.2%) |
| Bachelor's Degree or higher | 365 (91.2%) | 35 (8.7%) |
Occupancy by Age of Householder in Kingston Springs
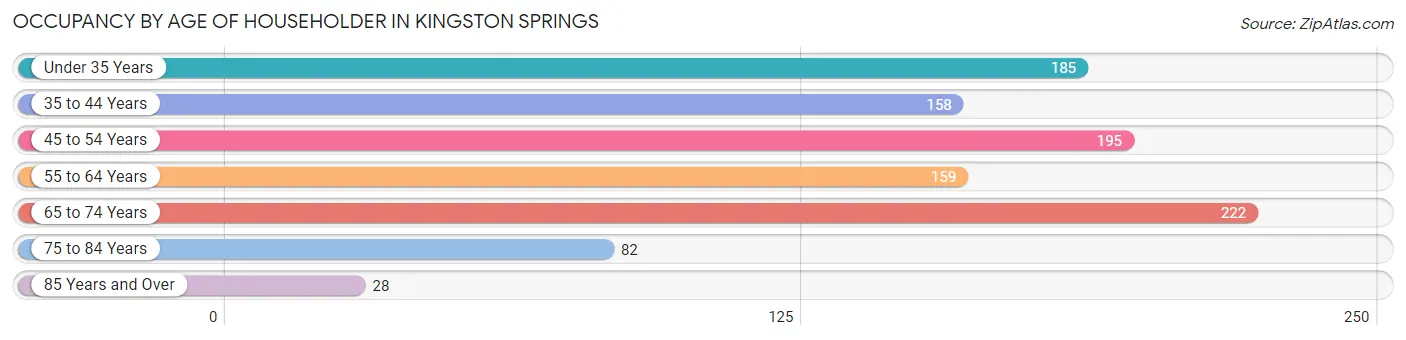
| Age Bracket | # Households | % Households |
| Under 35 Years | 185 | 18.0% |
| 35 to 44 Years | 158 | 15.3% |
| 45 to 54 Years | 195 | 19.0% |
| 55 to 64 Years | 159 | 15.4% |
| 65 to 74 Years | 222 | 21.6% |
| 75 to 84 Years | 82 | 8.0% |
| 85 Years and Over | 28 | 2.7% |
| Total | 1,029 | 100.0% |
Housing Finances in Kingston Springs
Median Income by Occupancy in Kingston Springs
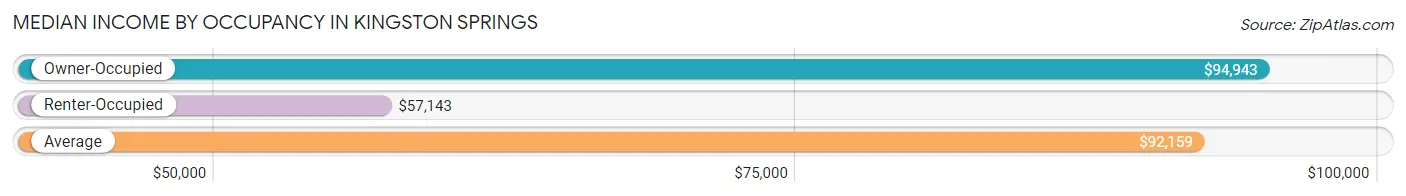
| Occupancy Type | # Households | Median Income |
| Owner-Occupied | 893 (86.8%) | $94,943 |
| Renter-Occupied | 136 (13.2%) | $57,143 |
| Average | 1,029 (100.0%) | $92,159 |
Occupancy by Householder Income Bracket in Kingston Springs
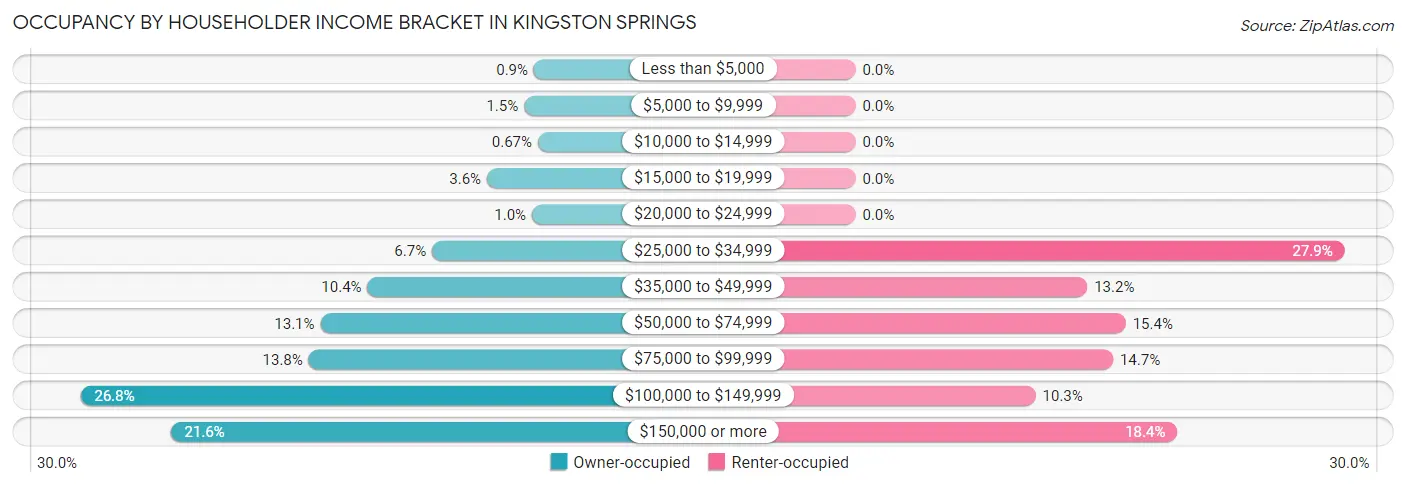
| Income Bracket | Owner-occupied | Renter-occupied |
| Less than $5,000 | 8 (0.9%) | 0 (0.0%) |
| $5,000 to $9,999 | 13 (1.5%) | 0 (0.0%) |
| $10,000 to $14,999 | 6 (0.7%) | 0 (0.0%) |
| $15,000 to $19,999 | 32 (3.6%) | 0 (0.0%) |
| $20,000 to $24,999 | 9 (1.0%) | 0 (0.0%) |
| $25,000 to $34,999 | 60 (6.7%) | 38 (27.9%) |
| $35,000 to $49,999 | 93 (10.4%) | 18 (13.2%) |
| $50,000 to $74,999 | 117 (13.1%) | 21 (15.4%) |
| $75,000 to $99,999 | 123 (13.8%) | 20 (14.7%) |
| $100,000 to $149,999 | 239 (26.8%) | 14 (10.3%) |
| $150,000 or more | 193 (21.6%) | 25 (18.4%) |
| Total | 893 (100.0%) | 136 (100.0%) |
Monthly Housing Cost Tiers in Kingston Springs
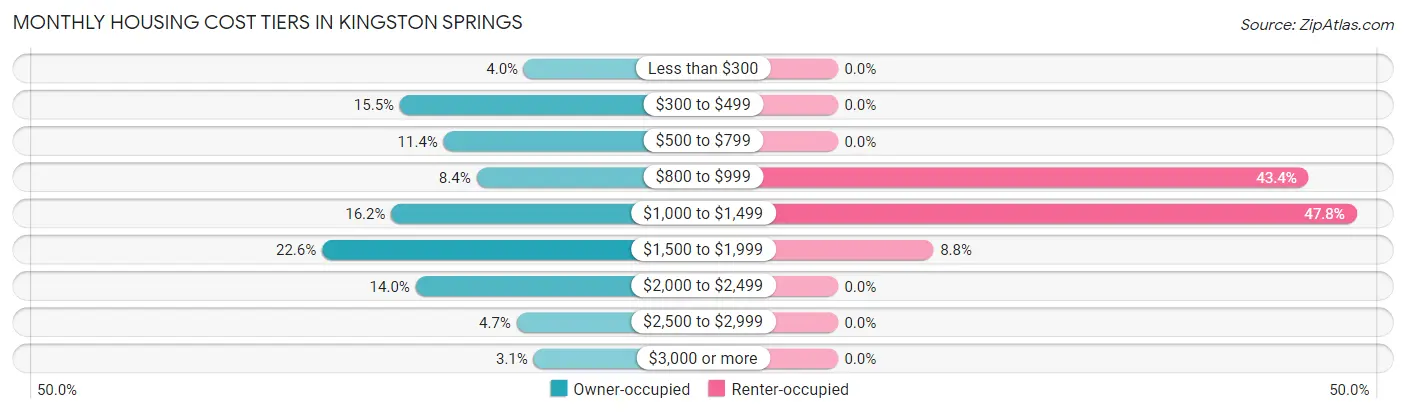
| Monthly Cost | Owner-occupied | Renter-occupied |
| Less than $300 | 36 (4.0%) | 0 (0.0%) |
| $300 to $499 | 138 (15.4%) | 0 (0.0%) |
| $500 to $799 | 102 (11.4%) | 0 (0.0%) |
| $800 to $999 | 75 (8.4%) | 59 (43.4%) |
| $1,000 to $1,499 | 145 (16.2%) | 65 (47.8%) |
| $1,500 to $1,999 | 202 (22.6%) | 12 (8.8%) |
| $2,000 to $2,499 | 125 (14.0%) | 0 (0.0%) |
| $2,500 to $2,999 | 42 (4.7%) | 0 (0.0%) |
| $3,000 or more | 28 (3.1%) | 0 (0.0%) |
| Total | 893 (100.0%) | 136 (100.0%) |
Physical Housing Characteristics in Kingston Springs
Housing Structures in Kingston Springs
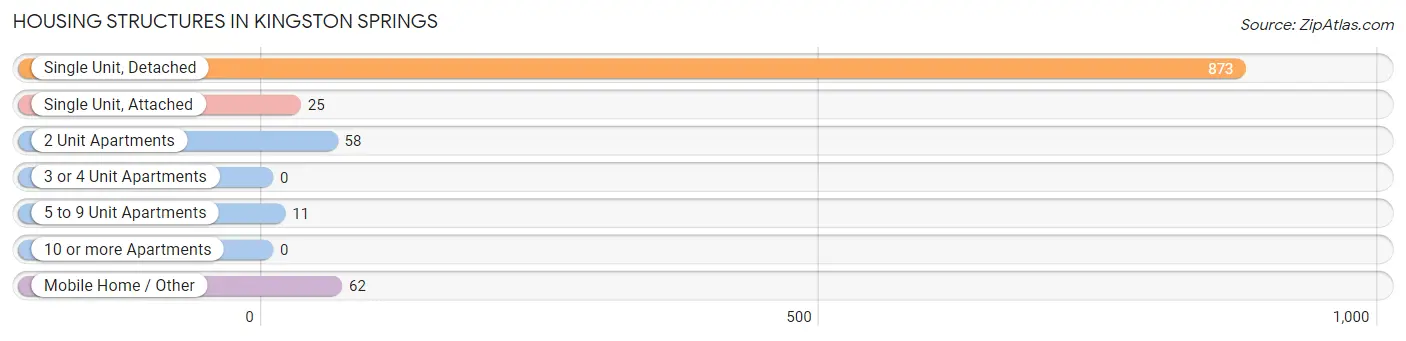
| Structure Type | # Housing Units | % Housing Units |
| Single Unit, Detached | 873 | 84.8% |
| Single Unit, Attached | 25 | 2.4% |
| 2 Unit Apartments | 58 | 5.6% |
| 3 or 4 Unit Apartments | 0 | 0.0% |
| 5 to 9 Unit Apartments | 11 | 1.1% |
| 10 or more Apartments | 0 | 0.0% |
| Mobile Home / Other | 62 | 6.0% |
| Total | 1,029 | 100.0% |
Housing Structures by Occupancy in Kingston Springs
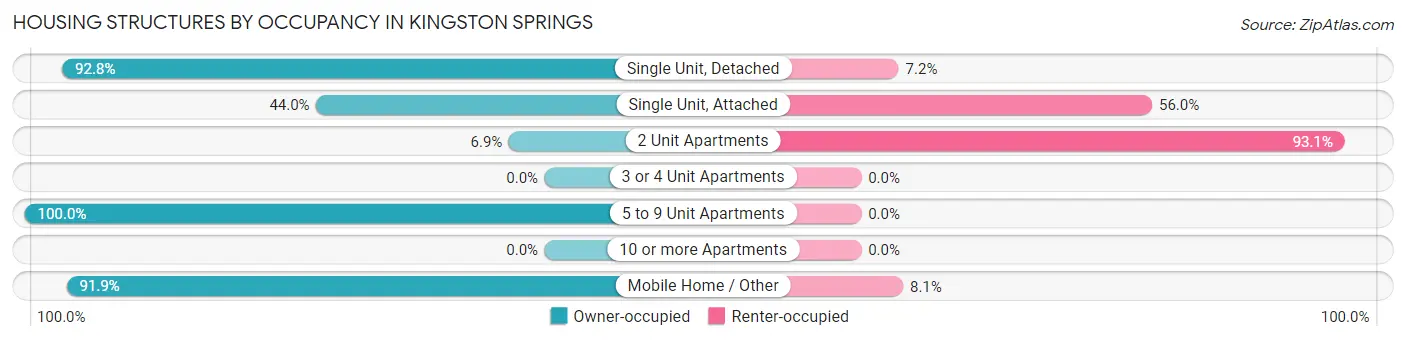
| Structure Type | Owner-occupied | Renter-occupied |
| Single Unit, Detached | 810 (92.8%) | 63 (7.2%) |
| Single Unit, Attached | 11 (44.0%) | 14 (56.0%) |
| 2 Unit Apartments | 4 (6.9%) | 54 (93.1%) |
| 3 or 4 Unit Apartments | 0 (0.0%) | 0 (0.0%) |
| 5 to 9 Unit Apartments | 11 (100.0%) | 0 (0.0%) |
| 10 or more Apartments | 0 (0.0%) | 0 (0.0%) |
| Mobile Home / Other | 57 (91.9%) | 5 (8.1%) |
| Total | 893 (86.8%) | 136 (13.2%) |
Housing Structures by Number of Rooms in Kingston Springs
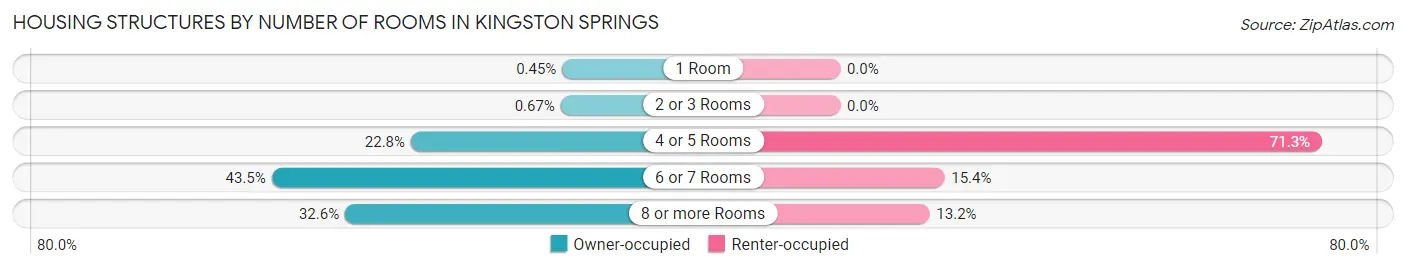
| Number of Rooms | Owner-occupied | Renter-occupied |
| 1 Room | 4 (0.4%) | 0 (0.0%) |
| 2 or 3 Rooms | 6 (0.7%) | 0 (0.0%) |
| 4 or 5 Rooms | 204 (22.8%) | 97 (71.3%) |
| 6 or 7 Rooms | 388 (43.4%) | 21 (15.4%) |
| 8 or more Rooms | 291 (32.6%) | 18 (13.2%) |
| Total | 893 (100.0%) | 136 (100.0%) |
Housing Structure by Heating Type in Kingston Springs
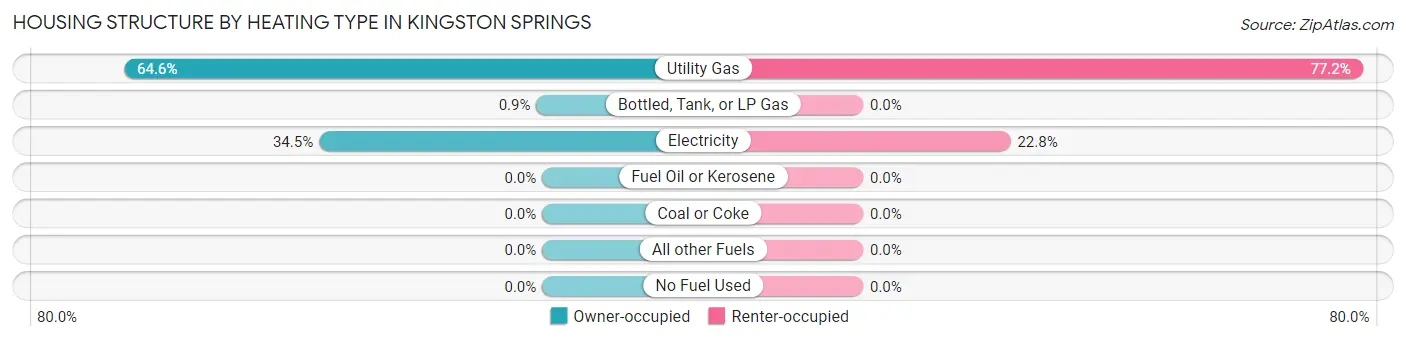
| Heating Type | Owner-occupied | Renter-occupied |
| Utility Gas | 577 (64.6%) | 105 (77.2%) |
| Bottled, Tank, or LP Gas | 8 (0.9%) | 0 (0.0%) |
| Electricity | 308 (34.5%) | 31 (22.8%) |
| Fuel Oil or Kerosene | 0 (0.0%) | 0 (0.0%) |
| Coal or Coke | 0 (0.0%) | 0 (0.0%) |
| All other Fuels | 0 (0.0%) | 0 (0.0%) |
| No Fuel Used | 0 (0.0%) | 0 (0.0%) |
| Total | 893 (100.0%) | 136 (100.0%) |
Household Vehicle Usage in Kingston Springs
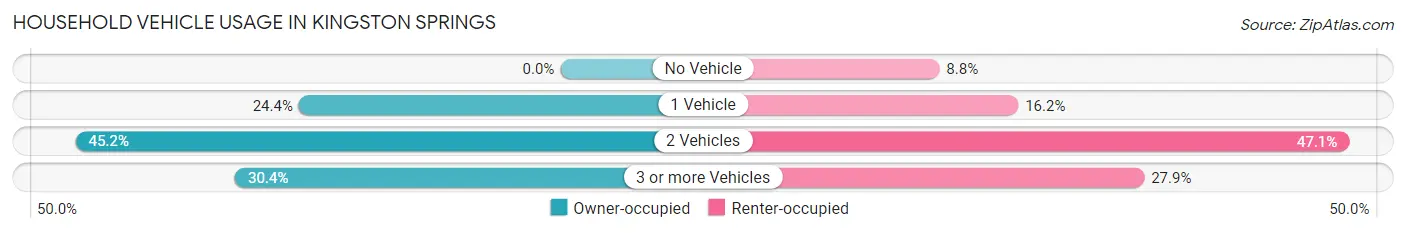
| Vehicles per Household | Owner-occupied | Renter-occupied |
| No Vehicle | 0 (0.0%) | 12 (8.8%) |
| 1 Vehicle | 218 (24.4%) | 22 (16.2%) |
| 2 Vehicles | 404 (45.2%) | 64 (47.1%) |
| 3 or more Vehicles | 271 (30.3%) | 38 (27.9%) |
| Total | 893 (100.0%) | 136 (100.0%) |
Real Estate & Mortgages in Kingston Springs
Real Estate and Mortgage Overview in Kingston Springs
| Characteristic | Without Mortgage | With Mortgage |
| Housing Units | 296 | 597 |
| Median Property Value | $305,100 | $341,300 |
| Median Household Income | $62,500 | $126 |
| Monthly Housing Costs | $482 | $28 |
| Real Estate Taxes | $2,288 | $44 |
Property Value by Mortgage Status in Kingston Springs
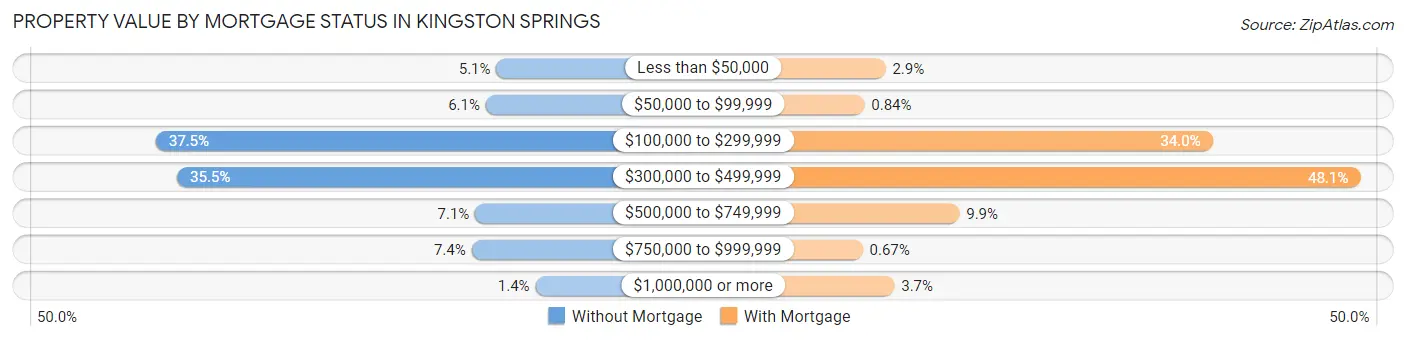
| Property Value | Without Mortgage | With Mortgage |
| Less than $50,000 | 15 (5.1%) | 17 (2.9%) |
| $50,000 to $99,999 | 18 (6.1%) | 5 (0.8%) |
| $100,000 to $299,999 | 111 (37.5%) | 203 (34.0%) |
| $300,000 to $499,999 | 105 (35.5%) | 287 (48.1%) |
| $500,000 to $749,999 | 21 (7.1%) | 59 (9.9%) |
| $750,000 to $999,999 | 22 (7.4%) | 4 (0.7%) |
| $1,000,000 or more | 4 (1.3%) | 22 (3.7%) |
| Total | 296 (100.0%) | 597 (100.0%) |
Household Income by Mortgage Status in Kingston Springs
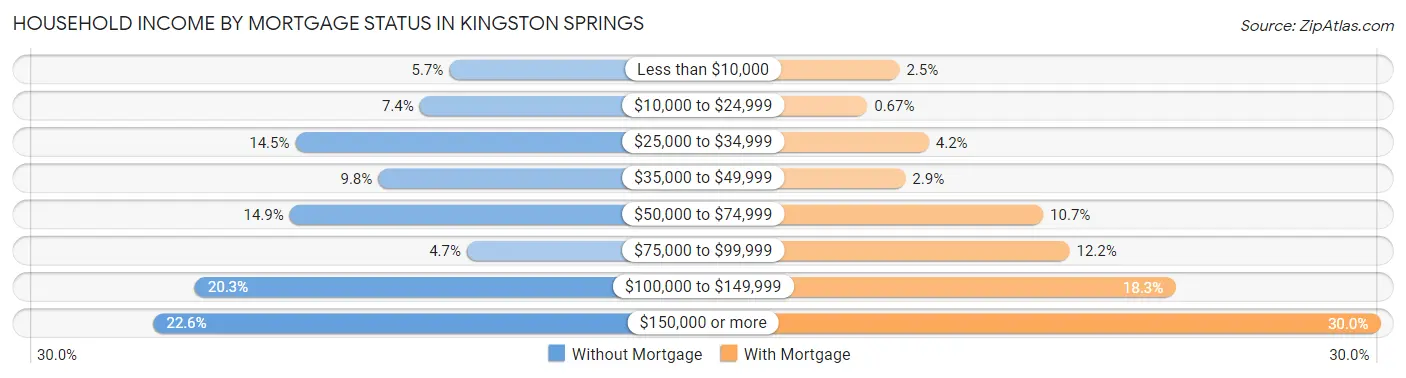
| Household Income | Without Mortgage | With Mortgage |
| Less than $10,000 | 17 (5.7%) | 15 (2.5%) |
| $10,000 to $24,999 | 22 (7.4%) | 4 (0.7%) |
| $25,000 to $34,999 | 43 (14.5%) | 25 (4.2%) |
| $35,000 to $49,999 | 29 (9.8%) | 17 (2.9%) |
| $50,000 to $74,999 | 44 (14.9%) | 64 (10.7%) |
| $75,000 to $99,999 | 14 (4.7%) | 73 (12.2%) |
| $100,000 to $149,999 | 60 (20.3%) | 109 (18.3%) |
| $150,000 or more | 67 (22.6%) | 179 (30.0%) |
| Total | 296 (100.0%) | 597 (100.0%) |
Property Value to Household Income Ratio in Kingston Springs
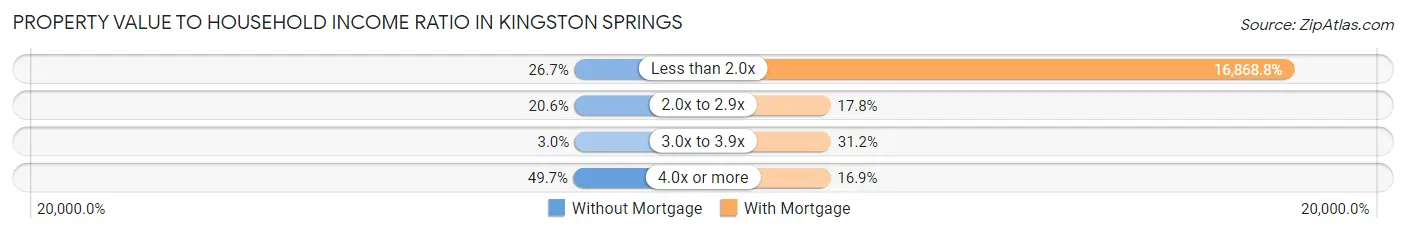
| Value-to-Income Ratio | Without Mortgage | With Mortgage |
| Less than 2.0x | 79 (26.7%) | 100,707 (16,868.8%) |
| 2.0x to 2.9x | 61 (20.6%) | 106 (17.8%) |
| 3.0x to 3.9x | 9 (3.0%) | 186 (31.2%) |
| 4.0x or more | 147 (49.7%) | 101 (16.9%) |
| Total | 296 (100.0%) | 597 (100.0%) |
Real Estate Taxes by Mortgage Status in Kingston Springs
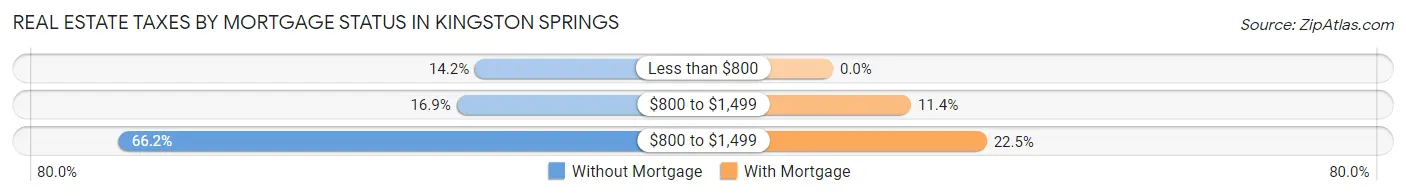
| Property Taxes | Without Mortgage | With Mortgage |
| Less than $800 | 42 (14.2%) | 0 (0.0%) |
| $800 to $1,499 | 50 (16.9%) | 68 (11.4%) |
| $800 to $1,499 | 196 (66.2%) | 134 (22.5%) |
| Total | 296 (100.0%) | 597 (100.0%) |
Health & Disability in Kingston Springs
Health Insurance Coverage by Age in Kingston Springs
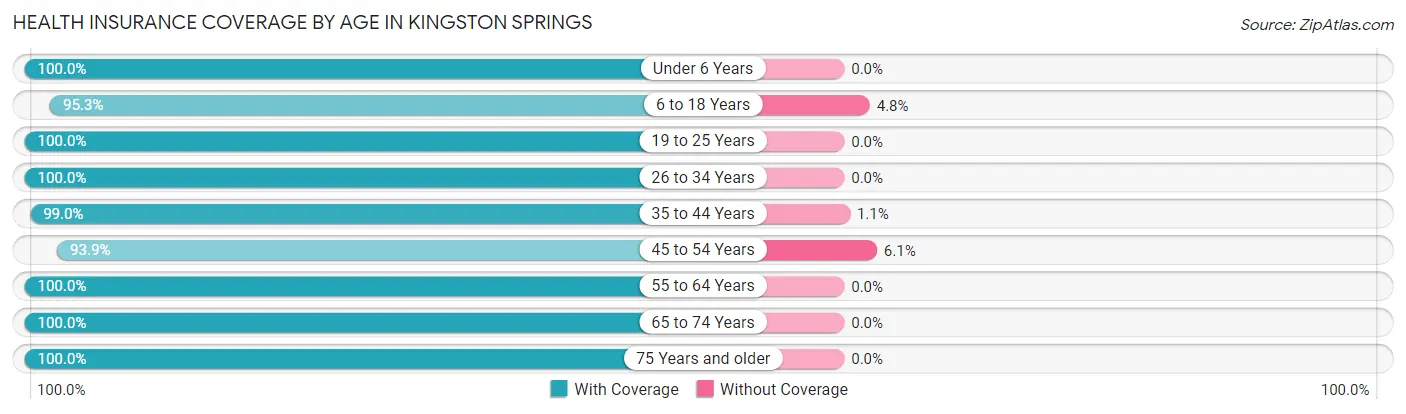
| Age Bracket | With Coverage | Without Coverage |
| Under 6 Years | 225 (100.0%) | 0 (0.0%) |
| 6 to 18 Years | 441 (95.3%) | 22 (4.8%) |
| 19 to 25 Years | 279 (100.0%) | 0 (0.0%) |
| 26 to 34 Years | 297 (100.0%) | 0 (0.0%) |
| 35 to 44 Years | 377 (99.0%) | 4 (1.1%) |
| 45 to 54 Years | 278 (93.9%) | 18 (6.1%) |
| 55 to 64 Years | 298 (100.0%) | 0 (0.0%) |
| 65 to 74 Years | 394 (100.0%) | 0 (0.0%) |
| 75 Years and older | 165 (100.0%) | 0 (0.0%) |
| Total | 2,754 (98.4%) | 44 (1.6%) |
Health Insurance Coverage by Citizenship Status in Kingston Springs
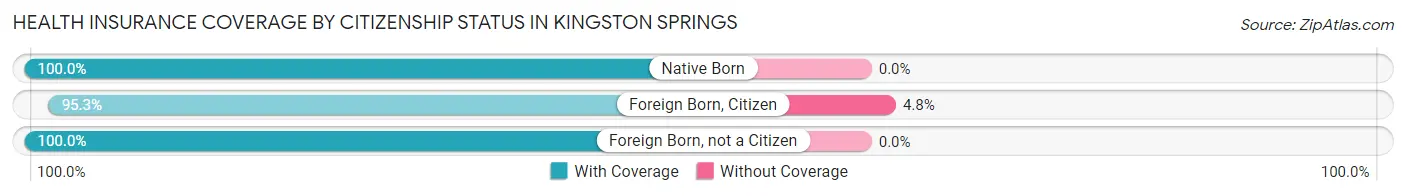
| Citizenship Status | With Coverage | Without Coverage |
| Native Born | 225 (100.0%) | 0 (0.0%) |
| Foreign Born, Citizen | 441 (95.3%) | 22 (4.8%) |
| Foreign Born, not a Citizen | 279 (100.0%) | 0 (0.0%) |
Health Insurance Coverage by Household Income in Kingston Springs
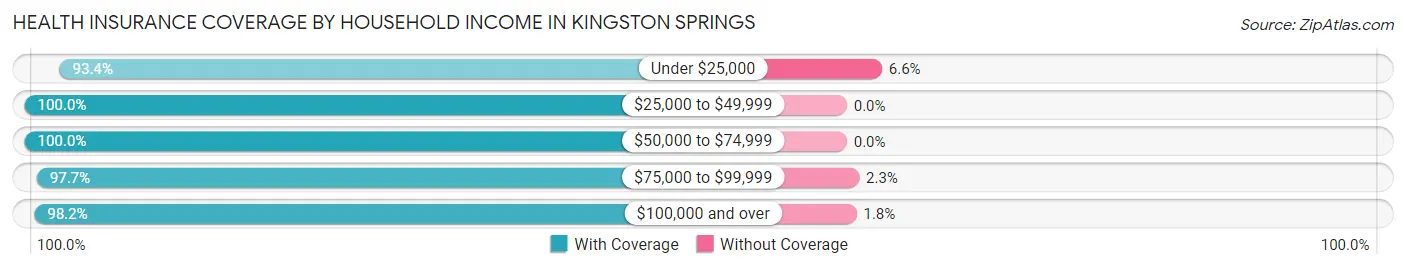
| Household Income | With Coverage | Without Coverage |
| Under $25,000 | 128 (93.4%) | 9 (6.6%) |
| $25,000 to $49,999 | 418 (100.0%) | 0 (0.0%) |
| $50,000 to $74,999 | 425 (100.0%) | 0 (0.0%) |
| $75,000 to $99,999 | 383 (97.7%) | 9 (2.3%) |
| $100,000 and over | 1,400 (98.2%) | 26 (1.8%) |
Public vs Private Health Insurance Coverage by Age in Kingston Springs
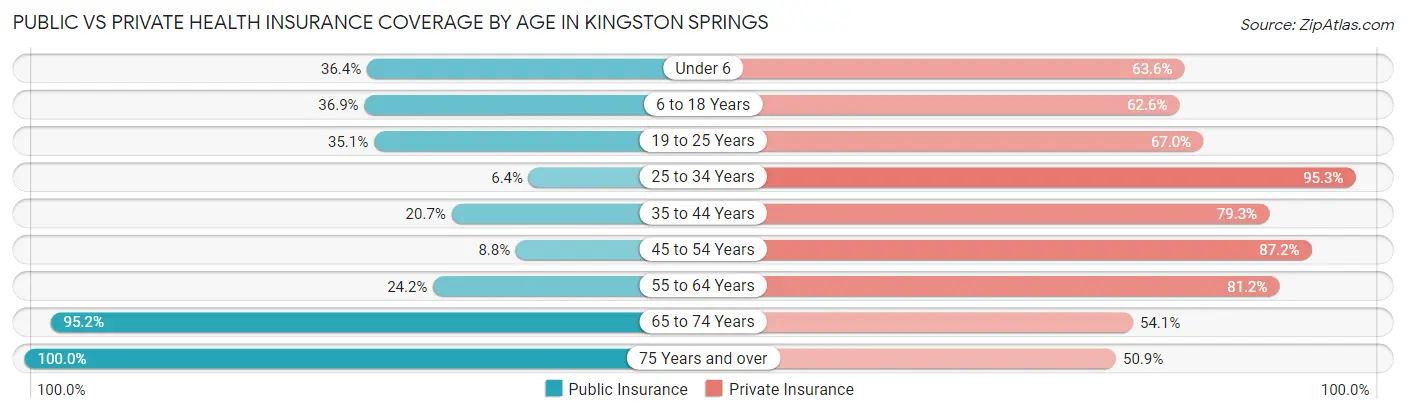
| Age Bracket | Public Insurance | Private Insurance |
| Under 6 | 82 (36.4%) | 143 (63.6%) |
| 6 to 18 Years | 171 (36.9%) | 290 (62.6%) |
| 19 to 25 Years | 98 (35.1%) | 187 (67.0%) |
| 25 to 34 Years | 19 (6.4%) | 283 (95.3%) |
| 35 to 44 Years | 79 (20.7%) | 302 (79.3%) |
| 45 to 54 Years | 26 (8.8%) | 258 (87.2%) |
| 55 to 64 Years | 72 (24.2%) | 242 (81.2%) |
| 65 to 74 Years | 375 (95.2%) | 213 (54.1%) |
| 75 Years and over | 165 (100.0%) | 84 (50.9%) |
| Total | 1,087 (38.9%) | 2,002 (71.6%) |
Disability Status by Sex by Age in Kingston Springs
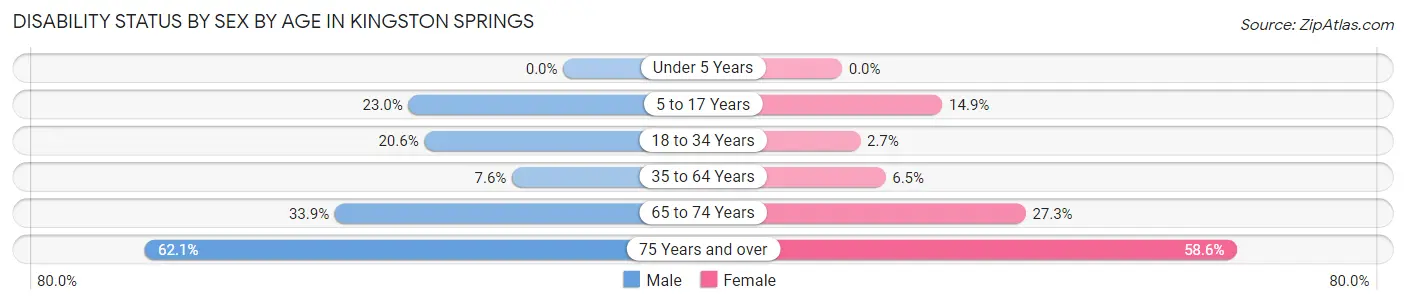
| Age Bracket | Male | Female |
| Under 5 Years | 0 (0.0%) | 0 (0.0%) |
| 5 to 17 Years | 54 (23.0%) | 31 (14.9%) |
| 18 to 34 Years | 53 (20.6%) | 10 (2.7%) |
| 35 to 64 Years | 40 (7.6%) | 29 (6.5%) |
| 65 to 74 Years | 59 (33.9%) | 60 (27.3%) |
| 75 Years and over | 59 (62.1%) | 41 (58.6%) |
Disability Class by Sex by Age in Kingston Springs
Disability Class: Hearing Difficulty
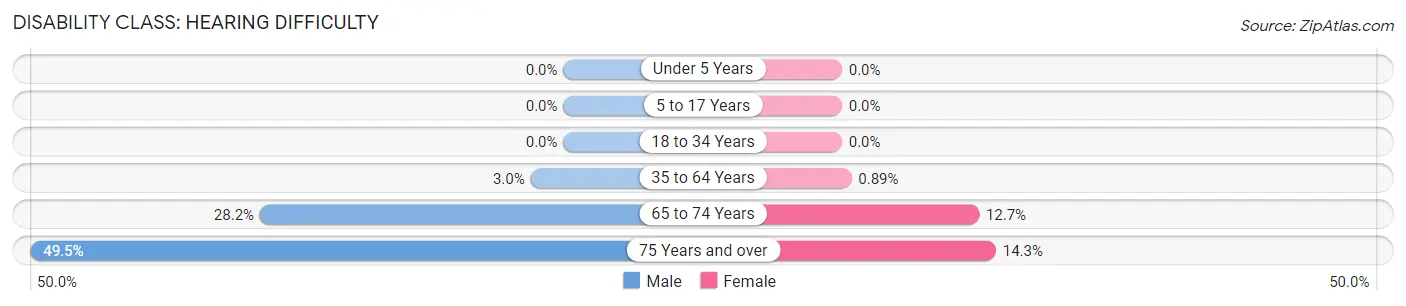
| Age Bracket | Male | Female |
| Under 5 Years | 0 (0.0%) | 0 (0.0%) |
| 5 to 17 Years | 0 (0.0%) | 0 (0.0%) |
| 18 to 34 Years | 0 (0.0%) | 0 (0.0%) |
| 35 to 64 Years | 16 (3.0%) | 4 (0.9%) |
| 65 to 74 Years | 49 (28.2%) | 28 (12.7%) |
| 75 Years and over | 47 (49.5%) | 10 (14.3%) |
Disability Class: Vision Difficulty
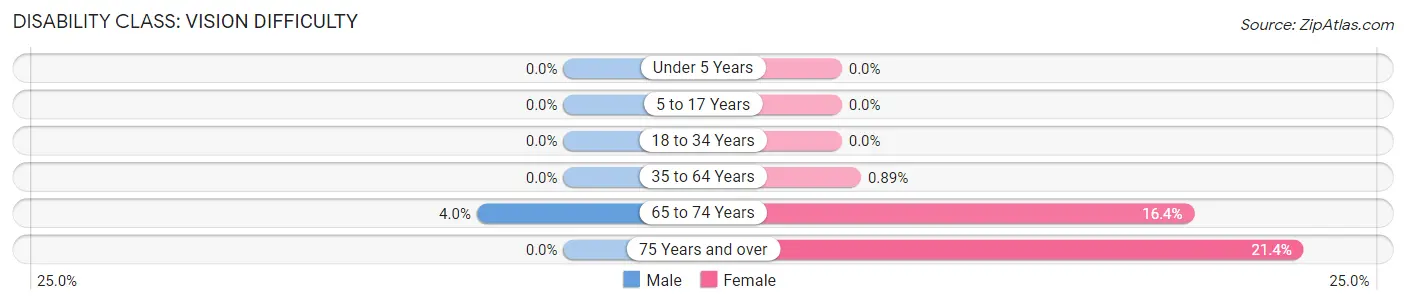
| Age Bracket | Male | Female |
| Under 5 Years | 0 (0.0%) | 0 (0.0%) |
| 5 to 17 Years | 0 (0.0%) | 0 (0.0%) |
| 18 to 34 Years | 0 (0.0%) | 0 (0.0%) |
| 35 to 64 Years | 0 (0.0%) | 4 (0.9%) |
| 65 to 74 Years | 7 (4.0%) | 36 (16.4%) |
| 75 Years and over | 0 (0.0%) | 15 (21.4%) |
Disability Class: Cognitive Difficulty
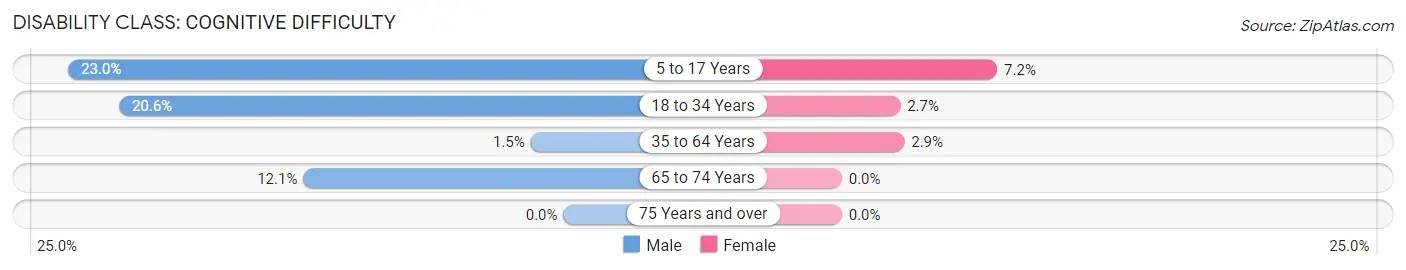
| Age Bracket | Male | Female |
| 5 to 17 Years | 54 (23.0%) | 15 (7.2%) |
| 18 to 34 Years | 53 (20.6%) | 10 (2.7%) |
| 35 to 64 Years | 8 (1.5%) | 13 (2.9%) |
| 65 to 74 Years | 21 (12.1%) | 0 (0.0%) |
| 75 Years and over | 0 (0.0%) | 0 (0.0%) |
Disability Class: Ambulatory Difficulty
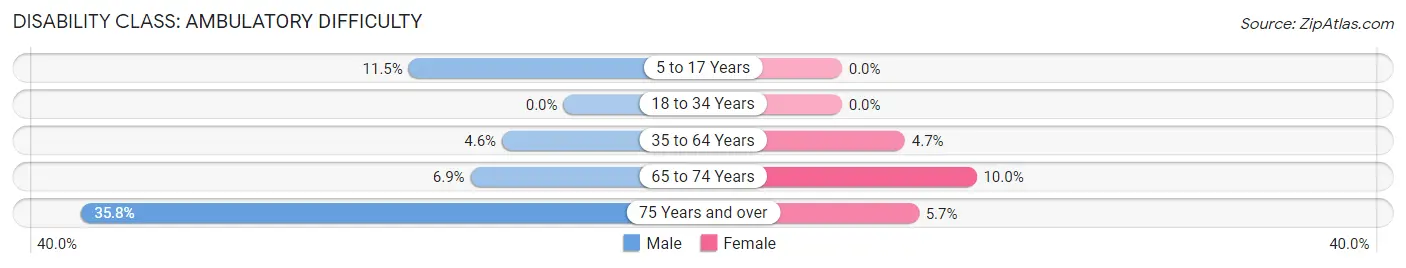
| Age Bracket | Male | Female |
| 5 to 17 Years | 27 (11.5%) | 0 (0.0%) |
| 18 to 34 Years | 0 (0.0%) | 0 (0.0%) |
| 35 to 64 Years | 24 (4.6%) | 21 (4.7%) |
| 65 to 74 Years | 12 (6.9%) | 22 (10.0%) |
| 75 Years and over | 34 (35.8%) | 4 (5.7%) |
Disability Class: Self-Care Difficulty
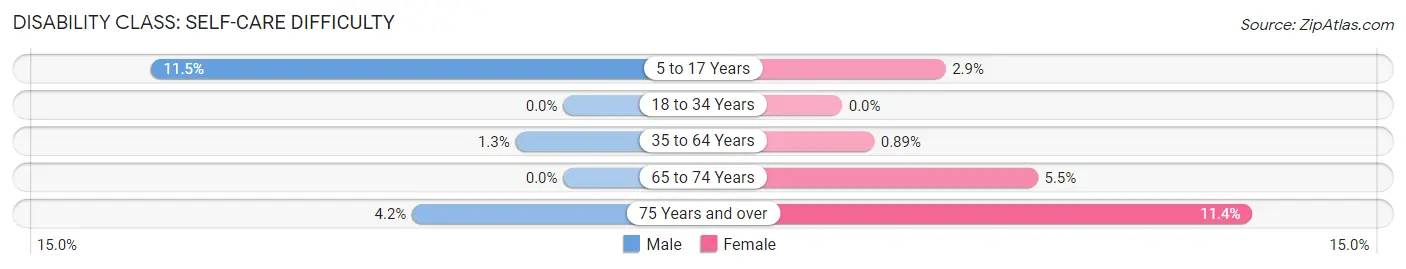
| Age Bracket | Male | Female |
| 5 to 17 Years | 27 (11.5%) | 6 (2.9%) |
| 18 to 34 Years | 0 (0.0%) | 0 (0.0%) |
| 35 to 64 Years | 7 (1.3%) | 4 (0.9%) |
| 65 to 74 Years | 0 (0.0%) | 12 (5.4%) |
| 75 Years and over | 4 (4.2%) | 8 (11.4%) |
Technology Access in Kingston Springs
Computing Device Access in Kingston Springs
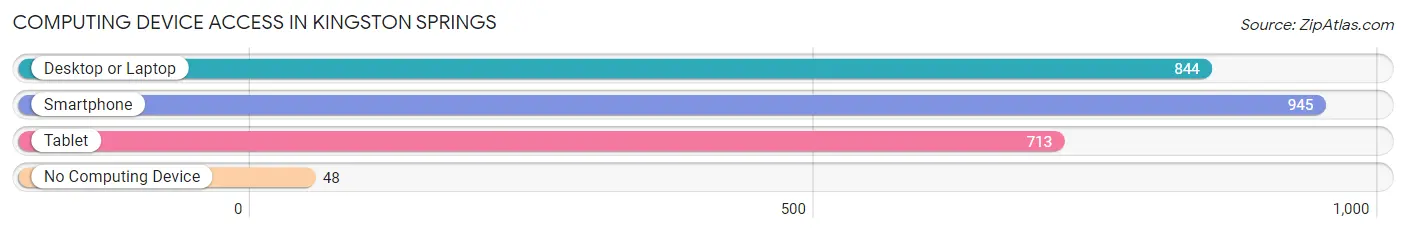
| Device Type | # Households | % Households |
| Desktop or Laptop | 844 | 82.0% |
| Smartphone | 945 | 91.8% |
| Tablet | 713 | 69.3% |
| No Computing Device | 48 | 4.7% |
| Total | 1,029 | 100.0% |
Internet Access in Kingston Springs
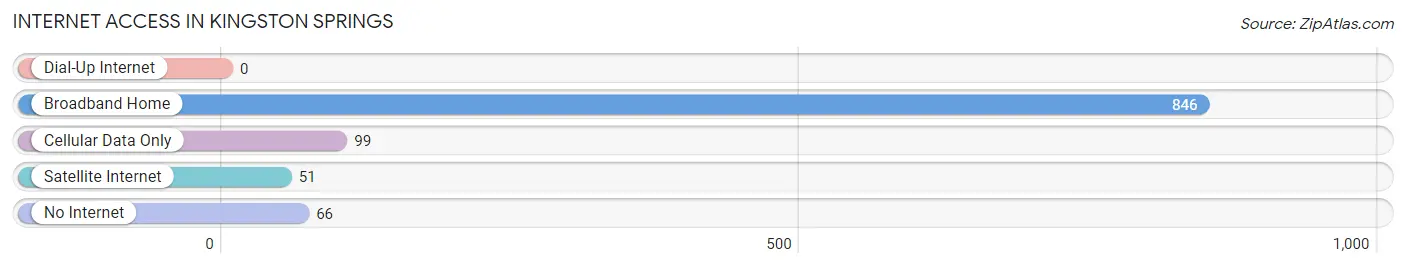
| Internet Type | # Households | % Households |
| Dial-Up Internet | 0 | 0.0% |
| Broadband Home | 846 | 82.2% |
| Cellular Data Only | 99 | 9.6% |
| Satellite Internet | 51 | 5.0% |
| No Internet | 66 | 6.4% |
| Total | 1,029 | 100.0% |
Kingston Springs Summary
Kingston Springs is a small town located in Cheatham County, Tennessee, about 25 miles west of Nashville. It is situated on the banks of the Harpeth River and is part of the Nashville metropolitan area. The town has a population of approximately 2,000 people and is known for its rural charm and small-town atmosphere.
History
The area that is now Kingston Springs was first settled in the early 1800s by a group of settlers from North Carolina. The town was originally known as Harpeth Springs, named after the nearby Harpeth River. In 1836, the town was renamed Kingston Springs after the Kingston family, who had purchased the land from the original settlers.
The town grew slowly over the years, and by the late 1800s, it had become a popular destination for tourists and vacationers. The town was known for its mineral springs, which were believed to have healing properties. In the early 1900s, the town was home to several resorts, including the Kingston Springs Hotel and the Harpeth Springs Hotel.
In the mid-1900s, Kingston Springs began to experience a decline in tourism. The resorts closed and the town's population began to decline. In the late 1970s, the town was revitalized with the opening of a new golf course and the development of a residential community.
Geography
Kingston Springs is located in Cheatham County, Tennessee, about 25 miles west of Nashville. The town is situated on the banks of the Harpeth River and is part of the Nashville metropolitan area. The town has a total area of 4.2 square miles, all of which is land.
The town is located in a hilly area, with elevations ranging from 500 to 800 feet above sea level. The town is located in a humid subtropical climate zone, with hot summers and mild winters. The average annual temperature is around 60 degrees Fahrenheit.
Economy
The economy of Kingston Springs is largely based on tourism and retail. The town is home to several small businesses, including restaurants, shops, and galleries. The town is also home to a golf course, which attracts visitors from all over the region.
The town is also home to several manufacturing companies, including a furniture factory and a plastics factory. The town is also home to a number of farms, which produce a variety of crops, including corn, soybeans, and hay.
Demographics
As of the 2010 census, the population of Kingston Springs was 2,095. The racial makeup of the town was 94.3% White, 2.2% African American, 0.3% Native American, 0.7% Asian, 0.1% Pacific Islander, 0.7% from other races, and 1.9% from two or more races. Hispanic or Latino of any race were 2.2% of the population.
The median household income in Kingston Springs was $50,938, and the median family income was $60,938. The per capita income for the town was $25,938. About 8.3% of families and 10.2% of the population were below the poverty line, including 14.2% of those under age 18 and 8.3% of those age 65 or over.
Common Questions
What is Per Capita Income in Kingston Springs?
Per Capita income in Kingston Springs is $44,830.
What is the Median Family Income in Kingston Springs?
Median Family Income in Kingston Springs is $99,432.
What is the Median Household income in Kingston Springs?
Median Household Income in Kingston Springs is $92,159.
What is Income or Wage Gap in Kingston Springs?
Income or Wage Gap in Kingston Springs is 38.9%.
Women in Kingston Springs earn 61.1 cents for every dollar earned by a man.
What is Inequality or Gini Index in Kingston Springs?
Inequality or Gini Index in Kingston Springs is 0.44.
What is the Total Population of Kingston Springs?
Total Population of Kingston Springs is 2,798.
What is the Total Male Population of Kingston Springs?
Total Male Population of Kingston Springs is 1,360.
What is the Total Female Population of Kingston Springs?
Total Female Population of Kingston Springs is 1,438.
What is the Ratio of Males per 100 Females in Kingston Springs?
There are 94.58 Males per 100 Females in Kingston Springs.
What is the Ratio of Females per 100 Males in Kingston Springs?
There are 105.74 Females per 100 Males in Kingston Springs.
What is the Median Population Age in Kingston Springs?
Median Population Age in Kingston Springs is 38.7 Years.
What is the Average Family Size in Kingston Springs
Average Family Size in Kingston Springs is 2.9 People.
What is the Average Household Size in Kingston Springs
Average Household Size in Kingston Springs is 2.7 People.
How Large is the Labor Force in Kingston Springs?
There are 1,437 People in the Labor Forcein in Kingston Springs.
What is the Percentage of People in the Labor Force in Kingston Springs?
65.0% of People are in the Labor Force in Kingston Springs.
What is the Unemployment Rate in Kingston Springs?
Unemployment Rate in Kingston Springs is 3.8%.