Zip Codes with the Highest Percentage of Households with Income Above $200,000 in Memphis, TN
RELATED REPORTS & OPTIONS
Household Income | $200k+
Memphis
Compare Zip Codes
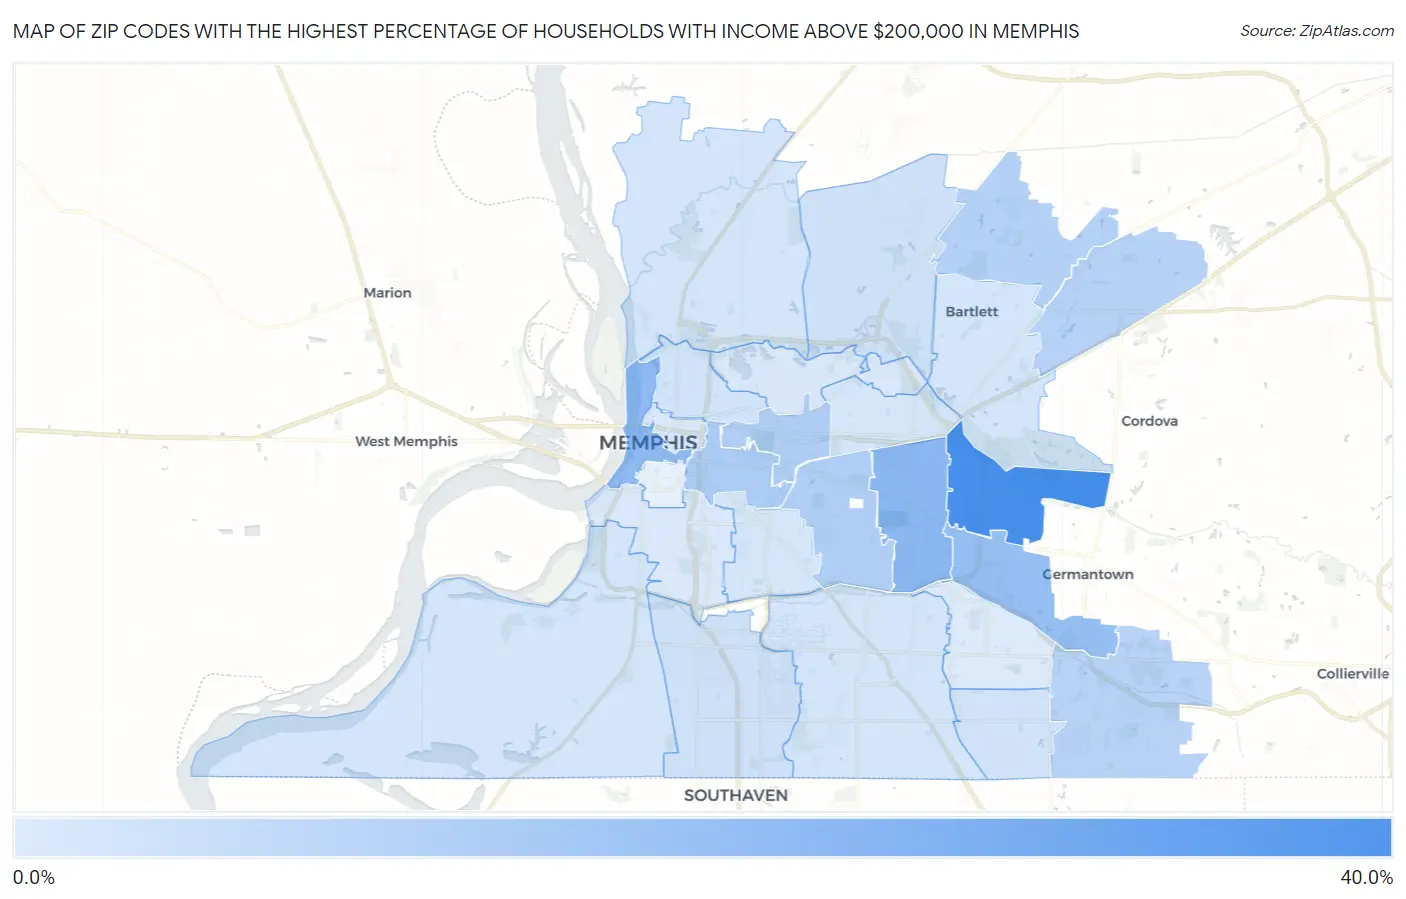
Map of Zip Codes with the Highest Percentage of Households with Income Above $200,000 in Memphis
0.40%
30.2%
Zip Codes with the Highest Percentage of Households with Income Above $200,000 in Memphis, TN
| Zip Code | Households with Income > $200k | vs State | vs National | |
| 1. | 38120 | 30.2% | 7.3%(+22.9)#11 | 11.4%(+18.8)#1,435 |
| 2. | 38117 | 15.9% | 7.3%(+8.60)#30 | 11.4%(+4.50)#4,606 |
| 3. | 38103 | 15.0% | 7.3%(+7.70)#35 | 11.4%(+3.60)#4,987 |
| 4. | 38119 | 13.8% | 7.3%(+6.50)#44 | 11.4%(+2.40)#5,566 |
| 5. | 38104 | 9.4% | 7.3%(+2.10)#79 | 11.4%(-2.00)#8,850 |
| 6. | 38111 | 8.6% | 7.3%(+1.30)#94 | 11.4%(-2.80)#9,632 |
| 7. | 38112 | 8.6% | 7.3%(+1.30)#96 | 11.4%(-2.80)#9,650 |
| 8. | 38135 | 8.1% | 7.3%(+0.800)#107 | 11.4%(-3.30)#10,231 |
| 9. | 38133 | 7.5% | 7.3%(+0.200)#117 | 11.4%(-3.90)#11,058 |
| 10. | 38125 | 6.9% | 7.3%(-0.400)#137 | 11.4%(-4.50)#11,903 |
| 11. | 38128 | 3.0% | 7.3%(-4.30)#338 | 11.4%(-8.40)#20,871 |
| 12. | 38116 | 2.8% | 7.3%(-4.50)#356 | 11.4%(-8.60)#21,421 |
| 13. | 38141 | 2.3% | 7.3%(-5.00)#403 | 11.4%(-9.10)#22,914 |
| 14. | 38107 | 2.3% | 7.3%(-5.00)#404 | 11.4%(-9.10)#22,938 |
| 15. | 38109 | 2.2% | 7.3%(-5.10)#408 | 11.4%(-9.20)#23,164 |
| 16. | 38118 | 2.1% | 7.3%(-5.20)#416 | 11.4%(-9.30)#23,448 |
| 17. | 38134 | 1.9% | 7.3%(-5.40)#436 | 11.4%(-9.50)#24,036 |
| 18. | 38127 | 1.9% | 7.3%(-5.40)#437 | 11.4%(-9.50)#24,039 |
| 19. | 38122 | 1.8% | 7.3%(-5.50)#444 | 11.4%(-9.60)#24,305 |
| 20. | 38114 | 1.8% | 7.3%(-5.50)#445 | 11.4%(-9.60)#24,310 |
| 21. | 38108 | 1.3% | 7.3%(-6.00)#478 | 11.4%(-10.1)#25,537 |
| 22. | 38106 | 1.0% | 7.3%(-6.30)#495 | 11.4%(-10.4)#26,180 |
| 23. | 38105 | 1.0% | 7.3%(-6.30)#499 | 11.4%(-10.4)#26,219 |
| 24. | 38115 | 0.40% | 7.3%(-6.90)#525 | 11.4%(-11.0)#27,232 |
1
Common Questions
What are the Top 10 Zip Codes with the Highest Percentage of Households with Income Above $200,000 in Memphis, TN?
Top 10 Zip Codes with the Highest Percentage of Households with Income Above $200,000 in Memphis, TN are:
What zip code has the Highest Percentage of Households with Income Above $200,000 in Memphis, TN?
38120 has the Highest Percentage of Households with Income Above $200,000 in Memphis, TN with 30.2%.
What is the Percentage of Households with Income Above $200,000 in Memphis, TN?
Percentage of Households with Income Above $200,000 in Memphis is 5.5%.
What is the Percentage of Households with Income Above $200,000 in Tennessee?
Percentage of Households with Income Above $200,000 in Tennessee is 7.3%.
What is the Percentage of Households with Income Above $200,000 in the United States?
Percentage of Households with Income Above $200,000 in the United States is 11.4%.