Sale Creek, TN Map & Demographics
Sale Creek Map
Sale Creek Overview
$33,271
PER CAPITA INCOME
$58,750
AVG FAMILY INCOME
$53,827
AVG HOUSEHOLD INCOME
39.3%
WAGE / INCOME GAP [ % ]
60.7¢/ $1
WAGE / INCOME GAP [ $ ]
0.44
INEQUALITY / GINI INDEX
3,065
TOTAL POPULATION
1,590
MALE POPULATION
1,475
FEMALE POPULATION
107.80
MALES / 100 FEMALES
92.77
FEMALES / 100 MALES
47.5
MEDIAN AGE
3.3
AVG FAMILY SIZE
3.0
AVG HOUSEHOLD SIZE
1,163
LABOR FORCE [ PEOPLE ]
46.6%
PERCENT IN LABOR FORCE
4.0%
UNEMPLOYMENT RATE
Sale Creek Zip Codes
Sale Creek Area Codes
Income in Sale Creek
Income Overview in Sale Creek
Per Capita Income in Sale Creek is $33,271, while median incomes of families and households are $58,750 and $53,827 respectively.
| Characteristic | Number | Measure |
| Per Capita Income | 3,065 | $33,271 |
| Median Family Income | 843 | $58,750 |
| Mean Family Income | 843 | $97,865 |
| Median Household Income | 1,027 | $53,827 |
| Mean Household Income | 1,027 | $94,406 |
| Income Deficit | 843 | $0 |
| Wage / Income Gap (%) | 3,065 | 39.26% |
| Wage / Income Gap ($) | 3,065 | 60.74¢ per $1 |
| Gini / Inequality Index | 3,065 | 0.44 |
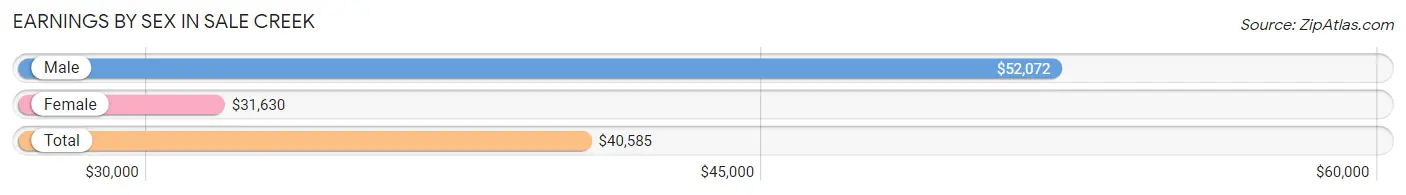
Earnings by Sex in Sale Creek
Average Earnings in Sale Creek are $40,585, $52,072 for men and $31,630 for women, a difference of 39.3%.
| Sex | Number | Average Earnings |
| Male | 681 (54.3%) | $52,072 |
| Female | 574 (45.7%) | $31,630 |
| Total | 1,255 (100.0%) | $40,585 |
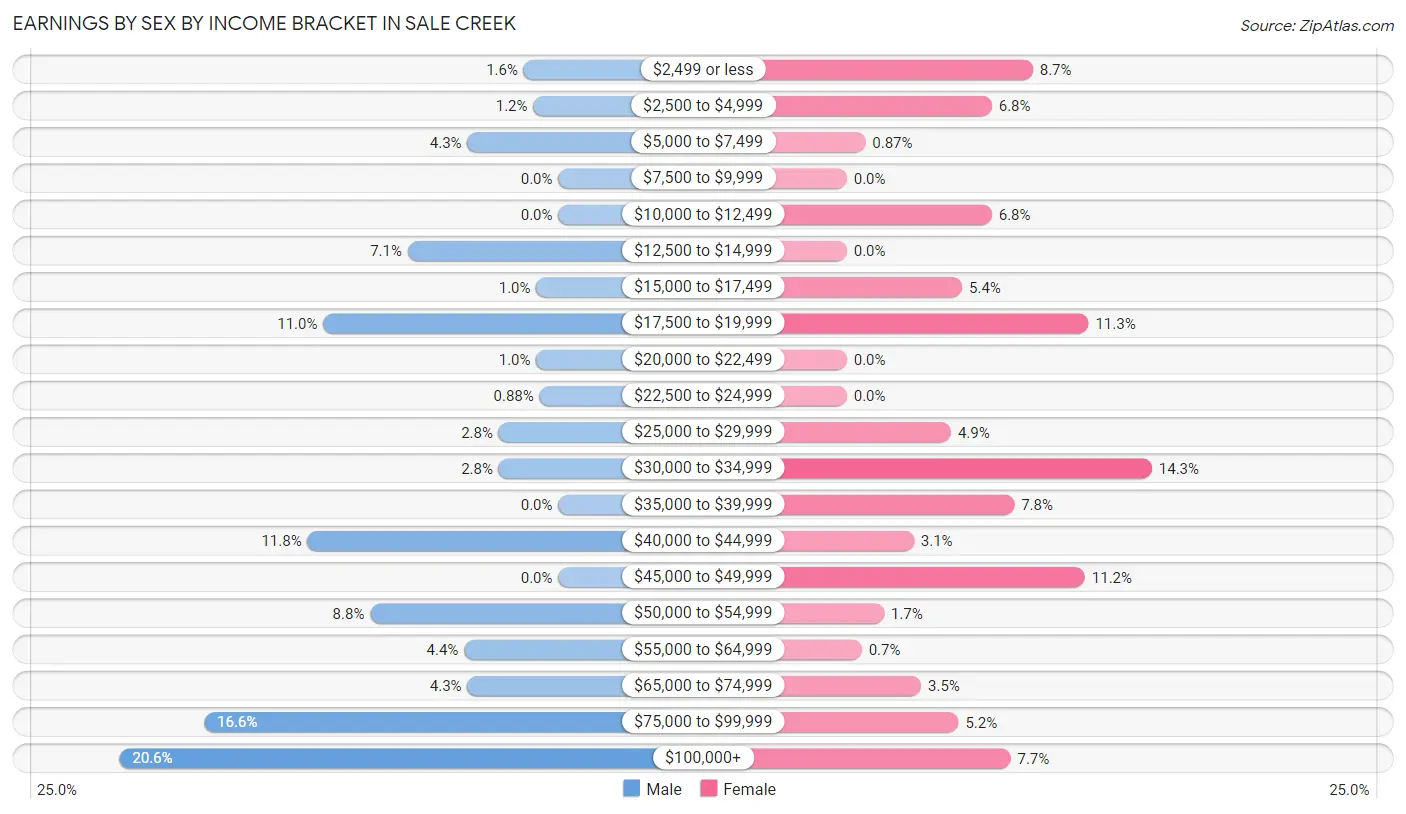
Earnings by Sex by Income Bracket in Sale Creek
The most common earnings brackets in Sale Creek are $100,000+ for men (140 | 20.6%) and $30,000 to $34,999 for women (82 | 14.3%).
| Income | Male | Female |
| $2,499 or less | 11 (1.6%) | 50 (8.7%) |
| $2,500 to $4,999 | 8 (1.2%) | 39 (6.8%) |
| $5,000 to $7,499 | 29 (4.3%) | 5 (0.9%) |
| $7,500 to $9,999 | 0 (0.0%) | 0 (0.0%) |
| $10,000 to $12,499 | 0 (0.0%) | 39 (6.8%) |
| $12,500 to $14,999 | 48 (7.0%) | 0 (0.0%) |
| $15,000 to $17,499 | 7 (1.0%) | 31 (5.4%) |
| $17,500 to $19,999 | 75 (11.0%) | 65 (11.3%) |
| $20,000 to $22,499 | 7 (1.0%) | 0 (0.0%) |
| $22,500 to $24,999 | 6 (0.9%) | 0 (0.0%) |
| $25,000 to $29,999 | 19 (2.8%) | 28 (4.9%) |
| $30,000 to $34,999 | 19 (2.8%) | 82 (14.3%) |
| $35,000 to $39,999 | 0 (0.0%) | 45 (7.8%) |
| $40,000 to $44,999 | 80 (11.7%) | 18 (3.1%) |
| $45,000 to $49,999 | 0 (0.0%) | 64 (11.2%) |
| $50,000 to $54,999 | 60 (8.8%) | 10 (1.7%) |
| $55,000 to $64,999 | 30 (4.4%) | 4 (0.7%) |
| $65,000 to $74,999 | 29 (4.3%) | 20 (3.5%) |
| $75,000 to $99,999 | 113 (16.6%) | 30 (5.2%) |
| $100,000+ | 140 (20.6%) | 44 (7.7%) |
| Total | 681 (100.0%) | 574 (100.0%) |
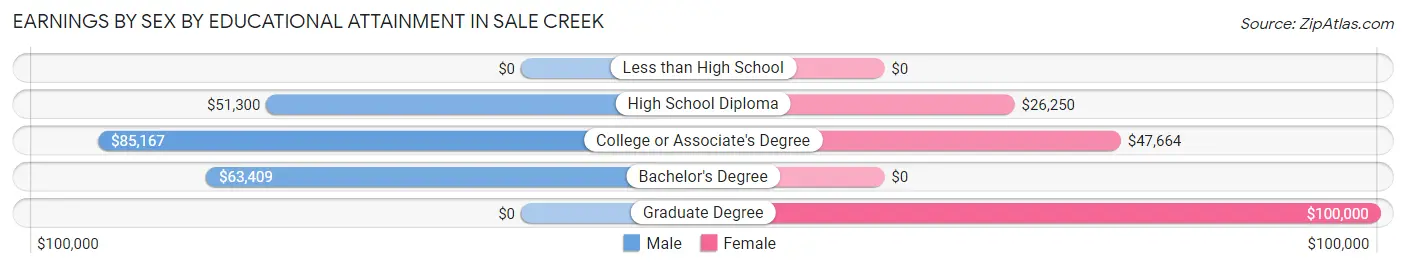
Earnings by Sex by Educational Attainment in Sale Creek
Average earnings in Sale Creek are $68,571 for men and $33,090 for women, a difference of 51.7%. Men with an educational attainment of college or associate's degree enjoy the highest average annual earnings of $85,167, while those with high school diploma education earn the least with $51,300. Women with an educational attainment of graduate degree earn the most with the average annual earnings of $100,000, while those with high school diploma education have the smallest earnings of $26,250.
| Educational Attainment | Male Income | Female Income |
| Less than High School | - | - |
| High School Diploma | $51,300 | $26,250 |
| College or Associate's Degree | $85,167 | $47,664 |
| Bachelor's Degree | $63,409 | $0 |
| Graduate Degree | - | - |
| Total | $68,571 | $33,090 |
Family Income in Sale Creek
Family Income Brackets in Sale Creek
According to the Sale Creek family income data, there are 283 families falling into the $35,000 to $49,999 income range, which is the most common income bracket and makes up 33.6% of all families.
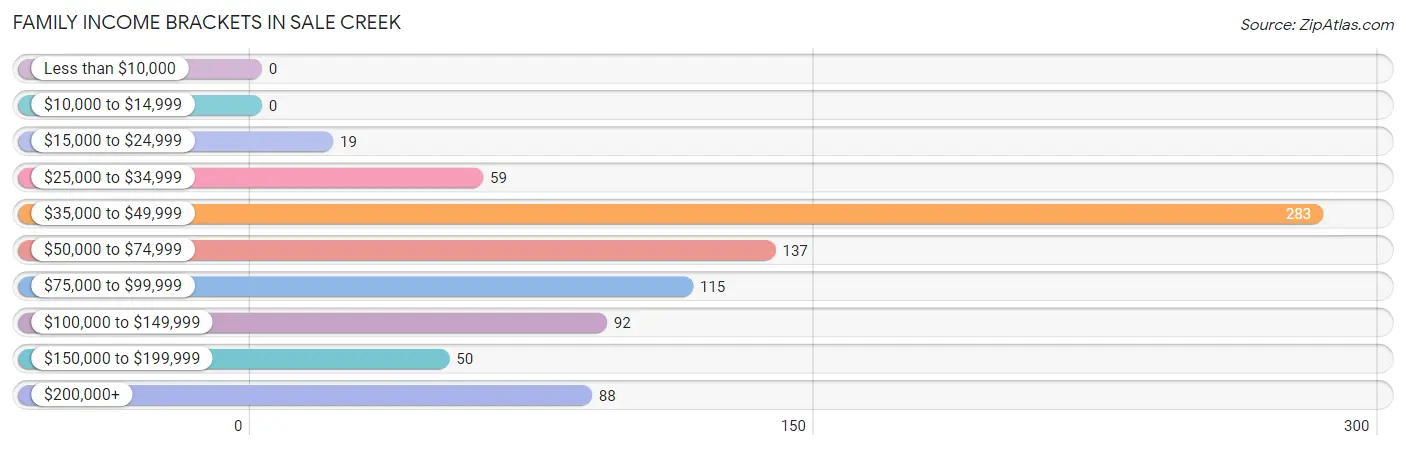
| Income Bracket | # Families | % Families |
| Less than $10,000 | 0 | 0.0% |
| $10,000 to $14,999 | 0 | 0.0% |
| $15,000 to $24,999 | 19 | 2.3% |
| $25,000 to $34,999 | 59 | 7.0% |
| $35,000 to $49,999 | 283 | 33.6% |
| $50,000 to $74,999 | 137 | 16.3% |
| $75,000 to $99,999 | 115 | 13.6% |
| $100,000 to $149,999 | 92 | 10.9% |
| $150,000 to $199,999 | 50 | 5.9% |
| $200,000+ | 88 | 10.4% |
Family Income by Famaliy Size in Sale Creek
4-person families (146 | 17.3%) account for the highest median family income in Sale Creek with $94,286 per family, while 2-person families (367 | 43.5%) have the highest median income of $24,506 per family member.
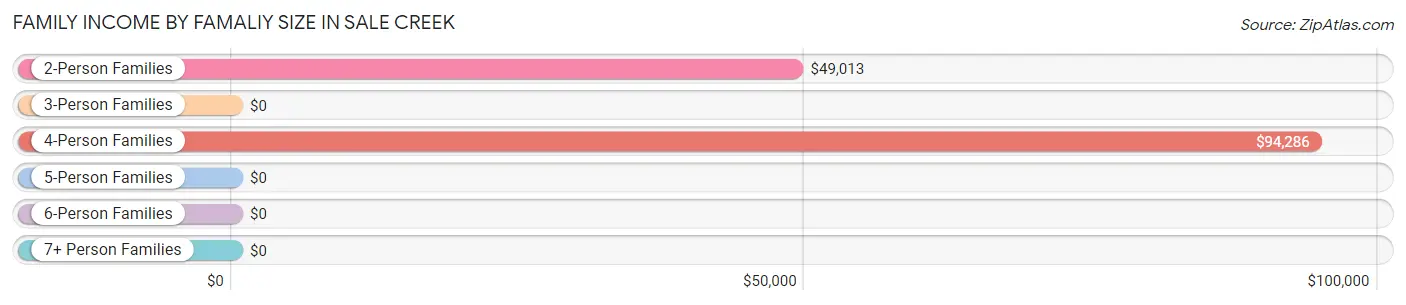
| Income Bracket | # Families | Median Income |
| 2-Person Families | 367 (43.5%) | $49,013 |
| 3-Person Families | 225 (26.7%) | $0 |
| 4-Person Families | 146 (17.3%) | $94,286 |
| 5-Person Families | 65 (7.7%) | $0 |
| 6-Person Families | 9 (1.1%) | $0 |
| 7+ Person Families | 31 (3.7%) | $0 |
| Total | 843 (100.0%) | $58,750 |
Family Income by Number of Earners in Sale Creek
The median family income in Sale Creek is $58,750, with families comprising 3+ earners (74) having the highest median family income of $161,250, while families with 1 earner (225) have the lowest median family income of $41,799, accounting for 8.8% and 26.7% of families, respectively.
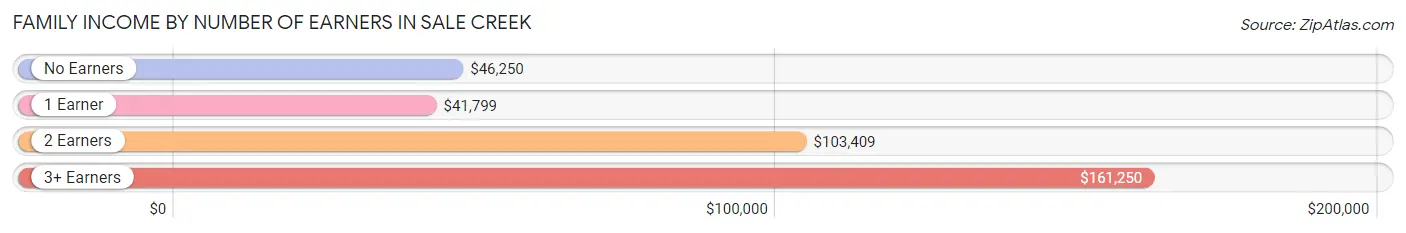
| Number of Earners | # Families | Median Income |
| No Earners | 274 (32.5%) | $46,250 |
| 1 Earner | 225 (26.7%) | $41,799 |
| 2 Earners | 270 (32.0%) | $103,409 |
| 3+ Earners | 74 (8.8%) | $161,250 |
| Total | 843 (100.0%) | $58,750 |
Household Income in Sale Creek
Household Income Brackets in Sale Creek
With 340 households falling in the category, the $35,000 to $49,999 income range is the most frequent in Sale Creek, accounting for 33.1% of all households.
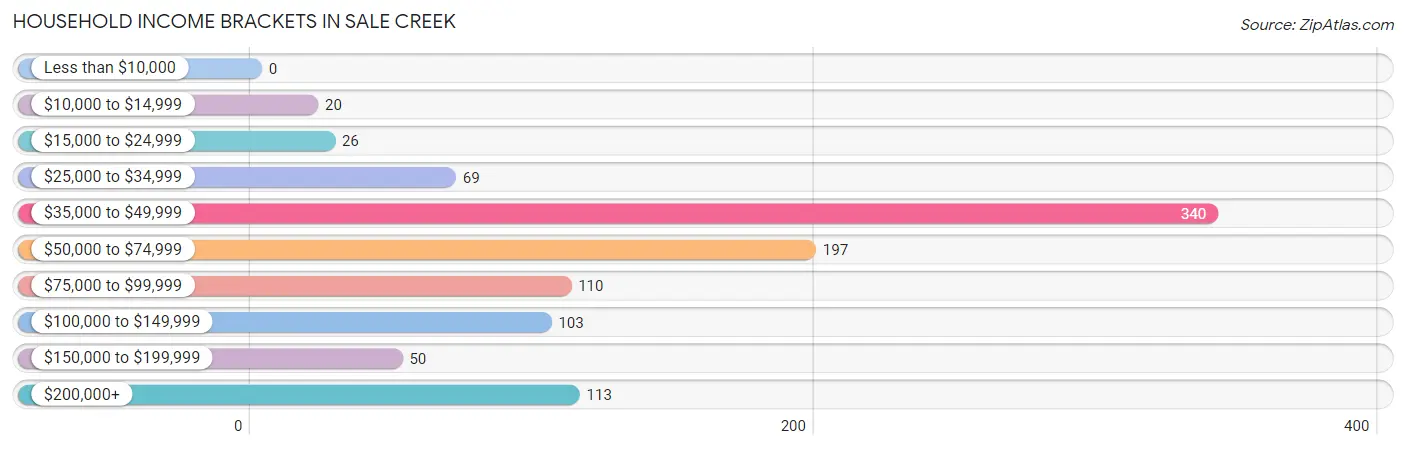
| Income Bracket | # Households | % Households |
| Less than $10,000 | 0 | 0.0% |
| $10,000 to $14,999 | 20 | 1.9% |
| $15,000 to $24,999 | 26 | 2.5% |
| $25,000 to $34,999 | 69 | 6.7% |
| $35,000 to $49,999 | 340 | 33.1% |
| $50,000 to $74,999 | 197 | 19.2% |
| $75,000 to $99,999 | 110 | 10.7% |
| $100,000 to $149,999 | 103 | 10.0% |
| $150,000 to $199,999 | 50 | 4.9% |
| $200,000+ | 113 | 11.0% |
Household Income by Householder Age in Sale Creek
The median household income in Sale Creek is $53,827, with the highest median household income of $69,545 found in the 45 to 64 years age bracket for the primary householder. A total of 428 households (41.7%) fall into this category.
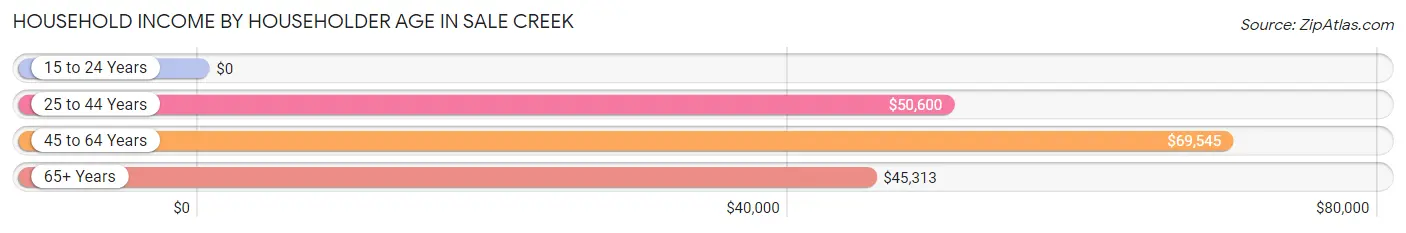
| Income Bracket | # Households | Median Income |
| 15 to 24 Years | 0 (0.0%) | $0 |
| 25 to 44 Years | 292 (28.4%) | $50,600 |
| 45 to 64 Years | 428 (41.7%) | $69,545 |
| 65+ Years | 307 (29.9%) | $45,313 |
| Total | 1,027 (100.0%) | $53,827 |
Poverty in Sale Creek
Income Below Poverty by Sex and Age in Sale Creek
With 2.1% poverty level for males and 1.1% for females among the residents of Sale Creek, under 5 year old males and 55 to 64 year old females are the most vulnerable to poverty, with 9 males (20.0%) and 16 females (12.7%) in their respective age groups living below the poverty level.
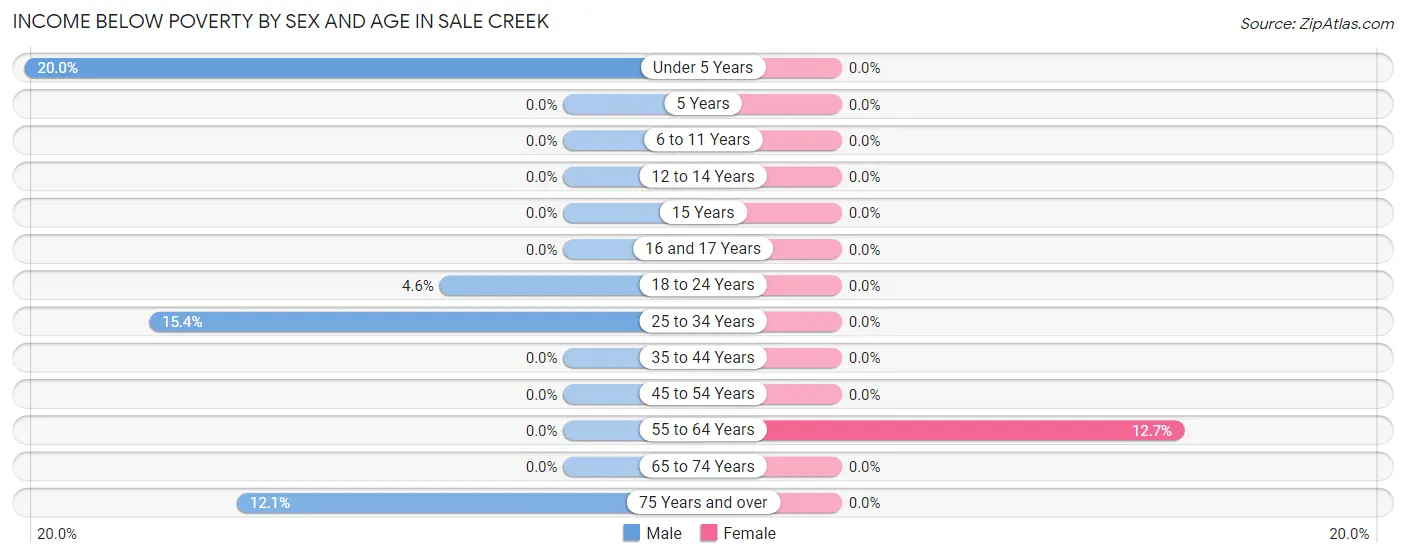
| Age Bracket | Male | Female |
| Under 5 Years | 9 (20.0%) | 0 (0.0%) |
| 5 Years | 0 (0.0%) | 0 (0.0%) |
| 6 to 11 Years | 0 (0.0%) | 0 (0.0%) |
| 12 to 14 Years | 0 (0.0%) | 0 (0.0%) |
| 15 Years | 0 (0.0%) | 0 (0.0%) |
| 16 and 17 Years | 0 (0.0%) | 0 (0.0%) |
| 18 to 24 Years | 10 (4.6%) | 0 (0.0%) |
| 25 to 34 Years | 2 (15.4%) | 0 (0.0%) |
| 35 to 44 Years | 0 (0.0%) | 0 (0.0%) |
| 45 to 54 Years | 0 (0.0%) | 0 (0.0%) |
| 55 to 64 Years | 0 (0.0%) | 16 (12.7%) |
| 65 to 74 Years | 0 (0.0%) | 0 (0.0%) |
| 75 Years and over | 12 (12.1%) | 0 (0.0%) |
| Total | 33 (2.1%) | 16 (1.1%) |
Income Above Poverty by Sex and Age in Sale Creek
According to the poverty statistics in Sale Creek, males aged 5 years and females aged under 5 years are the age groups that are most secure financially, with 100.0% of males and 100.0% of females in these age groups living above the poverty line.
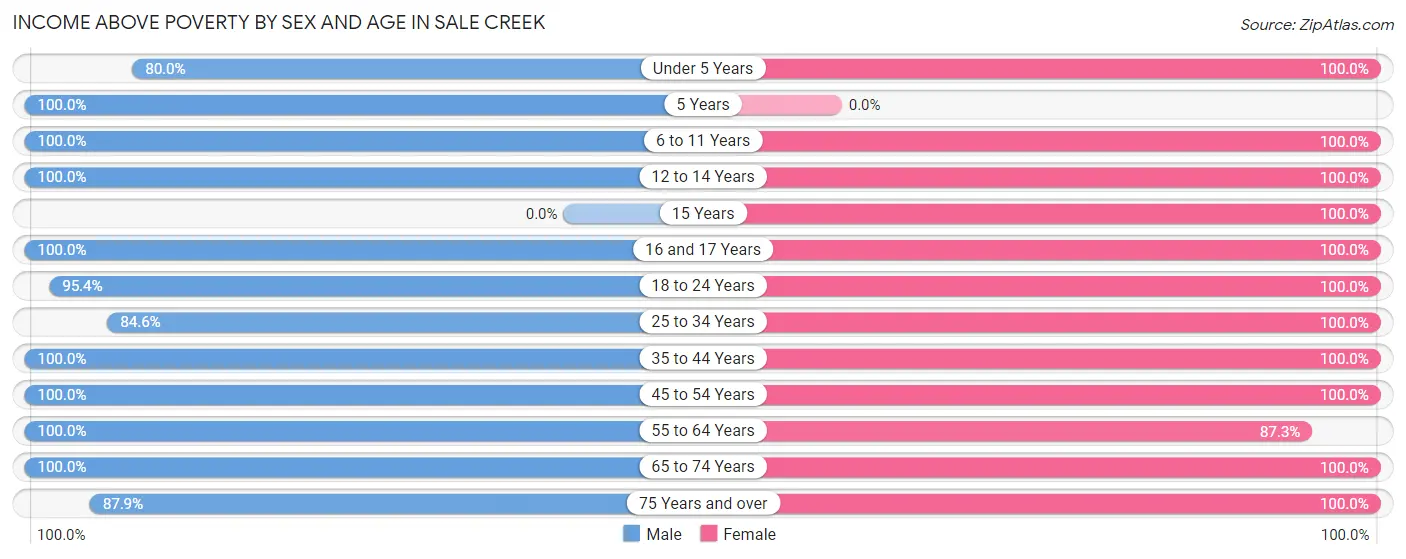
| Age Bracket | Male | Female |
| Under 5 Years | 36 (80.0%) | 36 (100.0%) |
| 5 Years | 10 (100.0%) | 0 (0.0%) |
| 6 to 11 Years | 144 (100.0%) | 225 (100.0%) |
| 12 to 14 Years | 23 (100.0%) | 63 (100.0%) |
| 15 Years | 0 (0.0%) | 24 (100.0%) |
| 16 and 17 Years | 55 (100.0%) | 62 (100.0%) |
| 18 to 24 Years | 208 (95.4%) | 39 (100.0%) |
| 25 to 34 Years | 11 (84.6%) | 67 (100.0%) |
| 35 to 44 Years | 124 (100.0%) | 263 (100.0%) |
| 45 to 54 Years | 436 (100.0%) | 193 (100.0%) |
| 55 to 64 Years | 207 (100.0%) | 110 (87.3%) |
| 65 to 74 Years | 216 (100.0%) | 202 (100.0%) |
| 75 Years and over | 87 (87.9%) | 175 (100.0%) |
| Total | 1,557 (97.9%) | 1,459 (98.9%) |
Income Below Poverty Among Married-Couple Families in Sale Creek
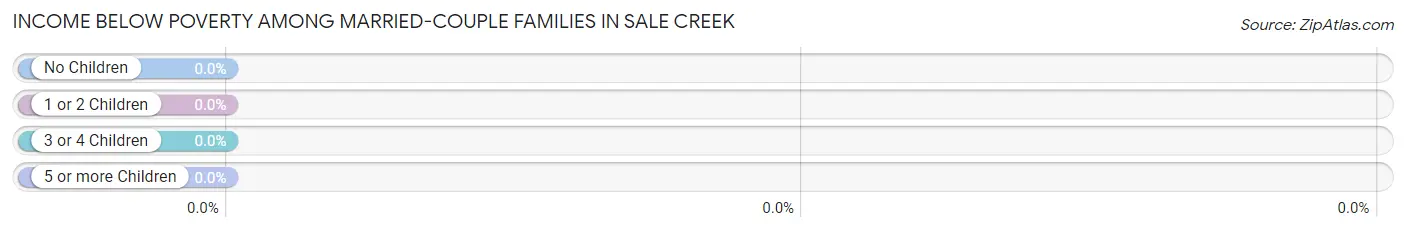
| Children | Above Poverty | Below Poverty |
| No Children | 409 (100.0%) | 0 (0.0%) |
| 1 or 2 Children | 167 (100.0%) | 0 (0.0%) |
| 3 or 4 Children | 74 (100.0%) | 0 (0.0%) |
| 5 or more Children | 0 (0.0%) | 0 (0.0%) |
| Total | 650 (100.0%) | 0 (0.0%) |
Income Below Poverty Among Single-Parent Households in Sale Creek
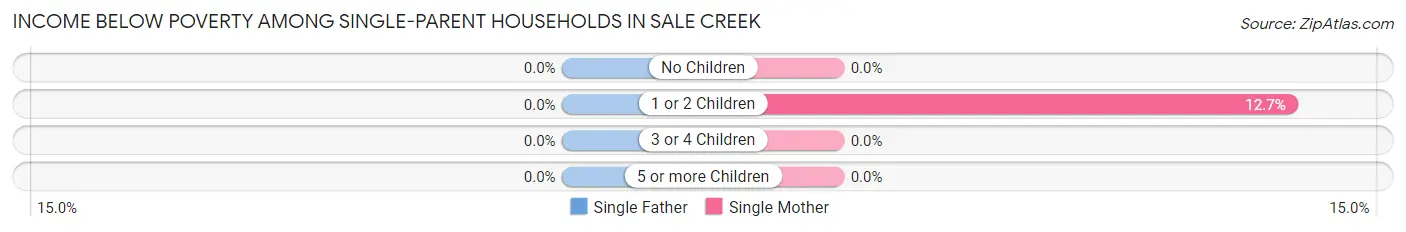
| Children | Single Father | Single Mother |
| No Children | 0 (0.0%) | 0 (0.0%) |
| 1 or 2 Children | 0 (0.0%) | 9 (12.7%) |
| 3 or 4 Children | 0 (0.0%) | 0 (0.0%) |
| 5 or more Children | 0 (0.0%) | 0 (0.0%) |
| Total | 0 (0.0%) | 9 (6.6%) |
Income Below Poverty Among Married-Couple vs Single-Parent Households in Sale Creek
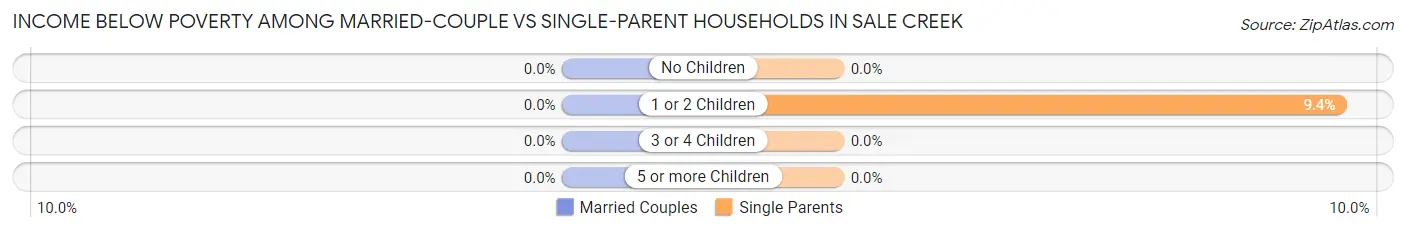
| Children | Married-Couple Families | Single-Parent Households |
| No Children | 0 (0.0%) | 0 (0.0%) |
| 1 or 2 Children | 0 (0.0%) | 9 (9.4%) |
| 3 or 4 Children | 0 (0.0%) | 0 (0.0%) |
| 5 or more Children | 0 (0.0%) | 0 (0.0%) |
| Total | 0 (0.0%) | 9 (4.7%) |
Race in Sale Creek
The most populous races in Sale Creek are White / Caucasian (2,796 | 91.2%), Two or more Races (218 | 7.1%), and Hispanic or Latino (120 | 3.9%).
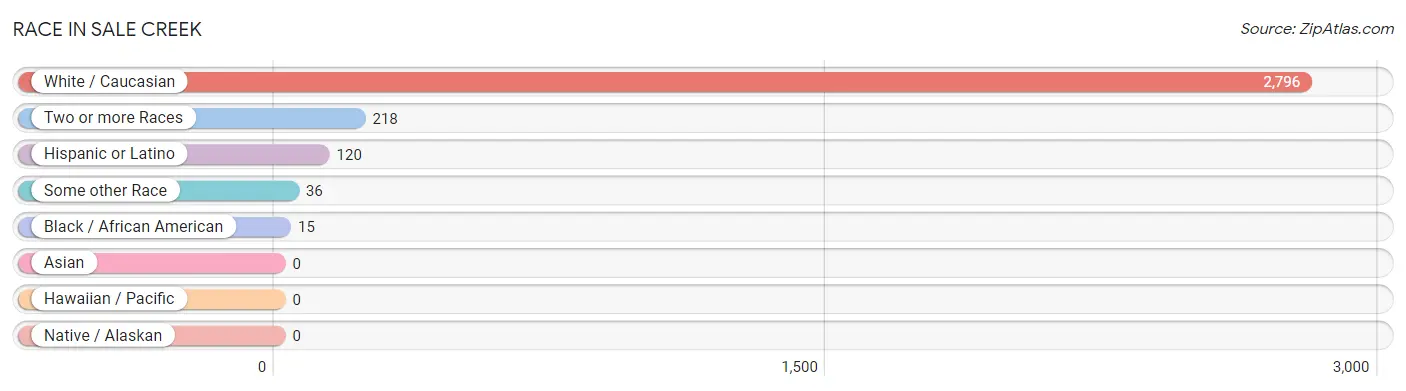
| Race | # Population | % Population |
| Asian | 0 | 0.0% |
| Black / African American | 15 | 0.5% |
| Hawaiian / Pacific | 0 | 0.0% |
| Hispanic or Latino | 120 | 3.9% |
| Native / Alaskan | 0 | 0.0% |
| White / Caucasian | 2,796 | 91.2% |
| Two or more Races | 218 | 7.1% |
| Some other Race | 36 | 1.2% |
| Total | 3,065 | 100.0% |
Ancestry in Sale Creek
The most populous ancestries reported in Sale Creek are Irish (874 | 28.5%), English (657 | 21.4%), German (504 | 16.4%), Scotch-Irish (192 | 6.3%), and American (154 | 5.0%), together accounting for 77.7% of all Sale Creek residents.
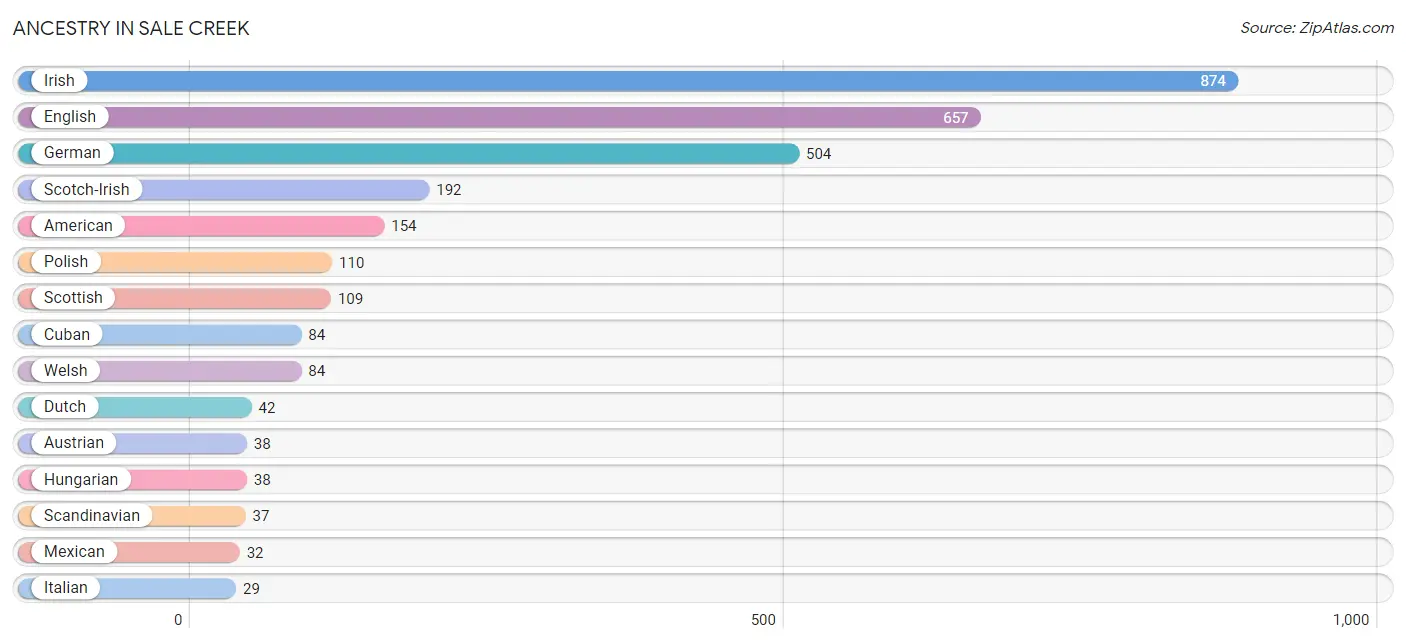
| Ancestry | # Population | % Population |
| American | 154 | 5.0% |
| Austrian | 38 | 1.2% |
| British | 7 | 0.2% |
| Cherokee | 17 | 0.5% |
| Cuban | 84 | 2.7% |
| Danish | 13 | 0.4% |
| Dutch | 42 | 1.4% |
| English | 657 | 21.4% |
| European | 27 | 0.9% |
| French | 5 | 0.2% |
| German | 504 | 16.4% |
| Hungarian | 38 | 1.2% |
| Irish | 874 | 28.5% |
| Italian | 29 | 0.9% |
| Mexican | 32 | 1.0% |
| Polish | 110 | 3.6% |
| Puerto Rican | 4 | 0.1% |
| Scandinavian | 37 | 1.2% |
| Scotch-Irish | 192 | 6.3% |
| Scottish | 109 | 3.6% |
| Swedish | 18 | 0.6% |
| Swiss | 11 | 0.4% |
| Welsh | 84 | 2.7% | View All 23 Rows |
Immigrants in Sale Creek
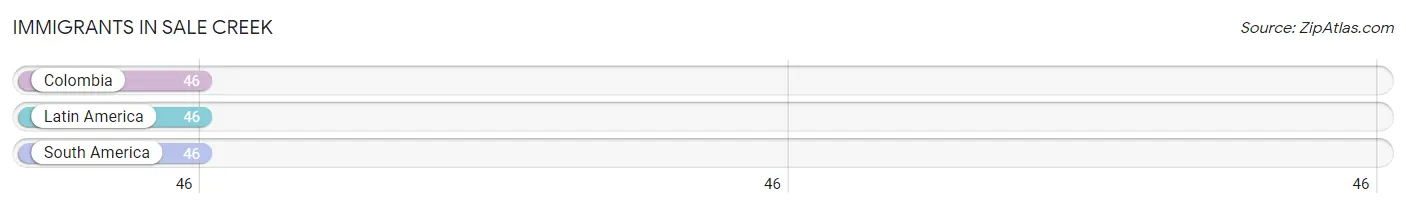
The most numerous immigrant groups reported in Sale Creek came from Colombia (46 | 1.5%), Latin America (46 | 1.5%), and South America (46 | 1.5%), together accounting for 4.5% of all Sale Creek residents.
| Immigration Origin | # Population | % Population |
| Colombia | 46 | 1.5% |
| Latin America | 46 | 1.5% |
| South America | 46 | 1.5% | View All 3 Rows |
Sex and Age in Sale Creek
Sex and Age in Sale Creek
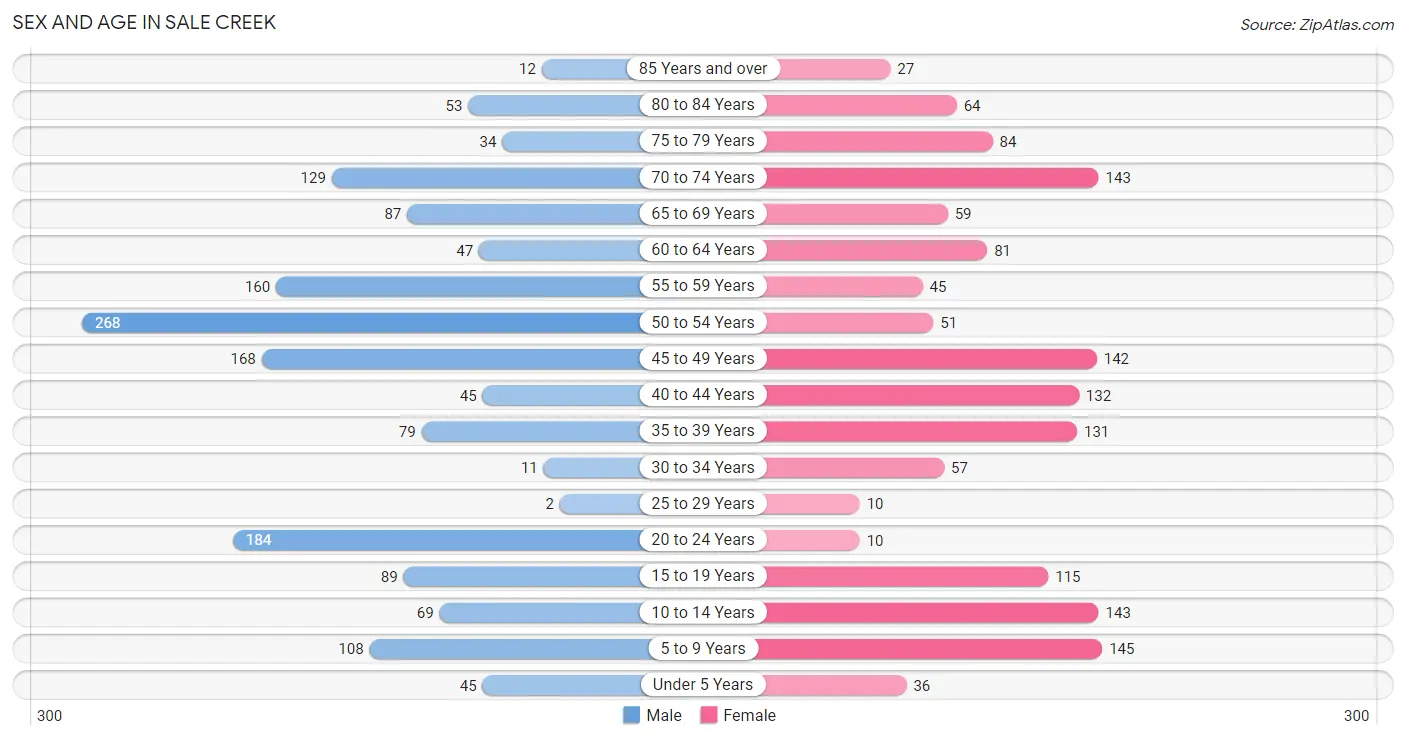
The most populous age groups in Sale Creek are 50 to 54 Years (268 | 16.9%) for men and 5 to 9 Years (145 | 9.8%) for women.
| Age Bracket | Male | Female |
| Under 5 Years | 45 (2.8%) | 36 (2.4%) |
| 5 to 9 Years | 108 (6.8%) | 145 (9.8%) |
| 10 to 14 Years | 69 (4.3%) | 143 (9.7%) |
| 15 to 19 Years | 89 (5.6%) | 115 (7.8%) |
| 20 to 24 Years | 184 (11.6%) | 10 (0.7%) |
| 25 to 29 Years | 2 (0.1%) | 10 (0.7%) |
| 30 to 34 Years | 11 (0.7%) | 57 (3.9%) |
| 35 to 39 Years | 79 (5.0%) | 131 (8.9%) |
| 40 to 44 Years | 45 (2.8%) | 132 (8.9%) |
| 45 to 49 Years | 168 (10.6%) | 142 (9.6%) |
| 50 to 54 Years | 268 (16.9%) | 51 (3.5%) |
| 55 to 59 Years | 160 (10.1%) | 45 (3.0%) |
| 60 to 64 Years | 47 (3.0%) | 81 (5.5%) |
| 65 to 69 Years | 87 (5.5%) | 59 (4.0%) |
| 70 to 74 Years | 129 (8.1%) | 143 (9.7%) |
| 75 to 79 Years | 34 (2.1%) | 84 (5.7%) |
| 80 to 84 Years | 53 (3.3%) | 64 (4.3%) |
| 85 Years and over | 12 (0.7%) | 27 (1.8%) |
| Total | 1,590 (100.0%) | 1,475 (100.0%) |
Families and Households in Sale Creek
Median Family Size in Sale Creek
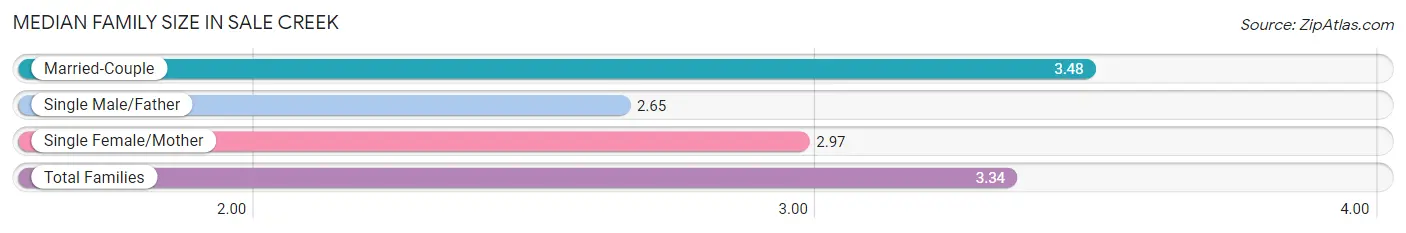
The median family size in Sale Creek is 3.34 persons per family, with married-couple families (650 | 77.1%) accounting for the largest median family size of 3.48 persons per family. On the other hand, single male/father families (57 | 6.8%) represent the smallest median family size with 2.65 persons per family.
| Family Type | # Families | Family Size |
| Married-Couple | 650 (77.1%) | 3.48 |
| Single Male/Father | 57 (6.8%) | 2.65 |
| Single Female/Mother | 136 (16.1%) | 2.97 |
| Total Families | 843 (100.0%) | 3.34 |
Median Household Size in Sale Creek
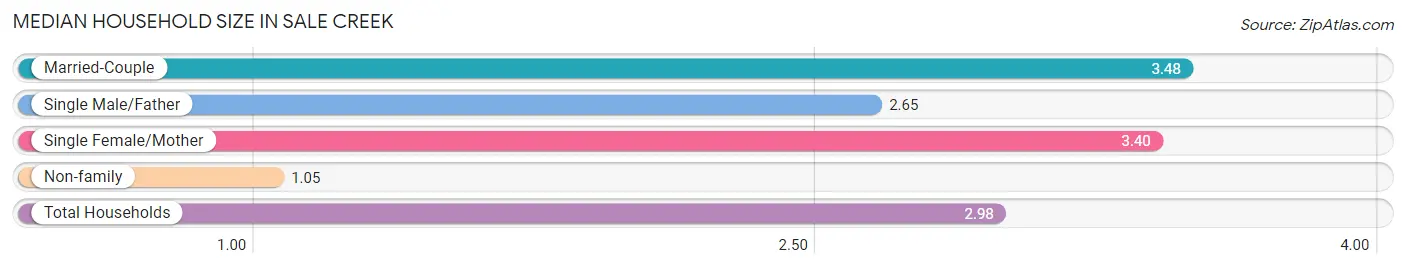
The median household size in Sale Creek is 2.98 persons per household, with married-couple households (650 | 63.3%) accounting for the largest median household size of 3.48 persons per household. non-family households (184 | 17.9%) represent the smallest median household size with 1.05 persons per household.
| Household Type | # Households | Household Size |
| Married-Couple | 650 (63.3%) | 3.48 |
| Single Male/Father | 57 (5.6%) | 2.65 |
| Single Female/Mother | 136 (13.2%) | 3.40 |
| Non-family | 184 (17.9%) | 1.05 |
| Total Households | 1,027 (100.0%) | 2.98 |
Household Size by Marriage Status in Sale Creek
Out of a total of 1,027 households in Sale Creek, 843 (82.1%) are family households, while 184 (17.9%) are nonfamily households. The most numerous type of family households are 2-person households, comprising 367, and the most common type of nonfamily households are 1-person households, comprising 178.
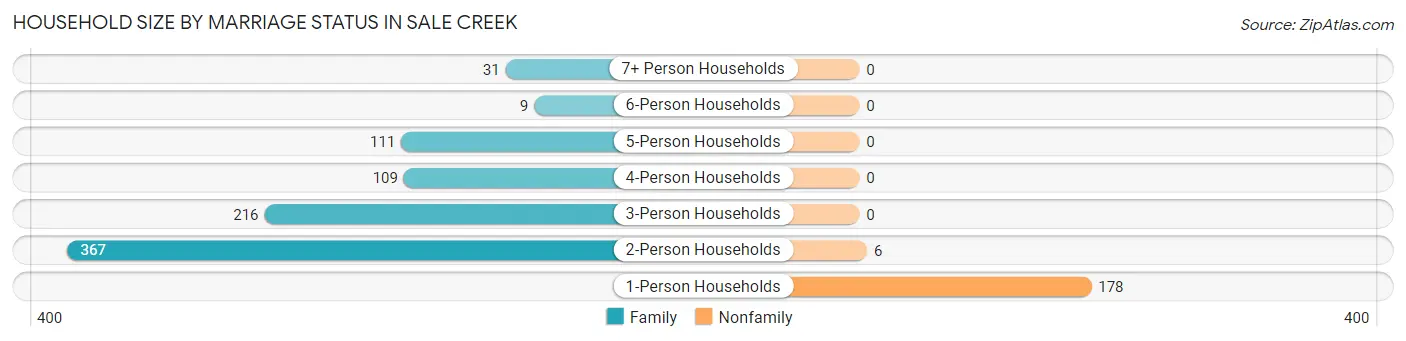
| Household Size | Family Households | Nonfamily Households |
| 1-Person Households | - | 178 (17.3%) |
| 2-Person Households | 367 (35.7%) | 6 (0.6%) |
| 3-Person Households | 216 (21.0%) | 0 (0.0%) |
| 4-Person Households | 109 (10.6%) | 0 (0.0%) |
| 5-Person Households | 111 (10.8%) | 0 (0.0%) |
| 6-Person Households | 9 (0.9%) | 0 (0.0%) |
| 7+ Person Households | 31 (3.0%) | 0 (0.0%) |
| Total | 843 (82.1%) | 184 (17.9%) |
Female Fertility in Sale Creek
Fertility by Age in Sale Creek
Average fertility rate in Sale Creek is 15.0 births per 1,000 women. Women in the age bracket of 35 to 50 years have the highest fertility rate with 22.0 births per 1,000 women. Women in the age bracket of 35 to 50 years acount for 100.0% of all women with births.
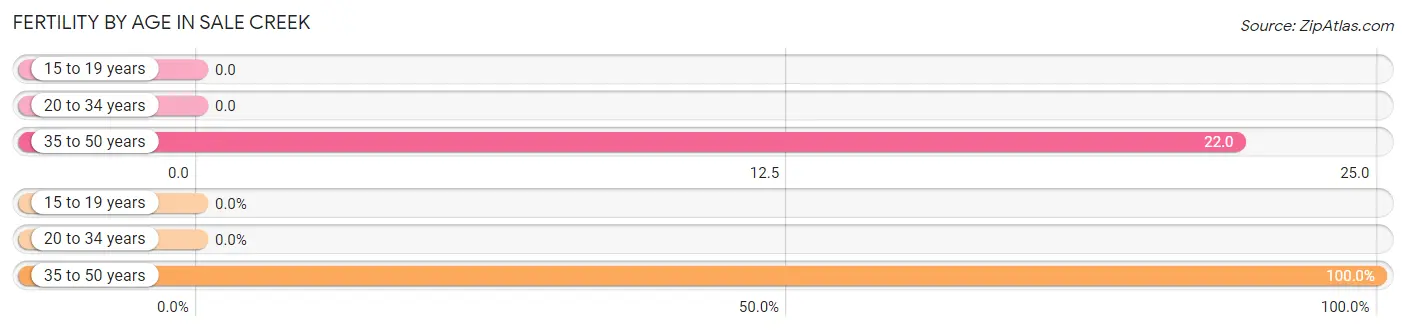
| Age Bracket | Women with Births | Births / 1,000 Women |
| 15 to 19 years | 0 (0.0%) | 0.0 |
| 20 to 34 years | 0 (0.0%) | 0.0 |
| 35 to 50 years | 9 (100.0%) | 22.0 |
| Total | 9 (100.0%) | 15.0 |
Fertility by Age by Marriage Status in Sale Creek
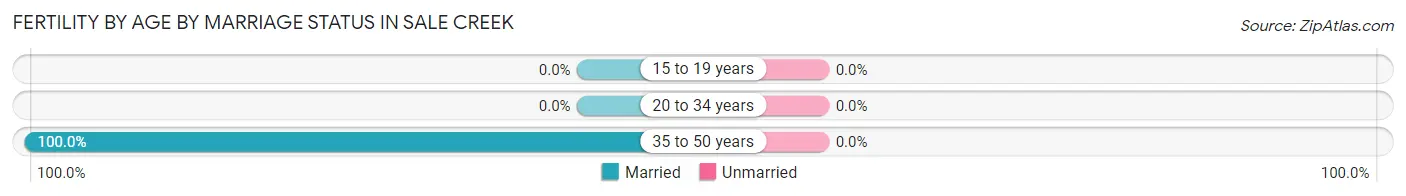
| Age Bracket | Married | Unmarried |
| 15 to 19 years | 0 (0.0%) | 0 (0.0%) |
| 20 to 34 years | 0 (0.0%) | 0 (0.0%) |
| 35 to 50 years | 9 (100.0%) | 0 (0.0%) |
| Total | 9 (100.0%) | 0 (0.0%) |
Fertility by Education in Sale Creek
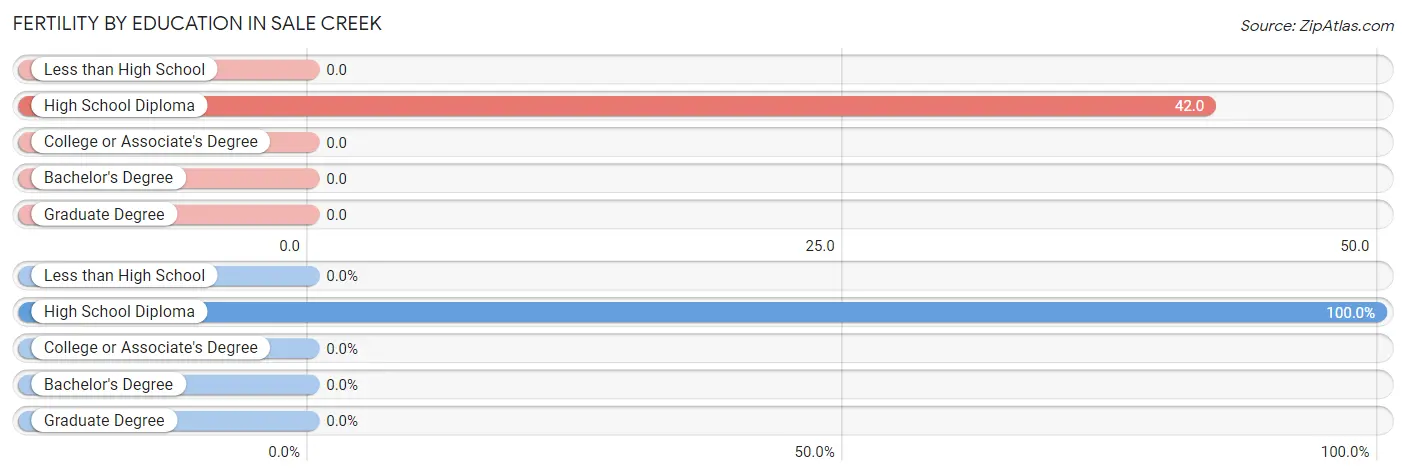
| Educational Attainment | Women with Births | Births / 1,000 Women |
| Less than High School | 0 (0.0%) | 0.0 |
| High School Diploma | 9 (100.0%) | 42.0 |
| College or Associate's Degree | 0 (0.0%) | 0.0 |
| Bachelor's Degree | 0 (0.0%) | 0.0 |
| Graduate Degree | 0 (0.0%) | 0.0 |
| Total | 9 (100.0%) | 15.0 |
Fertility by Education by Marriage Status in Sale Creek
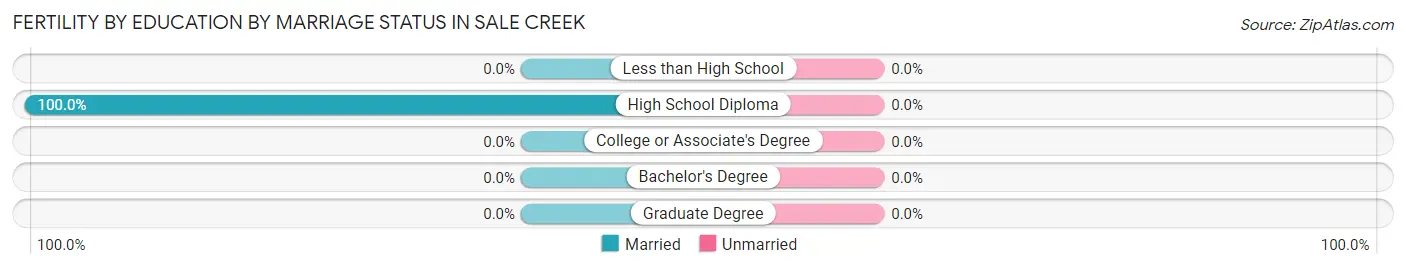
| Educational Attainment | Married | Unmarried |
| Less than High School | 0 (0.0%) | 0 (0.0%) |
| High School Diploma | 9 (100.0%) | 0 (0.0%) |
| College or Associate's Degree | 0 (0.0%) | 0 (0.0%) |
| Bachelor's Degree | 0 (0.0%) | 0 (0.0%) |
| Graduate Degree | 0 (0.0%) | 0 (0.0%) |
| Total | 9 (100.0%) | 0 (0.0%) |
Employment Characteristics in Sale Creek
Employment by Class of Employer in Sale Creek
Among the 1,115 employed individuals in Sale Creek, private company employees (686 | 61.5%), local government employees (156 | 14.0%), and self-employed (not incorporated) (94 | 8.4%) make up the most common classes of employment.
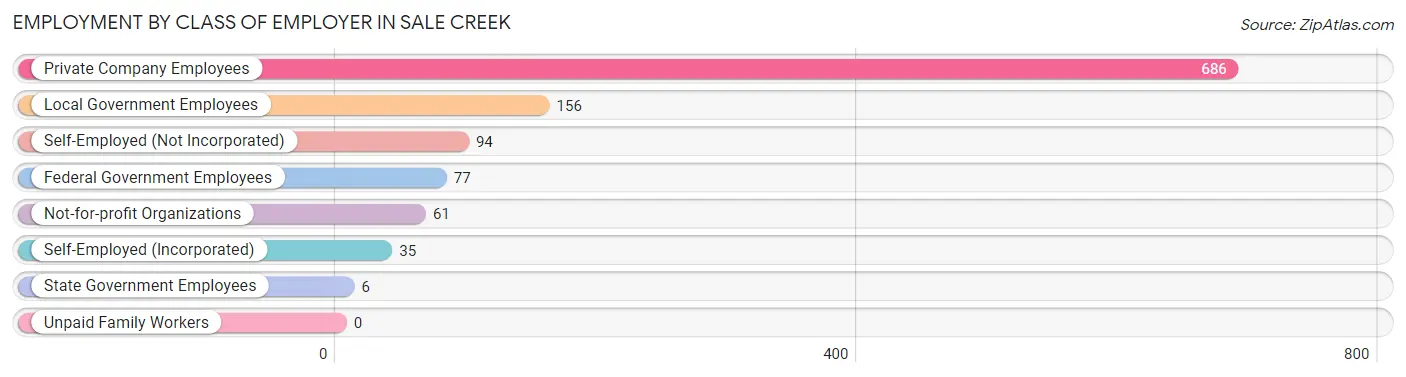
| Employer Class | # Employees | % Employees |
| Private Company Employees | 686 | 61.5% |
| Self-Employed (Incorporated) | 35 | 3.1% |
| Self-Employed (Not Incorporated) | 94 | 8.4% |
| Not-for-profit Organizations | 61 | 5.5% |
| Local Government Employees | 156 | 14.0% |
| State Government Employees | 6 | 0.5% |
| Federal Government Employees | 77 | 6.9% |
| Unpaid Family Workers | 0 | 0.0% |
| Total | 1,115 | 100.0% |
Employment Status by Age in Sale Creek
According to the labor force statistics for Sale Creek, out of the total population over 16 years of age (2,495), 46.6% or 1,163 individuals are in the labor force, with 4.0% or 47 of them unemployed. The age group with the highest labor force participation rate is 30 to 34 years, with 100.0% or 68 individuals in the labor force. Within the labor force, the 16 to 19 years age range has the highest percentage of unemployed individuals, with 33.9% or 39 of them being unemployed.
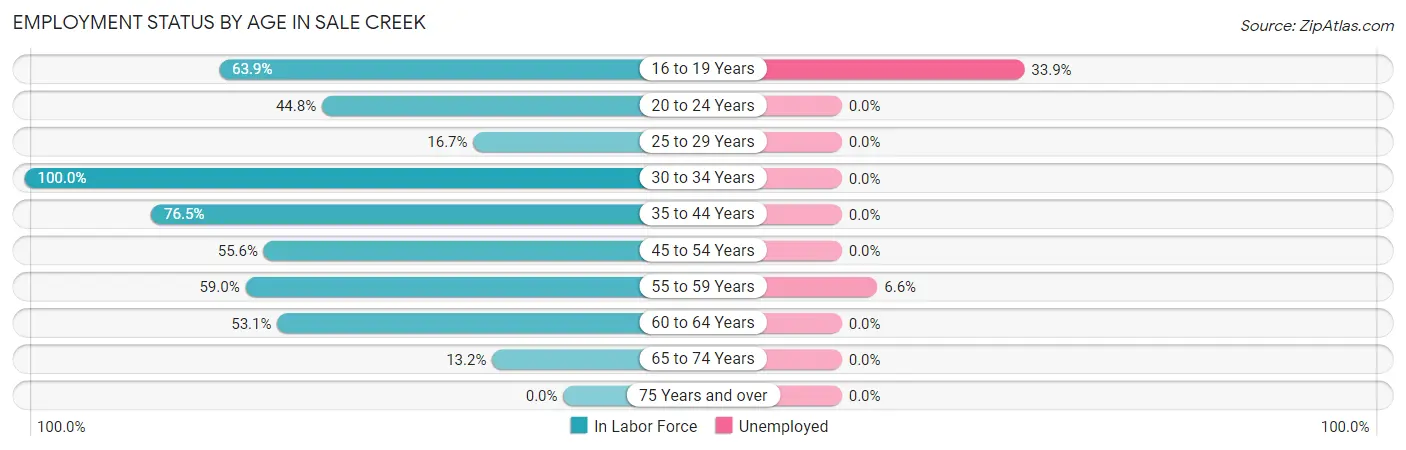
| Age Bracket | In Labor Force | Unemployed |
| 16 to 19 Years | 115 (63.9%) | 39 (33.9%) |
| 20 to 24 Years | 87 (44.8%) | 0 (0.0%) |
| 25 to 29 Years | 2 (16.7%) | 0 (0.0%) |
| 30 to 34 Years | 68 (100.0%) | 0 (0.0%) |
| 35 to 44 Years | 296 (76.5%) | 0 (0.0%) |
| 45 to 54 Years | 350 (55.6%) | 0 (0.0%) |
| 55 to 59 Years | 121 (59.0%) | 8 (6.6%) |
| 60 to 64 Years | 68 (53.1%) | 0 (0.0%) |
| 65 to 74 Years | 55 (13.2%) | 0 (0.0%) |
| 75 Years and over | 0 (0.0%) | 0 (0.0%) |
| Total | 1,163 (46.6%) | 47 (4.0%) |
Employment Status by Educational Attainment in Sale Creek
According to labor force statistics for Sale Creek, 63.3% of individuals (905) out of the total population between 25 and 64 years of age (1,429) are in the labor force, with 0.9% or 8 of them being unemployed. The group with the highest labor force participation rate are those with the educational attainment of bachelor's degree or higher, with 90.6% or 242 individuals in the labor force. Within the labor force, individuals with less than high school education have the highest percentage of unemployment, with 21.6% or 8 of them being unemployed.
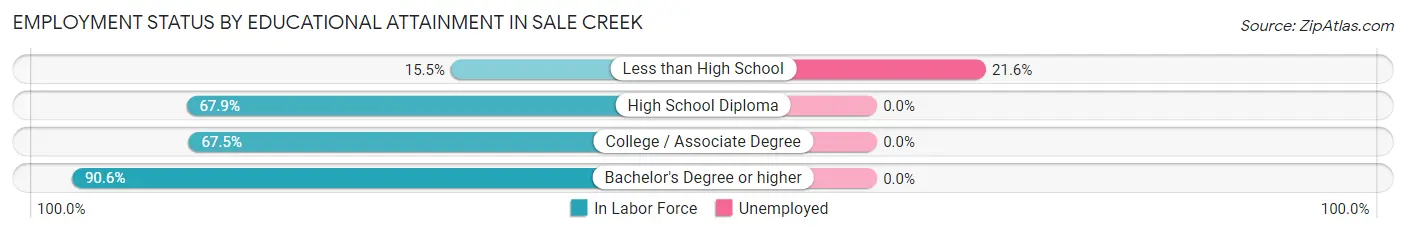
| Educational Attainment | In Labor Force | Unemployed |
| Less than High School | 37 (15.5%) | 51 (21.6%) |
| High School Diploma | 345 (67.9%) | 0 (0.0%) |
| College / Associate Degree | 281 (67.5%) | 0 (0.0%) |
| Bachelor's Degree or higher | 242 (90.6%) | 0 (0.0%) |
| Total | 905 (63.3%) | 13 (0.9%) |
Employment Occupations by Sex in Sale Creek
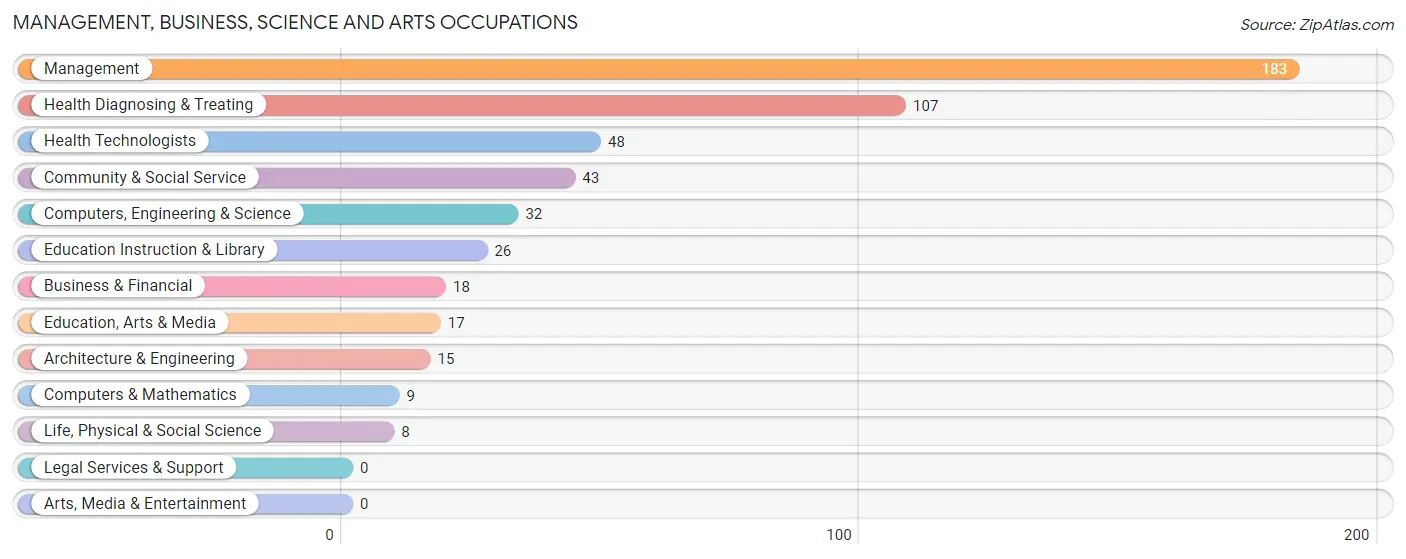
Management, Business, Science and Arts Occupations
The most common Management, Business, Science and Arts occupations in Sale Creek are Management (183 | 16.4%), Health Diagnosing & Treating (107 | 9.6%), Health Technologists (48 | 4.3%), Community & Social Service (43 | 3.9%), and Computers, Engineering & Science (32 | 2.9%).
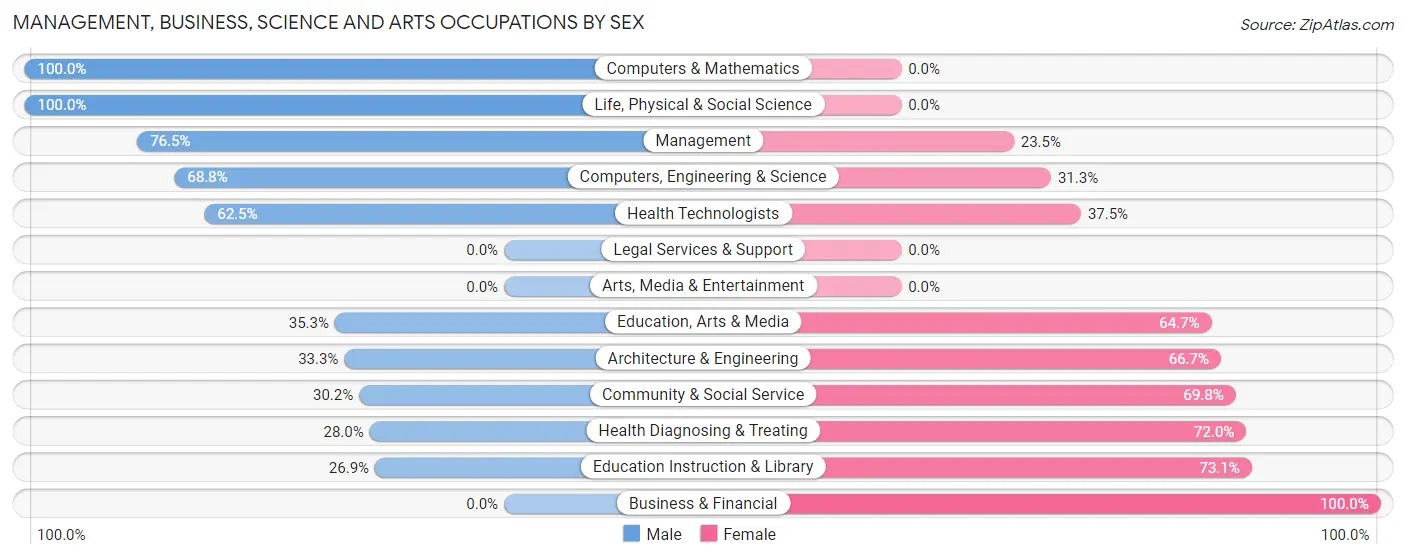
Management, Business, Science and Arts Occupations by Sex
Within the Management, Business, Science and Arts occupations in Sale Creek, the most male-oriented occupations are Computers & Mathematics (100.0%), Life, Physical & Social Science (100.0%), and Management (76.5%), while the most female-oriented occupations are Business & Financial (100.0%), Education Instruction & Library (73.1%), and Health Diagnosing & Treating (72.0%).
| Occupation | Male | Female |
| Management | 140 (76.5%) | 43 (23.5%) |
| Business & Financial | 0 (0.0%) | 18 (100.0%) |
| Computers, Engineering & Science | 22 (68.8%) | 10 (31.2%) |
| Computers & Mathematics | 9 (100.0%) | 0 (0.0%) |
| Architecture & Engineering | 5 (33.3%) | 10 (66.7%) |
| Life, Physical & Social Science | 8 (100.0%) | 0 (0.0%) |
| Community & Social Service | 13 (30.2%) | 30 (69.8%) |
| Education, Arts & Media | 6 (35.3%) | 11 (64.7%) |
| Legal Services & Support | 0 (0.0%) | 0 (0.0%) |
| Education Instruction & Library | 7 (26.9%) | 19 (73.1%) |
| Arts, Media & Entertainment | 0 (0.0%) | 0 (0.0%) |
| Health Diagnosing & Treating | 30 (28.0%) | 77 (72.0%) |
| Health Technologists | 30 (62.5%) | 18 (37.5%) |
| Total (Category) | 205 (53.5%) | 178 (46.5%) |
| Total (Overall) | 593 (53.2%) | 522 (46.8%) |
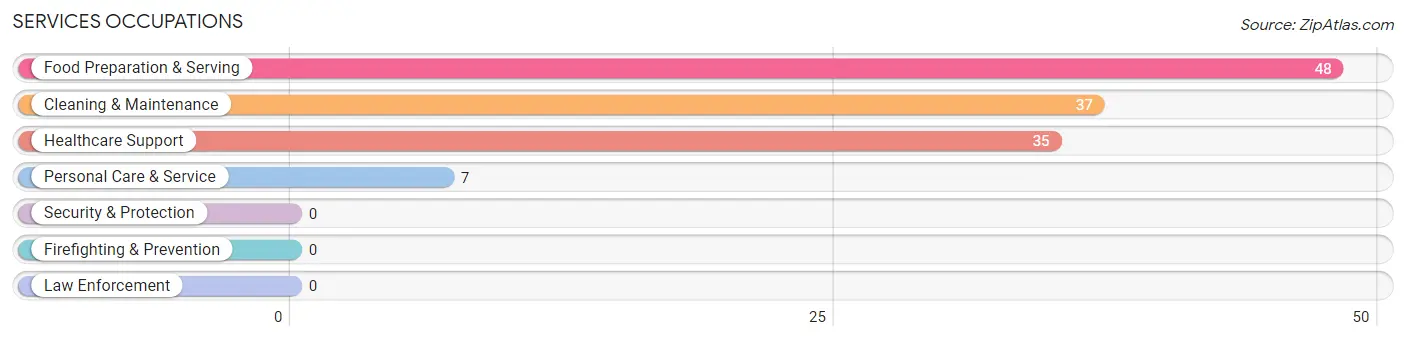
Services Occupations
The most common Services occupations in Sale Creek are Food Preparation & Serving (48 | 4.3%), Cleaning & Maintenance (37 | 3.3%), Healthcare Support (35 | 3.1%), and Personal Care & Service (7 | 0.6%).
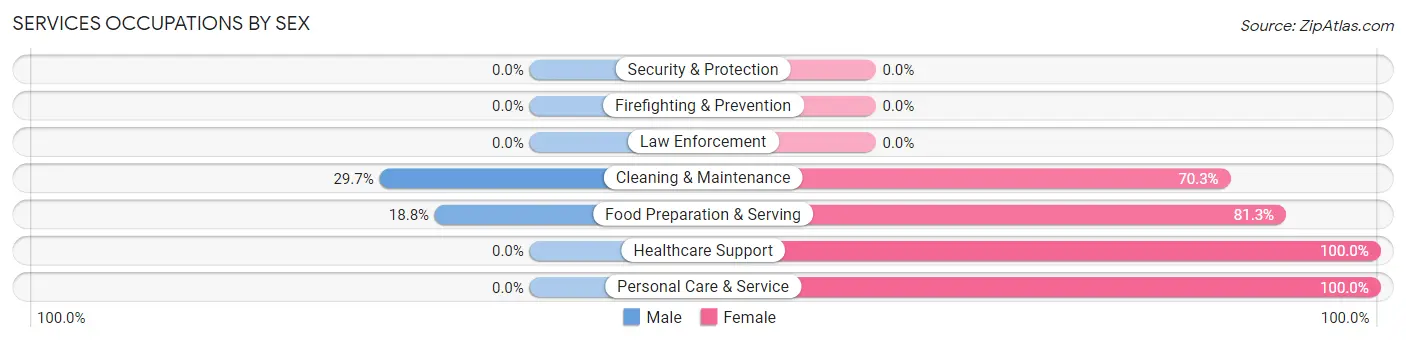
Services Occupations by Sex
Within the Services occupations in Sale Creek, the most male-oriented occupations are Cleaning & Maintenance (29.7%), and Food Preparation & Serving (18.8%), while the most female-oriented occupations are Healthcare Support (100.0%), Personal Care & Service (100.0%), and Food Preparation & Serving (81.2%).
| Occupation | Male | Female |
| Healthcare Support | 0 (0.0%) | 35 (100.0%) |
| Security & Protection | 0 (0.0%) | 0 (0.0%) |
| Firefighting & Prevention | 0 (0.0%) | 0 (0.0%) |
| Law Enforcement | 0 (0.0%) | 0 (0.0%) |
| Food Preparation & Serving | 9 (18.8%) | 39 (81.2%) |
| Cleaning & Maintenance | 11 (29.7%) | 26 (70.3%) |
| Personal Care & Service | 0 (0.0%) | 7 (100.0%) |
| Total (Category) | 20 (15.8%) | 107 (84.3%) |
| Total (Overall) | 593 (53.2%) | 522 (46.8%) |
Sales and Office Occupations
The most common Sales and Office occupations in Sale Creek are Office & Administration (143 | 12.8%), and Sales & Related (112 | 10.0%).
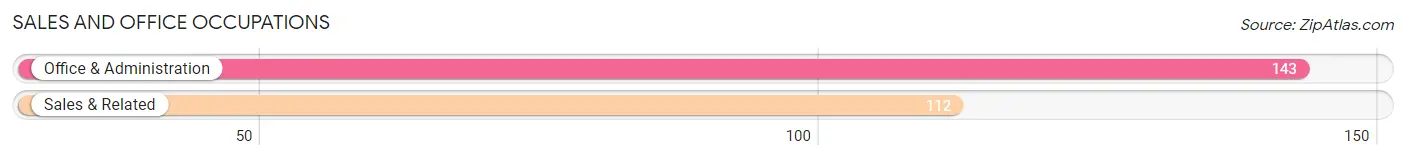
Sales and Office Occupations by Sex
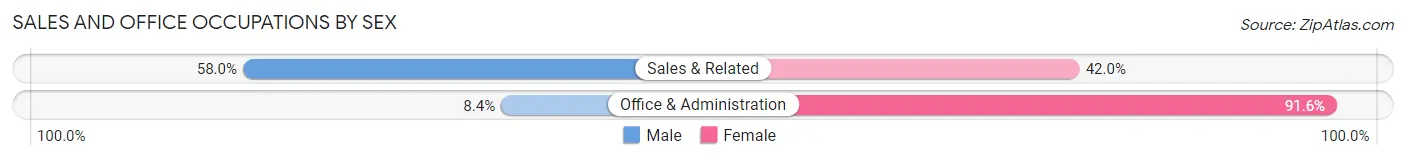
| Occupation | Male | Female |
| Sales & Related | 65 (58.0%) | 47 (42.0%) |
| Office & Administration | 12 (8.4%) | 131 (91.6%) |
| Total (Category) | 77 (30.2%) | 178 (69.8%) |
| Total (Overall) | 593 (53.2%) | 522 (46.8%) |
Natural Resources, Construction and Maintenance Occupations
The most common Natural Resources, Construction and Maintenance occupations in Sale Creek are Construction & Extraction (150 | 13.5%), and Installation, Maintenance & Repair (26 | 2.3%).
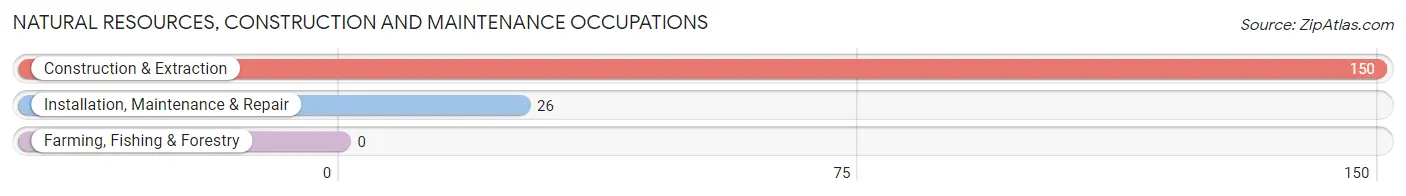
Natural Resources, Construction and Maintenance Occupations by Sex
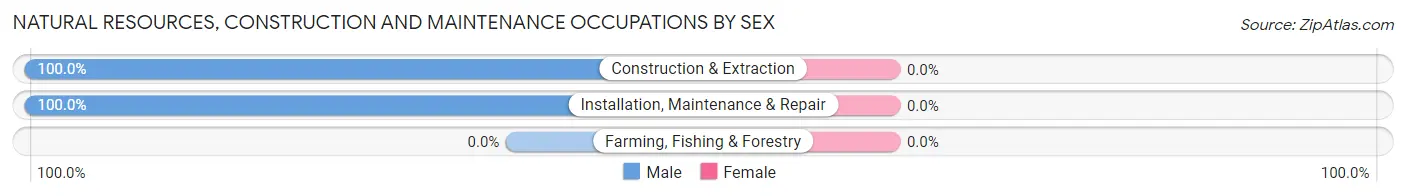
| Occupation | Male | Female |
| Farming, Fishing & Forestry | 0 (0.0%) | 0 (0.0%) |
| Construction & Extraction | 150 (100.0%) | 0 (0.0%) |
| Installation, Maintenance & Repair | 26 (100.0%) | 0 (0.0%) |
| Total (Category) | 176 (100.0%) | 0 (0.0%) |
| Total (Overall) | 593 (53.2%) | 522 (46.8%) |
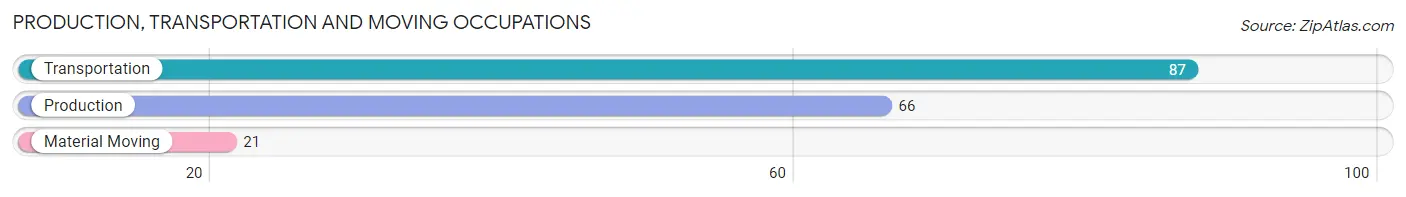
Production, Transportation and Moving Occupations
The most common Production, Transportation and Moving occupations in Sale Creek are Transportation (87 | 7.8%), Production (66 | 5.9%), and Material Moving (21 | 1.9%).
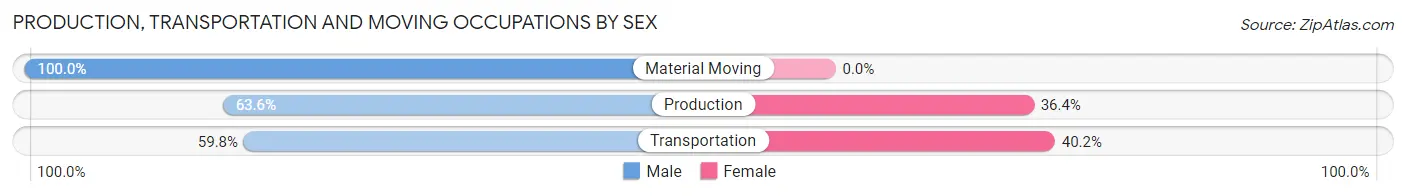
Production, Transportation and Moving Occupations by Sex
| Occupation | Male | Female |
| Production | 42 (63.6%) | 24 (36.4%) |
| Transportation | 52 (59.8%) | 35 (40.2%) |
| Material Moving | 21 (100.0%) | 0 (0.0%) |
| Total (Category) | 115 (66.1%) | 59 (33.9%) |
| Total (Overall) | 593 (53.2%) | 522 (46.8%) |
Employment Industries by Sex in Sale Creek
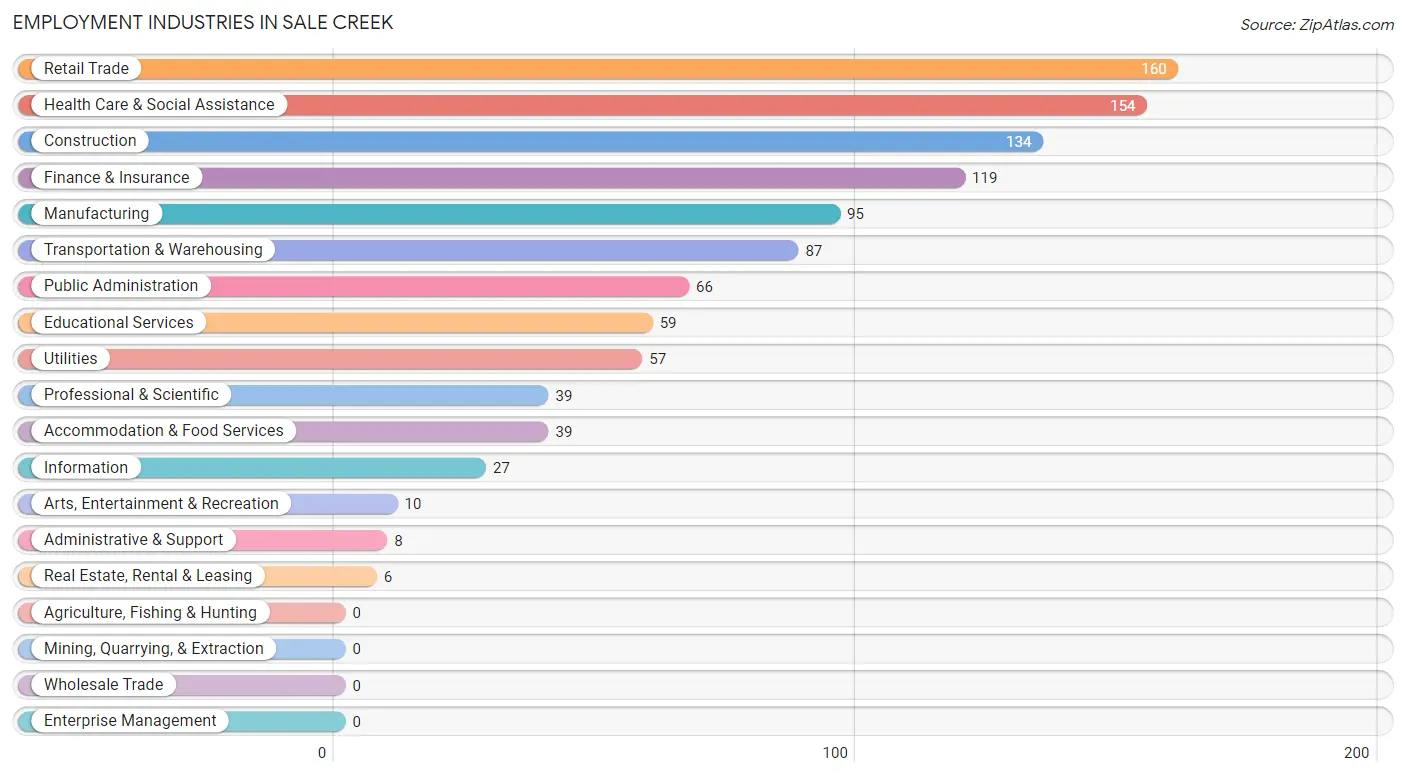
Employment Industries in Sale Creek
The major employment industries in Sale Creek include Retail Trade (160 | 14.3%), Health Care & Social Assistance (154 | 13.8%), Construction (134 | 12.0%), Finance & Insurance (119 | 10.7%), and Manufacturing (95 | 8.5%).
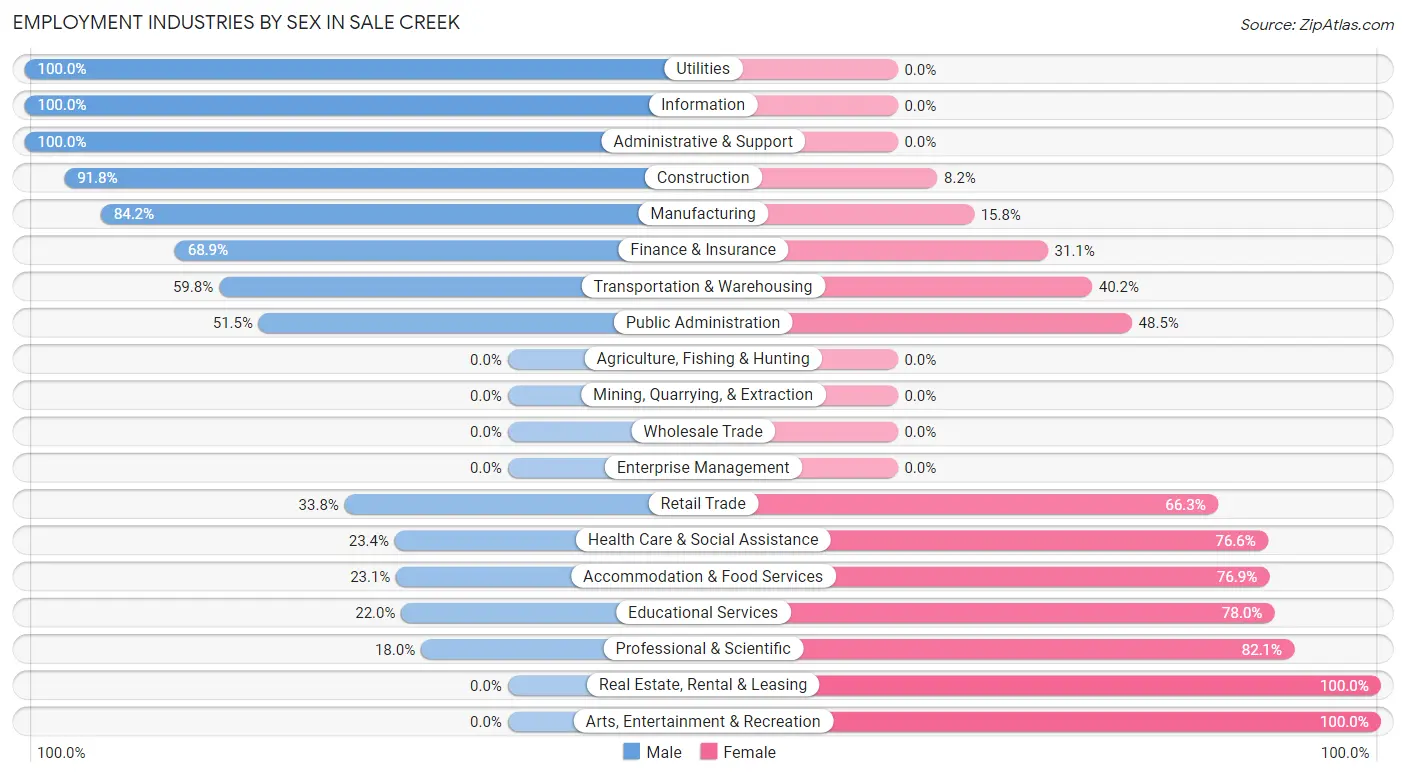
Employment Industries by Sex in Sale Creek
The Sale Creek industries that see more men than women are Utilities (100.0%), Information (100.0%), and Administrative & Support (100.0%), whereas the industries that tend to have a higher number of women are Real Estate, Rental & Leasing (100.0%), Arts, Entertainment & Recreation (100.0%), and Professional & Scientific (82.1%).
| Industry | Male | Female |
| Agriculture, Fishing & Hunting | 0 (0.0%) | 0 (0.0%) |
| Mining, Quarrying, & Extraction | 0 (0.0%) | 0 (0.0%) |
| Construction | 123 (91.8%) | 11 (8.2%) |
| Manufacturing | 80 (84.2%) | 15 (15.8%) |
| Wholesale Trade | 0 (0.0%) | 0 (0.0%) |
| Retail Trade | 54 (33.8%) | 106 (66.2%) |
| Transportation & Warehousing | 52 (59.8%) | 35 (40.2%) |
| Utilities | 57 (100.0%) | 0 (0.0%) |
| Information | 27 (100.0%) | 0 (0.0%) |
| Finance & Insurance | 82 (68.9%) | 37 (31.1%) |
| Real Estate, Rental & Leasing | 0 (0.0%) | 6 (100.0%) |
| Professional & Scientific | 7 (17.9%) | 32 (82.1%) |
| Enterprise Management | 0 (0.0%) | 0 (0.0%) |
| Administrative & Support | 8 (100.0%) | 0 (0.0%) |
| Educational Services | 13 (22.0%) | 46 (78.0%) |
| Health Care & Social Assistance | 36 (23.4%) | 118 (76.6%) |
| Arts, Entertainment & Recreation | 0 (0.0%) | 10 (100.0%) |
| Accommodation & Food Services | 9 (23.1%) | 30 (76.9%) |
| Public Administration | 34 (51.5%) | 32 (48.5%) |
| Total | 593 (53.2%) | 522 (46.8%) |
Education in Sale Creek
School Enrollment in Sale Creek
The most common levels of schooling among the 759 students in Sale Creek are elementary school (235 | 31.0%), middle school (189 | 24.9%), and college / undergraduate (177 | 23.3%).
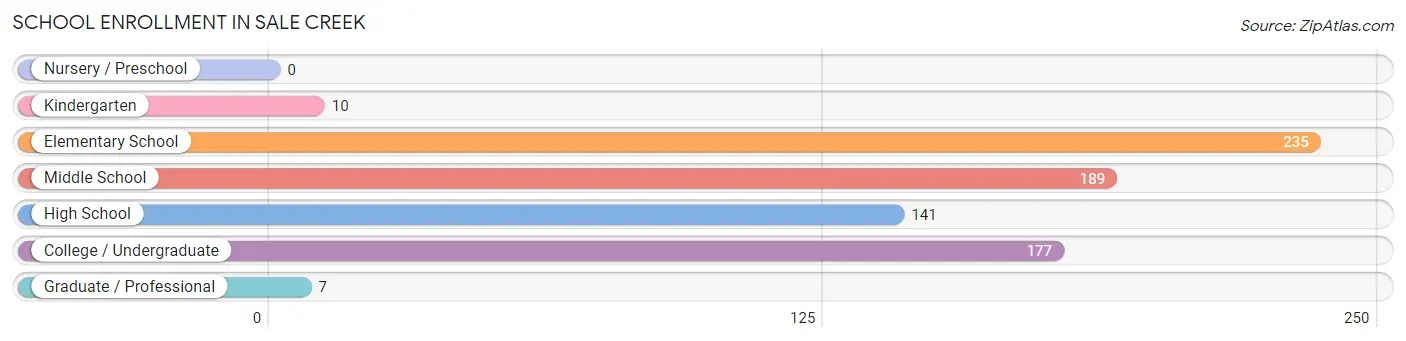
| School Level | # Students | % Students |
| Nursery / Preschool | 0 | 0.0% |
| Kindergarten | 10 | 1.3% |
| Elementary School | 235 | 31.0% |
| Middle School | 189 | 24.9% |
| High School | 141 | 18.6% |
| College / Undergraduate | 177 | 23.3% |
| Graduate / Professional | 7 | 0.9% |
| Total | 759 | 100.0% |
School Enrollment by Age by Funding Source in Sale Creek
Out of a total of 759 students who are enrolled in schools in Sale Creek, 99 (13.0%) attend a private institution, while the remaining 660 (87.0%) are enrolled in public schools. The age group of 5 to 9 year old has the highest likelihood of being enrolled in private schools, with 63 (26.6% in the age bracket) enrolled. Conversely, the age group of 20 to 24 year olds has the lowest likelihood of being enrolled in a private school, with 84 (100.0% in the age bracket) attending a public institution.
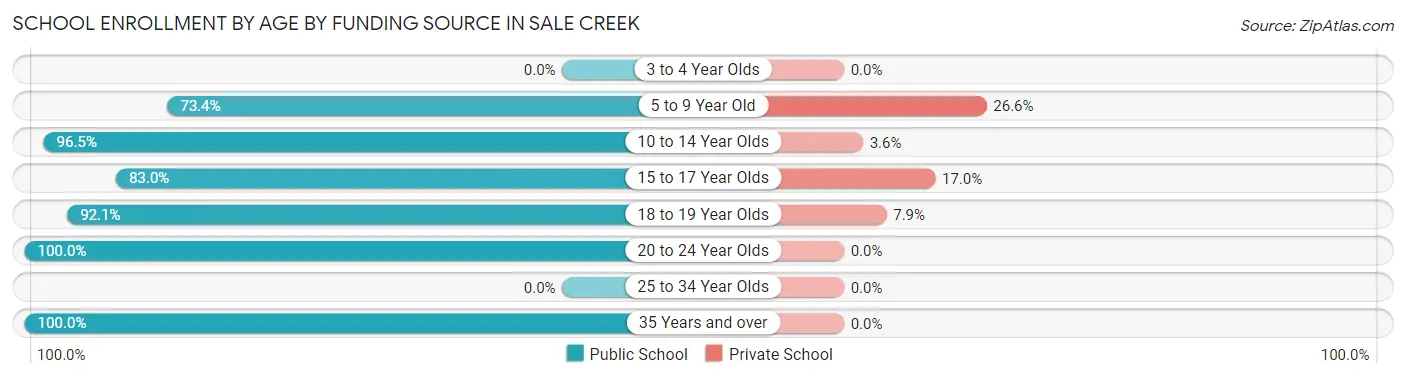
| Age Bracket | Public School | Private School |
| 3 to 4 Year Olds | 0 (0.0%) | 0 (0.0%) |
| 5 to 9 Year Old | 174 (73.4%) | 63 (26.6%) |
| 10 to 14 Year Olds | 190 (96.5%) | 7 (3.5%) |
| 15 to 17 Year Olds | 117 (83.0%) | 24 (17.0%) |
| 18 to 19 Year Olds | 58 (92.1%) | 5 (7.9%) |
| 20 to 24 Year Olds | 84 (100.0%) | 0 (0.0%) |
| 25 to 34 Year Olds | 0 (0.0%) | 0 (0.0%) |
| 35 Years and over | 37 (100.0%) | 0 (0.0%) |
| Total | 660 (87.0%) | 99 (13.0%) |
Educational Attainment by Field of Study in Sale Creek
Business (86 | 27.1%), science & technology (73 | 23.0%), arts & humanities (51 | 16.1%), education (45 | 14.2%), and bio, nature & agricultural (18 | 5.7%) are the most common fields of study among 317 individuals in Sale Creek who have obtained a bachelor's degree or higher.
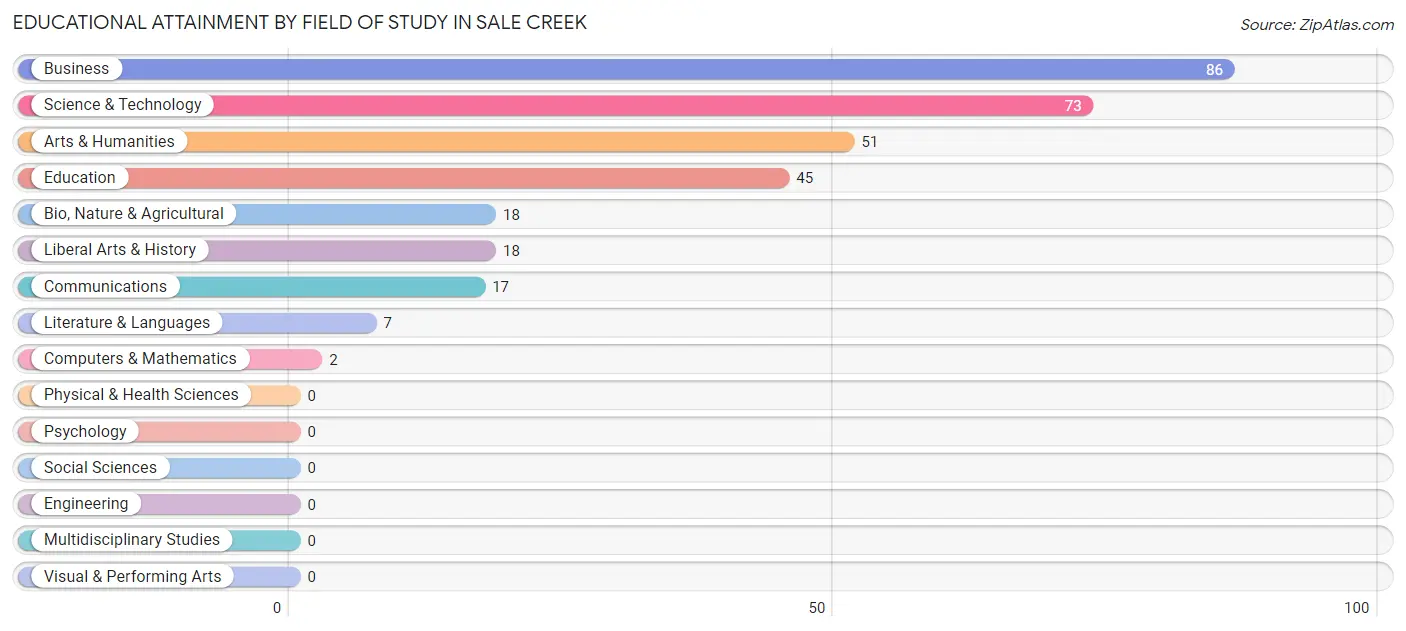
| Field of Study | # Graduates | % Graduates |
| Computers & Mathematics | 2 | 0.6% |
| Bio, Nature & Agricultural | 18 | 5.7% |
| Physical & Health Sciences | 0 | 0.0% |
| Psychology | 0 | 0.0% |
| Social Sciences | 0 | 0.0% |
| Engineering | 0 | 0.0% |
| Multidisciplinary Studies | 0 | 0.0% |
| Science & Technology | 73 | 23.0% |
| Business | 86 | 27.1% |
| Education | 45 | 14.2% |
| Literature & Languages | 7 | 2.2% |
| Liberal Arts & History | 18 | 5.7% |
| Visual & Performing Arts | 0 | 0.0% |
| Communications | 17 | 5.4% |
| Arts & Humanities | 51 | 16.1% |
| Total | 317 | 100.0% |
Transportation & Commute in Sale Creek
Vehicle Availability by Sex in Sale Creek
The most prevalent vehicle ownership categories in Sale Creek are males with 3 vehicles (205, accounting for 34.6%) and females with 3 vehicles (170, making up 39.3%).
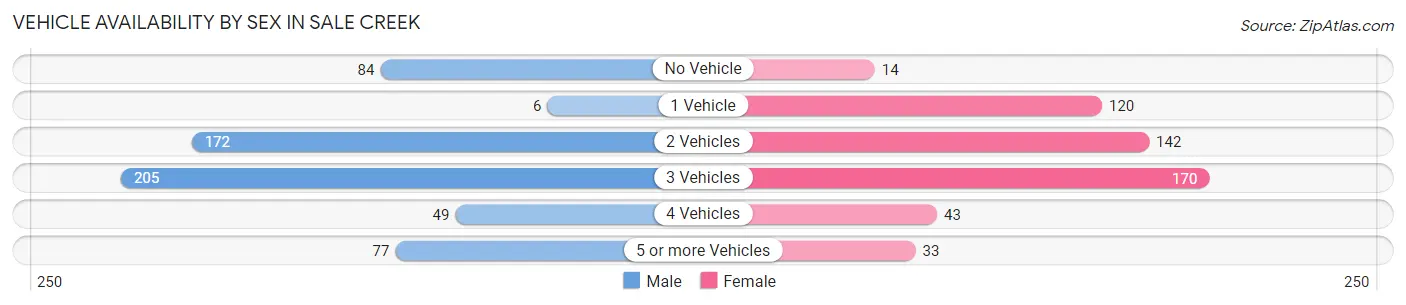
| Vehicles Available | Male | Female |
| No Vehicle | 84 (14.2%) | 14 (2.7%) |
| 1 Vehicle | 6 (1.0%) | 120 (23.0%) |
| 2 Vehicles | 172 (29.0%) | 142 (27.2%) |
| 3 Vehicles | 205 (34.6%) | 170 (32.6%) |
| 4 Vehicles | 49 (8.3%) | 43 (8.2%) |
| 5 or more Vehicles | 77 (13.0%) | 33 (6.3%) |
| Total | 593 (100.0%) | 522 (100.0%) |
Commute Time in Sale Creek
The most frequently occuring commute durations in Sale Creek are 30 to 34 minutes (232 commuters, 22.0%), 40 to 44 minutes (217 commuters, 20.5%), and 20 to 24 minutes (140 commuters, 13.3%).
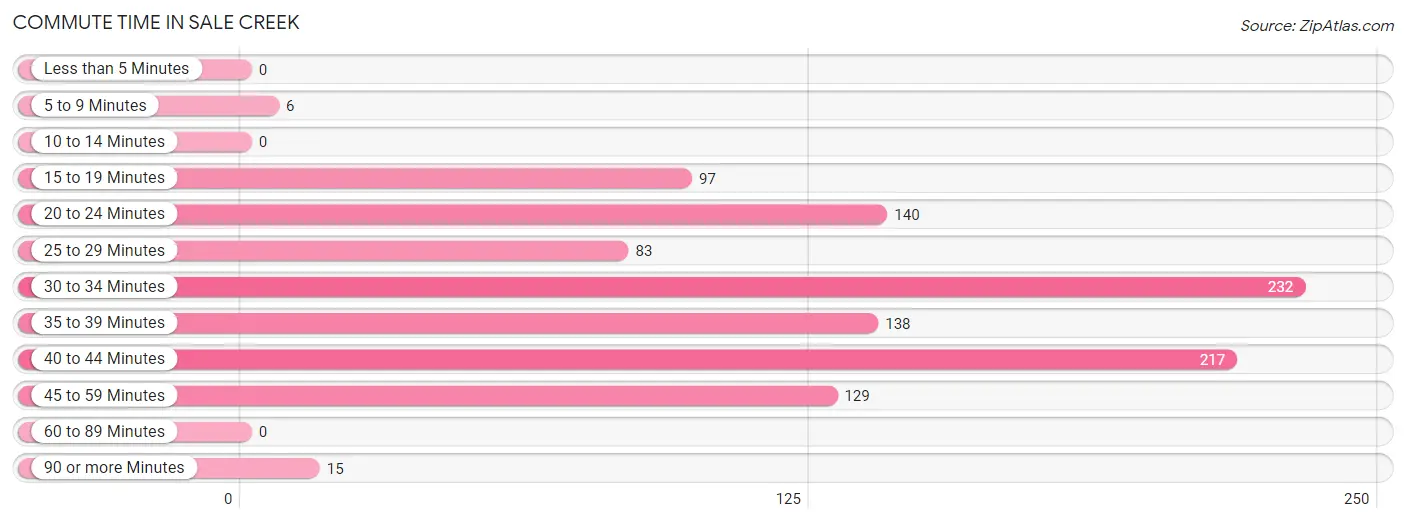
| Commute Time | # Commuters | % Commuters |
| Less than 5 Minutes | 0 | 0.0% |
| 5 to 9 Minutes | 6 | 0.6% |
| 10 to 14 Minutes | 0 | 0.0% |
| 15 to 19 Minutes | 97 | 9.2% |
| 20 to 24 Minutes | 140 | 13.3% |
| 25 to 29 Minutes | 83 | 7.9% |
| 30 to 34 Minutes | 232 | 22.0% |
| 35 to 39 Minutes | 138 | 13.1% |
| 40 to 44 Minutes | 217 | 20.5% |
| 45 to 59 Minutes | 129 | 12.2% |
| 60 to 89 Minutes | 0 | 0.0% |
| 90 or more Minutes | 15 | 1.4% |
Commute Time by Sex in Sale Creek
The most common commute times in Sale Creek are 30 to 34 minutes (173 commuters, 32.0%) for males and 20 to 24 minutes (103 commuters, 20.0%) for females.
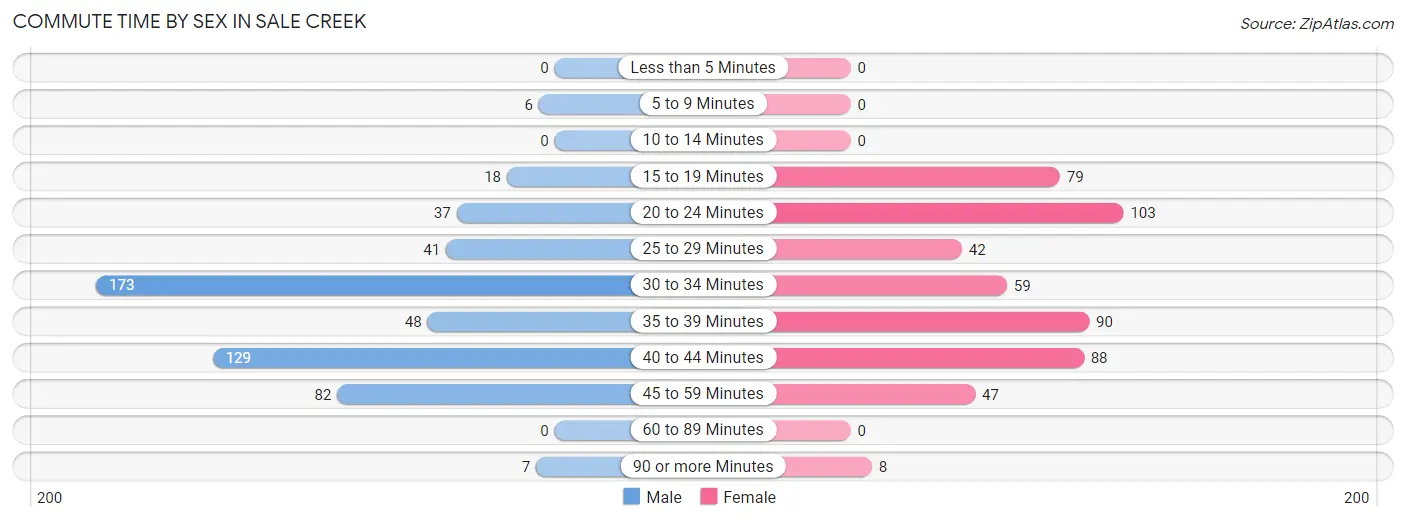
| Commute Time | Male | Female |
| Less than 5 Minutes | 0 (0.0%) | 0 (0.0%) |
| 5 to 9 Minutes | 6 (1.1%) | 0 (0.0%) |
| 10 to 14 Minutes | 0 (0.0%) | 0 (0.0%) |
| 15 to 19 Minutes | 18 (3.3%) | 79 (15.3%) |
| 20 to 24 Minutes | 37 (6.8%) | 103 (20.0%) |
| 25 to 29 Minutes | 41 (7.6%) | 42 (8.1%) |
| 30 to 34 Minutes | 173 (32.0%) | 59 (11.4%) |
| 35 to 39 Minutes | 48 (8.9%) | 90 (17.4%) |
| 40 to 44 Minutes | 129 (23.8%) | 88 (17.1%) |
| 45 to 59 Minutes | 82 (15.2%) | 47 (9.1%) |
| 60 to 89 Minutes | 0 (0.0%) | 0 (0.0%) |
| 90 or more Minutes | 7 (1.3%) | 8 (1.5%) |
Time of Departure to Work by Sex in Sale Creek
The most frequent times of departure to work in Sale Creek are 6:30 AM to 6:59 AM (151, 27.9%) for males and 8:00 AM to 8:29 AM (146, 28.3%) for females.
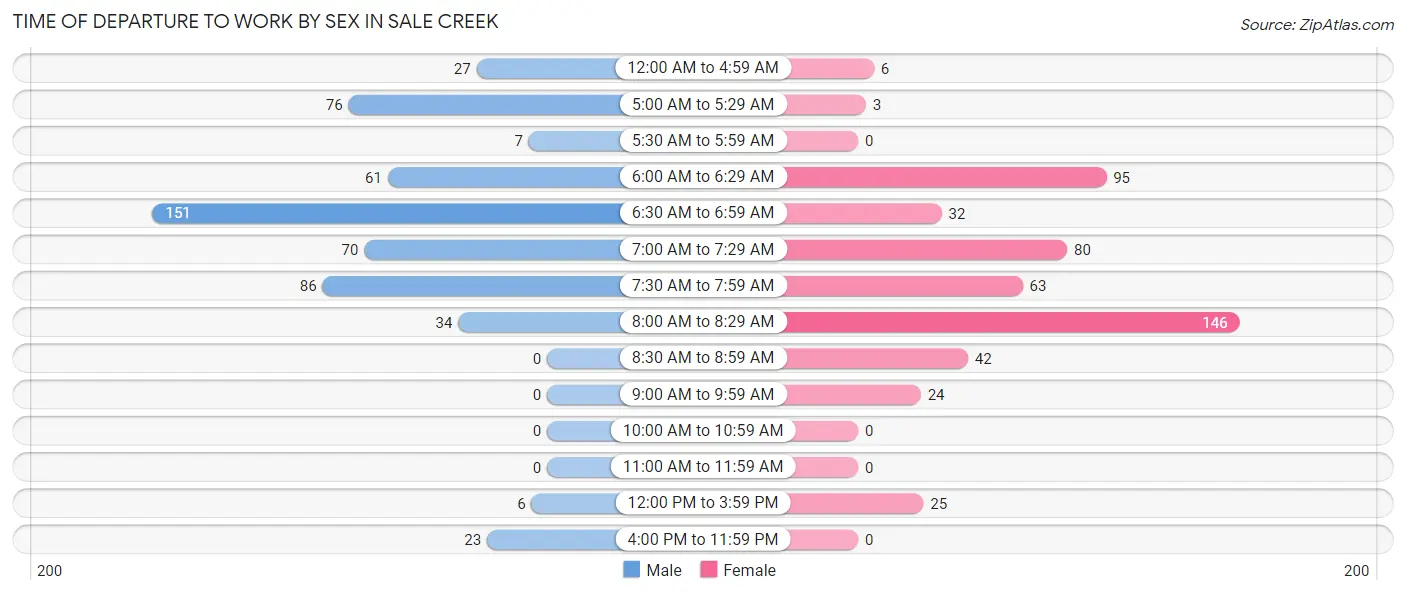
| Time of Departure | Male | Female |
| 12:00 AM to 4:59 AM | 27 (5.0%) | 6 (1.2%) |
| 5:00 AM to 5:29 AM | 76 (14.1%) | 3 (0.6%) |
| 5:30 AM to 5:59 AM | 7 (1.3%) | 0 (0.0%) |
| 6:00 AM to 6:29 AM | 61 (11.3%) | 95 (18.4%) |
| 6:30 AM to 6:59 AM | 151 (27.9%) | 32 (6.2%) |
| 7:00 AM to 7:29 AM | 70 (12.9%) | 80 (15.5%) |
| 7:30 AM to 7:59 AM | 86 (15.9%) | 63 (12.2%) |
| 8:00 AM to 8:29 AM | 34 (6.3%) | 146 (28.3%) |
| 8:30 AM to 8:59 AM | 0 (0.0%) | 42 (8.1%) |
| 9:00 AM to 9:59 AM | 0 (0.0%) | 24 (4.6%) |
| 10:00 AM to 10:59 AM | 0 (0.0%) | 0 (0.0%) |
| 11:00 AM to 11:59 AM | 0 (0.0%) | 0 (0.0%) |
| 12:00 PM to 3:59 PM | 6 (1.1%) | 25 (4.8%) |
| 4:00 PM to 11:59 PM | 23 (4.3%) | 0 (0.0%) |
| Total | 541 (100.0%) | 516 (100.0%) |
Housing Occupancy in Sale Creek
Occupancy by Ownership in Sale Creek
Of the total 1,027 dwellings in Sale Creek, owner-occupied units account for 877 (85.4%), while renter-occupied units make up 150 (14.6%).
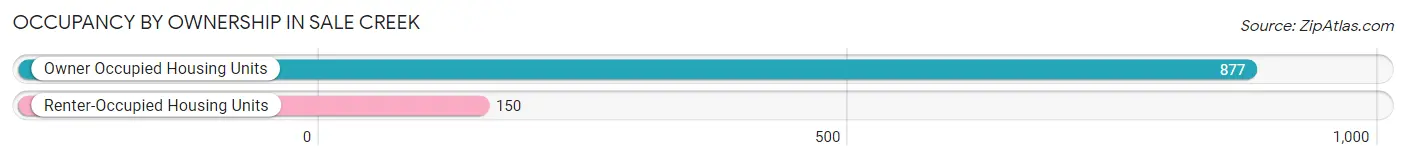
| Occupancy | # Housing Units | % Housing Units |
| Owner Occupied Housing Units | 877 | 85.4% |
| Renter-Occupied Housing Units | 150 | 14.6% |
| Total Occupied Housing Units | 1,027 | 100.0% |
Occupancy by Household Size in Sale Creek
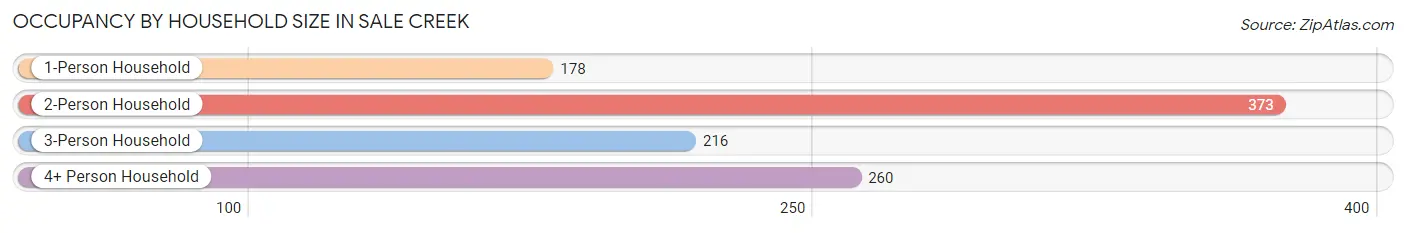
| Household Size | # Housing Units | % Housing Units |
| 1-Person Household | 178 | 17.3% |
| 2-Person Household | 373 | 36.3% |
| 3-Person Household | 216 | 21.0% |
| 4+ Person Household | 260 | 25.3% |
| Total Housing Units | 1,027 | 100.0% |
Occupancy by Ownership by Household Size in Sale Creek
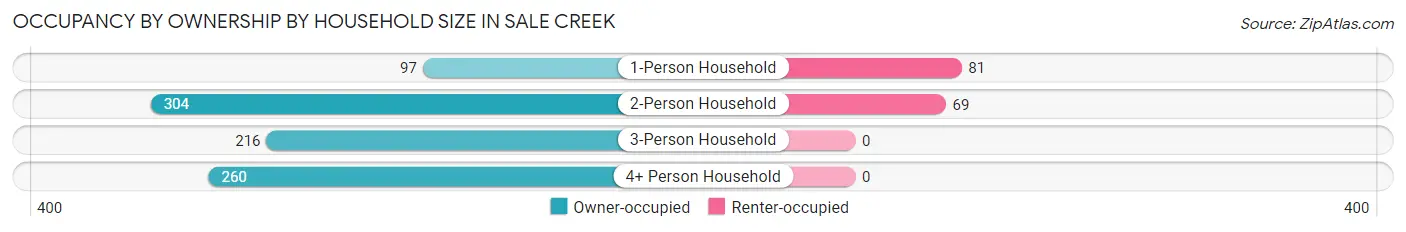
| Household Size | Owner-occupied | Renter-occupied |
| 1-Person Household | 97 (54.5%) | 81 (45.5%) |
| 2-Person Household | 304 (81.5%) | 69 (18.5%) |
| 3-Person Household | 216 (100.0%) | 0 (0.0%) |
| 4+ Person Household | 260 (100.0%) | 0 (0.0%) |
| Total Housing Units | 877 (85.4%) | 150 (14.6%) |
Occupancy by Educational Attainment in Sale Creek
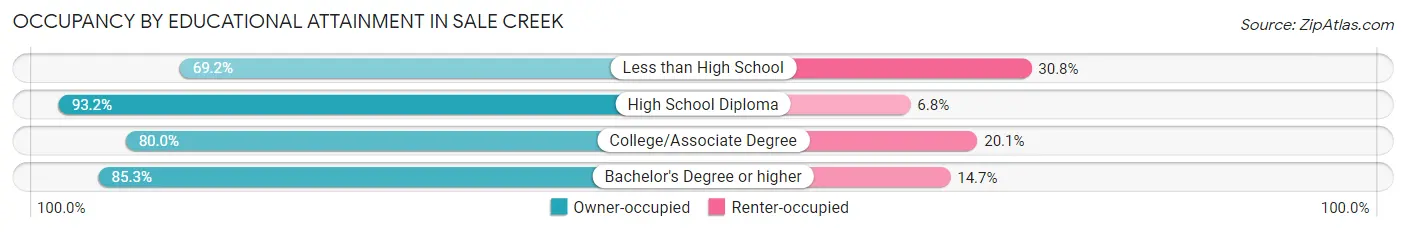
| Household Size | Owner-occupied | Renter-occupied |
| Less than High School | 27 (69.2%) | 12 (30.8%) |
| High School Diploma | 343 (93.2%) | 25 (6.8%) |
| College/Associate Degree | 327 (79.9%) | 82 (20.1%) |
| Bachelor's Degree or higher | 180 (85.3%) | 31 (14.7%) |
Occupancy by Age of Householder in Sale Creek
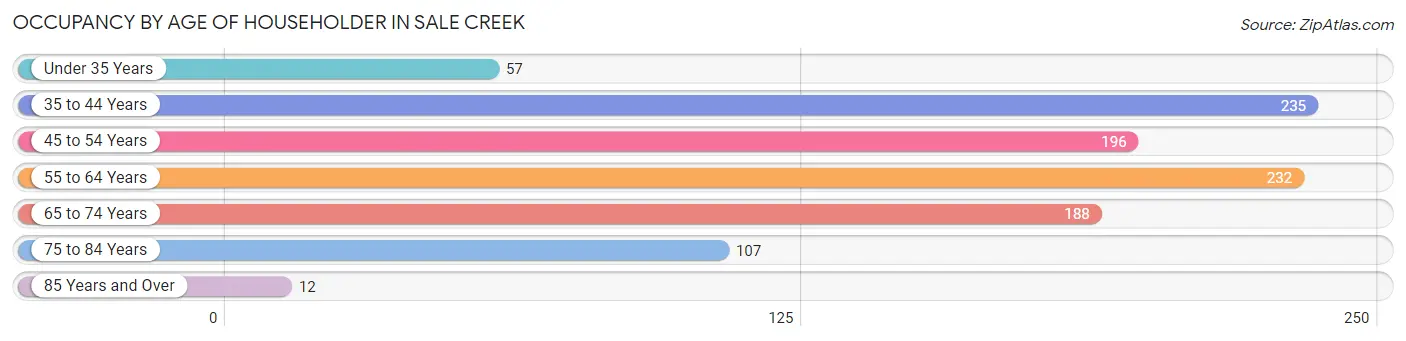
| Age Bracket | # Households | % Households |
| Under 35 Years | 57 | 5.6% |
| 35 to 44 Years | 235 | 22.9% |
| 45 to 54 Years | 196 | 19.1% |
| 55 to 64 Years | 232 | 22.6% |
| 65 to 74 Years | 188 | 18.3% |
| 75 to 84 Years | 107 | 10.4% |
| 85 Years and Over | 12 | 1.2% |
| Total | 1,027 | 100.0% |
Housing Finances in Sale Creek
Median Income by Occupancy in Sale Creek
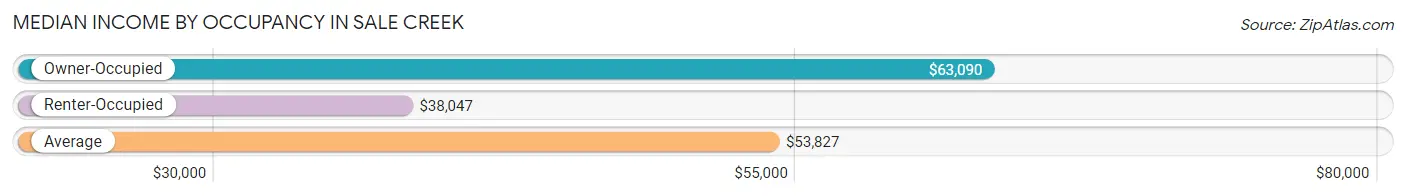
| Occupancy Type | # Households | Median Income |
| Owner-Occupied | 877 (85.4%) | $63,090 |
| Renter-Occupied | 150 (14.6%) | $38,047 |
| Average | 1,027 (100.0%) | $53,827 |
Occupancy by Householder Income Bracket in Sale Creek
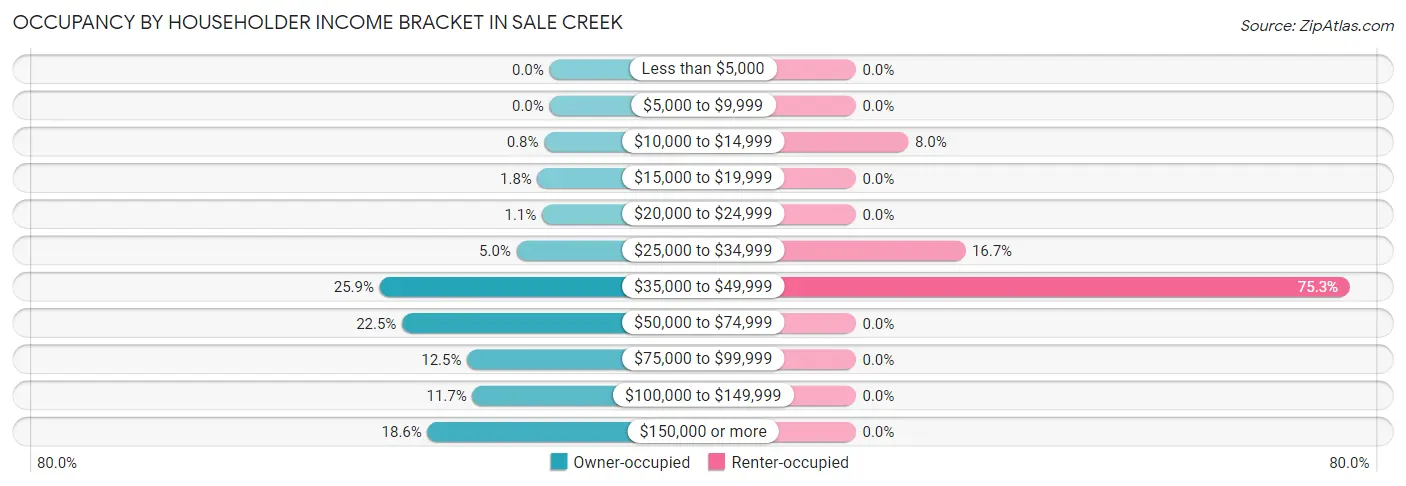
| Income Bracket | Owner-occupied | Renter-occupied |
| Less than $5,000 | 0 (0.0%) | 0 (0.0%) |
| $5,000 to $9,999 | 0 (0.0%) | 0 (0.0%) |
| $10,000 to $14,999 | 7 (0.8%) | 12 (8.0%) |
| $15,000 to $19,999 | 16 (1.8%) | 0 (0.0%) |
| $20,000 to $24,999 | 10 (1.1%) | 0 (0.0%) |
| $25,000 to $34,999 | 44 (5.0%) | 25 (16.7%) |
| $35,000 to $49,999 | 227 (25.9%) | 113 (75.3%) |
| $50,000 to $74,999 | 197 (22.5%) | 0 (0.0%) |
| $75,000 to $99,999 | 110 (12.5%) | 0 (0.0%) |
| $100,000 to $149,999 | 103 (11.7%) | 0 (0.0%) |
| $150,000 or more | 163 (18.6%) | 0 (0.0%) |
| Total | 877 (100.0%) | 150 (100.0%) |
Monthly Housing Cost Tiers in Sale Creek
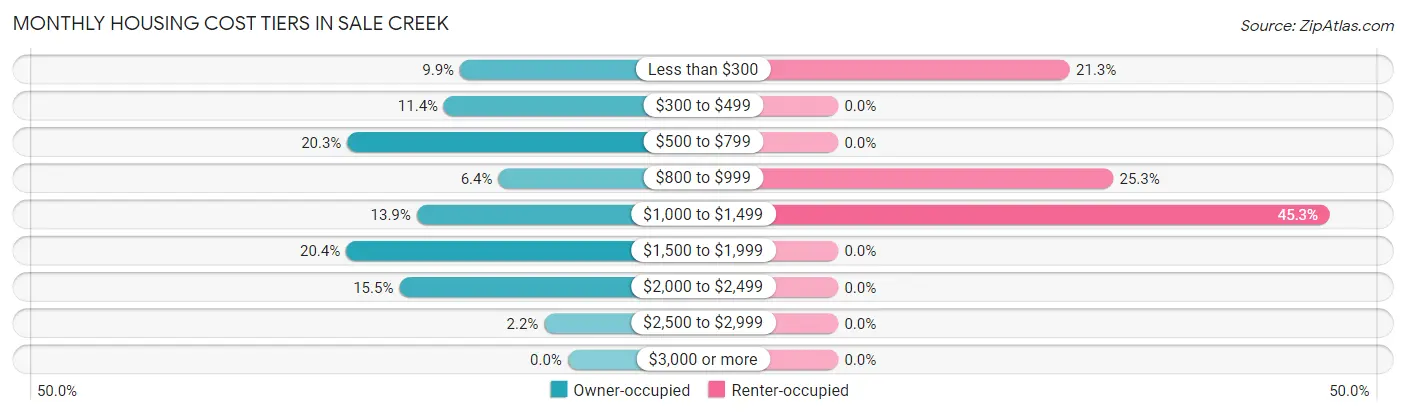
| Monthly Cost | Owner-occupied | Renter-occupied |
| Less than $300 | 87 (9.9%) | 32 (21.3%) |
| $300 to $499 | 100 (11.4%) | 0 (0.0%) |
| $500 to $799 | 178 (20.3%) | 0 (0.0%) |
| $800 to $999 | 56 (6.4%) | 38 (25.3%) |
| $1,000 to $1,499 | 122 (13.9%) | 68 (45.3%) |
| $1,500 to $1,999 | 179 (20.4%) | 0 (0.0%) |
| $2,000 to $2,499 | 136 (15.5%) | 0 (0.0%) |
| $2,500 to $2,999 | 19 (2.2%) | 0 (0.0%) |
| $3,000 or more | 0 (0.0%) | 0 (0.0%) |
| Total | 877 (100.0%) | 150 (100.0%) |
Physical Housing Characteristics in Sale Creek
Housing Structures in Sale Creek
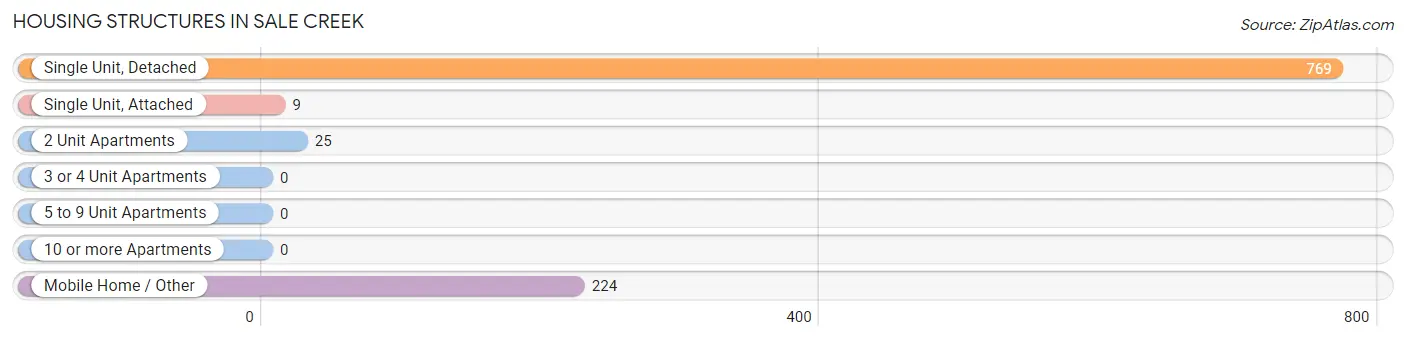
| Structure Type | # Housing Units | % Housing Units |
| Single Unit, Detached | 769 | 74.9% |
| Single Unit, Attached | 9 | 0.9% |
| 2 Unit Apartments | 25 | 2.4% |
| 3 or 4 Unit Apartments | 0 | 0.0% |
| 5 to 9 Unit Apartments | 0 | 0.0% |
| 10 or more Apartments | 0 | 0.0% |
| Mobile Home / Other | 224 | 21.8% |
| Total | 1,027 | 100.0% |
Housing Structures by Occupancy in Sale Creek
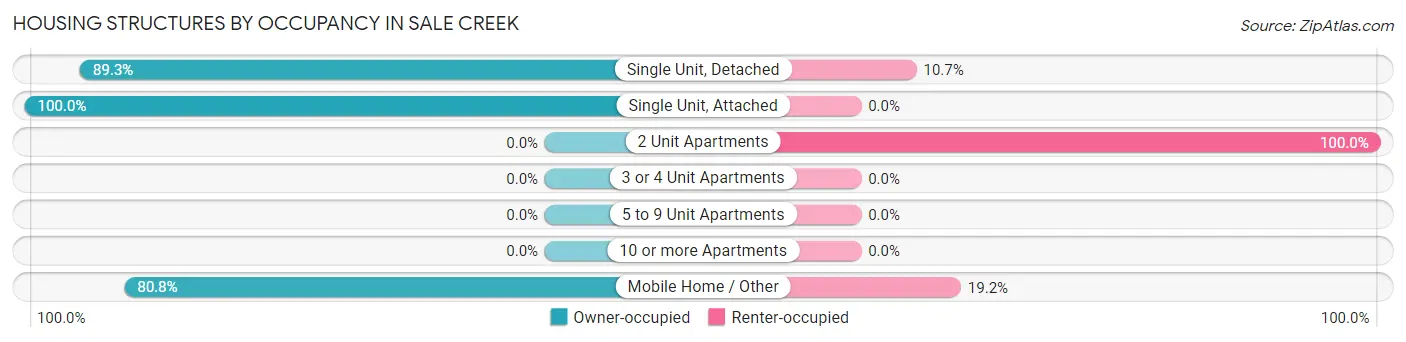
| Structure Type | Owner-occupied | Renter-occupied |
| Single Unit, Detached | 687 (89.3%) | 82 (10.7%) |
| Single Unit, Attached | 9 (100.0%) | 0 (0.0%) |
| 2 Unit Apartments | 0 (0.0%) | 25 (100.0%) |
| 3 or 4 Unit Apartments | 0 (0.0%) | 0 (0.0%) |
| 5 to 9 Unit Apartments | 0 (0.0%) | 0 (0.0%) |
| 10 or more Apartments | 0 (0.0%) | 0 (0.0%) |
| Mobile Home / Other | 181 (80.8%) | 43 (19.2%) |
| Total | 877 (85.4%) | 150 (14.6%) |
Housing Structures by Number of Rooms in Sale Creek
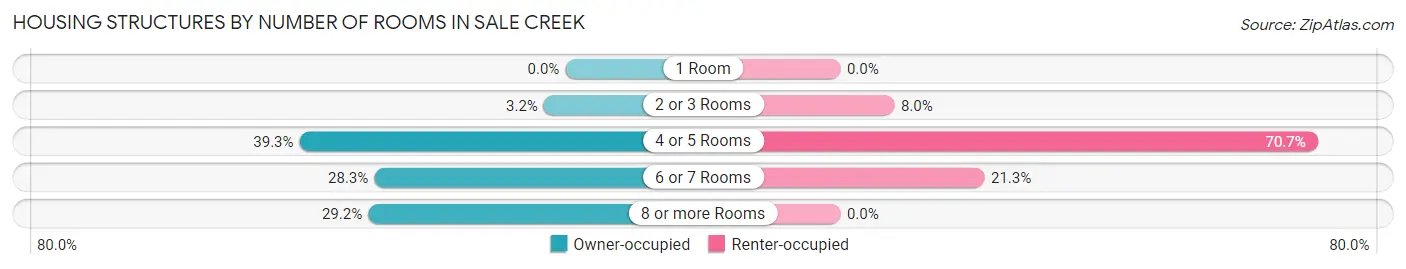
| Number of Rooms | Owner-occupied | Renter-occupied |
| 1 Room | 0 (0.0%) | 0 (0.0%) |
| 2 or 3 Rooms | 28 (3.2%) | 12 (8.0%) |
| 4 or 5 Rooms | 345 (39.3%) | 106 (70.7%) |
| 6 or 7 Rooms | 248 (28.3%) | 32 (21.3%) |
| 8 or more Rooms | 256 (29.2%) | 0 (0.0%) |
| Total | 877 (100.0%) | 150 (100.0%) |
Housing Structure by Heating Type in Sale Creek
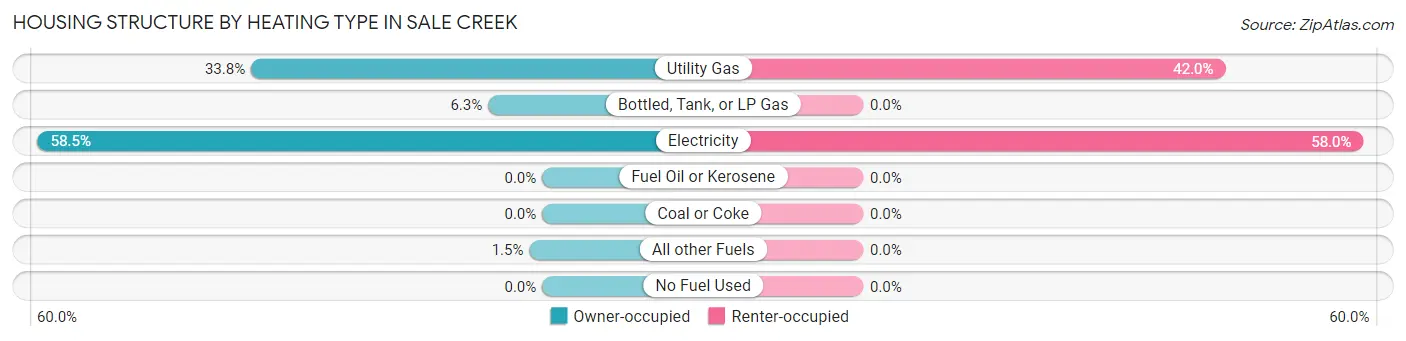
| Heating Type | Owner-occupied | Renter-occupied |
| Utility Gas | 296 (33.8%) | 63 (42.0%) |
| Bottled, Tank, or LP Gas | 55 (6.3%) | 0 (0.0%) |
| Electricity | 513 (58.5%) | 87 (58.0%) |
| Fuel Oil or Kerosene | 0 (0.0%) | 0 (0.0%) |
| Coal or Coke | 0 (0.0%) | 0 (0.0%) |
| All other Fuels | 13 (1.5%) | 0 (0.0%) |
| No Fuel Used | 0 (0.0%) | 0 (0.0%) |
| Total | 877 (100.0%) | 150 (100.0%) |
Household Vehicle Usage in Sale Creek
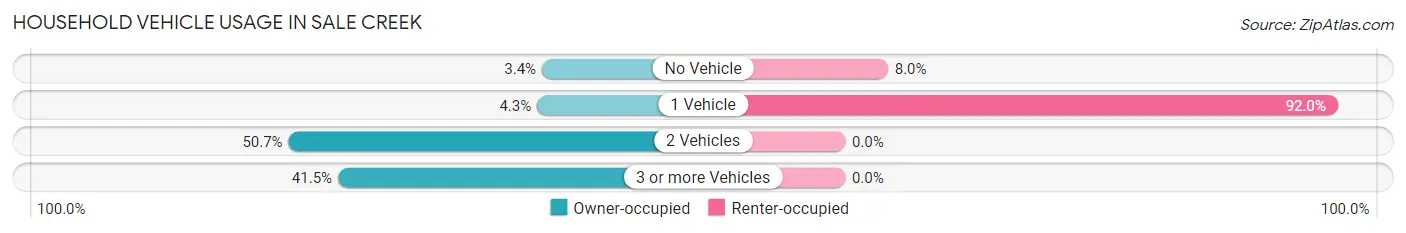
| Vehicles per Household | Owner-occupied | Renter-occupied |
| No Vehicle | 30 (3.4%) | 12 (8.0%) |
| 1 Vehicle | 38 (4.3%) | 138 (92.0%) |
| 2 Vehicles | 445 (50.7%) | 0 (0.0%) |
| 3 or more Vehicles | 364 (41.5%) | 0 (0.0%) |
| Total | 877 (100.0%) | 150 (100.0%) |
Real Estate & Mortgages in Sale Creek
Real Estate and Mortgage Overview in Sale Creek
| Characteristic | Without Mortgage | With Mortgage |
| Housing Units | 334 | 543 |
| Median Property Value | $143,700 | $355,900 |
| Median Household Income | $56,667 | $156 |
| Monthly Housing Costs | $471 | $0 |
| Real Estate Taxes | $1,083 | $0 |
Property Value by Mortgage Status in Sale Creek
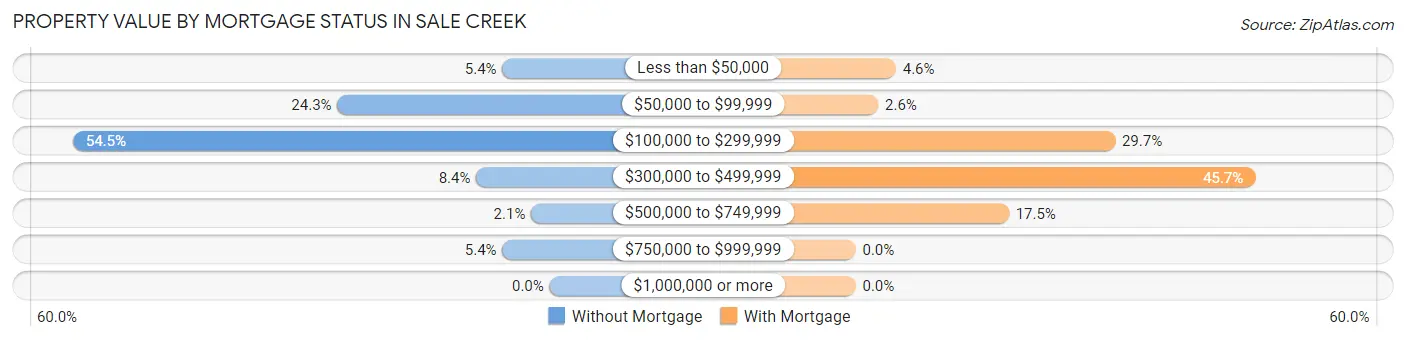
| Property Value | Without Mortgage | With Mortgage |
| Less than $50,000 | 18 (5.4%) | 25 (4.6%) |
| $50,000 to $99,999 | 81 (24.2%) | 14 (2.6%) |
| $100,000 to $299,999 | 182 (54.5%) | 161 (29.6%) |
| $300,000 to $499,999 | 28 (8.4%) | 248 (45.7%) |
| $500,000 to $749,999 | 7 (2.1%) | 95 (17.5%) |
| $750,000 to $999,999 | 18 (5.4%) | 0 (0.0%) |
| $1,000,000 or more | 0 (0.0%) | 0 (0.0%) |
| Total | 334 (100.0%) | 543 (100.0%) |
Household Income by Mortgage Status in Sale Creek
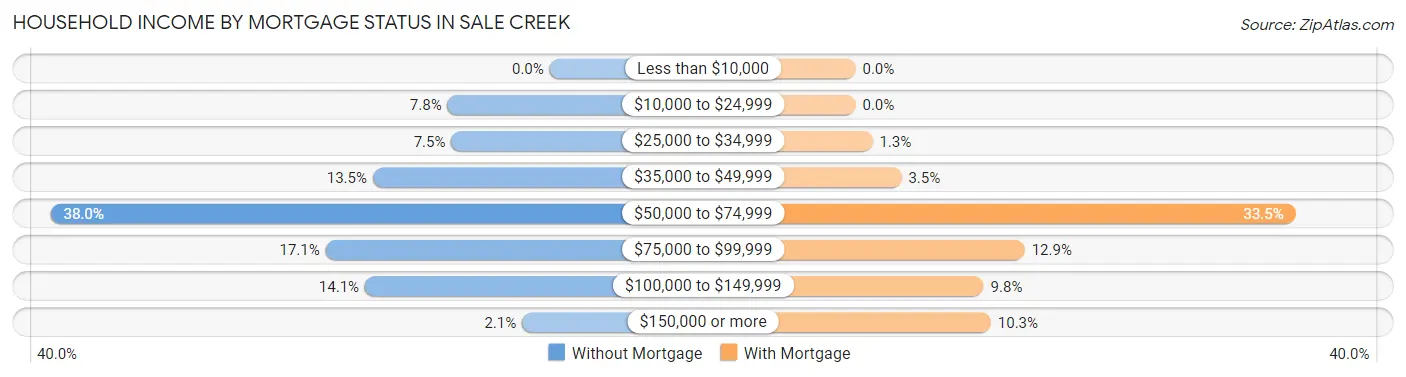
| Household Income | Without Mortgage | With Mortgage |
| Less than $10,000 | 0 (0.0%) | 0 (0.0%) |
| $10,000 to $24,999 | 26 (7.8%) | 0 (0.0%) |
| $25,000 to $34,999 | 25 (7.5%) | 7 (1.3%) |
| $35,000 to $49,999 | 45 (13.5%) | 19 (3.5%) |
| $50,000 to $74,999 | 127 (38.0%) | 182 (33.5%) |
| $75,000 to $99,999 | 57 (17.1%) | 70 (12.9%) |
| $100,000 to $149,999 | 47 (14.1%) | 53 (9.8%) |
| $150,000 or more | 7 (2.1%) | 56 (10.3%) |
| Total | 334 (100.0%) | 543 (100.0%) |
Property Value to Household Income Ratio in Sale Creek
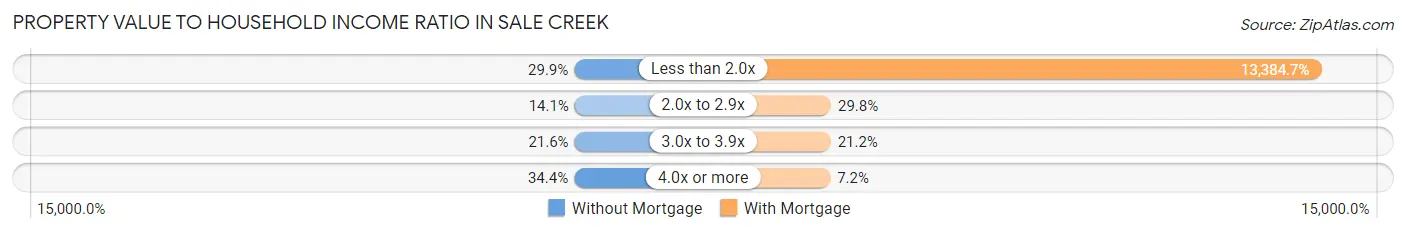
| Value-to-Income Ratio | Without Mortgage | With Mortgage |
| Less than 2.0x | 100 (29.9%) | 72,679 (13,384.7%) |
| 2.0x to 2.9x | 47 (14.1%) | 162 (29.8%) |
| 3.0x to 3.9x | 72 (21.6%) | 115 (21.2%) |
| 4.0x or more | 115 (34.4%) | 39 (7.2%) |
| Total | 334 (100.0%) | 543 (100.0%) |
Real Estate Taxes by Mortgage Status in Sale Creek
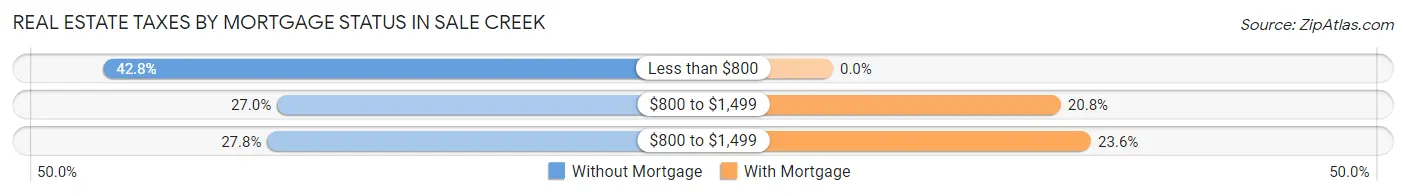
| Property Taxes | Without Mortgage | With Mortgage |
| Less than $800 | 143 (42.8%) | 0 (0.0%) |
| $800 to $1,499 | 90 (27.0%) | 113 (20.8%) |
| $800 to $1,499 | 93 (27.8%) | 128 (23.6%) |
| Total | 334 (100.0%) | 543 (100.0%) |
Health & Disability in Sale Creek
Health Insurance Coverage by Age in Sale Creek
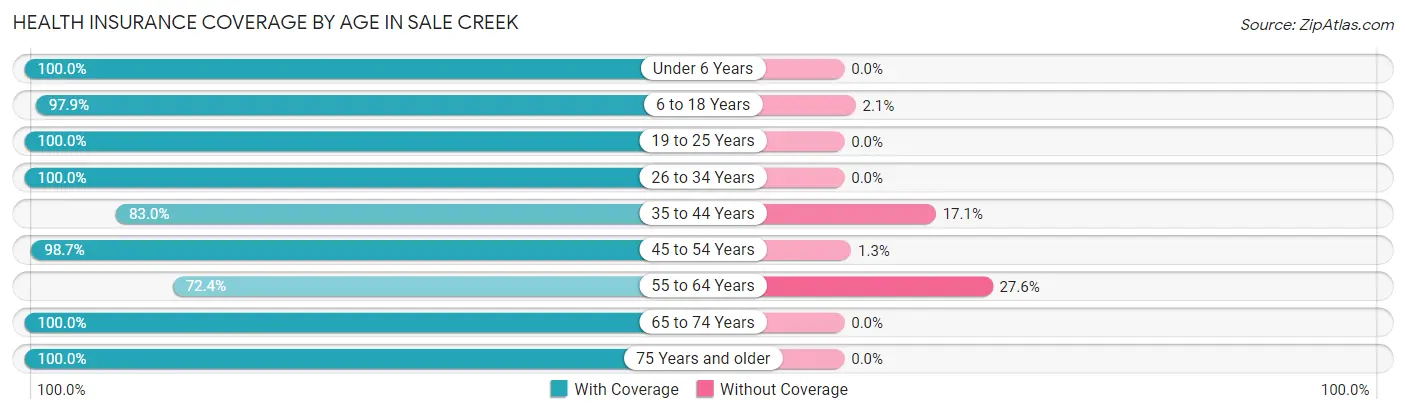
| Age Bracket | With Coverage | Without Coverage |
| Under 6 Years | 91 (100.0%) | 0 (0.0%) |
| 6 to 18 Years | 607 (97.9%) | 13 (2.1%) |
| 19 to 25 Years | 235 (100.0%) | 0 (0.0%) |
| 26 to 34 Years | 78 (100.0%) | 0 (0.0%) |
| 35 to 44 Years | 321 (83.0%) | 66 (17.1%) |
| 45 to 54 Years | 621 (98.7%) | 8 (1.3%) |
| 55 to 64 Years | 241 (72.4%) | 92 (27.6%) |
| 65 to 74 Years | 418 (100.0%) | 0 (0.0%) |
| 75 Years and older | 274 (100.0%) | 0 (0.0%) |
| Total | 2,886 (94.2%) | 179 (5.8%) |
Health Insurance Coverage by Citizenship Status in Sale Creek
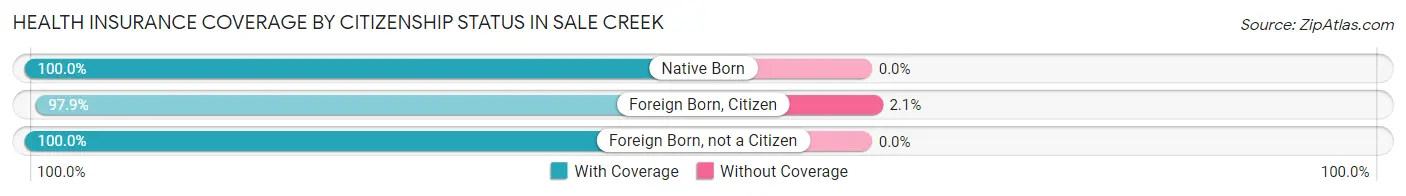
| Citizenship Status | With Coverage | Without Coverage |
| Native Born | 91 (100.0%) | 0 (0.0%) |
| Foreign Born, Citizen | 607 (97.9%) | 13 (2.1%) |
| Foreign Born, not a Citizen | 235 (100.0%) | 0 (0.0%) |
Health Insurance Coverage by Household Income in Sale Creek
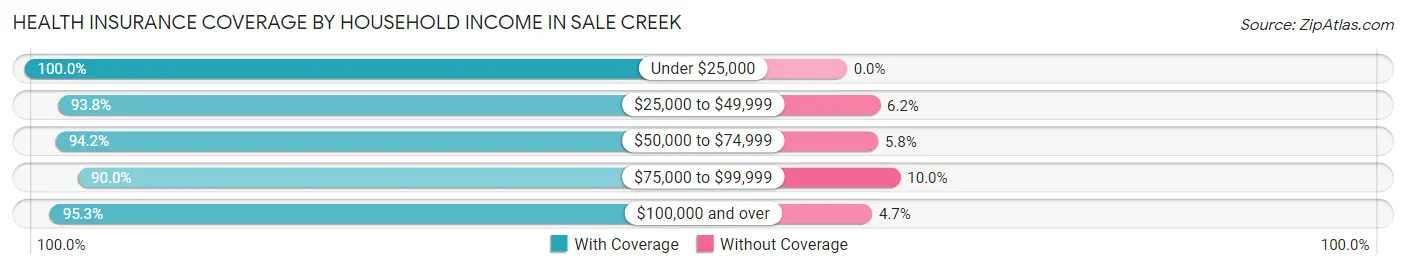
| Household Income | With Coverage | Without Coverage |
| Under $25,000 | 55 (100.0%) | 0 (0.0%) |
| $25,000 to $49,999 | 961 (93.8%) | 64 (6.2%) |
| $50,000 to $74,999 | 532 (94.2%) | 33 (5.8%) |
| $75,000 to $99,999 | 251 (90.0%) | 28 (10.0%) |
| $100,000 and over | 1,087 (95.3%) | 54 (4.7%) |
Public vs Private Health Insurance Coverage by Age in Sale Creek
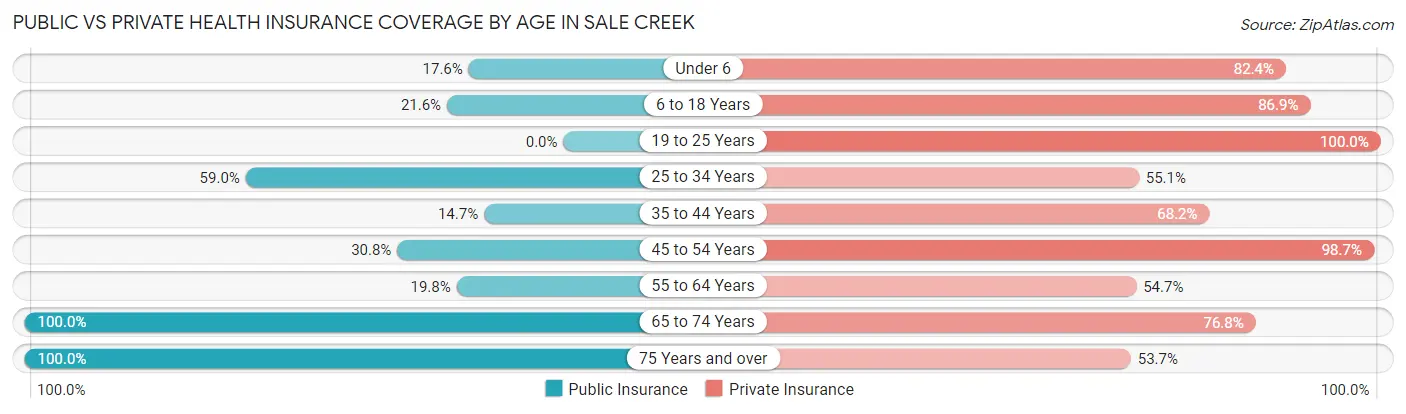
| Age Bracket | Public Insurance | Private Insurance |
| Under 6 | 16 (17.6%) | 75 (82.4%) |
| 6 to 18 Years | 134 (21.6%) | 539 (86.9%) |
| 19 to 25 Years | 0 (0.0%) | 235 (100.0%) |
| 25 to 34 Years | 46 (59.0%) | 43 (55.1%) |
| 35 to 44 Years | 57 (14.7%) | 264 (68.2%) |
| 45 to 54 Years | 194 (30.8%) | 621 (98.7%) |
| 55 to 64 Years | 66 (19.8%) | 182 (54.6%) |
| 65 to 74 Years | 418 (100.0%) | 321 (76.8%) |
| 75 Years and over | 274 (100.0%) | 147 (53.6%) |
| Total | 1,205 (39.3%) | 2,427 (79.2%) |
Disability Status by Sex by Age in Sale Creek
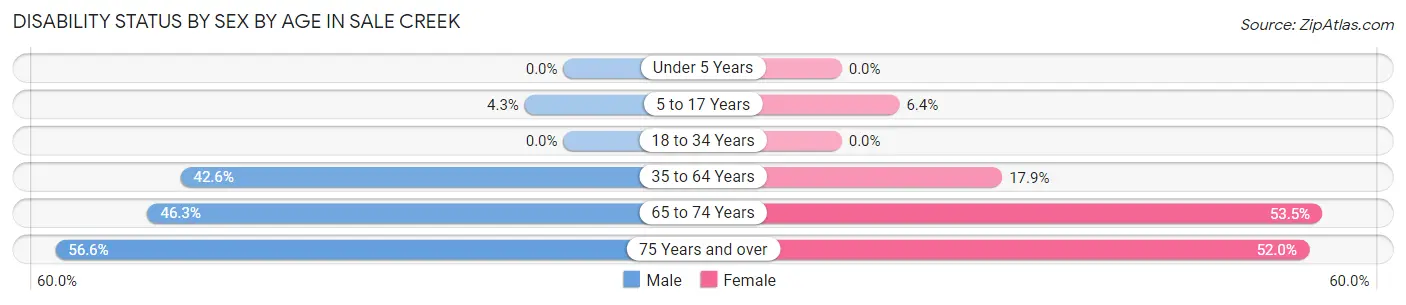
| Age Bracket | Male | Female |
| Under 5 Years | 0 (0.0%) | 0 (0.0%) |
| 5 to 17 Years | 10 (4.3%) | 24 (6.4%) |
| 18 to 34 Years | 0 (0.0%) | 0 (0.0%) |
| 35 to 64 Years | 327 (42.6%) | 104 (17.9%) |
| 65 to 74 Years | 100 (46.3%) | 108 (53.5%) |
| 75 Years and over | 56 (56.6%) | 91 (52.0%) |
Disability Class by Sex by Age in Sale Creek
Disability Class: Hearing Difficulty
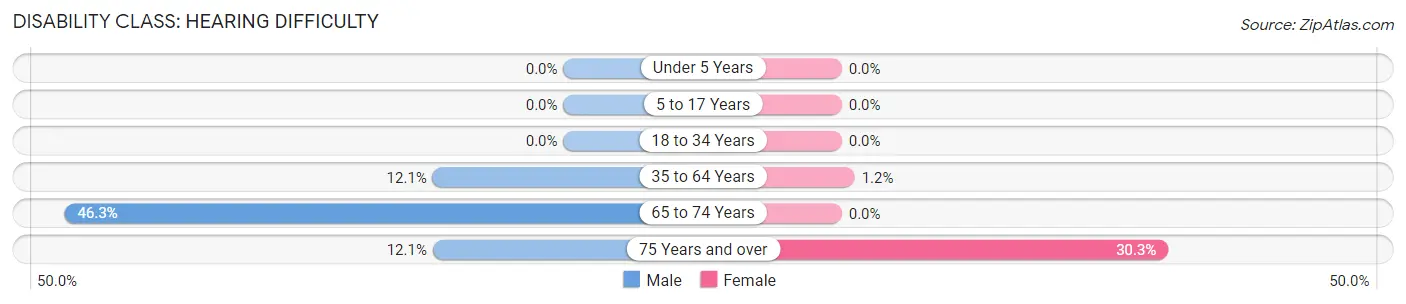
| Age Bracket | Male | Female |
| Under 5 Years | 0 (0.0%) | 0 (0.0%) |
| 5 to 17 Years | 0 (0.0%) | 0 (0.0%) |
| 18 to 34 Years | 0 (0.0%) | 0 (0.0%) |
| 35 to 64 Years | 93 (12.1%) | 7 (1.2%) |
| 65 to 74 Years | 100 (46.3%) | 0 (0.0%) |
| 75 Years and over | 12 (12.1%) | 53 (30.3%) |
Disability Class: Vision Difficulty
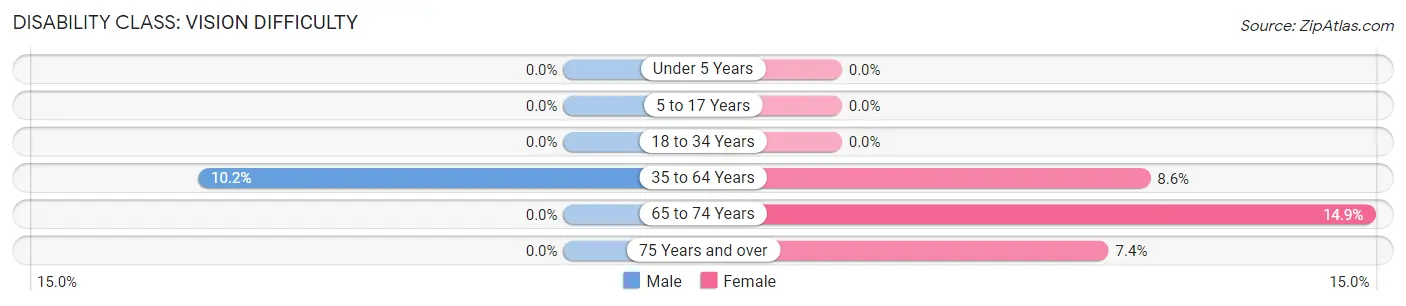
| Age Bracket | Male | Female |
| Under 5 Years | 0 (0.0%) | 0 (0.0%) |
| 5 to 17 Years | 0 (0.0%) | 0 (0.0%) |
| 18 to 34 Years | 0 (0.0%) | 0 (0.0%) |
| 35 to 64 Years | 78 (10.2%) | 50 (8.6%) |
| 65 to 74 Years | 0 (0.0%) | 30 (14.8%) |
| 75 Years and over | 0 (0.0%) | 13 (7.4%) |
Disability Class: Cognitive Difficulty
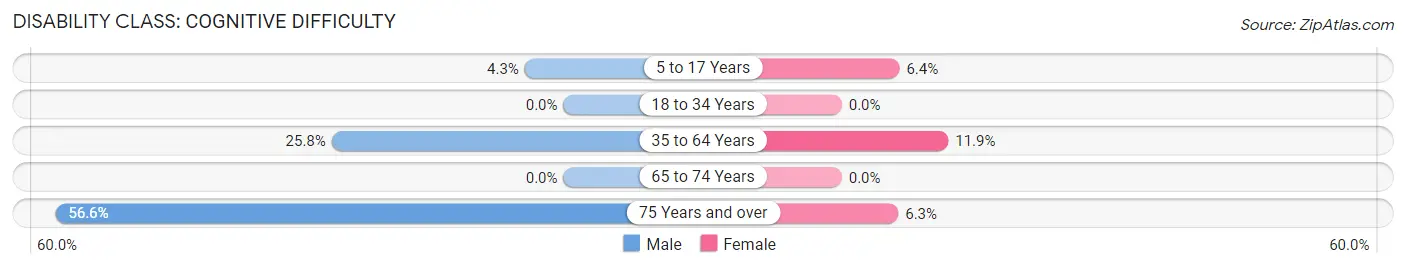
| Age Bracket | Male | Female |
| 5 to 17 Years | 10 (4.3%) | 24 (6.4%) |
| 18 to 34 Years | 0 (0.0%) | 0 (0.0%) |
| 35 to 64 Years | 198 (25.8%) | 69 (11.9%) |
| 65 to 74 Years | 0 (0.0%) | 0 (0.0%) |
| 75 Years and over | 56 (56.6%) | 11 (6.3%) |
Disability Class: Ambulatory Difficulty
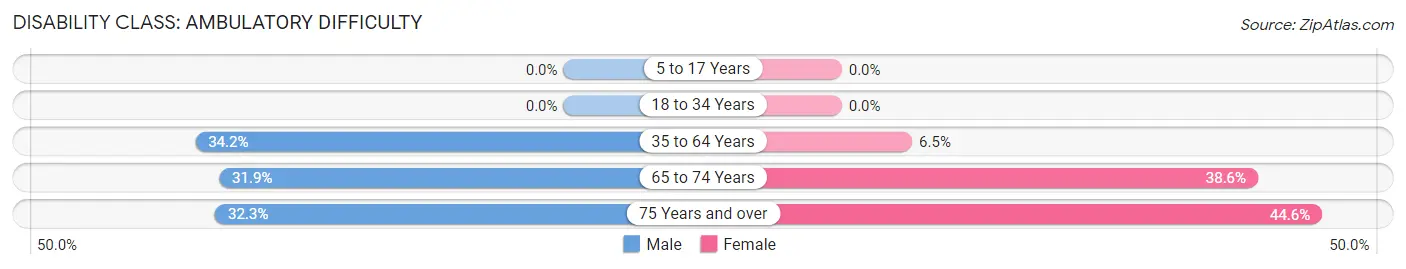
| Age Bracket | Male | Female |
| 5 to 17 Years | 0 (0.0%) | 0 (0.0%) |
| 18 to 34 Years | 0 (0.0%) | 0 (0.0%) |
| 35 to 64 Years | 262 (34.2%) | 38 (6.5%) |
| 65 to 74 Years | 69 (31.9%) | 78 (38.6%) |
| 75 Years and over | 32 (32.3%) | 78 (44.6%) |
Disability Class: Self-Care Difficulty
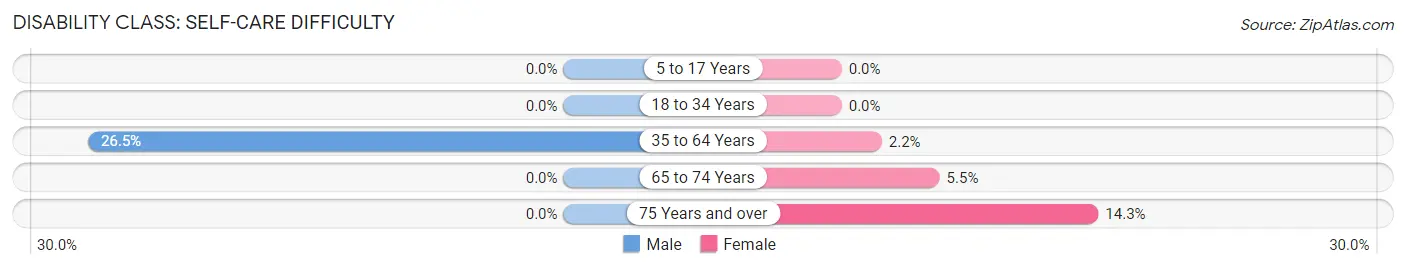
| Age Bracket | Male | Female |
| 5 to 17 Years | 0 (0.0%) | 0 (0.0%) |
| 18 to 34 Years | 0 (0.0%) | 0 (0.0%) |
| 35 to 64 Years | 203 (26.5%) | 13 (2.2%) |
| 65 to 74 Years | 0 (0.0%) | 11 (5.4%) |
| 75 Years and over | 0 (0.0%) | 25 (14.3%) |
Technology Access in Sale Creek
Computing Device Access in Sale Creek
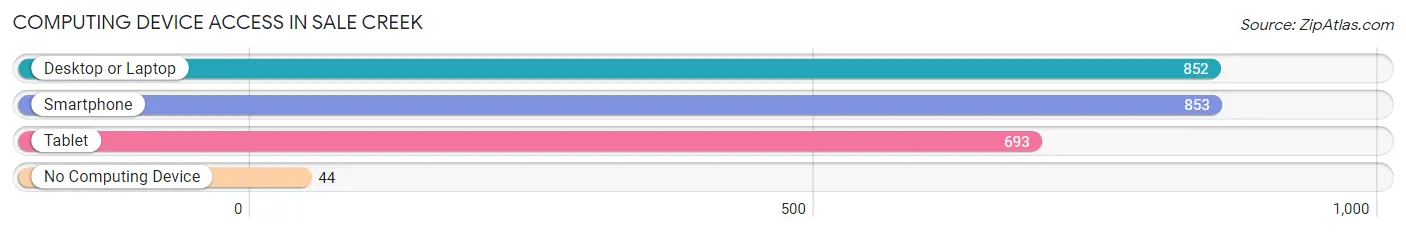
| Device Type | # Households | % Households |
| Desktop or Laptop | 852 | 83.0% |
| Smartphone | 853 | 83.1% |
| Tablet | 693 | 67.5% |
| No Computing Device | 44 | 4.3% |
| Total | 1,027 | 100.0% |
Internet Access in Sale Creek
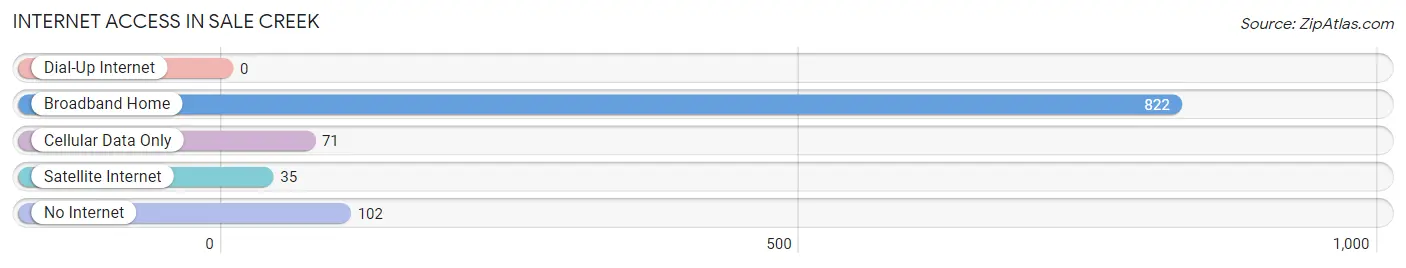
| Internet Type | # Households | % Households |
| Dial-Up Internet | 0 | 0.0% |
| Broadband Home | 822 | 80.0% |
| Cellular Data Only | 71 | 6.9% |
| Satellite Internet | 35 | 3.4% |
| No Internet | 102 | 9.9% |
| Total | 1,027 | 100.0% |
Sale Creek Summary
Sale Creek is an unincorporated community located in Hamilton County, Tennessee. It is situated along the Tennessee River, approximately 20 miles northeast of Chattanooga. The community is named after the creek that runs through it, which was named after a local Cherokee chief.
History
The area that is now Sale Creek was originally inhabited by the Cherokee Indians. The Cherokee were forced to leave the area in the late 1830s as part of the Indian Removal Act. The area was then settled by European-American settlers in the 1840s. The first post office in Sale Creek was established in 1848.
The community was originally known as “Sale’s Creek” after the local Cherokee chief, Sale. The name was eventually shortened to “Sale Creek”. The community was primarily an agricultural area, with many of the settlers growing cotton, corn, and other crops.
In the late 19th century, the area began to develop as a resort destination. The area was known for its natural beauty and was a popular spot for fishing and hunting. The area also became known for its mineral springs, which were believed to have healing properties.
Geography
Sale Creek is located in Hamilton County, Tennessee. It is situated along the Tennessee River, approximately 20 miles northeast of Chattanooga. The community is located in a rural area, with the nearest major city being Chattanooga.
The area is mostly flat, with some rolling hills. The terrain is mostly forested, with some open fields. The climate is humid subtropical, with hot summers and mild winters.
Economy
The economy of Sale Creek is primarily based on agriculture. The area is known for its production of cotton, corn, and other crops. The area is also known for its mineral springs, which are believed to have healing properties.
The area is also home to several small businesses, including restaurants, convenience stores, and gas stations. The area is also home to several churches and schools.
Demographics
As of the 2010 census, the population of Sale Creek was 1,845. The racial makeup of the community was 97.3% White, 0.7% African American, 0.3% Native American, 0.2% Asian, and 1.5% from other races.
The median household income in Sale Creek was $41,250, and the median family income was $45,625. The per capita income was $19,845. The poverty rate was 16.3%.
Conclusion
Sale Creek is an unincorporated community located in Hamilton County, Tennessee. It is situated along the Tennessee River, approximately 20 miles northeast of Chattanooga. The area was originally inhabited by the Cherokee Indians, and was later settled by European-American settlers in the 1840s. The economy of Sale Creek is primarily based on agriculture, with some small businesses and churches. As of the 2010 census, the population of Sale Creek was 1,845. The median household income in Sale Creek was $41,250, and the poverty rate was 16.3%.
Common Questions
What is Per Capita Income in Sale Creek?
Per Capita income in Sale Creek is $33,271.
What is the Median Family Income in Sale Creek?
Median Family Income in Sale Creek is $58,750.
What is the Median Household income in Sale Creek?
Median Household Income in Sale Creek is $53,827.
What is Income or Wage Gap in Sale Creek?
Income or Wage Gap in Sale Creek is 39.3%.
Women in Sale Creek earn 60.7 cents for every dollar earned by a man.
What is Inequality or Gini Index in Sale Creek?
Inequality or Gini Index in Sale Creek is 0.44.
What is the Total Population of Sale Creek?
Total Population of Sale Creek is 3,065.
What is the Total Male Population of Sale Creek?
Total Male Population of Sale Creek is 1,590.
What is the Total Female Population of Sale Creek?
Total Female Population of Sale Creek is 1,475.
What is the Ratio of Males per 100 Females in Sale Creek?
There are 107.80 Males per 100 Females in Sale Creek.
What is the Ratio of Females per 100 Males in Sale Creek?
There are 92.77 Females per 100 Males in Sale Creek.
What is the Median Population Age in Sale Creek?
Median Population Age in Sale Creek is 47.5 Years.
What is the Average Family Size in Sale Creek
Average Family Size in Sale Creek is 3.3 People.
What is the Average Household Size in Sale Creek
Average Household Size in Sale Creek is 3.0 People.
How Large is the Labor Force in Sale Creek?
There are 1,163 People in the Labor Forcein in Sale Creek.
What is the Percentage of People in the Labor Force in Sale Creek?
46.6% of People are in the Labor Force in Sale Creek.
What is the Unemployment Rate in Sale Creek?
Unemployment Rate in Sale Creek is 4.0%.