Castalian Springs, TN Map & Demographics
Castalian Springs Map
Castalian Springs Overview
$37,322
PER CAPITA INCOME
$112,609
AVG FAMILY INCOME
$81,016
AVG HOUSEHOLD INCOME
0.35
INEQUALITY / GINI INDEX
620
TOTAL POPULATION
300
MALE POPULATION
320
FEMALE POPULATION
93.75
MALES / 100 FEMALES
106.67
FEMALES / 100 MALES
45.0
MEDIAN AGE
3.0
AVG FAMILY SIZE
2.5
AVG HOUSEHOLD SIZE
346
LABOR FORCE [ PEOPLE ]
64.8%
PERCENT IN LABOR FORCE
Castalian Springs Zip Codes
Income in Castalian Springs
Income Overview in Castalian Springs
Per Capita Income in Castalian Springs is $37,322, while median incomes of families and households are $112,609 and $81,016 respectively.
| Characteristic | Number | Measure |
| Per Capita Income | 620 | $37,322 |
| Median Family Income | 180 | $112,609 |
| Mean Family Income | 180 | $103,554 |
| Median Household Income | 249 | $81,016 |
| Mean Household Income | 249 | $91,217 |
| Income Deficit | 180 | $0 |
| Wage / Income Gap (%) | 620 | 0.00% |
| Wage / Income Gap ($) | 620 | 100.00¢ per $1 |
| Gini / Inequality Index | 620 | 0.35 |
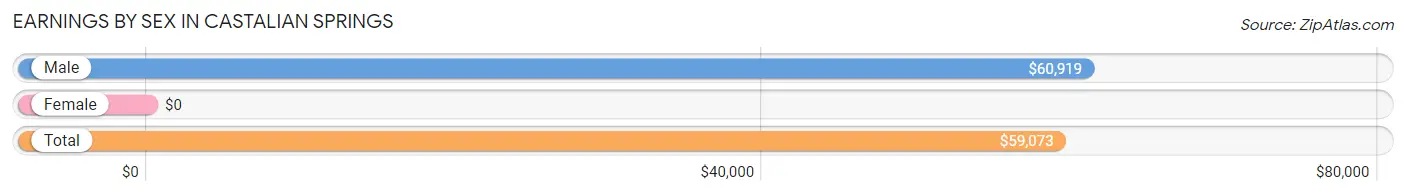
Earnings by Sex in Castalian Springs
| Sex | Number | Average Earnings |
| Male | 221 (59.6%) | $60,919 |
| Female | 150 (40.4%) | $0 |
| Total | 371 (100.0%) | $59,073 |
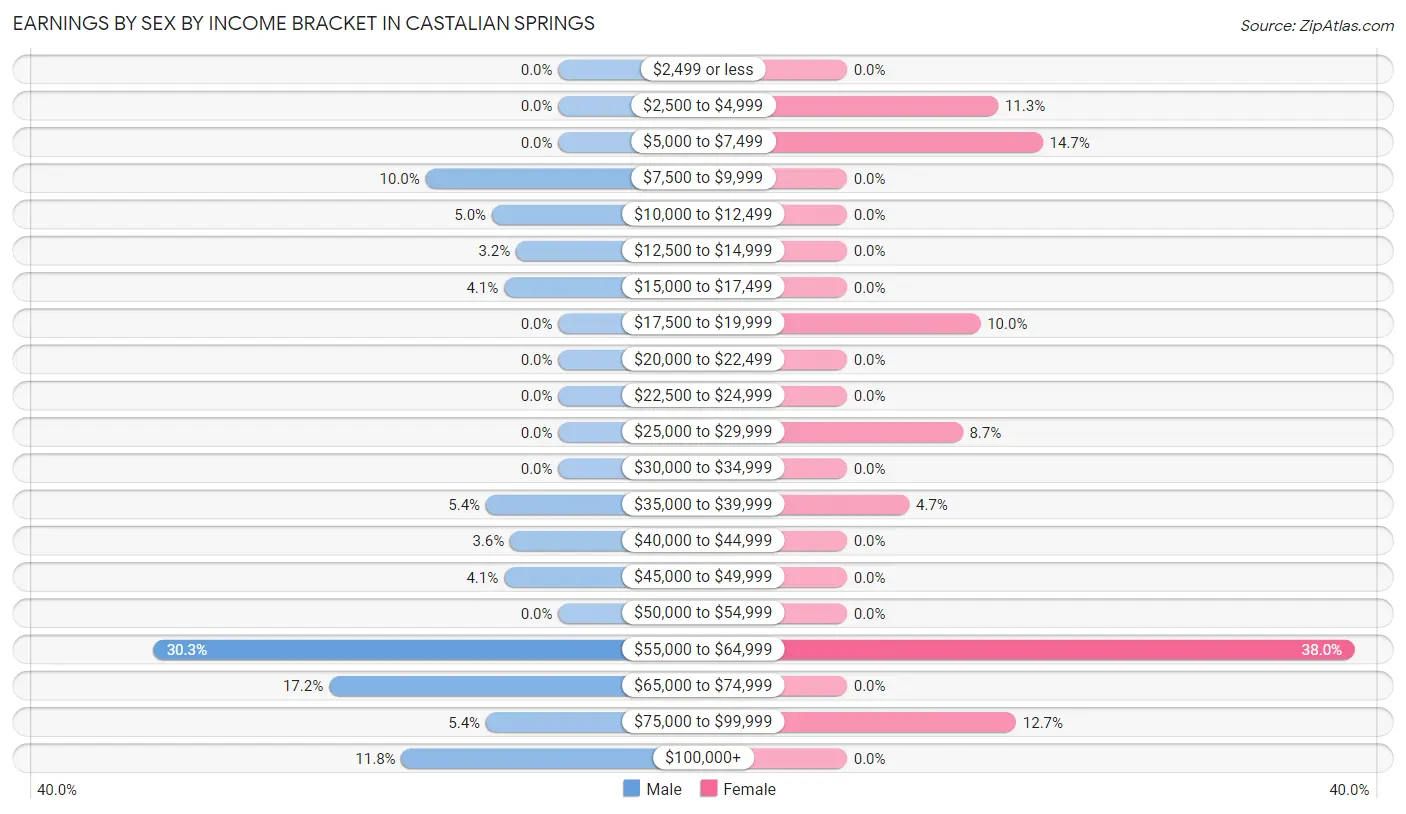
Earnings by Sex by Income Bracket in Castalian Springs
The most common earnings brackets in Castalian Springs are $55,000 to $64,999 for men (67 | 30.3%) and $55,000 to $64,999 for women (57 | 38.0%).
| Income | Male | Female |
| $2,499 or less | 0 (0.0%) | 0 (0.0%) |
| $2,500 to $4,999 | 0 (0.0%) | 17 (11.3%) |
| $5,000 to $7,499 | 0 (0.0%) | 22 (14.7%) |
| $7,500 to $9,999 | 22 (10.0%) | 0 (0.0%) |
| $10,000 to $12,499 | 11 (5.0%) | 0 (0.0%) |
| $12,500 to $14,999 | 7 (3.2%) | 0 (0.0%) |
| $15,000 to $17,499 | 9 (4.1%) | 0 (0.0%) |
| $17,500 to $19,999 | 0 (0.0%) | 15 (10.0%) |
| $20,000 to $22,499 | 0 (0.0%) | 0 (0.0%) |
| $22,500 to $24,999 | 0 (0.0%) | 0 (0.0%) |
| $25,000 to $29,999 | 0 (0.0%) | 13 (8.7%) |
| $30,000 to $34,999 | 0 (0.0%) | 0 (0.0%) |
| $35,000 to $39,999 | 12 (5.4%) | 7 (4.7%) |
| $40,000 to $44,999 | 8 (3.6%) | 0 (0.0%) |
| $45,000 to $49,999 | 9 (4.1%) | 0 (0.0%) |
| $50,000 to $54,999 | 0 (0.0%) | 0 (0.0%) |
| $55,000 to $64,999 | 67 (30.3%) | 57 (38.0%) |
| $65,000 to $74,999 | 38 (17.2%) | 0 (0.0%) |
| $75,000 to $99,999 | 12 (5.4%) | 19 (12.7%) |
| $100,000+ | 26 (11.8%) | 0 (0.0%) |
| Total | 221 (100.0%) | 150 (100.0%) |
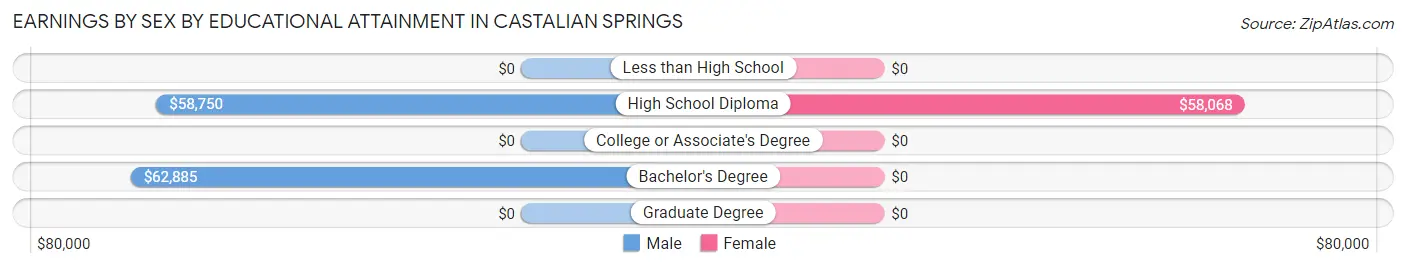
Earnings by Sex by Educational Attainment in Castalian Springs
Average earnings in Castalian Springs are $62,463 for men and $58,636 for women, a difference of 6.1%. Men with an educational attainment of bachelor's degree enjoy the highest average annual earnings of $62,885, while those with high school diploma education earn the least with $58,750. Women with an educational attainment of high school diploma earn the most with the average annual earnings of $58,068, while those with high school diploma education have the smallest earnings of $58,068.
| Educational Attainment | Male Income | Female Income |
| Less than High School | - | - |
| High School Diploma | $58,750 | $58,068 |
| College or Associate's Degree | - | - |
| Bachelor's Degree | $62,885 | $0 |
| Graduate Degree | - | - |
| Total | $62,463 | $58,636 |
Family Income in Castalian Springs
Family Income Brackets in Castalian Springs
According to the Castalian Springs family income data, there are 62 families falling into the $100,000 to $149,999 income range, which is the most common income bracket and makes up 34.4% of all families.
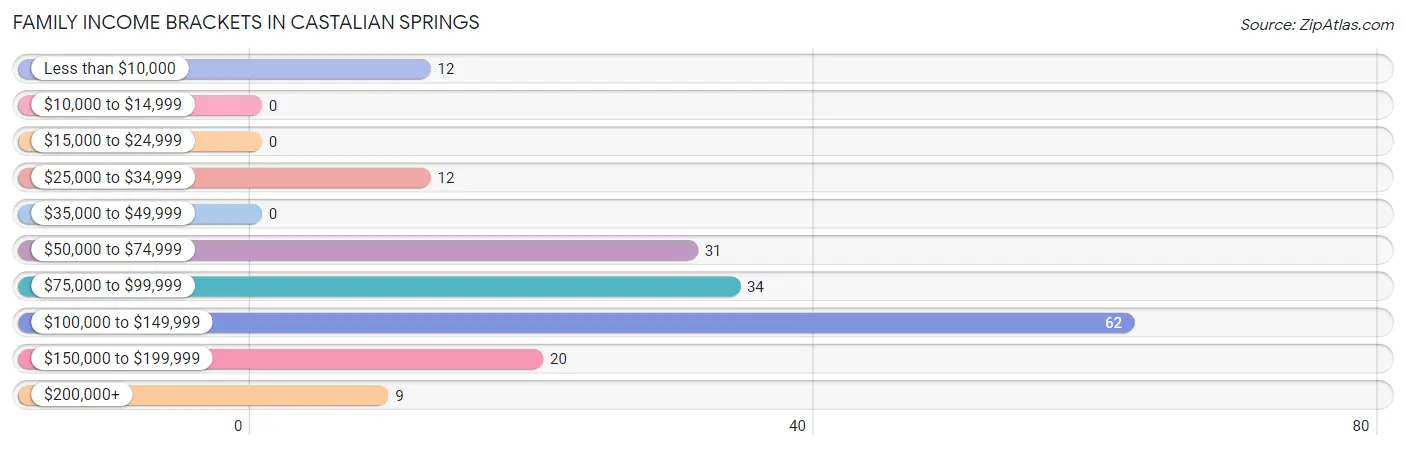
| Income Bracket | # Families | % Families |
| Less than $10,000 | 12 | 6.7% |
| $10,000 to $14,999 | 0 | 0.0% |
| $15,000 to $24,999 | 0 | 0.0% |
| $25,000 to $34,999 | 12 | 6.7% |
| $35,000 to $49,999 | 0 | 0.0% |
| $50,000 to $74,999 | 31 | 17.2% |
| $75,000 to $99,999 | 34 | 18.9% |
| $100,000 to $149,999 | 62 | 34.4% |
| $150,000 to $199,999 | 20 | 11.1% |
| $200,000+ | 9 | 5.0% |
Family Income by Famaliy Size in Castalian Springs
3-person families (89 | 49.4%) account for the highest median family income in Castalian Springs with $99,205 per family, while 3-person families (89 | 49.4%) have the highest median income of $33,068 per family member.
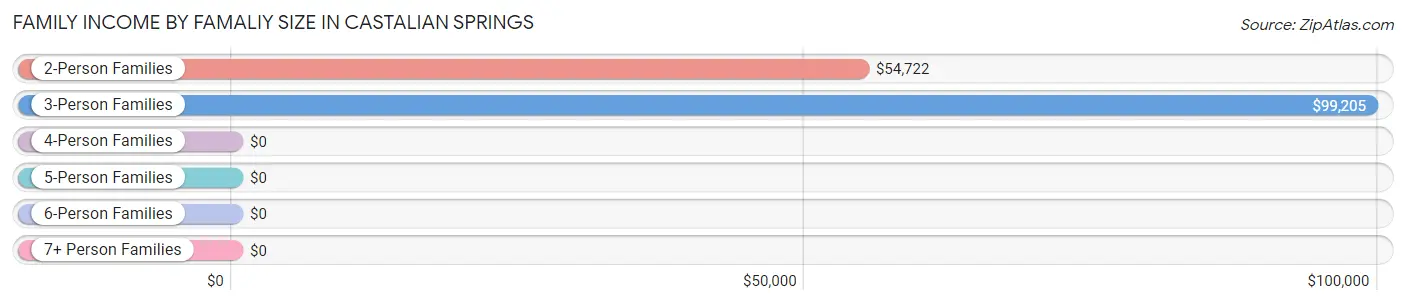
| Income Bracket | # Families | Median Income |
| 2-Person Families | 64 (35.6%) | $54,722 |
| 3-Person Families | 89 (49.4%) | $99,205 |
| 4-Person Families | 20 (11.1%) | $0 |
| 5-Person Families | 0 (0.0%) | $0 |
| 6-Person Families | 0 (0.0%) | $0 |
| 7+ Person Families | 7 (3.9%) | $0 |
| Total | 180 (100.0%) | $112,609 |
Family Income by Number of Earners in Castalian Springs
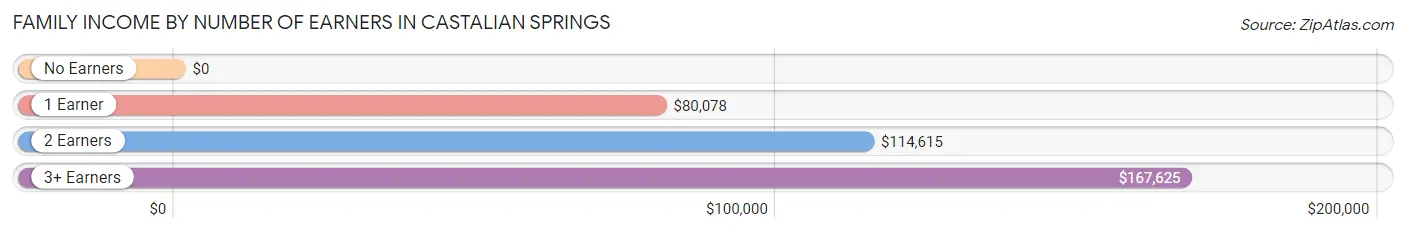
| Number of Earners | # Families | Median Income |
| No Earners | 10 (5.6%) | $0 |
| 1 Earner | 65 (36.1%) | $80,078 |
| 2 Earners | 68 (37.8%) | $114,615 |
| 3+ Earners | 37 (20.6%) | $167,625 |
| Total | 180 (100.0%) | $112,609 |
Household Income in Castalian Springs
Household Income Brackets in Castalian Springs
With 62 households falling in the category, the $100,000 to $149,999 income range is the most frequent in Castalian Springs, accounting for 24.9% of all households.
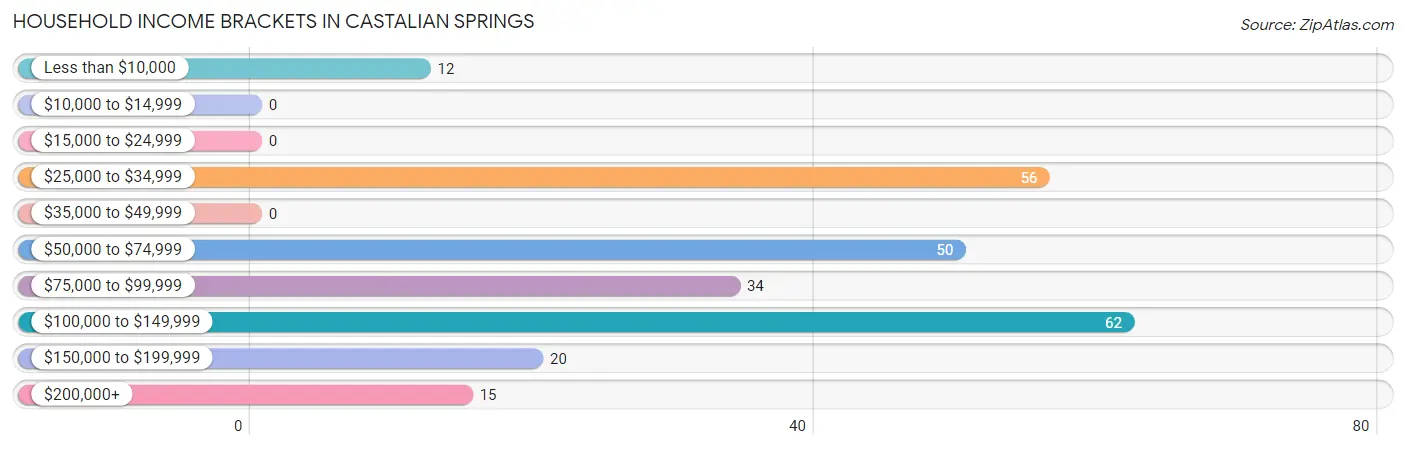
| Income Bracket | # Households | % Households |
| Less than $10,000 | 12 | 4.8% |
| $10,000 to $14,999 | 0 | 0.0% |
| $15,000 to $24,999 | 0 | 0.0% |
| $25,000 to $34,999 | 56 | 22.5% |
| $35,000 to $49,999 | 0 | 0.0% |
| $50,000 to $74,999 | 50 | 20.1% |
| $75,000 to $99,999 | 34 | 13.7% |
| $100,000 to $149,999 | 62 | 24.9% |
| $150,000 to $199,999 | 20 | 8.0% |
| $200,000+ | 15 | 6.0% |
Household Income by Householder Age in Castalian Springs
The median household income in Castalian Springs is $81,016, with the highest median household income of $120,078 found in the 45 to 64 years age bracket for the primary householder. A total of 126 households (50.6%) fall into this category.
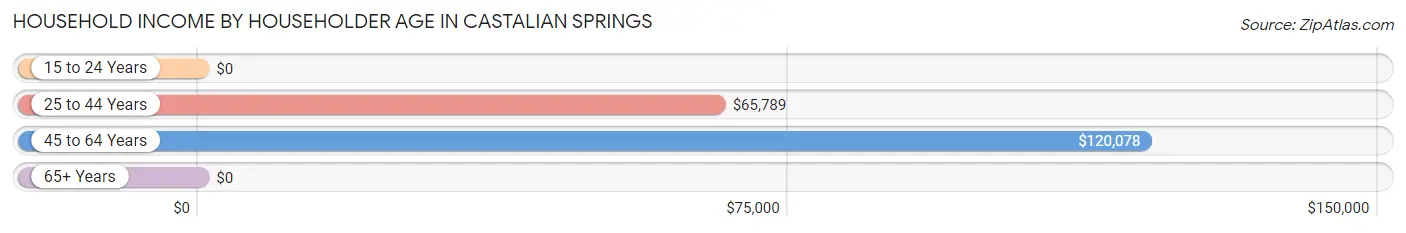
| Income Bracket | # Households | Median Income |
| 15 to 24 Years | 0 (0.0%) | $0 |
| 25 to 44 Years | 54 (21.7%) | $65,789 |
| 45 to 64 Years | 126 (50.6%) | $120,078 |
| 65+ Years | 69 (27.7%) | $0 |
| Total | 249 (100.0%) | $81,016 |
Poverty in Castalian Springs
Income Below Poverty by Sex and Age in Castalian Springs
With 2.7% poverty level for males and 8.1% for females among the residents of Castalian Springs, 55 to 64 year old males and 25 to 34 year old females are the most vulnerable to poverty, with 8 males (25.0%) and 12 females (26.1%) in their respective age groups living below the poverty level.
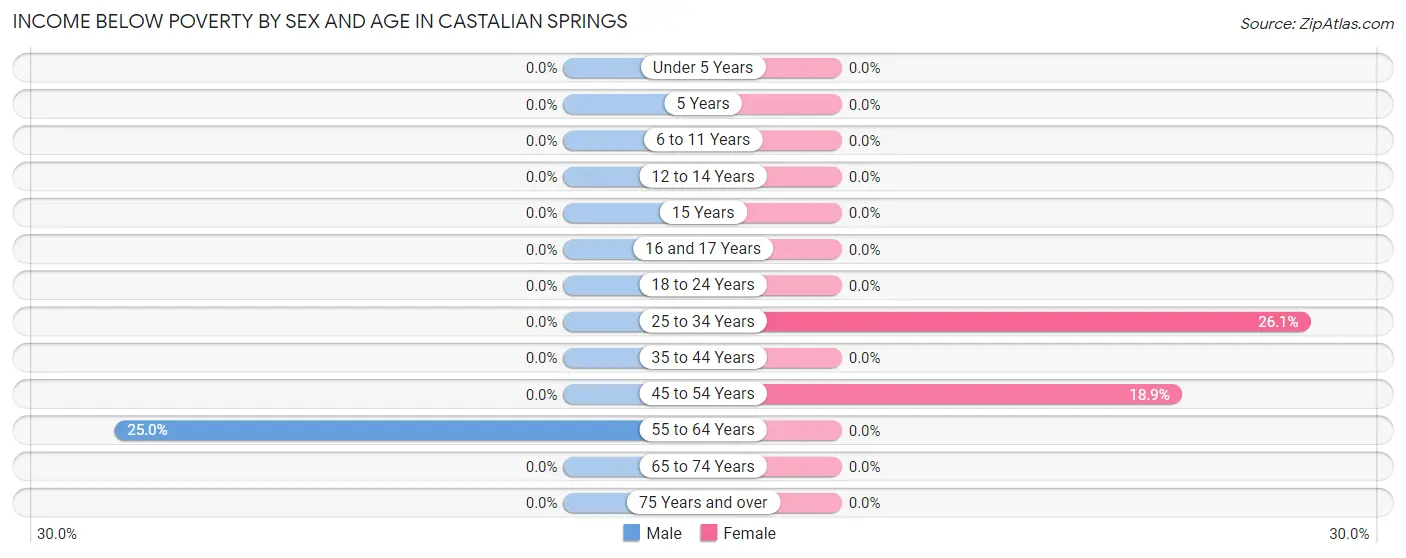
| Age Bracket | Male | Female |
| Under 5 Years | 0 (0.0%) | 0 (0.0%) |
| 5 Years | 0 (0.0%) | 0 (0.0%) |
| 6 to 11 Years | 0 (0.0%) | 0 (0.0%) |
| 12 to 14 Years | 0 (0.0%) | 0 (0.0%) |
| 15 Years | 0 (0.0%) | 0 (0.0%) |
| 16 and 17 Years | 0 (0.0%) | 0 (0.0%) |
| 18 to 24 Years | 0 (0.0%) | 0 (0.0%) |
| 25 to 34 Years | 0 (0.0%) | 12 (26.1%) |
| 35 to 44 Years | 0 (0.0%) | 0 (0.0%) |
| 45 to 54 Years | 0 (0.0%) | 14 (18.9%) |
| 55 to 64 Years | 8 (25.0%) | 0 (0.0%) |
| 65 to 74 Years | 0 (0.0%) | 0 (0.0%) |
| 75 Years and over | 0 (0.0%) | 0 (0.0%) |
| Total | 8 (2.7%) | 26 (8.1%) |
Income Above Poverty by Sex and Age in Castalian Springs
According to the poverty statistics in Castalian Springs, males aged 6 to 11 years and females aged under 5 years are the age groups that are most secure financially, with 100.0% of males and 100.0% of females in these age groups living above the poverty line.
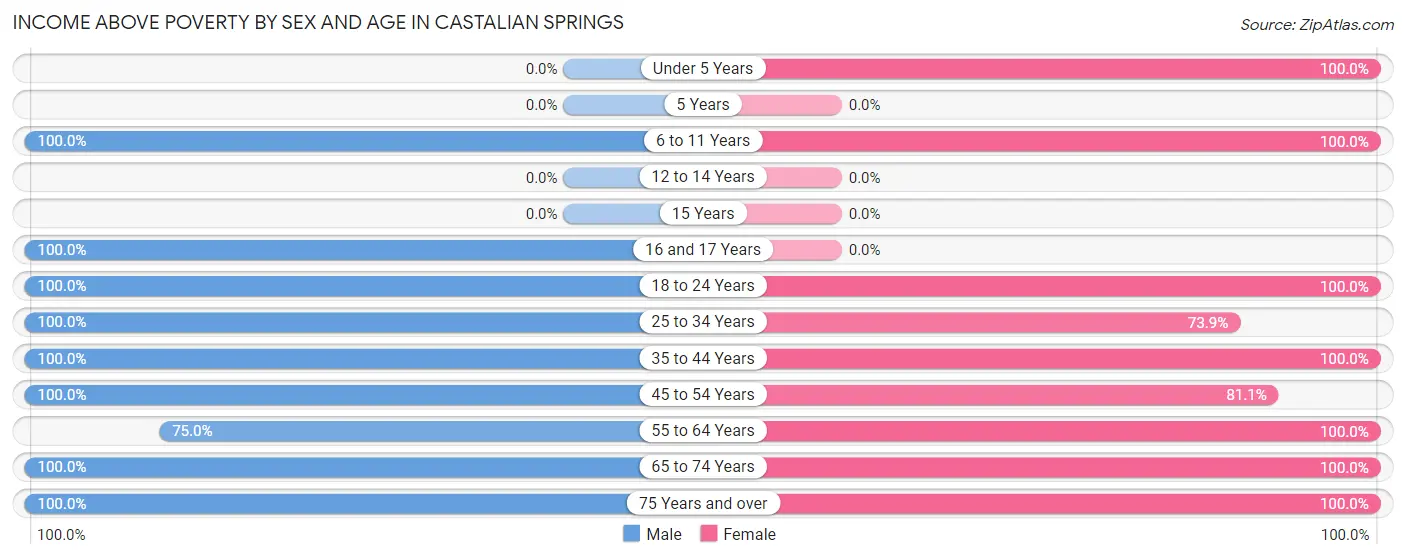
| Age Bracket | Male | Female |
| Under 5 Years | 0 (0.0%) | 26 (100.0%) |
| 5 Years | 0 (0.0%) | 0 (0.0%) |
| 6 to 11 Years | 17 (100.0%) | 43 (100.0%) |
| 12 to 14 Years | 0 (0.0%) | 0 (0.0%) |
| 15 Years | 0 (0.0%) | 0 (0.0%) |
| 16 and 17 Years | 23 (100.0%) | 0 (0.0%) |
| 18 to 24 Years | 19 (100.0%) | 36 (100.0%) |
| 25 to 34 Years | 28 (100.0%) | 34 (73.9%) |
| 35 to 44 Years | 36 (100.0%) | 37 (100.0%) |
| 45 to 54 Years | 86 (100.0%) | 60 (81.1%) |
| 55 to 64 Years | 24 (75.0%) | 21 (100.0%) |
| 65 to 74 Years | 41 (100.0%) | 18 (100.0%) |
| 75 Years and over | 18 (100.0%) | 19 (100.0%) |
| Total | 292 (97.3%) | 294 (91.9%) |
Income Below Poverty Among Married-Couple Families in Castalian Springs
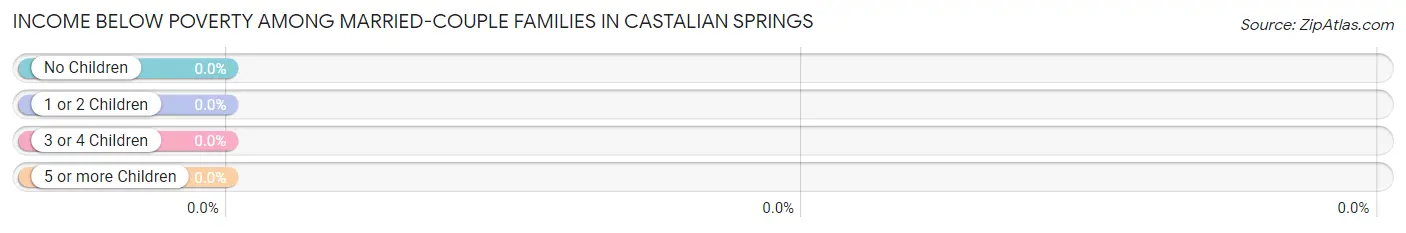
| Children | Above Poverty | Below Poverty |
| No Children | 77 (100.0%) | 0 (0.0%) |
| 1 or 2 Children | 56 (100.0%) | 0 (0.0%) |
| 3 or 4 Children | 7 (100.0%) | 0 (0.0%) |
| 5 or more Children | 0 (0.0%) | 0 (0.0%) |
| Total | 140 (100.0%) | 0 (0.0%) |
Income Below Poverty Among Single-Parent Households in Castalian Springs
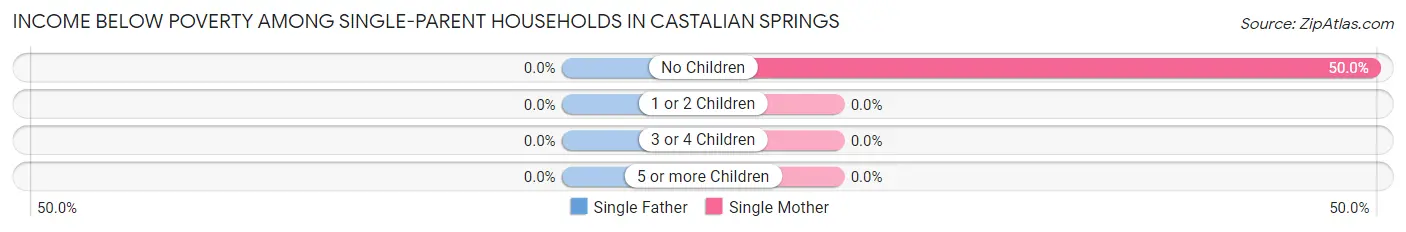
| Children | Single Father | Single Mother |
| No Children | 0 (0.0%) | 12 (50.0%) |
| 1 or 2 Children | 0 (0.0%) | 0 (0.0%) |
| 3 or 4 Children | 0 (0.0%) | 0 (0.0%) |
| 5 or more Children | 0 (0.0%) | 0 (0.0%) |
| Total | 0 (0.0%) | 12 (50.0%) |
Income Below Poverty Among Married-Couple vs Single-Parent Households in Castalian Springs
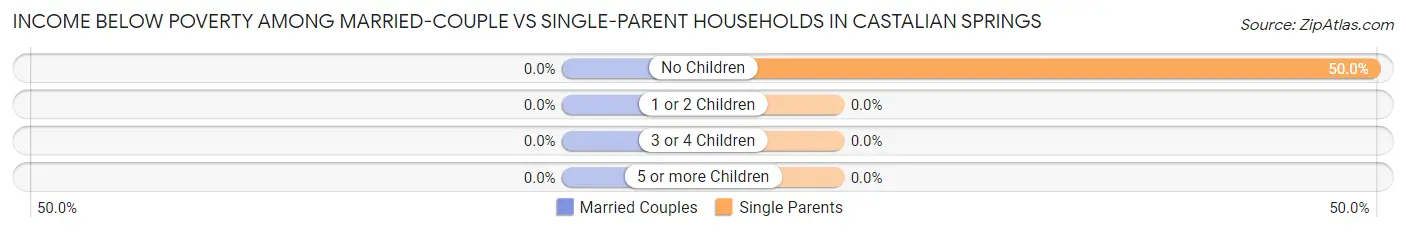
| Children | Married-Couple Families | Single-Parent Households |
| No Children | 0 (0.0%) | 12 (50.0%) |
| 1 or 2 Children | 0 (0.0%) | 0 (0.0%) |
| 3 or 4 Children | 0 (0.0%) | 0 (0.0%) |
| 5 or more Children | 0 (0.0%) | 0 (0.0%) |
| Total | 0 (0.0%) | 12 (30.0%) |
Race in Castalian Springs
The most populous races in Castalian Springs are White / Caucasian (584 | 94.2%), and Two or more Races (36 | 5.8%).
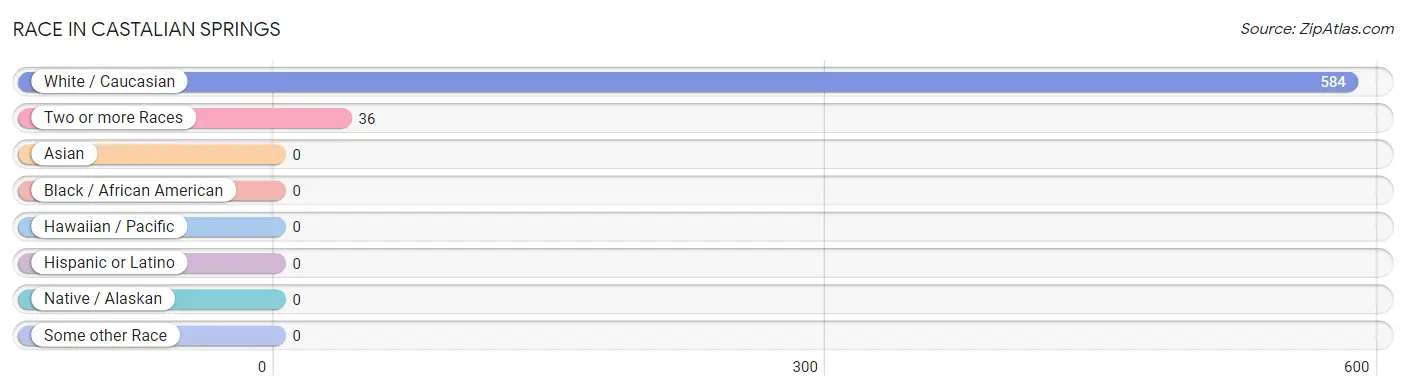
| Race | # Population | % Population |
| Asian | 0 | 0.0% |
| Black / African American | 0 | 0.0% |
| Hawaiian / Pacific | 0 | 0.0% |
| Hispanic or Latino | 0 | 0.0% |
| Native / Alaskan | 0 | 0.0% |
| White / Caucasian | 584 | 94.2% |
| Two or more Races | 36 | 5.8% |
| Some other Race | 0 | 0.0% |
| Total | 620 | 100.0% |
Ancestry in Castalian Springs
The most populous ancestries reported in Castalian Springs are American (271 | 43.7%), English (92 | 14.8%), Irish (77 | 12.4%), German (70 | 11.3%), and Italian (26 | 4.2%), together accounting for 86.5% of all Castalian Springs residents.
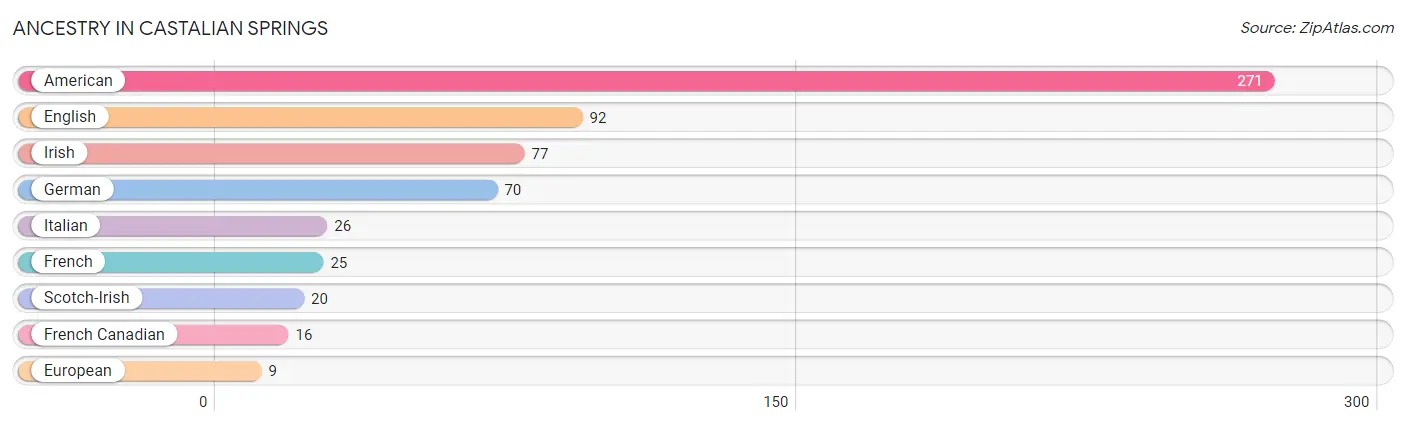
| Ancestry | # Population | % Population |
| American | 271 | 43.7% |
| English | 92 | 14.8% |
| European | 9 | 1.5% |
| French | 25 | 4.0% |
| French Canadian | 16 | 2.6% |
| German | 70 | 11.3% |
| Irish | 77 | 12.4% |
| Italian | 26 | 4.2% |
| Scotch-Irish | 20 | 3.2% | View All 9 Rows |
Immigrants in Castalian Springs

| Immigration Origin | # Population | % Population | View All 0 Rows |
Sex and Age in Castalian Springs
Sex and Age in Castalian Springs
The most populous age groups in Castalian Springs are 45 to 49 Years (70 | 23.3%) for men and 45 to 49 Years (53 | 16.6%) for women.
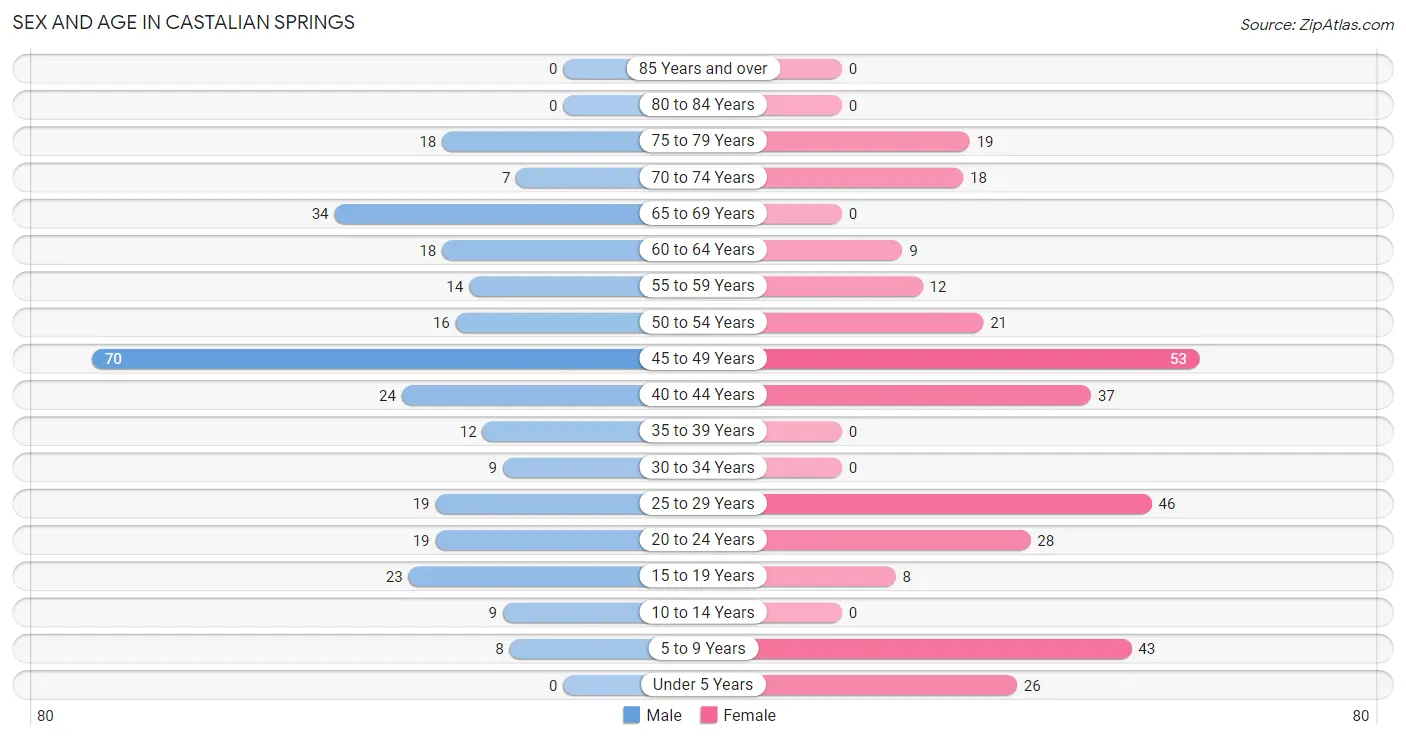
| Age Bracket | Male | Female |
| Under 5 Years | 0 (0.0%) | 26 (8.1%) |
| 5 to 9 Years | 8 (2.7%) | 43 (13.4%) |
| 10 to 14 Years | 9 (3.0%) | 0 (0.0%) |
| 15 to 19 Years | 23 (7.7%) | 8 (2.5%) |
| 20 to 24 Years | 19 (6.3%) | 28 (8.7%) |
| 25 to 29 Years | 19 (6.3%) | 46 (14.4%) |
| 30 to 34 Years | 9 (3.0%) | 0 (0.0%) |
| 35 to 39 Years | 12 (4.0%) | 0 (0.0%) |
| 40 to 44 Years | 24 (8.0%) | 37 (11.6%) |
| 45 to 49 Years | 70 (23.3%) | 53 (16.6%) |
| 50 to 54 Years | 16 (5.3%) | 21 (6.6%) |
| 55 to 59 Years | 14 (4.7%) | 12 (3.7%) |
| 60 to 64 Years | 18 (6.0%) | 9 (2.8%) |
| 65 to 69 Years | 34 (11.3%) | 0 (0.0%) |
| 70 to 74 Years | 7 (2.3%) | 18 (5.6%) |
| 75 to 79 Years | 18 (6.0%) | 19 (5.9%) |
| 80 to 84 Years | 0 (0.0%) | 0 (0.0%) |
| 85 Years and over | 0 (0.0%) | 0 (0.0%) |
| Total | 300 (100.0%) | 320 (100.0%) |
Families and Households in Castalian Springs
Median Family Size in Castalian Springs
The median family size in Castalian Springs is 3.02 persons per family, with married-couple families (140 | 77.8%) accounting for the largest median family size of 3.15 persons per family. On the other hand, single female/mother families (24 | 13.3%) represent the smallest median family size with 2.21 persons per family.
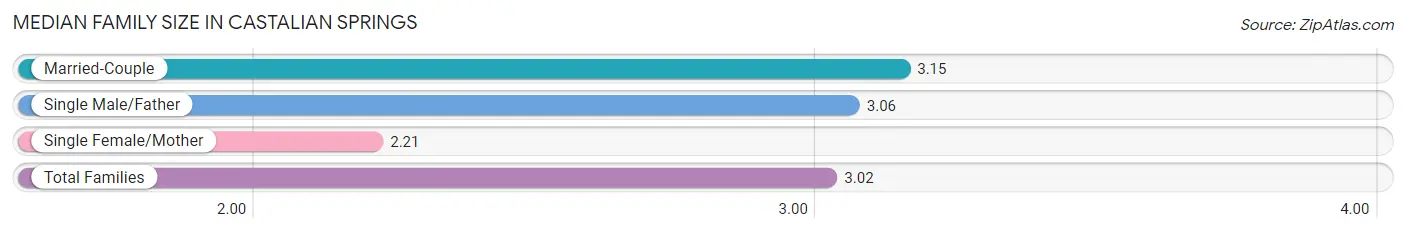
| Family Type | # Families | Family Size |
| Married-Couple | 140 (77.8%) | 3.15 |
| Single Male/Father | 16 (8.9%) | 3.06 |
| Single Female/Mother | 24 (13.3%) | 2.21 |
| Total Families | 180 (100.0%) | 3.02 |
Median Household Size in Castalian Springs
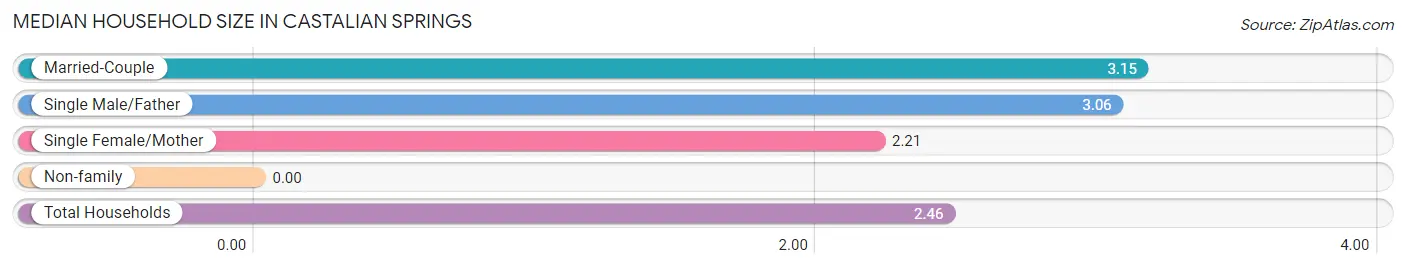
| Household Type | # Households | Household Size |
| Married-Couple | 140 (56.2%) | 3.15 |
| Single Male/Father | 16 (6.4%) | 3.06 |
| Single Female/Mother | 24 (9.6%) | 2.21 |
| Non-family | 69 (27.7%) | - |
| Total Households | 249 (100.0%) | 2.46 |
Household Size by Marriage Status in Castalian Springs
Out of a total of 249 households in Castalian Springs, 180 (72.3%) are family households, while 69 (27.7%) are nonfamily households. The most numerous type of family households are 3-person households, comprising 89, and the most common type of nonfamily households are 1-person households, comprising 69.
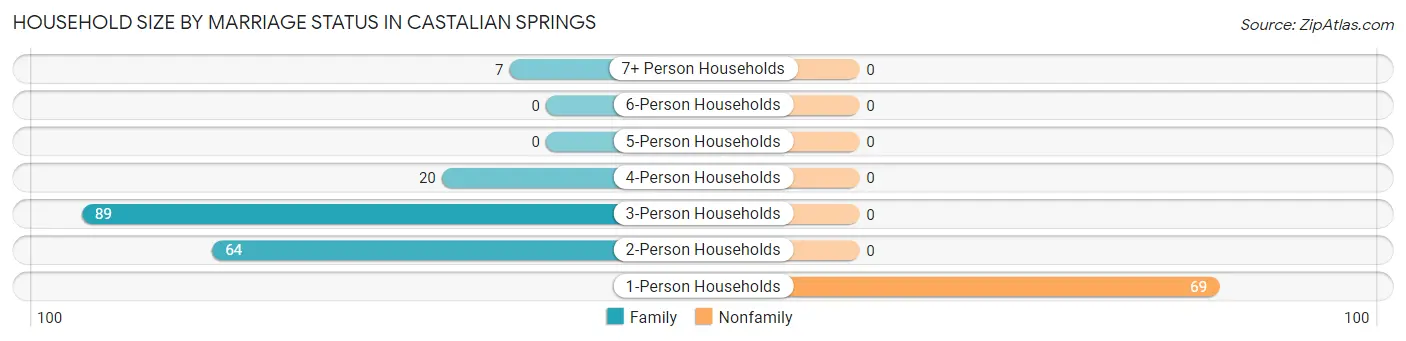
| Household Size | Family Households | Nonfamily Households |
| 1-Person Households | - | 69 (27.7%) |
| 2-Person Households | 64 (25.7%) | 0 (0.0%) |
| 3-Person Households | 89 (35.7%) | 0 (0.0%) |
| 4-Person Households | 20 (8.0%) | 0 (0.0%) |
| 5-Person Households | 0 (0.0%) | 0 (0.0%) |
| 6-Person Households | 0 (0.0%) | 0 (0.0%) |
| 7+ Person Households | 7 (2.8%) | 0 (0.0%) |
| Total | 180 (72.3%) | 69 (27.7%) |
Female Fertility in Castalian Springs
Fertility by Age in Castalian Springs
| Age Bracket | Women with Births | Births / 1,000 Women |
| 15 to 19 years | 0 (0.0%) | 0.0 |
| 20 to 34 years | 0 (0.0%) | 0.0 |
| 35 to 50 years | 0 (0.0%) | 0.0 |
| Total | 0 (0.0%) | 0.0 |
Fertility by Age by Marriage Status in Castalian Springs
| Age Bracket | Married | Unmarried |
| 15 to 19 years | 0 (0.0%) | 0 (0.0%) |
| 20 to 34 years | 0 (0.0%) | 0 (0.0%) |
| 35 to 50 years | 0 (0.0%) | 0 (0.0%) |
| Total | 0 (0.0%) | 0 (0.0%) |
Fertility by Education in Castalian Springs
| Educational Attainment | Women with Births | Births / 1,000 Women |
| Less than High School | 0 (0.0%) | 0.0 |
| High School Diploma | 0 (0.0%) | 0.0 |
| College or Associate's Degree | 0 (0.0%) | 0.0 |
| Bachelor's Degree | 0 (0.0%) | 0.0 |
| Graduate Degree | 0 (0.0%) | 0.0 |
| Total | 0 (0.0%) | 0.0 |
Fertility by Education by Marriage Status in Castalian Springs
| Educational Attainment | Married | Unmarried |
| Less than High School | 0 (0.0%) | 0 (0.0%) |
| High School Diploma | 0 (0.0%) | 0 (0.0%) |
| College or Associate's Degree | 0 (0.0%) | 0 (0.0%) |
| Bachelor's Degree | 0 (0.0%) | 0 (0.0%) |
| Graduate Degree | 0 (0.0%) | 0 (0.0%) |
| Total | 0 (0.0%) | 0 (0.0%) |
Employment Characteristics in Castalian Springs
Employment by Class of Employer in Castalian Springs
Among the 346 employed individuals in Castalian Springs, private company employees (195 | 56.4%), local government employees (105 | 30.3%), and state government employees (20 | 5.8%) make up the most common classes of employment.
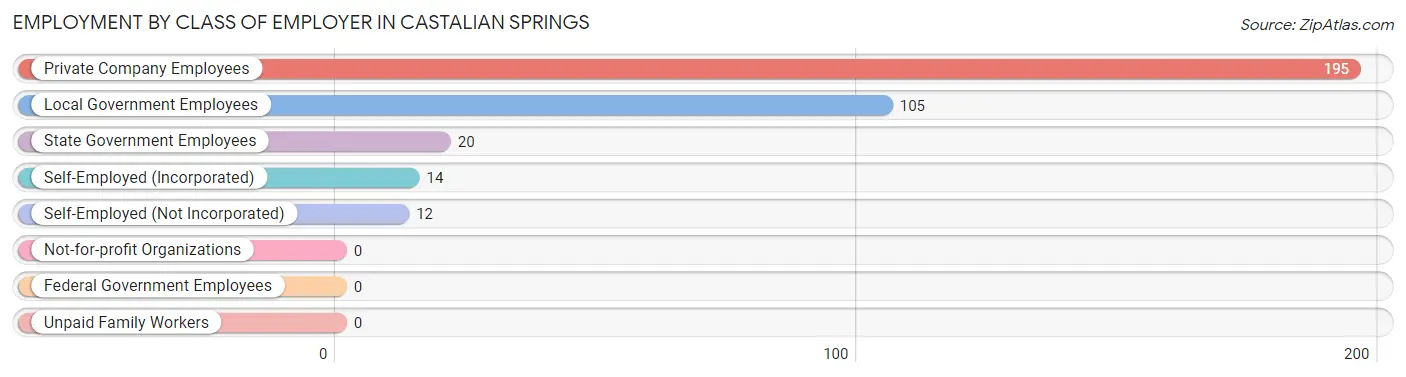
| Employer Class | # Employees | % Employees |
| Private Company Employees | 195 | 56.4% |
| Self-Employed (Incorporated) | 14 | 4.1% |
| Self-Employed (Not Incorporated) | 12 | 3.5% |
| Not-for-profit Organizations | 0 | 0.0% |
| Local Government Employees | 105 | 30.3% |
| State Government Employees | 20 | 5.8% |
| Federal Government Employees | 0 | 0.0% |
| Unpaid Family Workers | 0 | 0.0% |
| Total | 346 | 100.0% |
Employment Status by Age in Castalian Springs
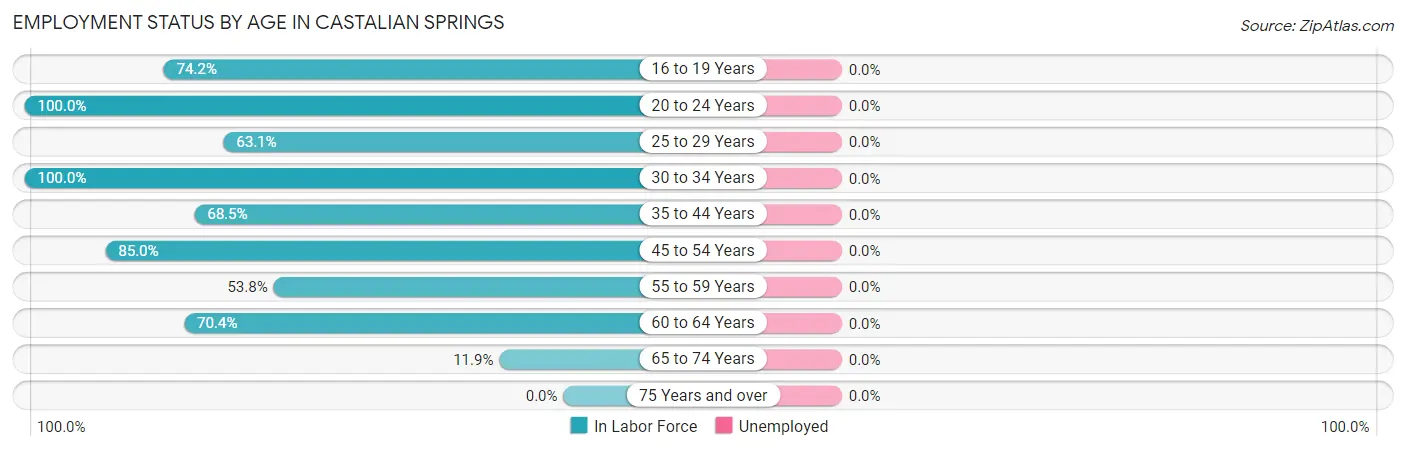
| Age Bracket | In Labor Force | Unemployed |
| 16 to 19 Years | 23 (74.2%) | 0 (0.0%) |
| 20 to 24 Years | 47 (100.0%) | 0 (0.0%) |
| 25 to 29 Years | 41 (63.1%) | 0 (0.0%) |
| 30 to 34 Years | 9 (100.0%) | 0 (0.0%) |
| 35 to 44 Years | 50 (68.5%) | 0 (0.0%) |
| 45 to 54 Years | 136 (85.0%) | 0 (0.0%) |
| 55 to 59 Years | 14 (53.8%) | 0 (0.0%) |
| 60 to 64 Years | 19 (70.4%) | 0 (0.0%) |
| 65 to 74 Years | 7 (11.9%) | 0 (0.0%) |
| 75 Years and over | 0 (0.0%) | 0 (0.0%) |
| Total | 346 (64.8%) | 0 (0.0%) |
Employment Status by Educational Attainment in Castalian Springs
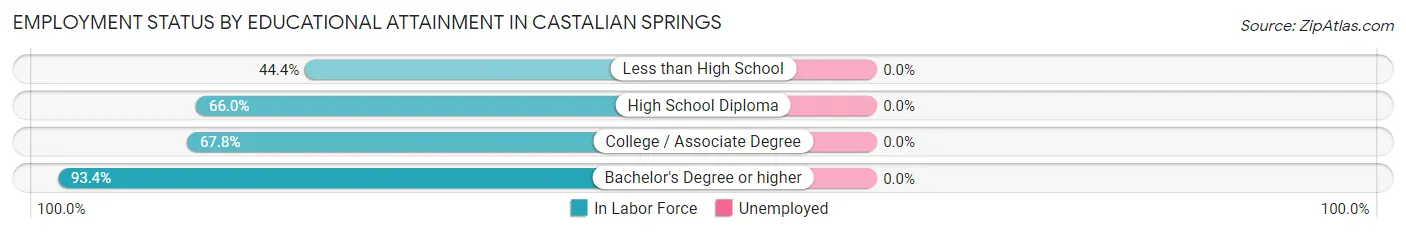
| Educational Attainment | In Labor Force | Unemployed |
| Less than High School | 16 (44.4%) | 0 (0.0%) |
| High School Diploma | 66 (66.0%) | 0 (0.0%) |
| College / Associate Degree | 59 (67.8%) | 0 (0.0%) |
| Bachelor's Degree or higher | 128 (93.4%) | 0 (0.0%) |
| Total | 269 (74.7%) | 0 (0.0%) |
Employment Occupations by Sex in Castalian Springs
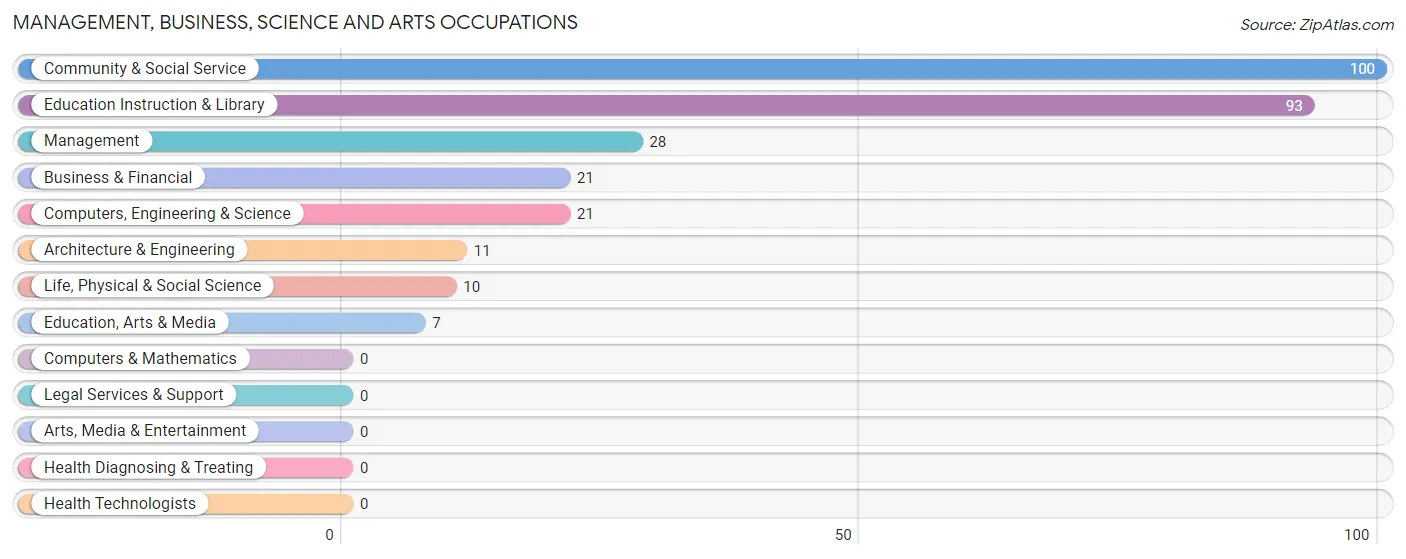
Management, Business, Science and Arts Occupations
The most common Management, Business, Science and Arts occupations in Castalian Springs are Community & Social Service (100 | 28.9%), Education Instruction & Library (93 | 26.9%), Management (28 | 8.1%), Business & Financial (21 | 6.1%), and Computers, Engineering & Science (21 | 6.1%).
Management, Business, Science and Arts Occupations by Sex
Within the Management, Business, Science and Arts occupations in Castalian Springs, the most male-oriented occupations are Business & Financial (100.0%), Computers, Engineering & Science (100.0%), and Architecture & Engineering (100.0%), while the most female-oriented occupations are Education, Arts & Media (100.0%), Community & Social Service (53.0%), and Education Instruction & Library (49.5%).
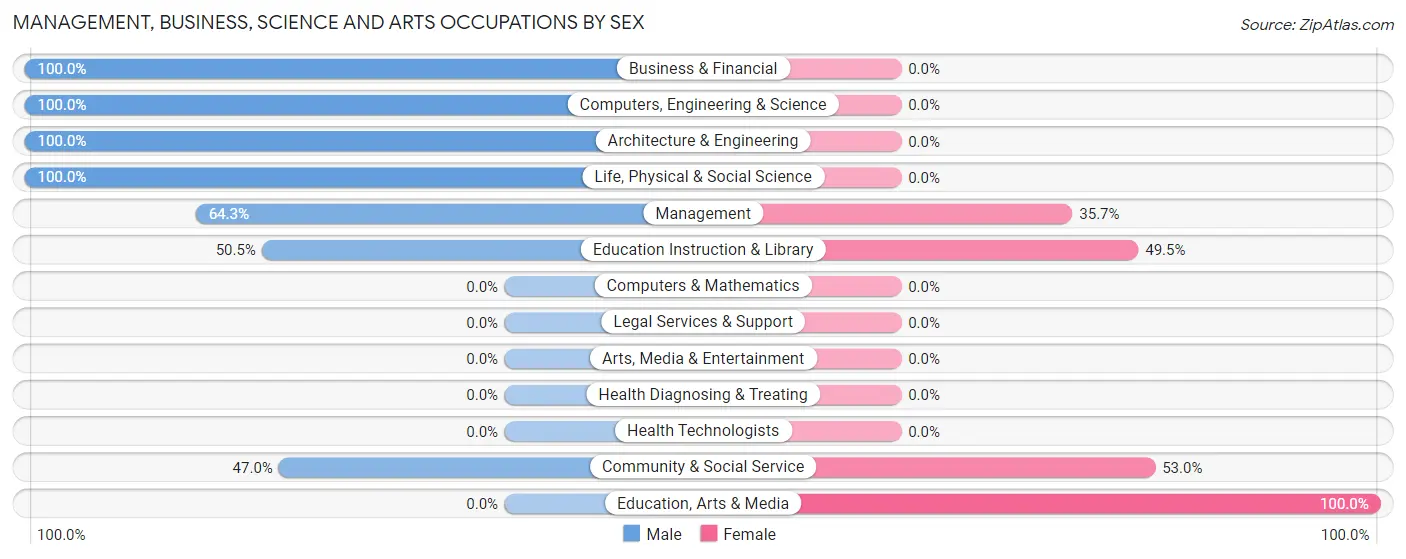
| Occupation | Male | Female |
| Management | 18 (64.3%) | 10 (35.7%) |
| Business & Financial | 21 (100.0%) | 0 (0.0%) |
| Computers, Engineering & Science | 21 (100.0%) | 0 (0.0%) |
| Computers & Mathematics | 0 (0.0%) | 0 (0.0%) |
| Architecture & Engineering | 11 (100.0%) | 0 (0.0%) |
| Life, Physical & Social Science | 10 (100.0%) | 0 (0.0%) |
| Community & Social Service | 47 (47.0%) | 53 (53.0%) |
| Education, Arts & Media | 0 (0.0%) | 7 (100.0%) |
| Legal Services & Support | 0 (0.0%) | 0 (0.0%) |
| Education Instruction & Library | 47 (50.5%) | 46 (49.5%) |
| Arts, Media & Entertainment | 0 (0.0%) | 0 (0.0%) |
| Health Diagnosing & Treating | 0 (0.0%) | 0 (0.0%) |
| Health Technologists | 0 (0.0%) | 0 (0.0%) |
| Total (Category) | 107 (62.9%) | 63 (37.1%) |
| Total (Overall) | 213 (61.6%) | 133 (38.4%) |
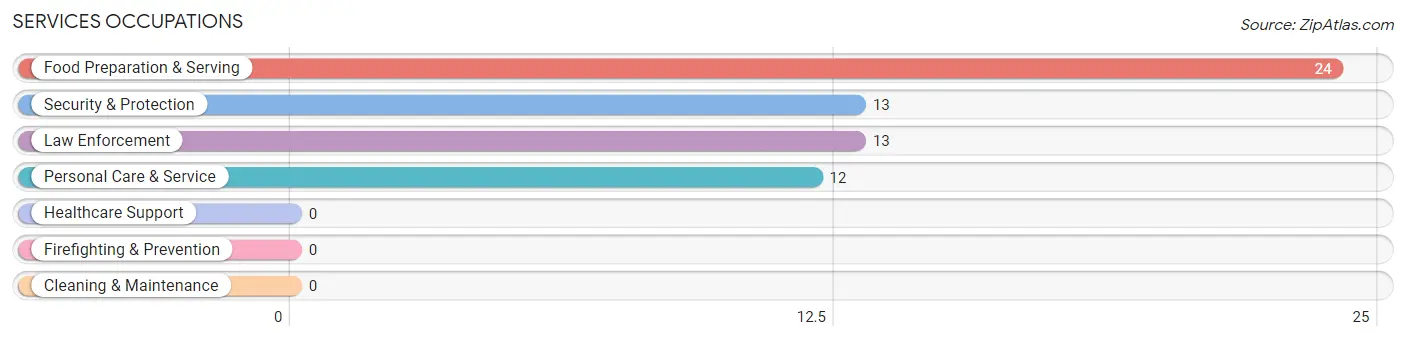
Services Occupations
The most common Services occupations in Castalian Springs are Food Preparation & Serving (24 | 6.9%), Security & Protection (13 | 3.8%), Law Enforcement (13 | 3.8%), and Personal Care & Service (12 | 3.5%).
Services Occupations by Sex
Within the Services occupations in Castalian Springs, the most male-oriented occupations are Security & Protection (100.0%), Law Enforcement (100.0%), and Food Preparation & Serving (37.5%), while the most female-oriented occupations are Personal Care & Service (100.0%), and Food Preparation & Serving (62.5%).
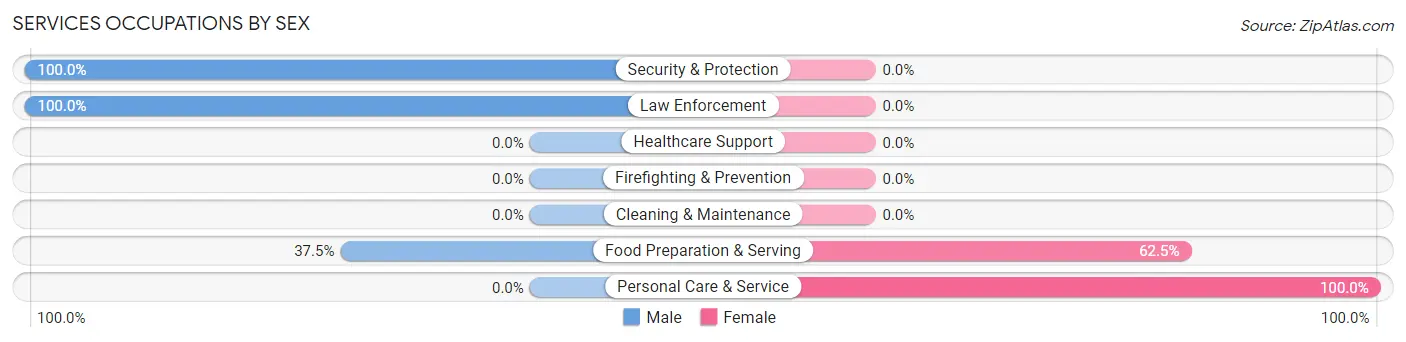
| Occupation | Male | Female |
| Healthcare Support | 0 (0.0%) | 0 (0.0%) |
| Security & Protection | 13 (100.0%) | 0 (0.0%) |
| Firefighting & Prevention | 0 (0.0%) | 0 (0.0%) |
| Law Enforcement | 13 (100.0%) | 0 (0.0%) |
| Food Preparation & Serving | 9 (37.5%) | 15 (62.5%) |
| Cleaning & Maintenance | 0 (0.0%) | 0 (0.0%) |
| Personal Care & Service | 0 (0.0%) | 12 (100.0%) |
| Total (Category) | 22 (44.9%) | 27 (55.1%) |
| Total (Overall) | 213 (61.6%) | 133 (38.4%) |
Sales and Office Occupations
The most common Sales and Office occupations in Castalian Springs are Office & Administration (51 | 14.7%), and Sales & Related (32 | 9.2%).

Sales and Office Occupations by Sex

| Occupation | Male | Female |
| Sales & Related | 19 (59.4%) | 13 (40.6%) |
| Office & Administration | 21 (41.2%) | 30 (58.8%) |
| Total (Category) | 40 (48.2%) | 43 (51.8%) |
| Total (Overall) | 213 (61.6%) | 133 (38.4%) |
Natural Resources, Construction and Maintenance Occupations
The most common Natural Resources, Construction and Maintenance occupations in Castalian Springs are , and Installation, Maintenance & Repair (3 | 0.9%).
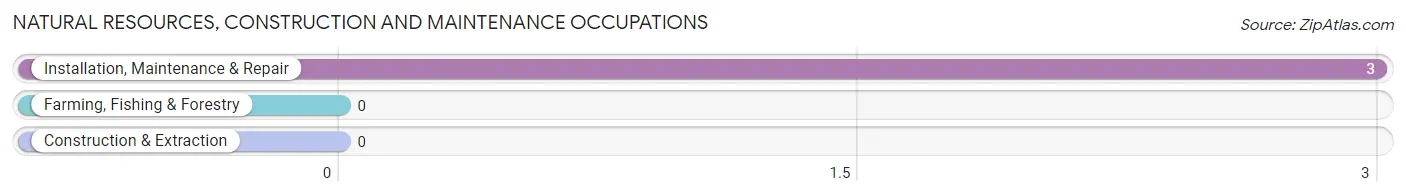
Natural Resources, Construction and Maintenance Occupations by Sex
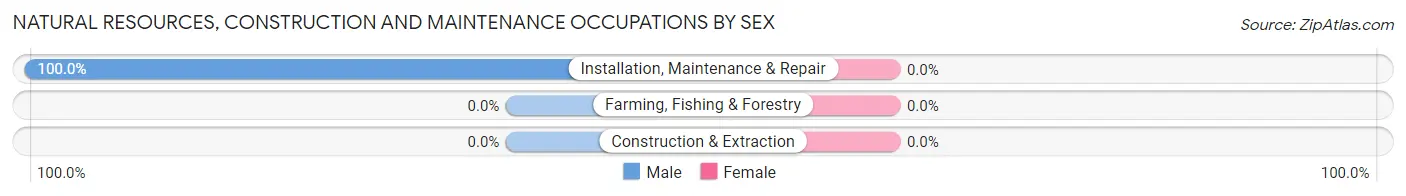
| Occupation | Male | Female |
| Farming, Fishing & Forestry | 0 (0.0%) | 0 (0.0%) |
| Construction & Extraction | 0 (0.0%) | 0 (0.0%) |
| Installation, Maintenance & Repair | 3 (100.0%) | 0 (0.0%) |
| Total (Category) | 3 (100.0%) | 0 (0.0%) |
| Total (Overall) | 213 (61.6%) | 133 (38.4%) |
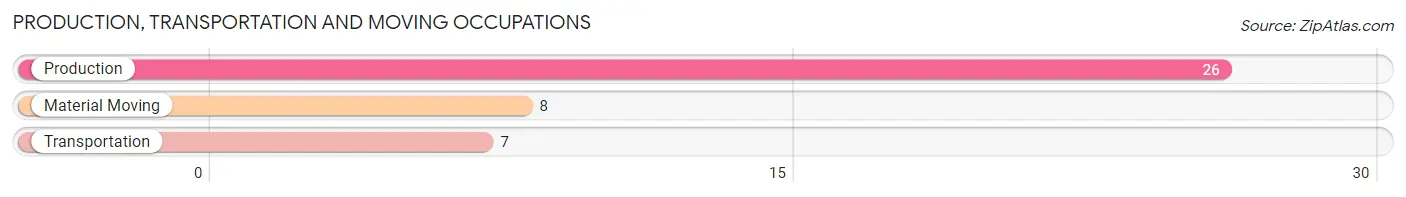
Production, Transportation and Moving Occupations
The most common Production, Transportation and Moving occupations in Castalian Springs are Production (26 | 7.5%), Material Moving (8 | 2.3%), and Transportation (7 | 2.0%).
Production, Transportation and Moving Occupations by Sex
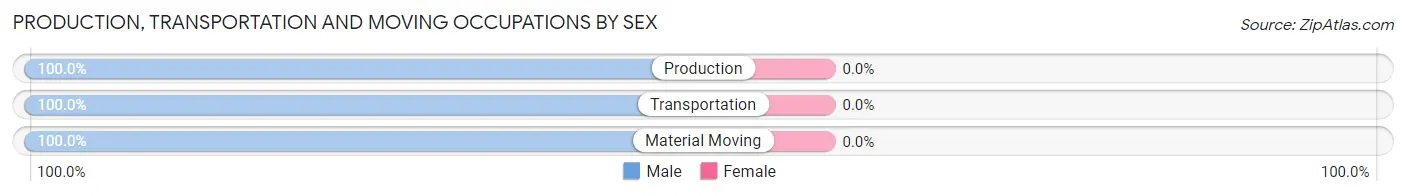
| Occupation | Male | Female |
| Production | 26 (100.0%) | 0 (0.0%) |
| Transportation | 7 (100.0%) | 0 (0.0%) |
| Material Moving | 8 (100.0%) | 0 (0.0%) |
| Total (Category) | 41 (100.0%) | 0 (0.0%) |
| Total (Overall) | 213 (61.6%) | 133 (38.4%) |
Employment Industries by Sex in Castalian Springs
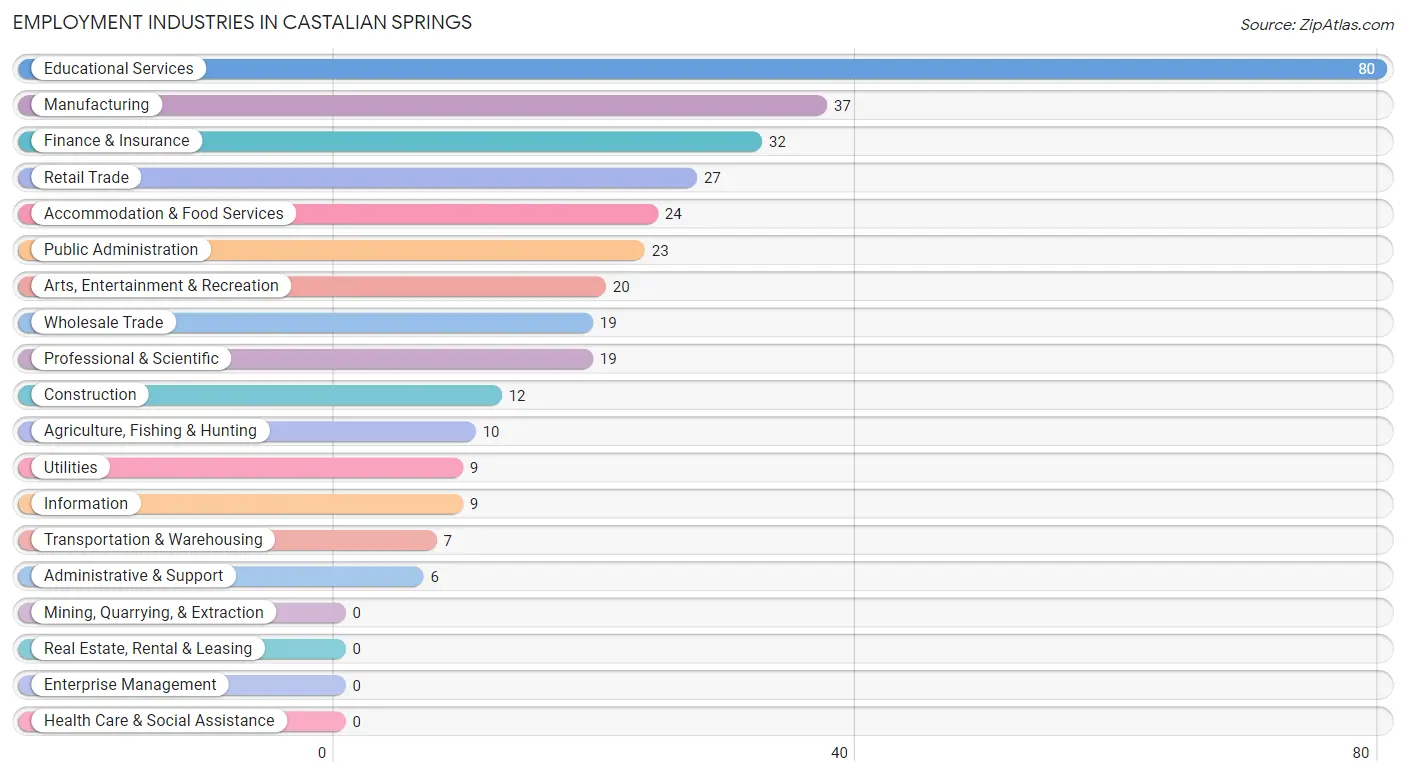
Employment Industries in Castalian Springs
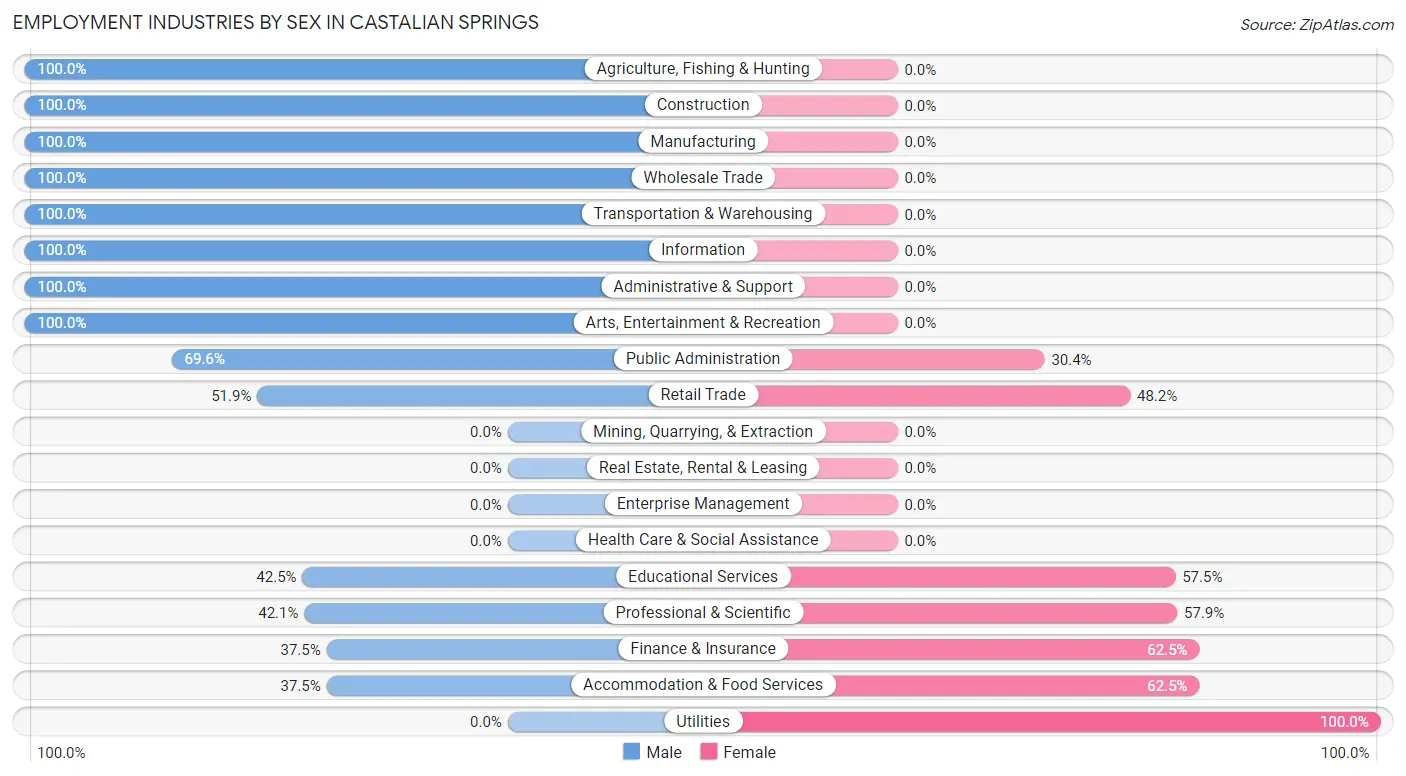
The major employment industries in Castalian Springs include Educational Services (80 | 23.1%), Manufacturing (37 | 10.7%), Finance & Insurance (32 | 9.2%), Retail Trade (27 | 7.8%), and Accommodation & Food Services (24 | 6.9%).
Employment Industries by Sex in Castalian Springs
The Castalian Springs industries that see more men than women are Agriculture, Fishing & Hunting (100.0%), Construction (100.0%), and Manufacturing (100.0%), whereas the industries that tend to have a higher number of women are Utilities (100.0%), Finance & Insurance (62.5%), and Accommodation & Food Services (62.5%).
| Industry | Male | Female |
| Agriculture, Fishing & Hunting | 10 (100.0%) | 0 (0.0%) |
| Mining, Quarrying, & Extraction | 0 (0.0%) | 0 (0.0%) |
| Construction | 12 (100.0%) | 0 (0.0%) |
| Manufacturing | 37 (100.0%) | 0 (0.0%) |
| Wholesale Trade | 19 (100.0%) | 0 (0.0%) |
| Retail Trade | 14 (51.8%) | 13 (48.1%) |
| Transportation & Warehousing | 7 (100.0%) | 0 (0.0%) |
| Utilities | 0 (0.0%) | 9 (100.0%) |
| Information | 9 (100.0%) | 0 (0.0%) |
| Finance & Insurance | 12 (37.5%) | 20 (62.5%) |
| Real Estate, Rental & Leasing | 0 (0.0%) | 0 (0.0%) |
| Professional & Scientific | 8 (42.1%) | 11 (57.9%) |
| Enterprise Management | 0 (0.0%) | 0 (0.0%) |
| Administrative & Support | 6 (100.0%) | 0 (0.0%) |
| Educational Services | 34 (42.5%) | 46 (57.5%) |
| Health Care & Social Assistance | 0 (0.0%) | 0 (0.0%) |
| Arts, Entertainment & Recreation | 20 (100.0%) | 0 (0.0%) |
| Accommodation & Food Services | 9 (37.5%) | 15 (62.5%) |
| Public Administration | 16 (69.6%) | 7 (30.4%) |
| Total | 213 (61.6%) | 133 (38.4%) |
Education in Castalian Springs
School Enrollment in Castalian Springs
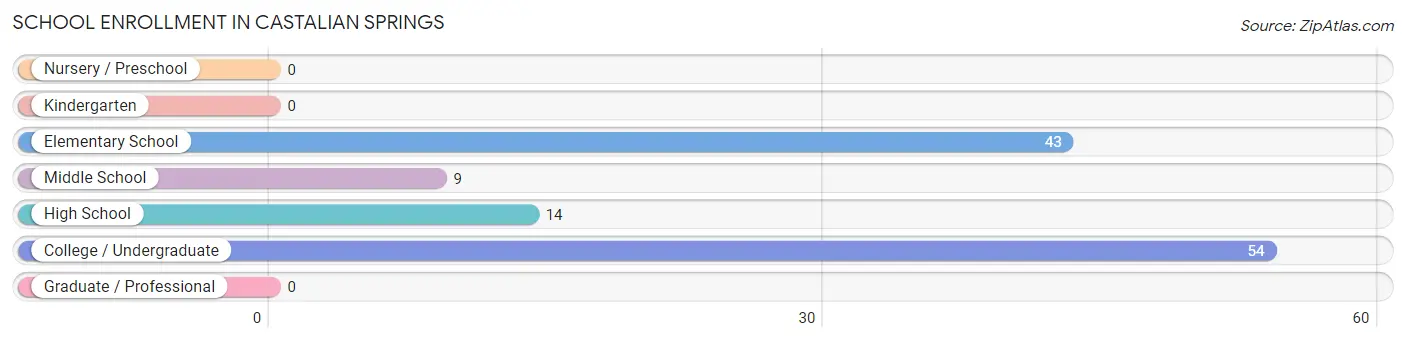
The most common levels of schooling among the 120 students in Castalian Springs are college / undergraduate (54 | 45.0%), elementary school (43 | 35.8%), and high school (14 | 11.7%).
| School Level | # Students | % Students |
| Nursery / Preschool | 0 | 0.0% |
| Kindergarten | 0 | 0.0% |
| Elementary School | 43 | 35.8% |
| Middle School | 9 | 7.5% |
| High School | 14 | 11.7% |
| College / Undergraduate | 54 | 45.0% |
| Graduate / Professional | 0 | 0.0% |
| Total | 120 | 100.0% |
School Enrollment by Age by Funding Source in Castalian Springs
| Age Bracket | Public School | Private School |
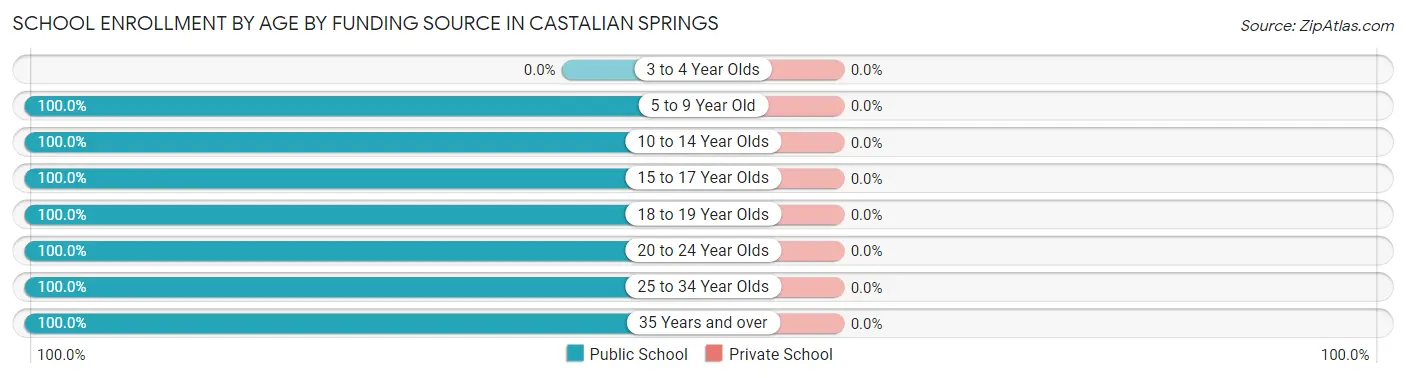
| 3 to 4 Year Olds | 0 (0.0%) | 0 (0.0%) |
| 5 to 9 Year Old | 43 (100.0%) | 0 (0.0%) |
| 10 to 14 Year Olds | 9 (100.0%) | 0 (0.0%) |
| 15 to 17 Year Olds | 14 (100.0%) | 0 (0.0%) |
| 18 to 19 Year Olds | 8 (100.0%) | 0 (0.0%) |
| 20 to 24 Year Olds | 22 (100.0%) | 0 (0.0%) |
| 25 to 34 Year Olds | 10 (100.0%) | 0 (0.0%) |
| 35 Years and over | 14 (100.0%) | 0 (0.0%) |
| Total | 120 (100.0%) | 0 (0.0%) |
Educational Attainment by Field of Study in Castalian Springs
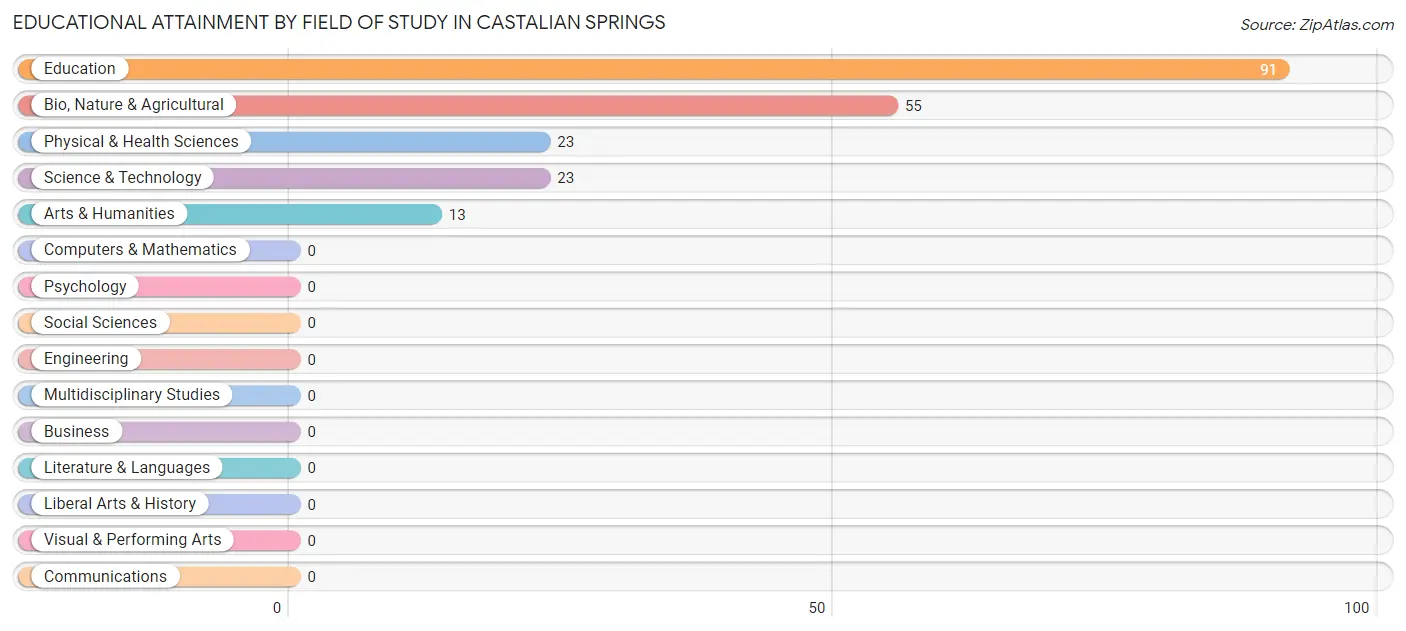
Education (91 | 44.4%), bio, nature & agricultural (55 | 26.8%), physical & health sciences (23 | 11.2%), science & technology (23 | 11.2%), and arts & humanities (13 | 6.3%) are the most common fields of study among 205 individuals in Castalian Springs who have obtained a bachelor's degree or higher.
| Field of Study | # Graduates | % Graduates |
| Computers & Mathematics | 0 | 0.0% |
| Bio, Nature & Agricultural | 55 | 26.8% |
| Physical & Health Sciences | 23 | 11.2% |
| Psychology | 0 | 0.0% |
| Social Sciences | 0 | 0.0% |
| Engineering | 0 | 0.0% |
| Multidisciplinary Studies | 0 | 0.0% |
| Science & Technology | 23 | 11.2% |
| Business | 0 | 0.0% |
| Education | 91 | 44.4% |
| Literature & Languages | 0 | 0.0% |
| Liberal Arts & History | 0 | 0.0% |
| Visual & Performing Arts | 0 | 0.0% |
| Communications | 0 | 0.0% |
| Arts & Humanities | 13 | 6.3% |
| Total | 205 | 100.0% |
Transportation & Commute in Castalian Springs
Vehicle Availability by Sex in Castalian Springs
The most prevalent vehicle ownership categories in Castalian Springs are males with 2 vehicles (82, accounting for 38.5%) and females with 2 vehicles (69, making up 61.7%).
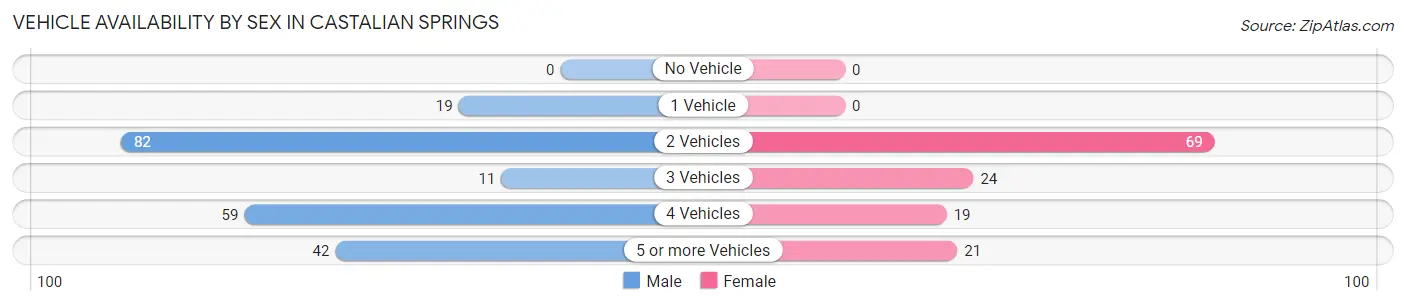
| Vehicles Available | Male | Female |
| No Vehicle | 0 (0.0%) | 0 (0.0%) |
| 1 Vehicle | 19 (8.9%) | 0 (0.0%) |
| 2 Vehicles | 82 (38.5%) | 69 (51.9%) |
| 3 Vehicles | 11 (5.2%) | 24 (18.0%) |
| 4 Vehicles | 59 (27.7%) | 19 (14.3%) |
| 5 or more Vehicles | 42 (19.7%) | 21 (15.8%) |
| Total | 213 (100.0%) | 133 (100.0%) |
Commute Time in Castalian Springs
The most frequently occuring commute durations in Castalian Springs are 10 to 14 minutes (75 commuters, 24.7%), 15 to 19 minutes (52 commuters, 17.2%), and 20 to 24 minutes (39 commuters, 12.9%).
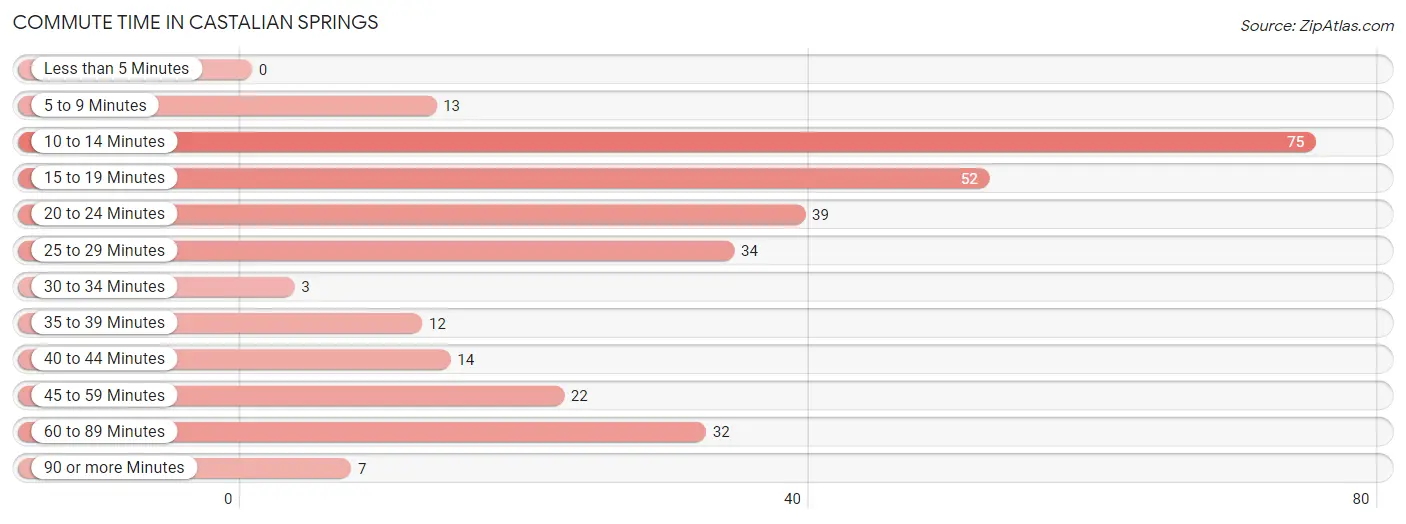
| Commute Time | # Commuters | % Commuters |
| Less than 5 Minutes | 0 | 0.0% |
| 5 to 9 Minutes | 13 | 4.3% |
| 10 to 14 Minutes | 75 | 24.7% |
| 15 to 19 Minutes | 52 | 17.2% |
| 20 to 24 Minutes | 39 | 12.9% |
| 25 to 29 Minutes | 34 | 11.2% |
| 30 to 34 Minutes | 3 | 1.0% |
| 35 to 39 Minutes | 12 | 4.0% |
| 40 to 44 Minutes | 14 | 4.6% |
| 45 to 59 Minutes | 22 | 7.3% |
| 60 to 89 Minutes | 32 | 10.6% |
| 90 or more Minutes | 7 | 2.3% |
Commute Time by Sex in Castalian Springs
The most common commute times in Castalian Springs are 25 to 29 minutes (34 commuters, 17.8%) for males and 10 to 14 minutes (48 commuters, 42.9%) for females.
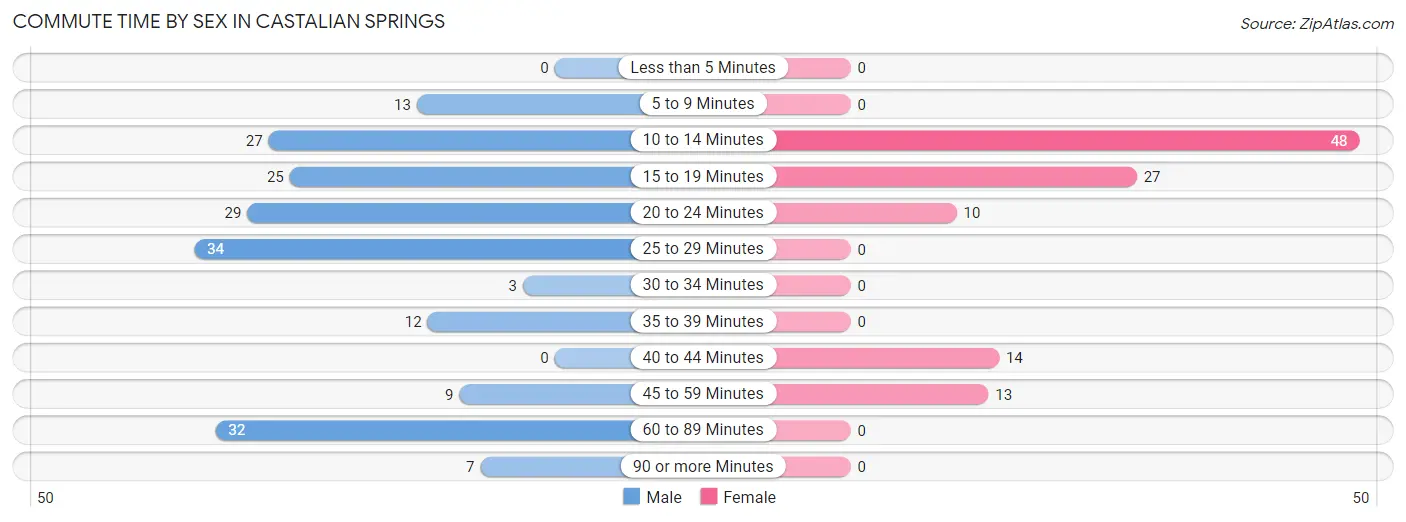
| Commute Time | Male | Female |
| Less than 5 Minutes | 0 (0.0%) | 0 (0.0%) |
| 5 to 9 Minutes | 13 (6.8%) | 0 (0.0%) |
| 10 to 14 Minutes | 27 (14.1%) | 48 (42.9%) |
| 15 to 19 Minutes | 25 (13.1%) | 27 (24.1%) |
| 20 to 24 Minutes | 29 (15.2%) | 10 (8.9%) |
| 25 to 29 Minutes | 34 (17.8%) | 0 (0.0%) |
| 30 to 34 Minutes | 3 (1.6%) | 0 (0.0%) |
| 35 to 39 Minutes | 12 (6.3%) | 0 (0.0%) |
| 40 to 44 Minutes | 0 (0.0%) | 14 (12.5%) |
| 45 to 59 Minutes | 9 (4.7%) | 13 (11.6%) |
| 60 to 89 Minutes | 32 (16.8%) | 0 (0.0%) |
| 90 or more Minutes | 7 (3.7%) | 0 (0.0%) |
Time of Departure to Work by Sex in Castalian Springs
The most frequent times of departure to work in Castalian Springs are 12:00 PM to 3:59 PM (39, 20.4%) for males and 5:00 AM to 5:29 AM (45, 40.2%) for females.
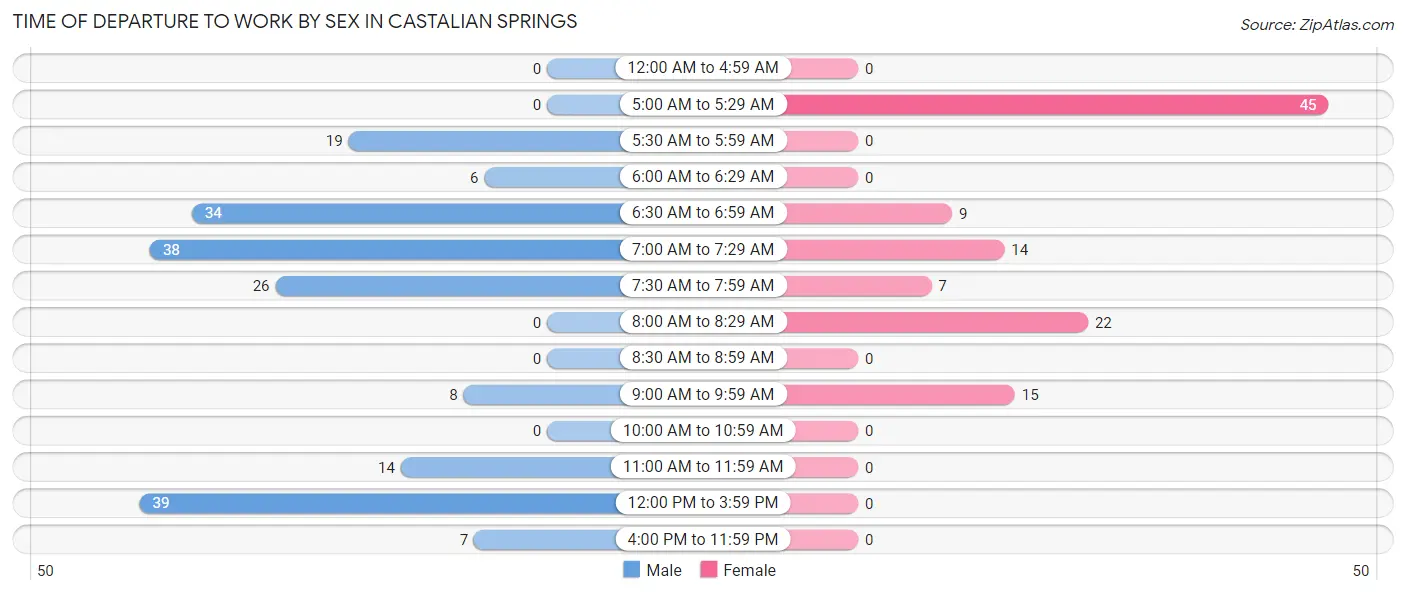
| Time of Departure | Male | Female |
| 12:00 AM to 4:59 AM | 0 (0.0%) | 0 (0.0%) |
| 5:00 AM to 5:29 AM | 0 (0.0%) | 45 (40.2%) |
| 5:30 AM to 5:59 AM | 19 (10.0%) | 0 (0.0%) |
| 6:00 AM to 6:29 AM | 6 (3.1%) | 0 (0.0%) |
| 6:30 AM to 6:59 AM | 34 (17.8%) | 9 (8.0%) |
| 7:00 AM to 7:29 AM | 38 (19.9%) | 14 (12.5%) |
| 7:30 AM to 7:59 AM | 26 (13.6%) | 7 (6.2%) |
| 8:00 AM to 8:29 AM | 0 (0.0%) | 22 (19.6%) |
| 8:30 AM to 8:59 AM | 0 (0.0%) | 0 (0.0%) |
| 9:00 AM to 9:59 AM | 8 (4.2%) | 15 (13.4%) |
| 10:00 AM to 10:59 AM | 0 (0.0%) | 0 (0.0%) |
| 11:00 AM to 11:59 AM | 14 (7.3%) | 0 (0.0%) |
| 12:00 PM to 3:59 PM | 39 (20.4%) | 0 (0.0%) |
| 4:00 PM to 11:59 PM | 7 (3.7%) | 0 (0.0%) |
| Total | 191 (100.0%) | 112 (100.0%) |
Housing Occupancy in Castalian Springs
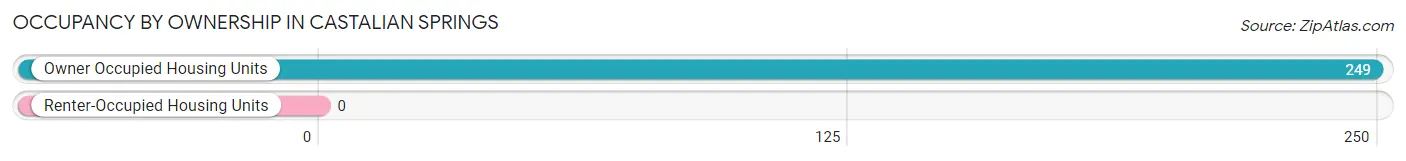
Occupancy by Ownership in Castalian Springs
Of the total 249 dwellings in Castalian Springs, owner-occupied units account for 249 (100.0%), while renter-occupied units make up 0 (0.0%).
| Occupancy | # Housing Units | % Housing Units |
| Owner Occupied Housing Units | 249 | 100.0% |
| Renter-Occupied Housing Units | 0 | 0.0% |
| Total Occupied Housing Units | 249 | 100.0% |
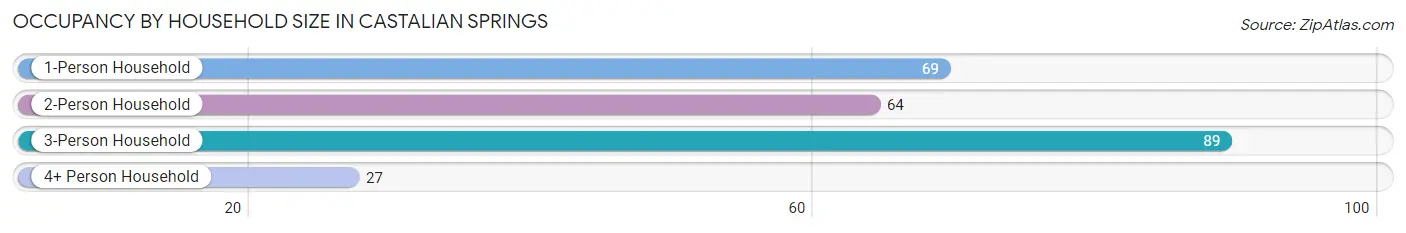
Occupancy by Household Size in Castalian Springs
| Household Size | # Housing Units | % Housing Units |
| 1-Person Household | 69 | 27.7% |
| 2-Person Household | 64 | 25.7% |
| 3-Person Household | 89 | 35.7% |
| 4+ Person Household | 27 | 10.8% |
| Total Housing Units | 249 | 100.0% |
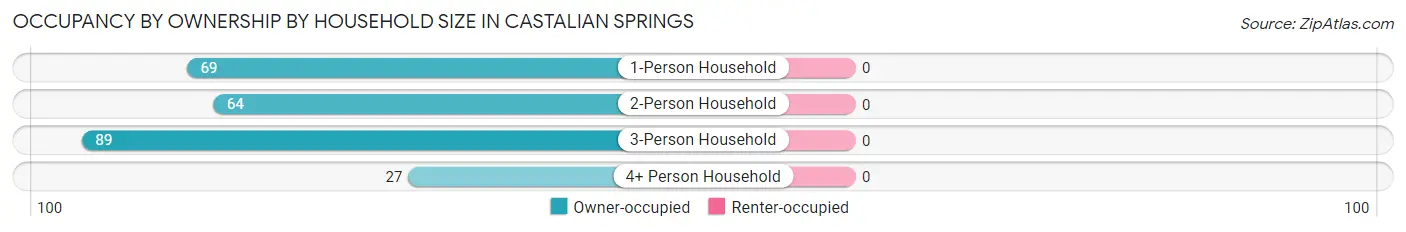
Occupancy by Ownership by Household Size in Castalian Springs
| Household Size | Owner-occupied | Renter-occupied |
| 1-Person Household | 69 (100.0%) | 0 (0.0%) |
| 2-Person Household | 64 (100.0%) | 0 (0.0%) |
| 3-Person Household | 89 (100.0%) | 0 (0.0%) |
| 4+ Person Household | 27 (100.0%) | 0 (0.0%) |
| Total Housing Units | 249 (100.0%) | 0 (0.0%) |
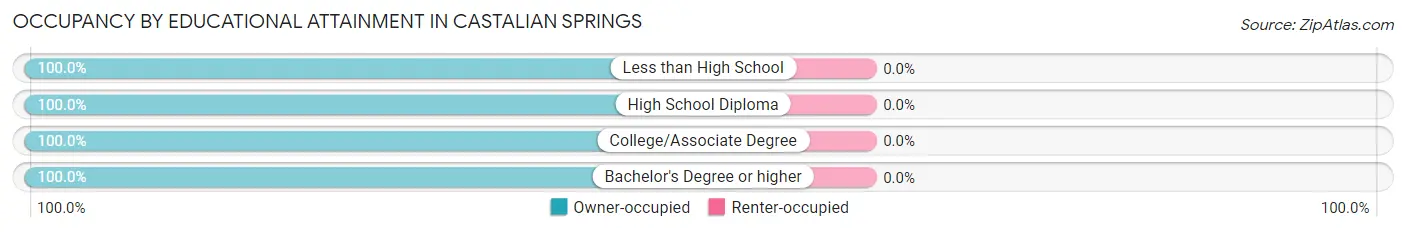
Occupancy by Educational Attainment in Castalian Springs
| Household Size | Owner-occupied | Renter-occupied |
| Less than High School | 28 (100.0%) | 0 (0.0%) |
| High School Diploma | 51 (100.0%) | 0 (0.0%) |
| College/Associate Degree | 81 (100.0%) | 0 (0.0%) |
| Bachelor's Degree or higher | 89 (100.0%) | 0 (0.0%) |
Occupancy by Age of Householder in Castalian Springs
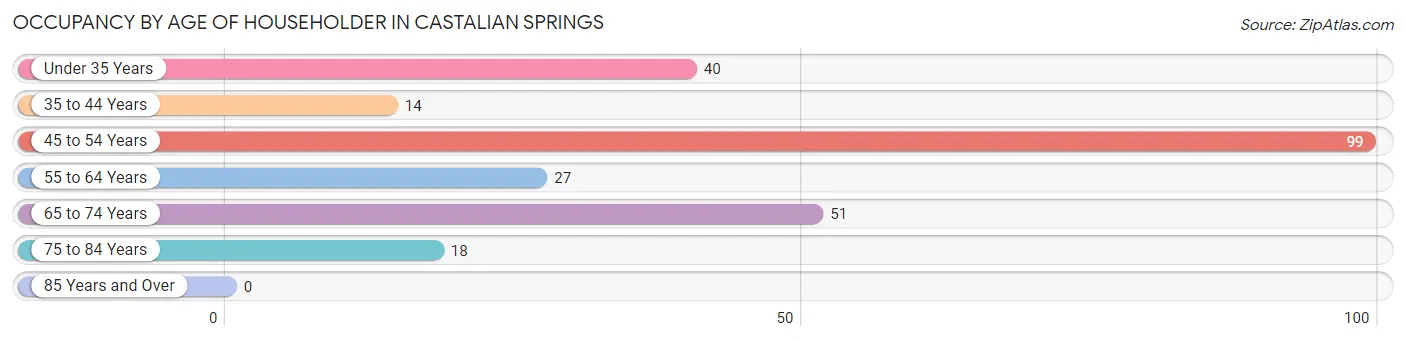
| Age Bracket | # Households | % Households |
| Under 35 Years | 40 | 16.1% |
| 35 to 44 Years | 14 | 5.6% |
| 45 to 54 Years | 99 | 39.8% |
| 55 to 64 Years | 27 | 10.8% |
| 65 to 74 Years | 51 | 20.5% |
| 75 to 84 Years | 18 | 7.2% |
| 85 Years and Over | 0 | 0.0% |
| Total | 249 | 100.0% |
Housing Finances in Castalian Springs
Median Income by Occupancy in Castalian Springs
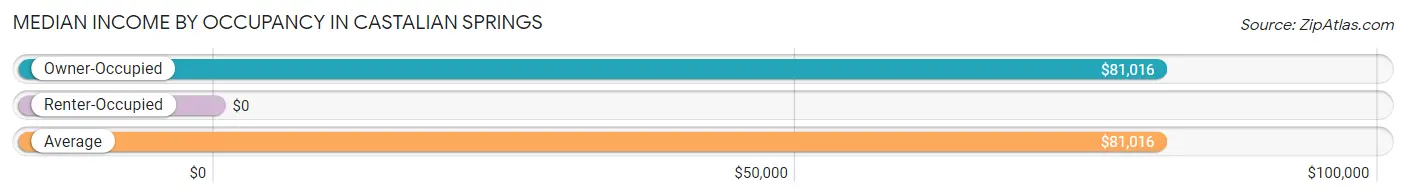
| Occupancy Type | # Households | Median Income |
| Owner-Occupied | 249 (100.0%) | $81,016 |
| Renter-Occupied | 0 (0.0%) | $0 |
| Average | 249 (100.0%) | $81,016 |
Occupancy by Householder Income Bracket in Castalian Springs
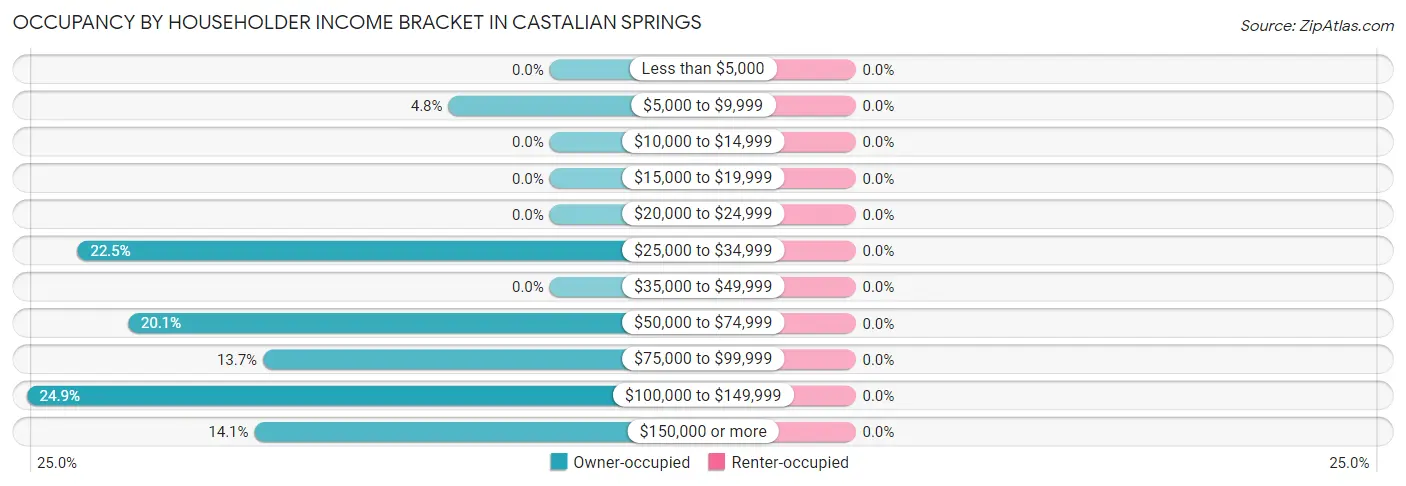
| Income Bracket | Owner-occupied | Renter-occupied |
| Less than $5,000 | 0 (0.0%) | 0 (0.0%) |
| $5,000 to $9,999 | 12 (4.8%) | 0 (0.0%) |
| $10,000 to $14,999 | 0 (0.0%) | 0 (0.0%) |
| $15,000 to $19,999 | 0 (0.0%) | 0 (0.0%) |
| $20,000 to $24,999 | 0 (0.0%) | 0 (0.0%) |
| $25,000 to $34,999 | 56 (22.5%) | 0 (0.0%) |
| $35,000 to $49,999 | 0 (0.0%) | 0 (0.0%) |
| $50,000 to $74,999 | 50 (20.1%) | 0 (0.0%) |
| $75,000 to $99,999 | 34 (13.7%) | 0 (0.0%) |
| $100,000 to $149,999 | 62 (24.9%) | 0 (0.0%) |
| $150,000 or more | 35 (14.1%) | 0 (0.0%) |
| Total | 249 (100.0%) | 0 (0.0%) |
Monthly Housing Cost Tiers in Castalian Springs
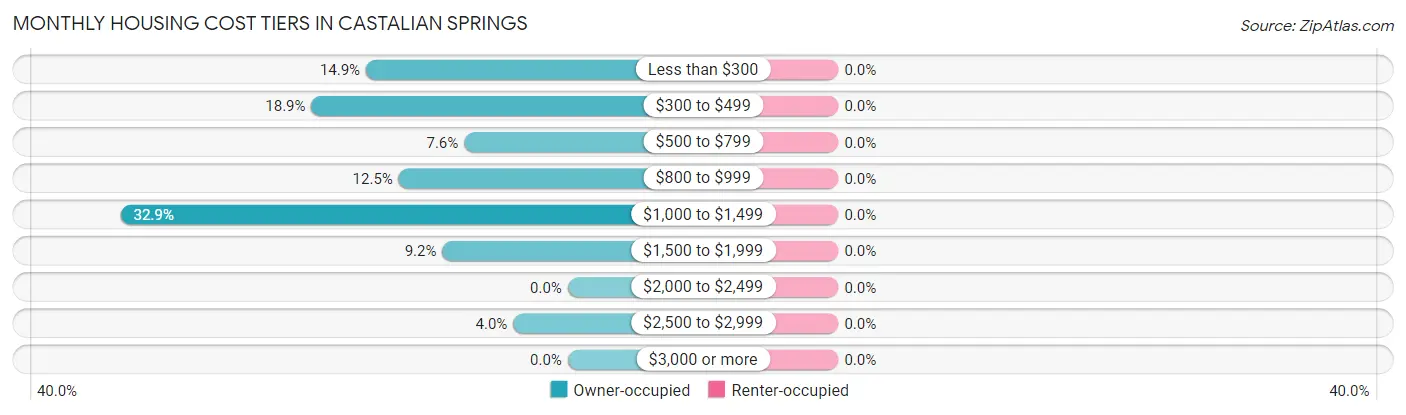
| Monthly Cost | Owner-occupied | Renter-occupied |
| Less than $300 | 37 (14.9%) | 0 (0.0%) |
| $300 to $499 | 47 (18.9%) | 0 (0.0%) |
| $500 to $799 | 19 (7.6%) | 0 (0.0%) |
| $800 to $999 | 31 (12.4%) | 0 (0.0%) |
| $1,000 to $1,499 | 82 (32.9%) | 0 (0.0%) |
| $1,500 to $1,999 | 23 (9.2%) | 0 (0.0%) |
| $2,000 to $2,499 | 0 (0.0%) | 0 (0.0%) |
| $2,500 to $2,999 | 10 (4.0%) | 0 (0.0%) |
| $3,000 or more | 0 (0.0%) | 0 (0.0%) |
| Total | 249 (100.0%) | 0 (0.0%) |
Physical Housing Characteristics in Castalian Springs
Housing Structures in Castalian Springs
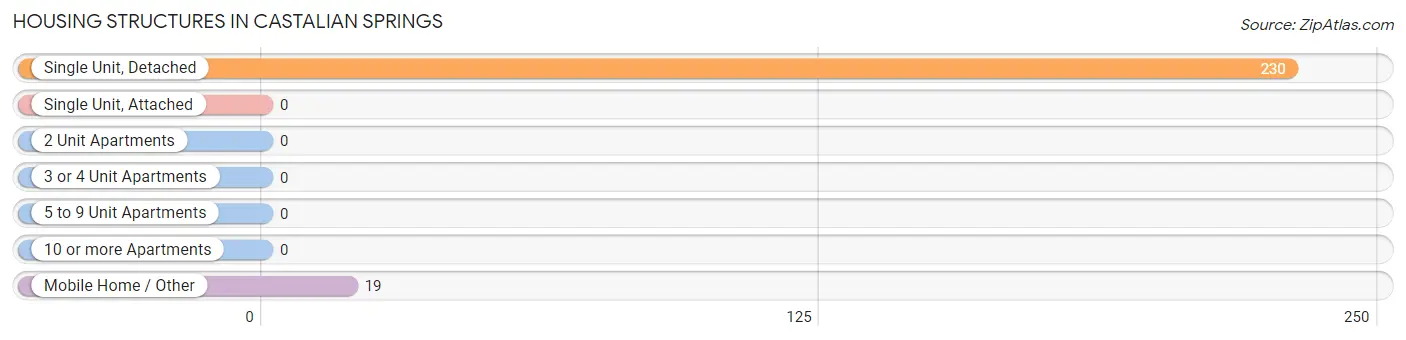
| Structure Type | # Housing Units | % Housing Units |
| Single Unit, Detached | 230 | 92.4% |
| Single Unit, Attached | 0 | 0.0% |
| 2 Unit Apartments | 0 | 0.0% |
| 3 or 4 Unit Apartments | 0 | 0.0% |
| 5 to 9 Unit Apartments | 0 | 0.0% |
| 10 or more Apartments | 0 | 0.0% |
| Mobile Home / Other | 19 | 7.6% |
| Total | 249 | 100.0% |
Housing Structures by Occupancy in Castalian Springs
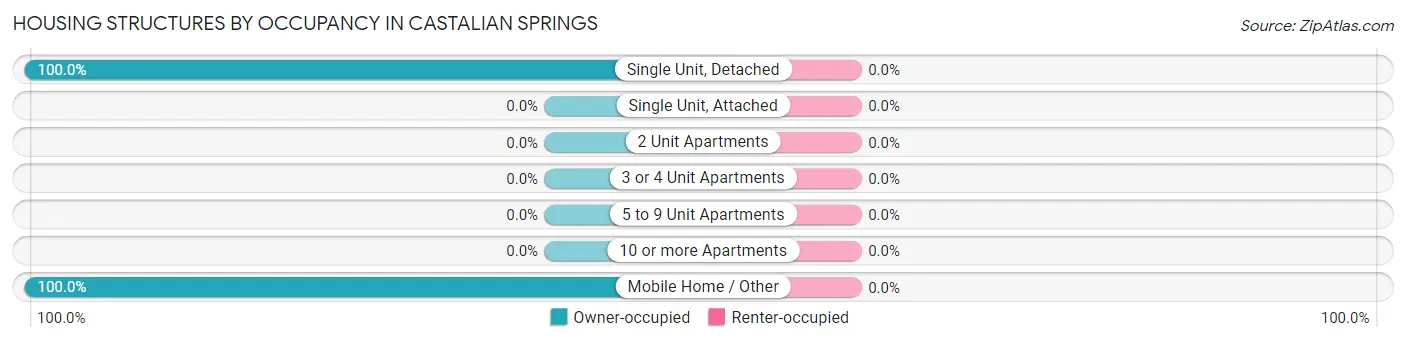
| Structure Type | Owner-occupied | Renter-occupied |
| Single Unit, Detached | 230 (100.0%) | 0 (0.0%) |
| Single Unit, Attached | 0 (0.0%) | 0 (0.0%) |
| 2 Unit Apartments | 0 (0.0%) | 0 (0.0%) |
| 3 or 4 Unit Apartments | 0 (0.0%) | 0 (0.0%) |
| 5 to 9 Unit Apartments | 0 (0.0%) | 0 (0.0%) |
| 10 or more Apartments | 0 (0.0%) | 0 (0.0%) |
| Mobile Home / Other | 19 (100.0%) | 0 (0.0%) |
| Total | 249 (100.0%) | 0 (0.0%) |
Housing Structures by Number of Rooms in Castalian Springs
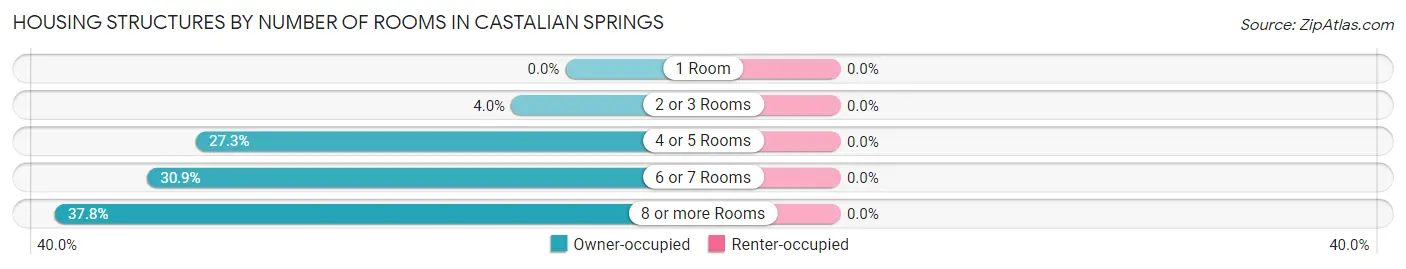
| Number of Rooms | Owner-occupied | Renter-occupied |
| 1 Room | 0 (0.0%) | 0 (0.0%) |
| 2 or 3 Rooms | 10 (4.0%) | 0 (0.0%) |
| 4 or 5 Rooms | 68 (27.3%) | 0 (0.0%) |
| 6 or 7 Rooms | 77 (30.9%) | 0 (0.0%) |
| 8 or more Rooms | 94 (37.8%) | 0 (0.0%) |
| Total | 249 (100.0%) | 0 (0.0%) |
Housing Structure by Heating Type in Castalian Springs
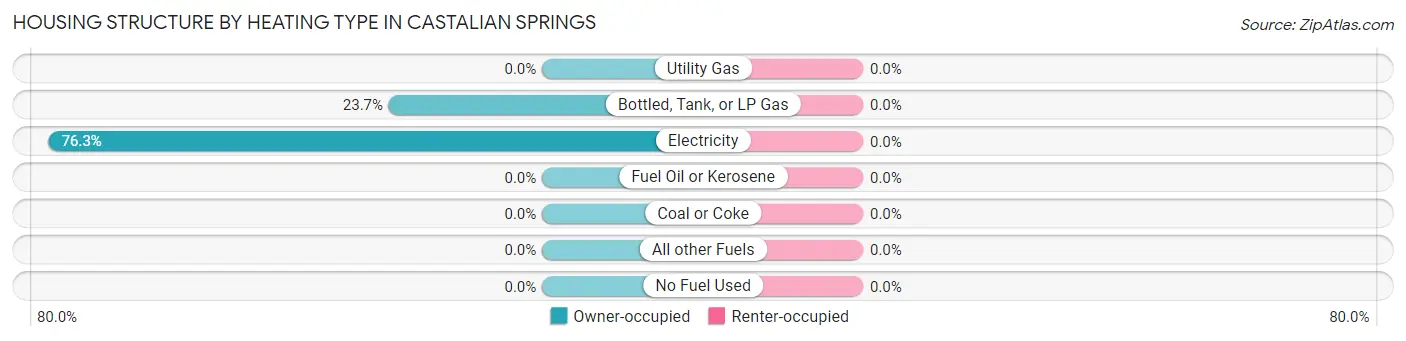
| Heating Type | Owner-occupied | Renter-occupied |
| Utility Gas | 0 (0.0%) | 0 (0.0%) |
| Bottled, Tank, or LP Gas | 59 (23.7%) | 0 (0.0%) |
| Electricity | 190 (76.3%) | 0 (0.0%) |
| Fuel Oil or Kerosene | 0 (0.0%) | 0 (0.0%) |
| Coal or Coke | 0 (0.0%) | 0 (0.0%) |
| All other Fuels | 0 (0.0%) | 0 (0.0%) |
| No Fuel Used | 0 (0.0%) | 0 (0.0%) |
| Total | 249 (100.0%) | 0 (0.0%) |
Household Vehicle Usage in Castalian Springs
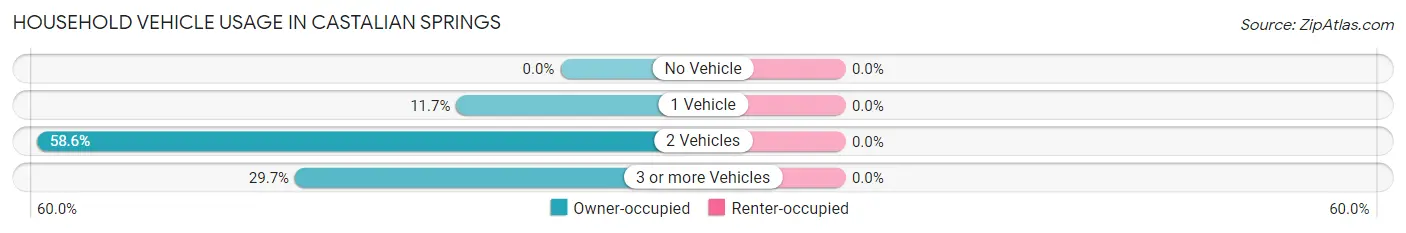
| Vehicles per Household | Owner-occupied | Renter-occupied |
| No Vehicle | 0 (0.0%) | 0 (0.0%) |
| 1 Vehicle | 29 (11.7%) | 0 (0.0%) |
| 2 Vehicles | 146 (58.6%) | 0 (0.0%) |
| 3 or more Vehicles | 74 (29.7%) | 0 (0.0%) |
| Total | 249 (100.0%) | 0 (0.0%) |
Real Estate & Mortgages in Castalian Springs
Real Estate and Mortgage Overview in Castalian Springs
| Characteristic | Without Mortgage | With Mortgage |
| Housing Units | 82 | 167 |
| Median Property Value | $266,700 | $162,000 |
| Median Household Income | - | - |
| Monthly Housing Costs | $432 | $0 |
| Real Estate Taxes | $2,047 | $16 |
Property Value by Mortgage Status in Castalian Springs
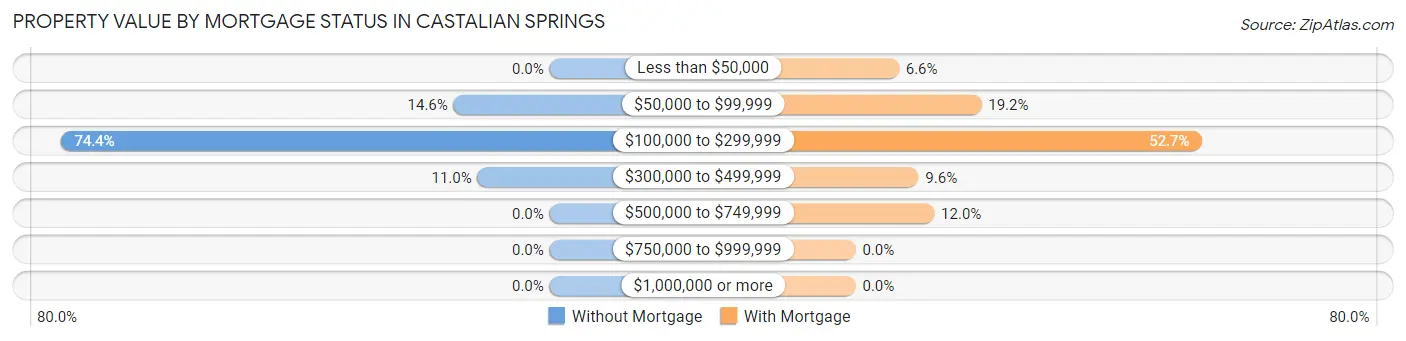
| Property Value | Without Mortgage | With Mortgage |
| Less than $50,000 | 0 (0.0%) | 11 (6.6%) |
| $50,000 to $99,999 | 12 (14.6%) | 32 (19.2%) |
| $100,000 to $299,999 | 61 (74.4%) | 88 (52.7%) |
| $300,000 to $499,999 | 9 (11.0%) | 16 (9.6%) |
| $500,000 to $749,999 | 0 (0.0%) | 20 (12.0%) |
| $750,000 to $999,999 | 0 (0.0%) | 0 (0.0%) |
| $1,000,000 or more | 0 (0.0%) | 0 (0.0%) |
| Total | 82 (100.0%) | 167 (100.0%) |
Household Income by Mortgage Status in Castalian Springs
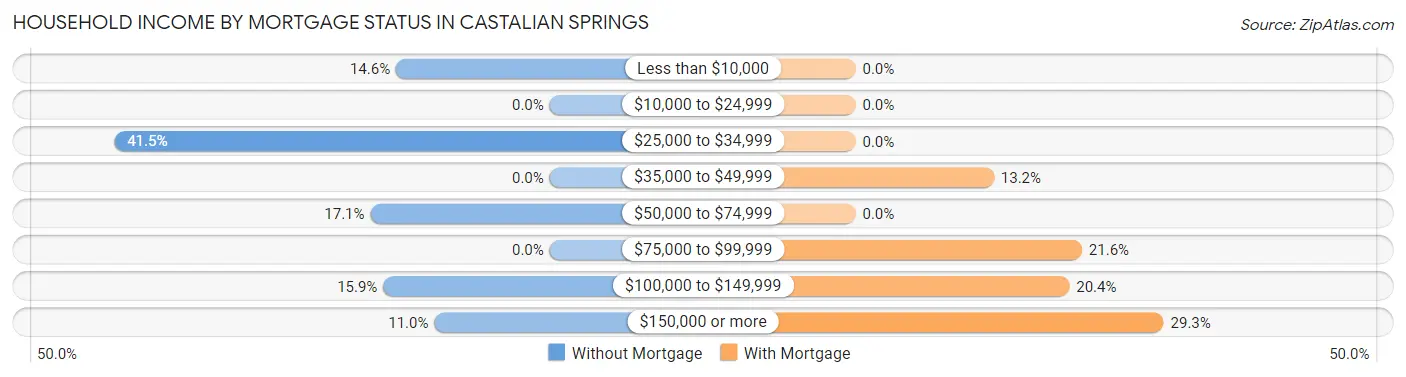
| Household Income | Without Mortgage | With Mortgage |
| Less than $10,000 | 12 (14.6%) | 0 (0.0%) |
| $10,000 to $24,999 | 0 (0.0%) | 0 (0.0%) |
| $25,000 to $34,999 | 34 (41.5%) | 0 (0.0%) |
| $35,000 to $49,999 | 0 (0.0%) | 22 (13.2%) |
| $50,000 to $74,999 | 14 (17.1%) | 0 (0.0%) |
| $75,000 to $99,999 | 0 (0.0%) | 36 (21.6%) |
| $100,000 to $149,999 | 13 (15.9%) | 34 (20.4%) |
| $150,000 or more | 9 (11.0%) | 49 (29.3%) |
| Total | 82 (100.0%) | 167 (100.0%) |
Property Value to Household Income Ratio in Castalian Springs
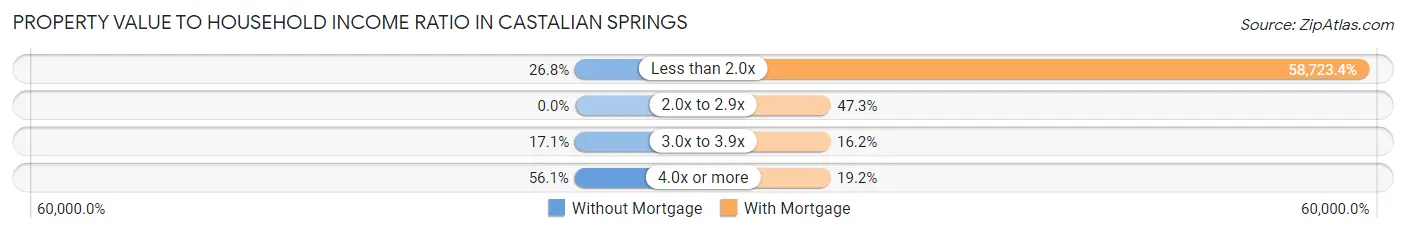
| Value-to-Income Ratio | Without Mortgage | With Mortgage |
| Less than 2.0x | 22 (26.8%) | 98,068 (58,723.4%) |
| 2.0x to 2.9x | 0 (0.0%) | 79 (47.3%) |
| 3.0x to 3.9x | 14 (17.1%) | 27 (16.2%) |
| 4.0x or more | 46 (56.1%) | 32 (19.2%) |
| Total | 82 (100.0%) | 167 (100.0%) |
Real Estate Taxes by Mortgage Status in Castalian Springs
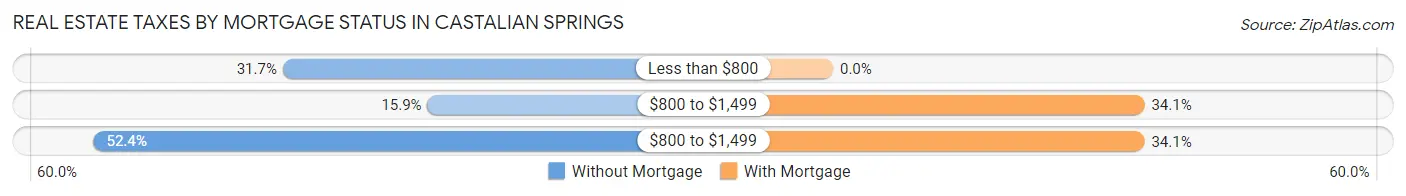
| Property Taxes | Without Mortgage | With Mortgage |
| Less than $800 | 26 (31.7%) | 0 (0.0%) |
| $800 to $1,499 | 13 (15.9%) | 57 (34.1%) |
| $800 to $1,499 | 43 (52.4%) | 57 (34.1%) |
| Total | 82 (100.0%) | 167 (100.0%) |
Health & Disability in Castalian Springs
Health Insurance Coverage by Age in Castalian Springs
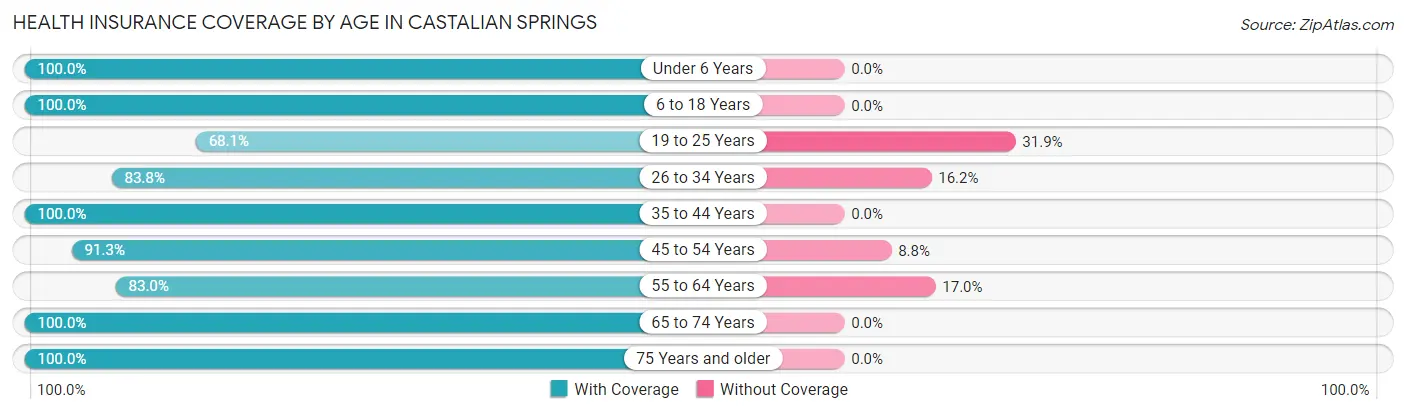
| Age Bracket | With Coverage | Without Coverage |
| Under 6 Years | 26 (100.0%) | 0 (0.0%) |
| 6 to 18 Years | 91 (100.0%) | 0 (0.0%) |
| 19 to 25 Years | 32 (68.1%) | 15 (31.9%) |
| 26 to 34 Years | 62 (83.8%) | 12 (16.2%) |
| 35 to 44 Years | 73 (100.0%) | 0 (0.0%) |
| 45 to 54 Years | 146 (91.2%) | 14 (8.7%) |
| 55 to 64 Years | 44 (83.0%) | 9 (17.0%) |
| 65 to 74 Years | 59 (100.0%) | 0 (0.0%) |
| 75 Years and older | 37 (100.0%) | 0 (0.0%) |
| Total | 570 (91.9%) | 50 (8.1%) |
Health Insurance Coverage by Citizenship Status in Castalian Springs

| Citizenship Status | With Coverage | Without Coverage |
| Native Born | 26 (100.0%) | 0 (0.0%) |
| Foreign Born, Citizen | 91 (100.0%) | 0 (0.0%) |
| Foreign Born, not a Citizen | 32 (68.1%) | 15 (31.9%) |
Health Insurance Coverage by Household Income in Castalian Springs
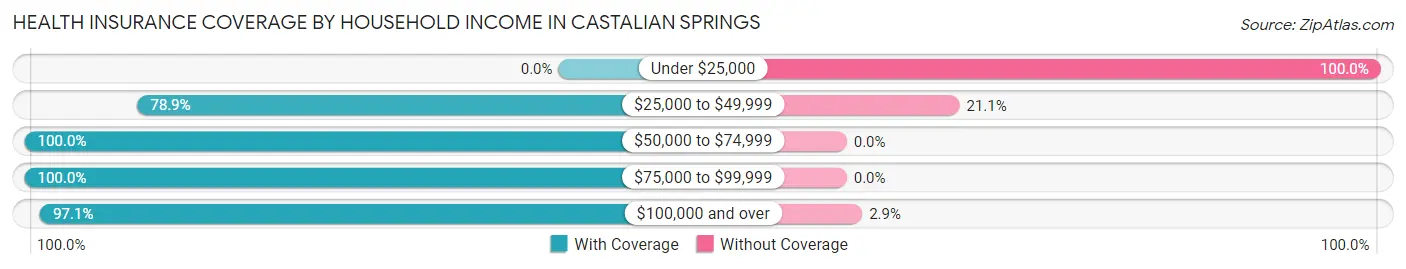
| Household Income | With Coverage | Without Coverage |
| Under $25,000 | 0 (0.0%) | 26 (100.0%) |
| $25,000 to $49,999 | 56 (78.9%) | 15 (21.1%) |
| $50,000 to $74,999 | 95 (100.0%) | 0 (0.0%) |
| $75,000 to $99,999 | 109 (100.0%) | 0 (0.0%) |
| $100,000 and over | 302 (97.1%) | 9 (2.9%) |
Public vs Private Health Insurance Coverage by Age in Castalian Springs
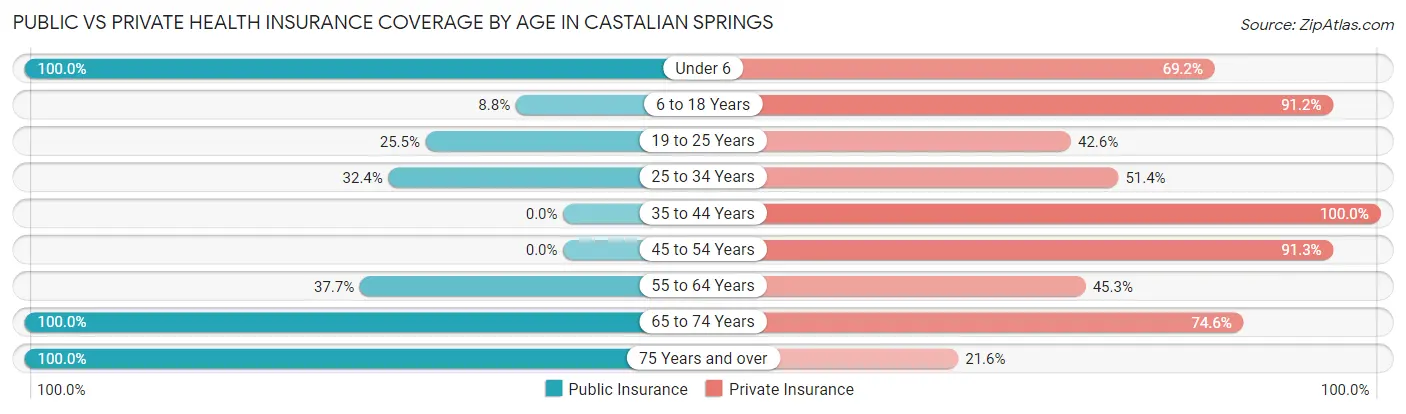
| Age Bracket | Public Insurance | Private Insurance |
| Under 6 | 26 (100.0%) | 18 (69.2%) |
| 6 to 18 Years | 8 (8.8%) | 83 (91.2%) |
| 19 to 25 Years | 12 (25.5%) | 20 (42.5%) |
| 25 to 34 Years | 24 (32.4%) | 38 (51.3%) |
| 35 to 44 Years | 0 (0.0%) | 73 (100.0%) |
| 45 to 54 Years | 0 (0.0%) | 146 (91.2%) |
| 55 to 64 Years | 20 (37.7%) | 24 (45.3%) |
| 65 to 74 Years | 59 (100.0%) | 44 (74.6%) |
| 75 Years and over | 37 (100.0%) | 8 (21.6%) |
| Total | 186 (30.0%) | 454 (73.2%) |
Disability Status by Sex by Age in Castalian Springs
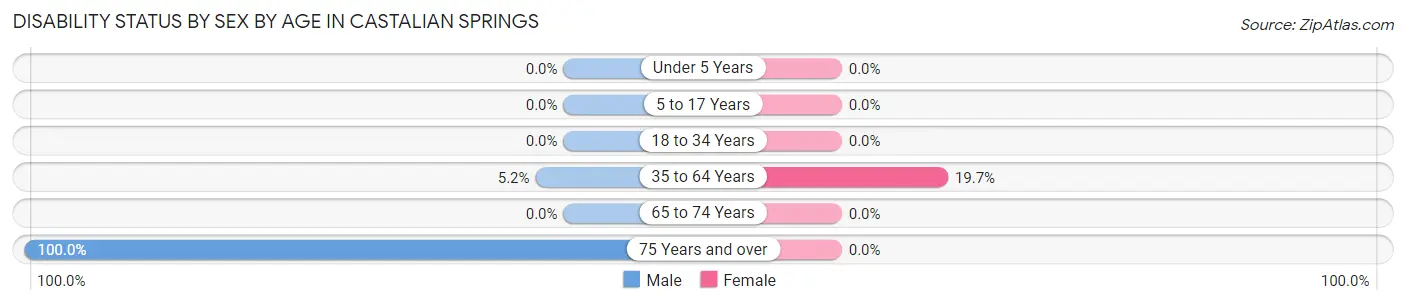
| Age Bracket | Male | Female |
| Under 5 Years | 0 (0.0%) | 0 (0.0%) |
| 5 to 17 Years | 0 (0.0%) | 0 (0.0%) |
| 18 to 34 Years | 0 (0.0%) | 0 (0.0%) |
| 35 to 64 Years | 8 (5.2%) | 26 (19.7%) |
| 65 to 74 Years | 0 (0.0%) | 0 (0.0%) |
| 75 Years and over | 18 (100.0%) | 0 (0.0%) |
Disability Class by Sex by Age in Castalian Springs
Disability Class: Hearing Difficulty
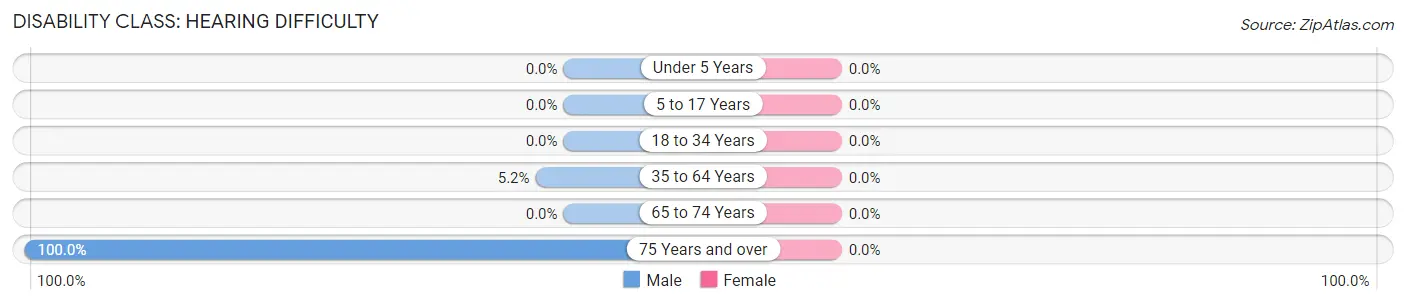
| Age Bracket | Male | Female |
| Under 5 Years | 0 (0.0%) | 0 (0.0%) |
| 5 to 17 Years | 0 (0.0%) | 0 (0.0%) |
| 18 to 34 Years | 0 (0.0%) | 0 (0.0%) |
| 35 to 64 Years | 8 (5.2%) | 0 (0.0%) |
| 65 to 74 Years | 0 (0.0%) | 0 (0.0%) |
| 75 Years and over | 18 (100.0%) | 0 (0.0%) |
Disability Class: Vision Difficulty
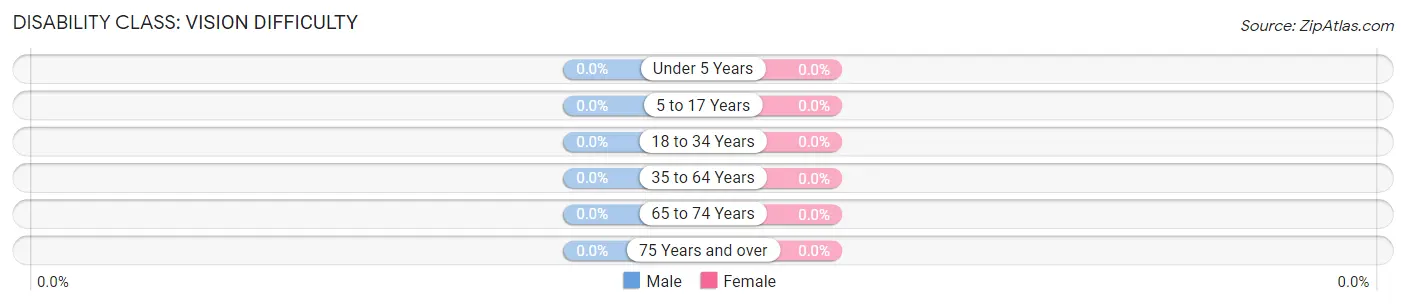
| Age Bracket | Male | Female |
| Under 5 Years | 0 (0.0%) | 0 (0.0%) |
| 5 to 17 Years | 0 (0.0%) | 0 (0.0%) |
| 18 to 34 Years | 0 (0.0%) | 0 (0.0%) |
| 35 to 64 Years | 0 (0.0%) | 0 (0.0%) |
| 65 to 74 Years | 0 (0.0%) | 0 (0.0%) |
| 75 Years and over | 0 (0.0%) | 0 (0.0%) |
Disability Class: Cognitive Difficulty
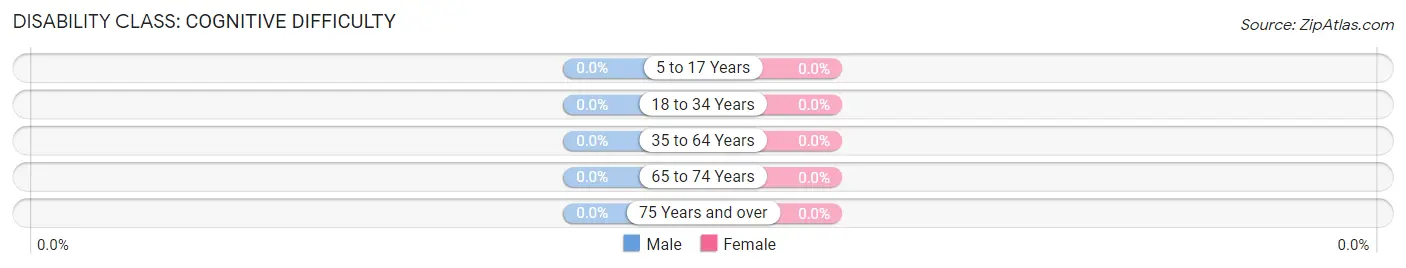
| Age Bracket | Male | Female |
| 5 to 17 Years | 0 (0.0%) | 0 (0.0%) |
| 18 to 34 Years | 0 (0.0%) | 0 (0.0%) |
| 35 to 64 Years | 0 (0.0%) | 0 (0.0%) |
| 65 to 74 Years | 0 (0.0%) | 0 (0.0%) |
| 75 Years and over | 0 (0.0%) | 0 (0.0%) |
Disability Class: Ambulatory Difficulty
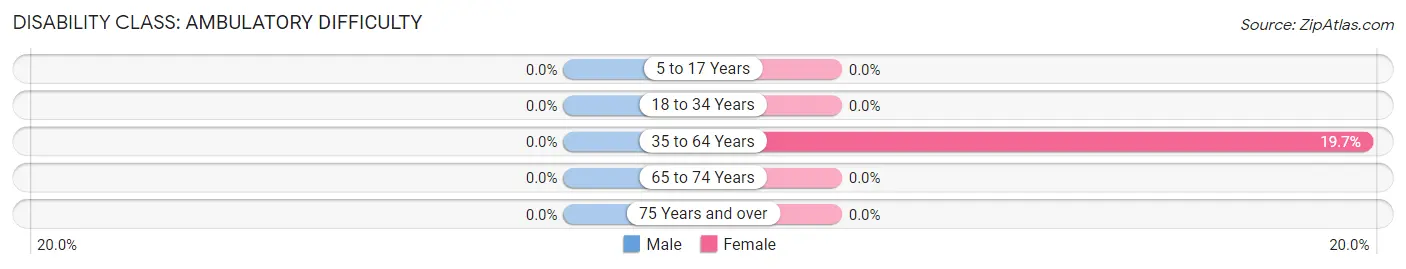
| Age Bracket | Male | Female |
| 5 to 17 Years | 0 (0.0%) | 0 (0.0%) |
| 18 to 34 Years | 0 (0.0%) | 0 (0.0%) |
| 35 to 64 Years | 0 (0.0%) | 26 (19.7%) |
| 65 to 74 Years | 0 (0.0%) | 0 (0.0%) |
| 75 Years and over | 0 (0.0%) | 0 (0.0%) |
Disability Class: Self-Care Difficulty
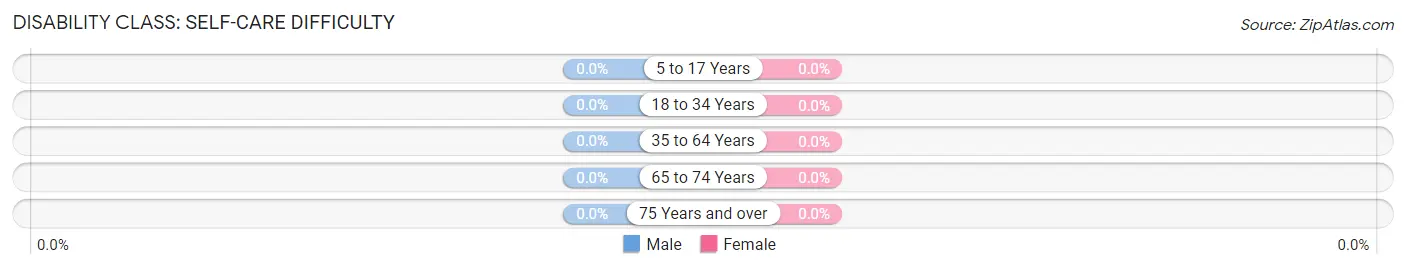
| Age Bracket | Male | Female |
| 5 to 17 Years | 0 (0.0%) | 0 (0.0%) |
| 18 to 34 Years | 0 (0.0%) | 0 (0.0%) |
| 35 to 64 Years | 0 (0.0%) | 0 (0.0%) |
| 65 to 74 Years | 0 (0.0%) | 0 (0.0%) |
| 75 Years and over | 0 (0.0%) | 0 (0.0%) |
Technology Access in Castalian Springs
Computing Device Access in Castalian Springs
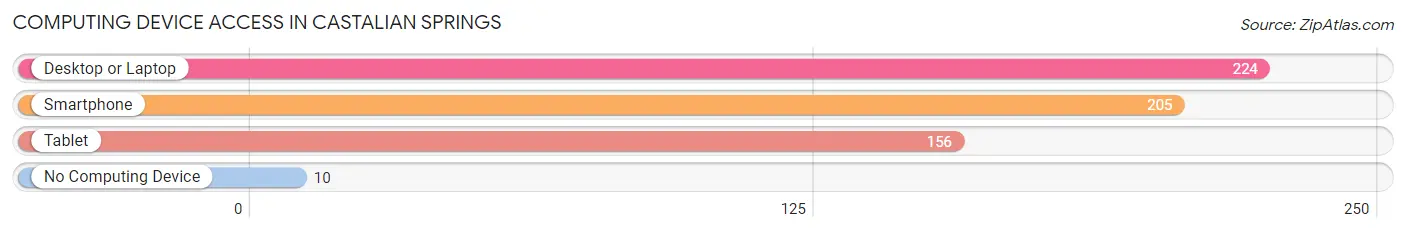
| Device Type | # Households | % Households |
| Desktop or Laptop | 224 | 90.0% |
| Smartphone | 205 | 82.3% |
| Tablet | 156 | 62.6% |
| No Computing Device | 10 | 4.0% |
| Total | 249 | 100.0% |
Internet Access in Castalian Springs
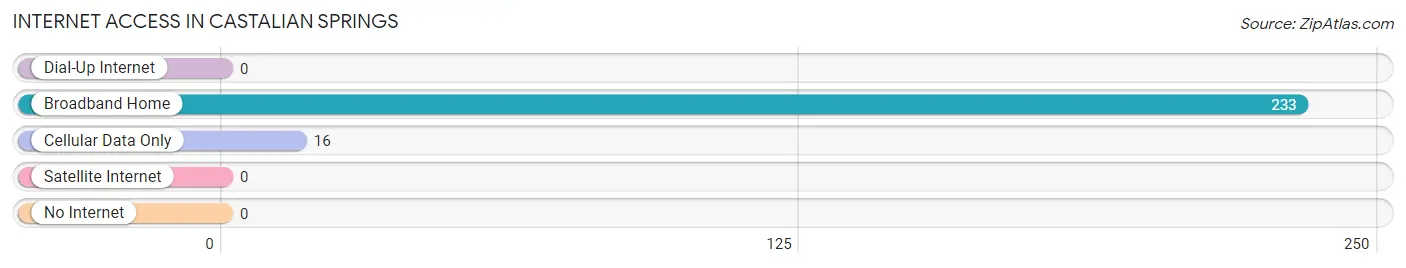
| Internet Type | # Households | % Households |
| Dial-Up Internet | 0 | 0.0% |
| Broadband Home | 233 | 93.6% |
| Cellular Data Only | 16 | 6.4% |
| Satellite Internet | 0 | 0.0% |
| No Internet | 0 | 0.0% |
| Total | 249 | 100.0% |
Castalian Springs Summary
Castalian Springs is a small unincorporated community located in Sumner County, Tennessee. It is situated along the banks of the Cumberland River, approximately 25 miles northeast of Nashville. The community was founded in 1802 by William Edmiston, who named it after the Castalian Springs of ancient Greece. The area was originally inhabited by Native Americans, and the first settlers were mostly Scots-Irish immigrants.
History
The area that is now Castalian Springs was originally inhabited by Native Americans, including the Cherokee, Chickasaw, and Shawnee tribes. The first European settlers arrived in the area in the late 1700s, and the community was officially founded in 1802 by William Edmiston. Edmiston named the community after the Castalian Springs of ancient Greece, which were believed to have healing properties.
The area quickly grew in popularity, and by the mid-1800s, it was a popular destination for travelers and tourists. The area was known for its mineral springs, which were believed to have healing properties. The springs were also used to power a grist mill, which was built in 1820.
In the late 1800s, the area began to decline in popularity, and by the early 1900s, the springs had dried up. The grist mill was abandoned, and the area became a quiet farming community.
Geography
Castalian Springs is located in Sumner County, Tennessee, approximately 25 miles northeast of Nashville. It is situated along the banks of the Cumberland River, and is surrounded by rolling hills and farmland. The area is known for its natural beauty, and is home to several parks and recreational areas.
The climate in Castalian Springs is humid subtropical, with hot summers and mild winters. The average annual temperature is around 60 degrees Fahrenheit, and the average annual precipitation is around 45 inches.
Economy
The economy of Castalian Springs is largely based on agriculture. The area is home to several farms, and the main crops grown in the area are corn, soybeans, and hay. The area is also home to several small businesses, including restaurants, shops, and service providers.
Demographics
As of the 2010 census, the population of Castalian Springs was 1,845. The racial makeup of the town was 94.3% White, 2.2% African American, 0.3% Native American, 0.7% Asian, and 2.5% from other races. The median household income was $45,000, and the median age was 40.
Conclusion
Castalian Springs is a small unincorporated community located in Sumner County, Tennessee. It was founded in 1802 by William Edmiston, and was originally known for its mineral springs. The area is now a quiet farming community, and the economy is largely based on agriculture. The population of Castalian Springs is 1,845, and the median household income is $45,000.
Common Questions
What is Per Capita Income in Castalian Springs?
Per Capita income in Castalian Springs is $37,322.
What is the Median Family Income in Castalian Springs?
Median Family Income in Castalian Springs is $112,609.
What is the Median Household income in Castalian Springs?
Median Household Income in Castalian Springs is $81,016.
What is Inequality or Gini Index in Castalian Springs?
Inequality or Gini Index in Castalian Springs is 0.35.
What is the Total Population of Castalian Springs?
Total Population of Castalian Springs is 620.
What is the Total Male Population of Castalian Springs?
Total Male Population of Castalian Springs is 300.
What is the Total Female Population of Castalian Springs?
Total Female Population of Castalian Springs is 320.
What is the Ratio of Males per 100 Females in Castalian Springs?
There are 93.75 Males per 100 Females in Castalian Springs.
What is the Ratio of Females per 100 Males in Castalian Springs?
There are 106.67 Females per 100 Males in Castalian Springs.
What is the Median Population Age in Castalian Springs?
Median Population Age in Castalian Springs is 45.0 Years.
What is the Average Family Size in Castalian Springs
Average Family Size in Castalian Springs is 3.0 People.
What is the Average Household Size in Castalian Springs
Average Household Size in Castalian Springs is 2.5 People.
How Large is the Labor Force in Castalian Springs?
There are 346 People in the Labor Forcein in Castalian Springs.
What is the Percentage of People in the Labor Force in Castalian Springs?
64.8% of People are in the Labor Force in Castalian Springs.