Zip Codes with the Highest Percentage of Households with Income Above $200,000 in Crossville, TN
RELATED REPORTS & OPTIONS
Household Income | $200k+
Crossville
Compare Zip Codes
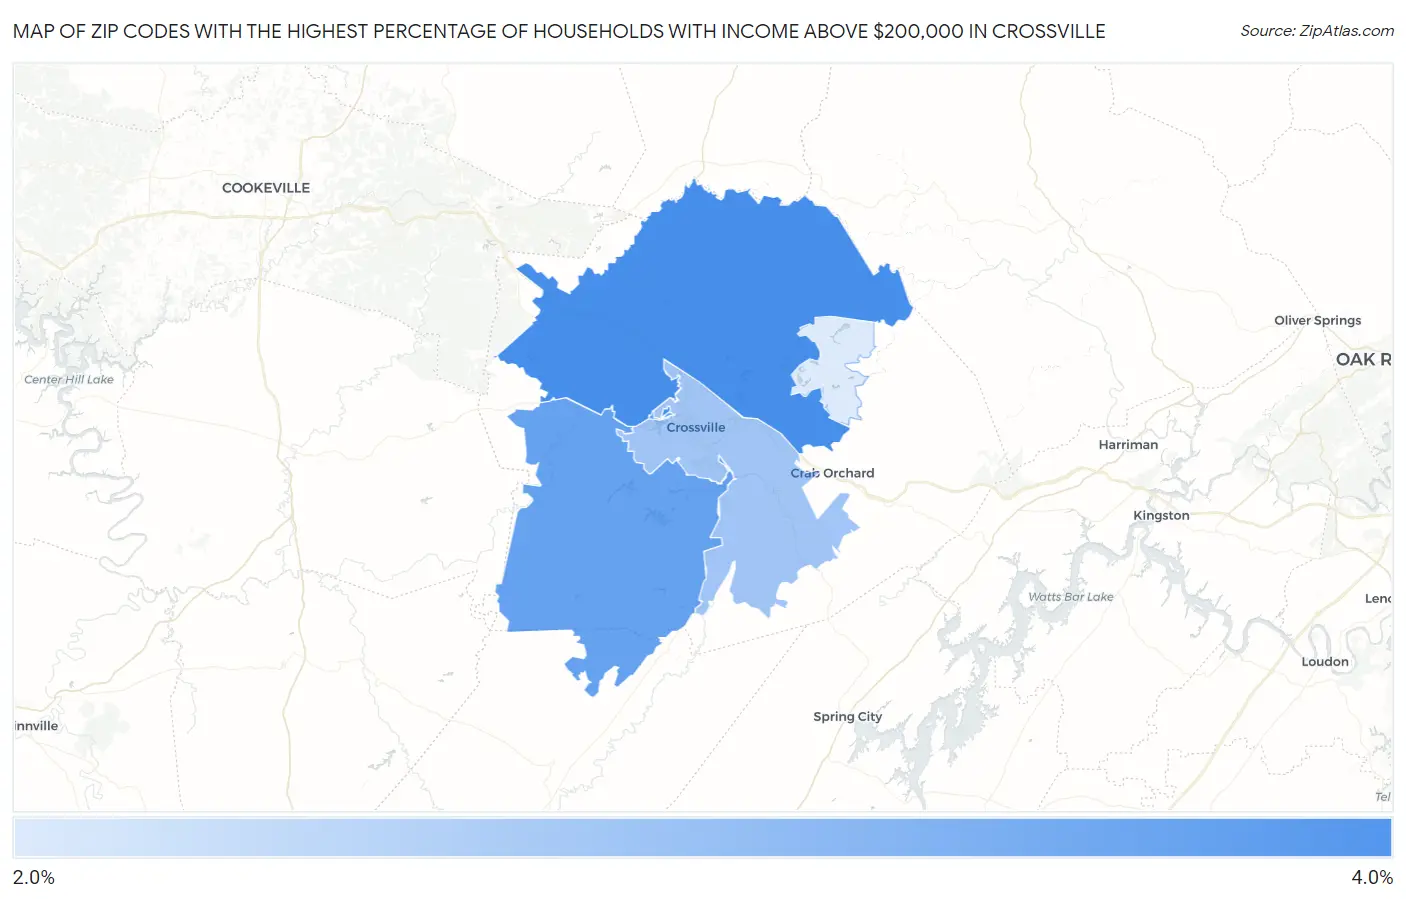
Map of Zip Codes with the Highest Percentage of Households with Income Above $200,000 in Crossville
2.6%
3.6%
Zip Codes with the Highest Percentage of Households with Income Above $200,000 in Crossville, TN
| Zip Code | Households with Income > $200k | vs State | vs National | |
| 1. | 38571 | 3.6% | 7.3%(-3.70)#288 | 11.4%(-7.80)#19,193 |
| 2. | 38572 | 3.4% | 7.3%(-3.90)#300 | 11.4%(-8.00)#19,741 |
| 3. | 38555 | 3.0% | 7.3%(-4.30)#339 | 11.4%(-8.40)#20,908 |
| 4. | 38558 | 2.6% | 7.3%(-4.70)#382 | 11.4%(-8.80)#22,079 |
1
Common Questions
What are the Top 3 Zip Codes with the Highest Percentage of Households with Income Above $200,000 in Crossville, TN?
Top 3 Zip Codes with the Highest Percentage of Households with Income Above $200,000 in Crossville, TN are:
What zip code has the Highest Percentage of Households with Income Above $200,000 in Crossville, TN?
38571 has the Highest Percentage of Households with Income Above $200,000 in Crossville, TN with 3.6%.
What is the Percentage of Households with Income Above $200,000 in Crossville, TN?
Percentage of Households with Income Above $200,000 in Crossville is 2.1%.
What is the Percentage of Households with Income Above $200,000 in Tennessee?
Percentage of Households with Income Above $200,000 in Tennessee is 7.3%.
What is the Percentage of Households with Income Above $200,000 in the United States?
Percentage of Households with Income Above $200,000 in the United States is 11.4%.