Zip Codes with the Highest Percentage of Population with a Degree in Visual and Performing Arts in Steubenville, OH
RELATED REPORTS & OPTIONS
Visual and Performing Arts
Steubenville
Compare Zip Codes
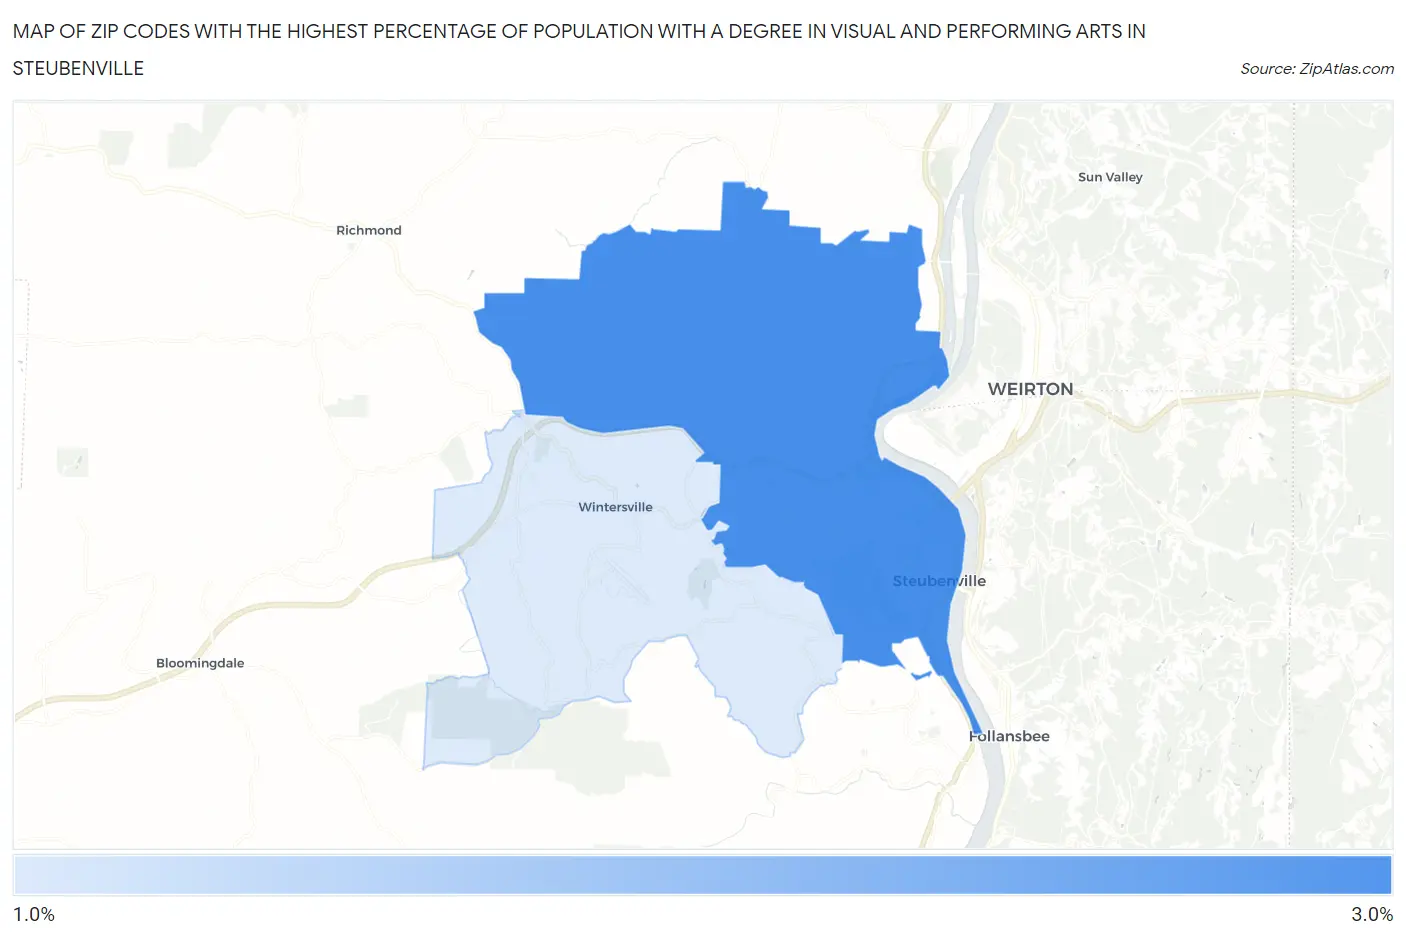
Map of Zip Codes with the Highest Percentage of Population with a Degree in Visual and Performing Arts in Steubenville
1.9%
2.6%
Zip Codes with the Highest Percentage of Population with a Degree in Visual and Performing Arts in Steubenville, OH
| Zip Code | % Graduates | vs State | vs National | |
| 1. | 43952 | 2.6% | 3.7%(-1.09)#513 | 4.3%(-1.63)#14,170 |
| 2. | 43953 | 1.9% | 3.7%(-1.81)#616 | 4.3%(-2.36)#16,806 |
1
Common Questions
What are the Top Zip Codes with the Highest Percentage of Population with a Degree in Visual and Performing Arts in Steubenville, OH?
Top Zip Codes with the Highest Percentage of Population with a Degree in Visual and Performing Arts in Steubenville, OH are:
What zip code has the Highest Percentage of Population with a Degree in Visual and Performing Arts in Steubenville, OH?
43952 has the Highest Percentage of Population with a Degree in Visual and Performing Arts in Steubenville, OH with 2.6%.
What is the Percentage of Population with a Degree in Visual and Performing Arts in Steubenville, OH?
Percentage of Population with a Degree in Visual and Performing Arts in Steubenville is 2.1%.
What is the Percentage of Population with a Degree in Visual and Performing Arts in Ohio?
Percentage of Population with a Degree in Visual and Performing Arts in Ohio is 3.7%.
What is the Percentage of Population with a Degree in Visual and Performing Arts in the United States?
Percentage of Population with a Degree in Visual and Performing Arts in the United States is 4.3%.