Zip Codes with the Highest Percentage of Population with a Degree in Visual and Performing Arts in Akron, OH
RELATED REPORTS & OPTIONS
Visual and Performing Arts
Akron
Compare Zip Codes
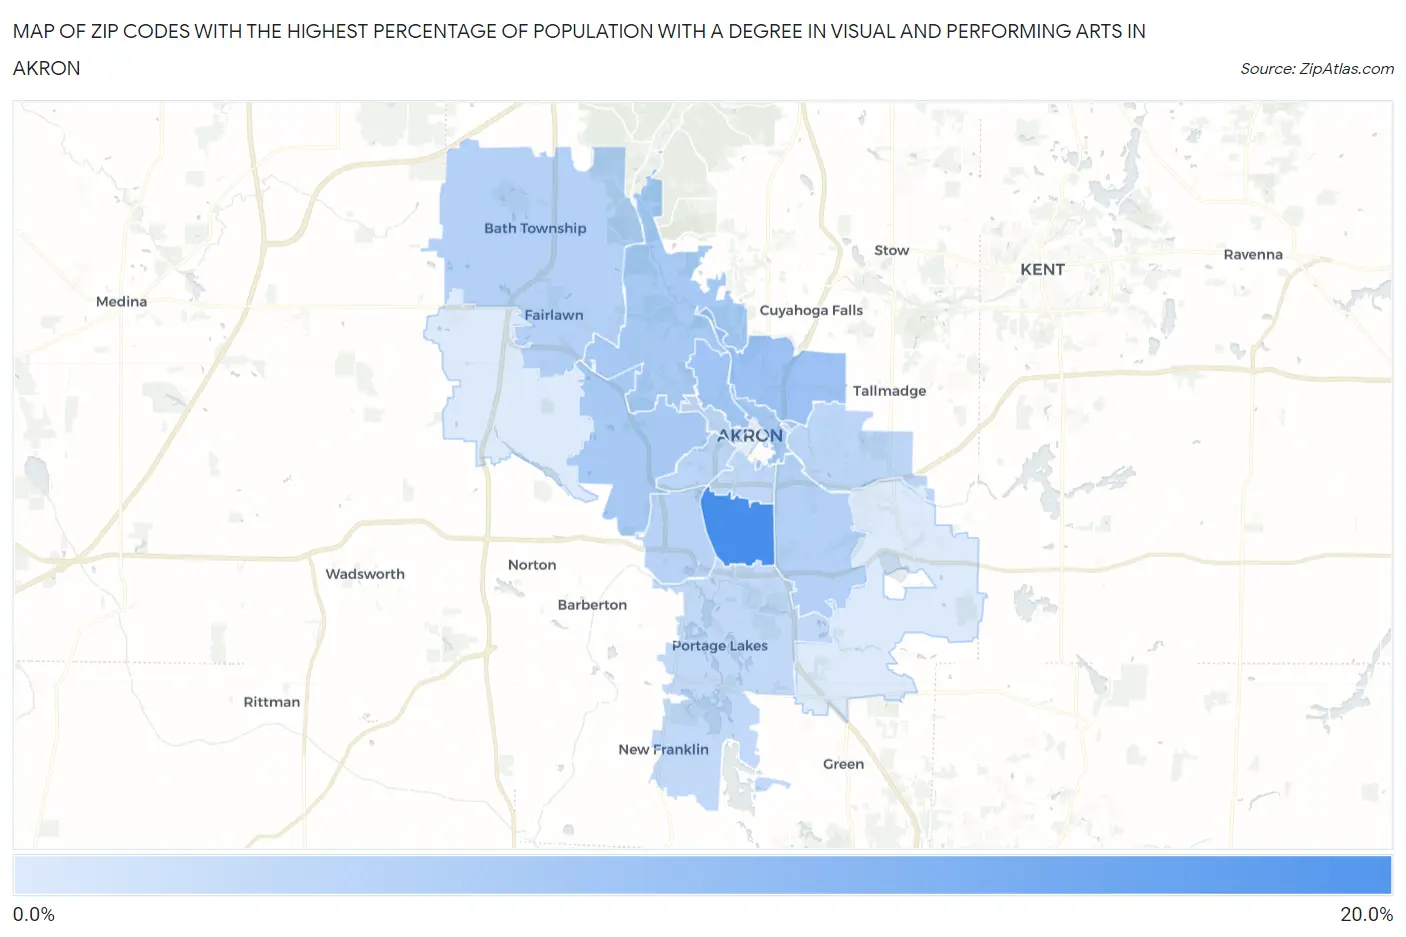
Map of Zip Codes with the Highest Percentage of Population with a Degree in Visual and Performing Arts in Akron
1.9%
15.1%
Zip Codes with the Highest Percentage of Population with a Degree in Visual and Performing Arts in Akron, OH
| Zip Code | % Graduates | vs State | vs National | |
| 1. | 44301 | 15.1% | 3.7%(+11.4)#32 | 4.3%(+10.9)#796 |
| 2. | 44310 | 7.4% | 3.7%(+3.70)#119 | 4.3%(+3.15)#3,296 |
| 3. | 44303 | 7.0% | 3.7%(+3.25)#136 | 4.3%(+2.71)#3,702 |
| 4. | 44304 | 6.7% | 3.7%(+2.95)#147 | 4.3%(+2.40)#4,053 |
| 5. | 44320 | 6.5% | 3.7%(+2.78)#152 | 4.3%(+2.24)#4,235 |
| 6. | 44313 | 6.4% | 3.7%(+2.66)#157 | 4.3%(+2.12)#4,374 |
| 7. | 44333 | 5.5% | 3.7%(+1.80)#200 | 4.3%(+1.26)#5,664 |
| 8. | 44306 | 5.5% | 3.7%(+1.79)#203 | 4.3%(+1.25)#5,685 |
| 9. | 44314 | 5.0% | 3.7%(+1.30)#233 | 4.3%(+0.754)#6,618 |
| 10. | 44307 | 4.9% | 3.7%(+1.14)#249 | 4.3%(+0.601)#6,969 |
| 11. | 44302 | 4.7% | 3.7%(+1.00)#258 | 4.3%(+0.463)#7,268 |
| 12. | 44305 | 4.7% | 3.7%(+0.966)#263 | 4.3%(+0.425)#7,349 |
| 13. | 44311 | 4.5% | 3.7%(+0.741)#286 | 4.3%(+0.200)#7,936 |
| 14. | 44319 | 4.2% | 3.7%(+0.500)#305 | 4.3%(-0.042)#8,590 |
| 15. | 44321 | 2.0% | 3.7%(-1.76)#605 | 4.3%(-2.30)#16,610 |
| 16. | 44312 | 1.9% | 3.7%(-1.80)#612 | 4.3%(-2.34)#16,745 |
1
Common Questions
What are the Top 10 Zip Codes with the Highest Percentage of Population with a Degree in Visual and Performing Arts in Akron, OH?
Top 10 Zip Codes with the Highest Percentage of Population with a Degree in Visual and Performing Arts in Akron, OH are:
What zip code has the Highest Percentage of Population with a Degree in Visual and Performing Arts in Akron, OH?
44301 has the Highest Percentage of Population with a Degree in Visual and Performing Arts in Akron, OH with 15.1%.
What is the Percentage of Population with a Degree in Visual and Performing Arts in Akron, OH?
Percentage of Population with a Degree in Visual and Performing Arts in Akron is 6.4%.
What is the Percentage of Population with a Degree in Visual and Performing Arts in Ohio?
Percentage of Population with a Degree in Visual and Performing Arts in Ohio is 3.7%.
What is the Percentage of Population with a Degree in Visual and Performing Arts in the United States?
Percentage of Population with a Degree in Visual and Performing Arts in the United States is 4.3%.