Duncan Falls, OH Map & Demographics
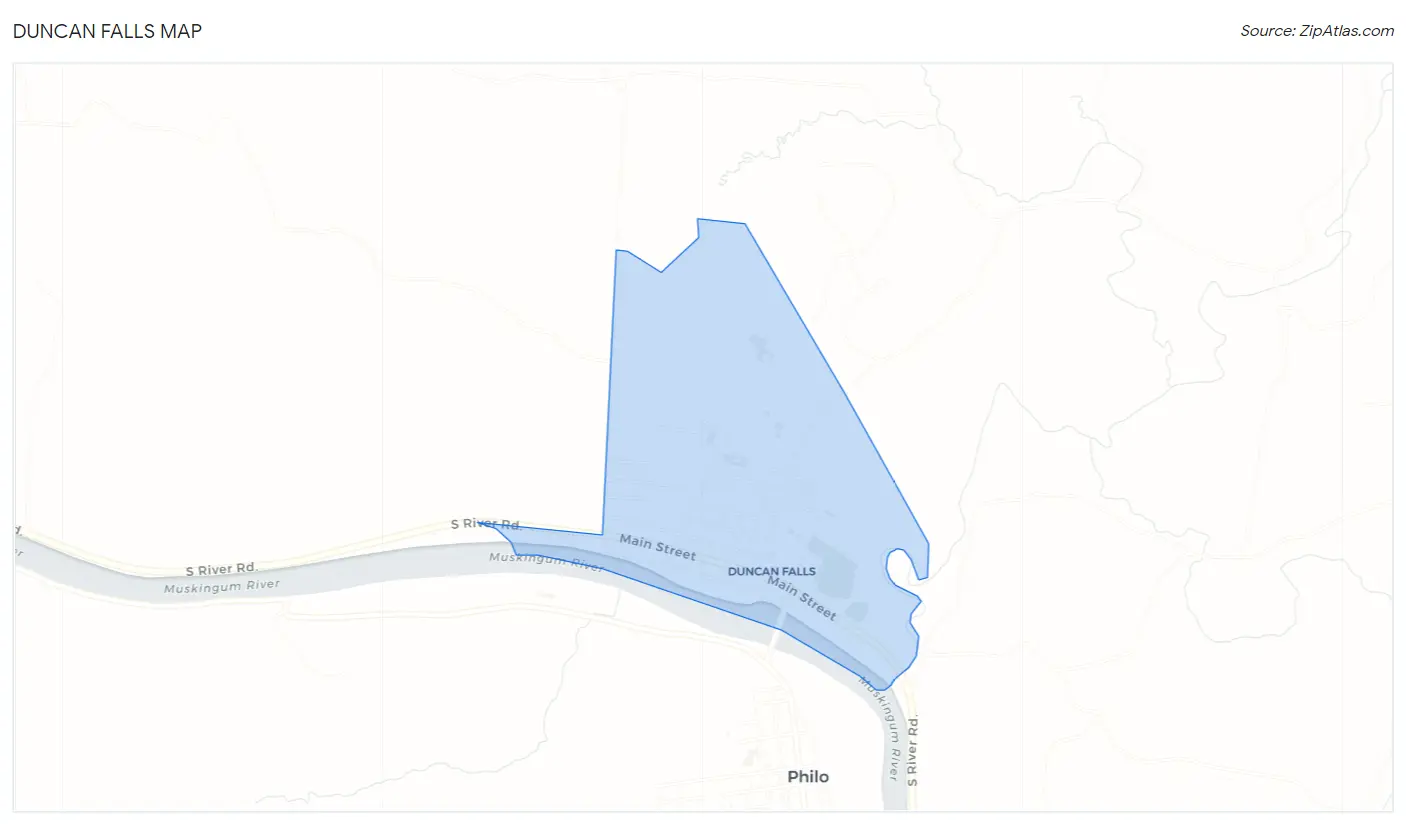
Duncan Falls Map
Duncan Falls Overview
$38,069
PER CAPITA INCOME
$105,670
AVG FAMILY INCOME
$91,875
AVG HOUSEHOLD INCOME
0.36
INEQUALITY / GINI INDEX
1,577
TOTAL POPULATION
843
MALE POPULATION
734
FEMALE POPULATION
114.85
MALES / 100 FEMALES
87.07
FEMALES / 100 MALES
35.4
MEDIAN AGE
3.1
AVG FAMILY SIZE
3.1
AVG HOUSEHOLD SIZE
767
LABOR FORCE [ PEOPLE ]
62.2%
PERCENT IN LABOR FORCE
4.6%
UNEMPLOYMENT RATE
Duncan Falls Zip Codes
Duncan Falls Area Codes
Income in Duncan Falls
Income Overview in Duncan Falls
Per Capita Income in Duncan Falls is $38,069, while median incomes of families and households are $105,670 and $91,875 respectively.
| Characteristic | Number | Measure |
| Per Capita Income | 1,577 | $38,069 |
| Median Family Income | 441 | $105,670 |
| Mean Family Income | 441 | $125,830 |
| Median Household Income | 502 | $91,875 |
| Mean Household Income | 502 | $119,983 |
| Income Deficit | 441 | $0 |
| Wage / Income Gap (%) | 1,577 | 0.00% |
| Wage / Income Gap ($) | 1,577 | 100.00¢ per $1 |
| Gini / Inequality Index | 1,577 | 0.36 |
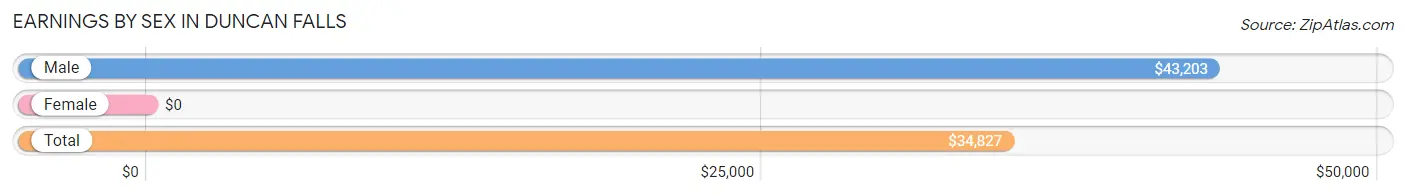
Earnings by Sex in Duncan Falls
| Sex | Number | Average Earnings |
| Male | 517 (56.4%) | $43,203 |
| Female | 400 (43.6%) | $0 |
| Total | 917 (100.0%) | $34,827 |
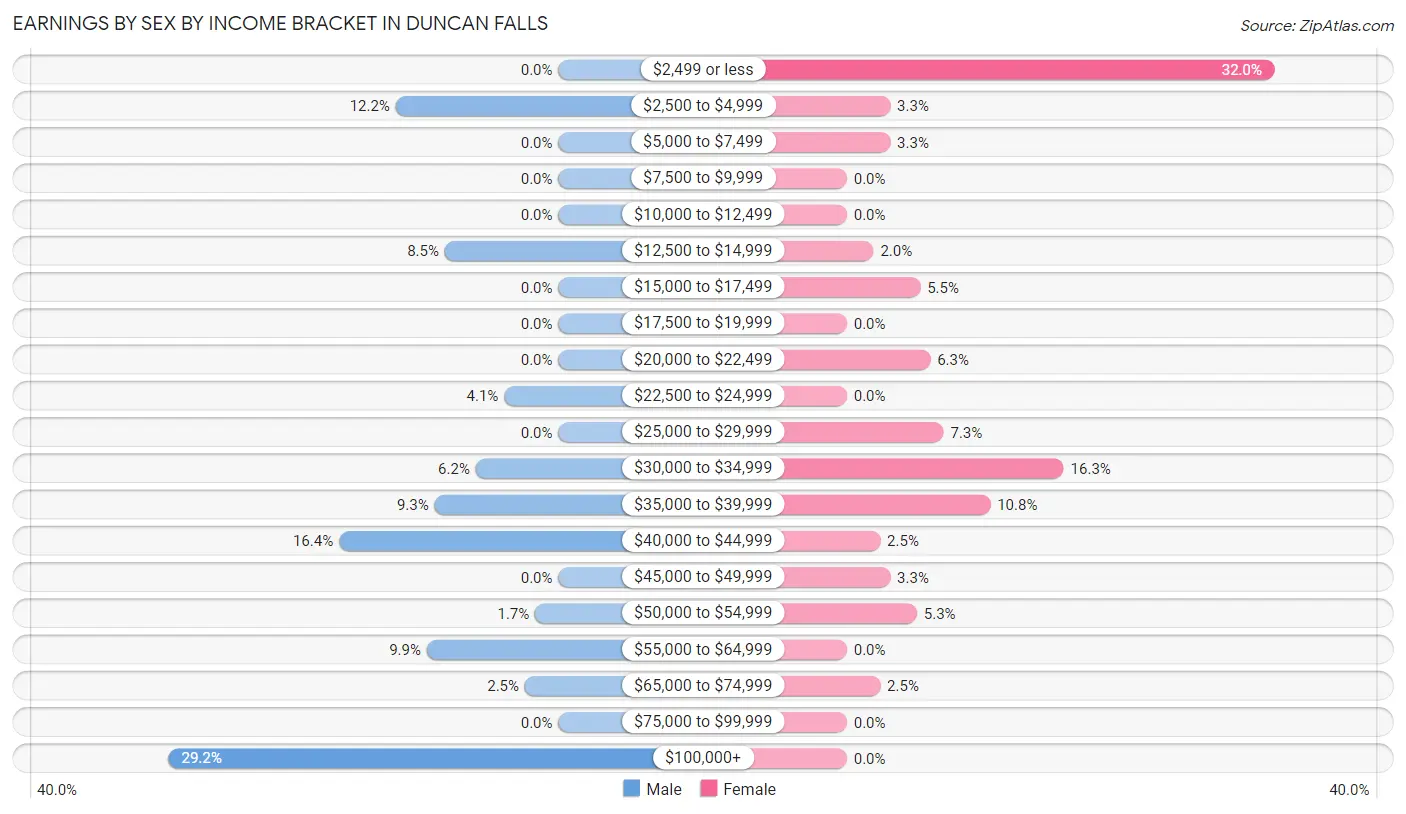
Earnings by Sex by Income Bracket in Duncan Falls
The most common earnings brackets in Duncan Falls are $100,000+ for men (151 | 29.2%) and $2,499 or less for women (128 | 32.0%).
| Income | Male | Female |
| $2,499 or less | 0 (0.0%) | 128 (32.0%) |
| $2,500 to $4,999 | 63 (12.2%) | 13 (3.3%) |
| $5,000 to $7,499 | 0 (0.0%) | 13 (3.3%) |
| $7,500 to $9,999 | 0 (0.0%) | 0 (0.0%) |
| $10,000 to $12,499 | 0 (0.0%) | 0 (0.0%) |
| $12,500 to $14,999 | 44 (8.5%) | 8 (2.0%) |
| $15,000 to $17,499 | 0 (0.0%) | 22 (5.5%) |
| $17,500 to $19,999 | 0 (0.0%) | 0 (0.0%) |
| $20,000 to $22,499 | 0 (0.0%) | 25 (6.2%) |
| $22,500 to $24,999 | 21 (4.1%) | 0 (0.0%) |
| $25,000 to $29,999 | 0 (0.0%) | 29 (7.2%) |
| $30,000 to $34,999 | 32 (6.2%) | 65 (16.3%) |
| $35,000 to $39,999 | 48 (9.3%) | 43 (10.7%) |
| $40,000 to $44,999 | 85 (16.4%) | 10 (2.5%) |
| $45,000 to $49,999 | 0 (0.0%) | 13 (3.3%) |
| $50,000 to $54,999 | 9 (1.7%) | 21 (5.2%) |
| $55,000 to $64,999 | 51 (9.9%) | 0 (0.0%) |
| $65,000 to $74,999 | 13 (2.5%) | 10 (2.5%) |
| $75,000 to $99,999 | 0 (0.0%) | 0 (0.0%) |
| $100,000+ | 151 (29.2%) | 0 (0.0%) |
| Total | 517 (100.0%) | 400 (100.0%) |
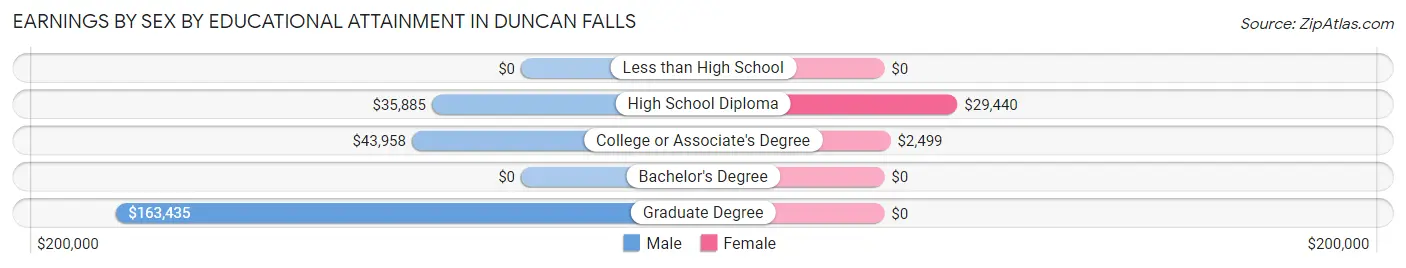
Earnings by Sex by Educational Attainment in Duncan Falls
| Educational Attainment | Male Income | Female Income |
| Less than High School | - | - |
| High School Diploma | $35,885 | $29,440 |
| College or Associate's Degree | $43,958 | $2,499 |
| Bachelor's Degree | - | - |
| Graduate Degree | $163,435 | $0 |
| Total | $44,609 | $0 |
Family Income in Duncan Falls
Family Income Brackets in Duncan Falls
According to the Duncan Falls family income data, there are 151 families falling into the $200,000+ income range, which is the most common income bracket and makes up 34.2% of all families.
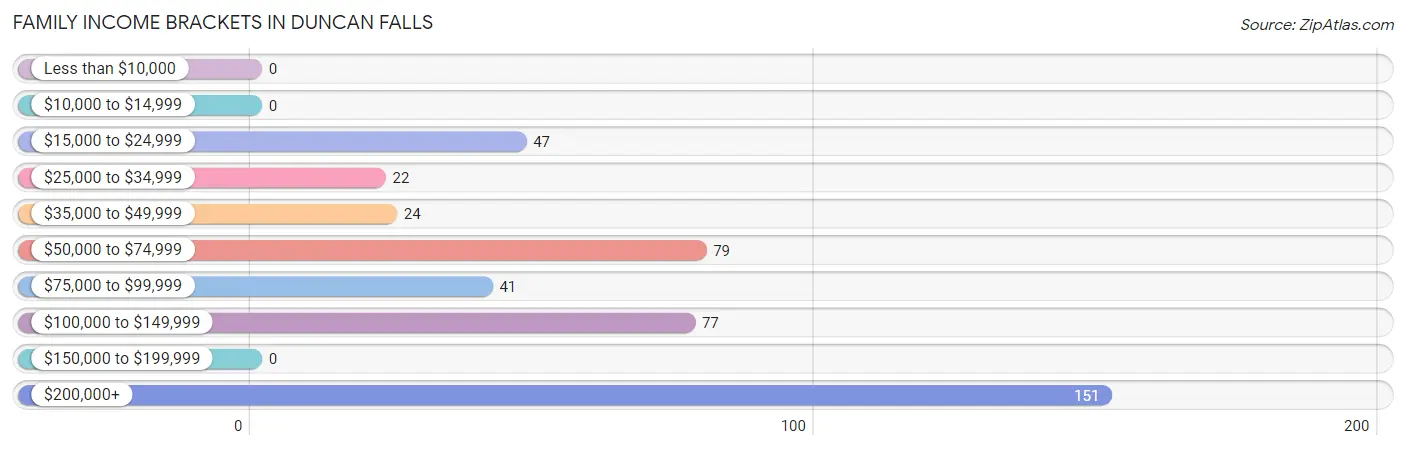
| Income Bracket | # Families | % Families |
| Less than $10,000 | 0 | 0.0% |
| $10,000 to $14,999 | 0 | 0.0% |
| $15,000 to $24,999 | 47 | 10.7% |
| $25,000 to $34,999 | 22 | 5.0% |
| $35,000 to $49,999 | 24 | 5.4% |
| $50,000 to $74,999 | 79 | 17.9% |
| $75,000 to $99,999 | 41 | 9.3% |
| $100,000 to $149,999 | 77 | 17.5% |
| $150,000 to $199,999 | 0 | 0.0% |
| $200,000+ | 151 | 34.2% |
Family Income by Famaliy Size in Duncan Falls
3-person families (191 | 43.3%) account for the highest median family income in Duncan Falls with $235,919 per family, while 3-person families (191 | 43.3%) have the highest median income of $78,640 per family member.
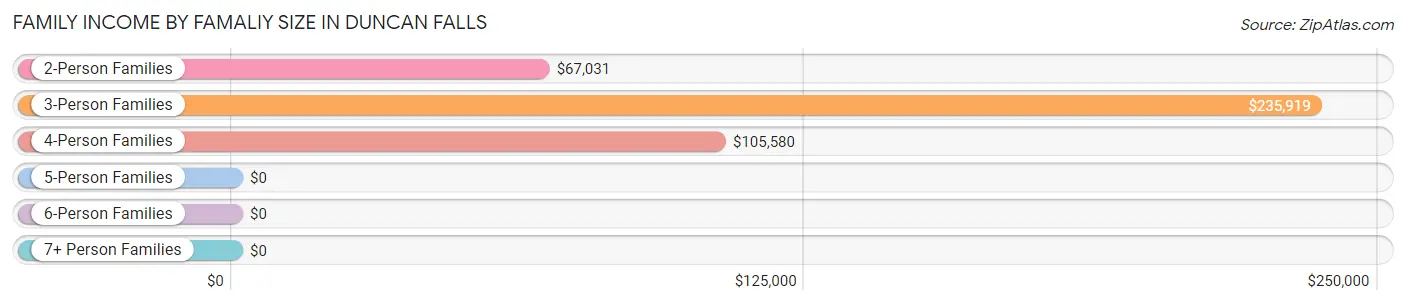
| Income Bracket | # Families | Median Income |
| 2-Person Families | 125 (28.3%) | $67,031 |
| 3-Person Families | 191 (43.3%) | $235,919 |
| 4-Person Families | 101 (22.9%) | $105,580 |
| 5-Person Families | 24 (5.4%) | $0 |
| 6-Person Families | 0 (0.0%) | $0 |
| 7+ Person Families | 0 (0.0%) | $0 |
| Total | 441 (100.0%) | $105,670 |
Family Income by Number of Earners in Duncan Falls
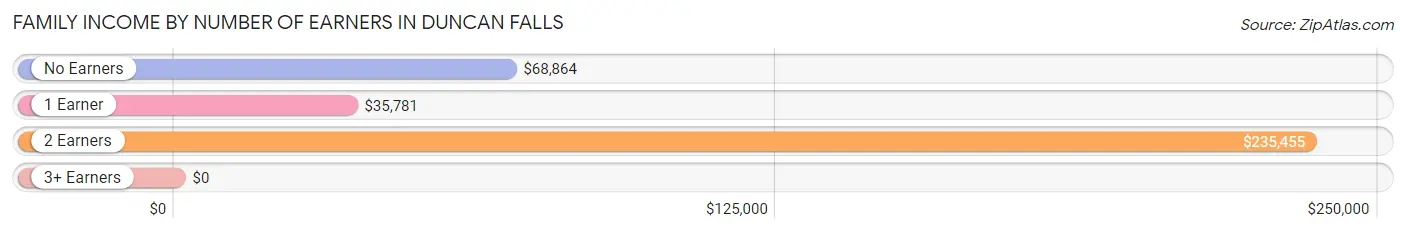
| Number of Earners | # Families | Median Income |
| No Earners | 28 (6.4%) | $68,864 |
| 1 Earner | 109 (24.7%) | $35,781 |
| 2 Earners | 247 (56.0%) | $235,455 |
| 3+ Earners | 57 (12.9%) | $0 |
| Total | 441 (100.0%) | $105,670 |
Household Income in Duncan Falls
Household Income Brackets in Duncan Falls
With 151 households falling in the category, the $200,000+ income range is the most frequent in Duncan Falls, accounting for 30.1% of all households.
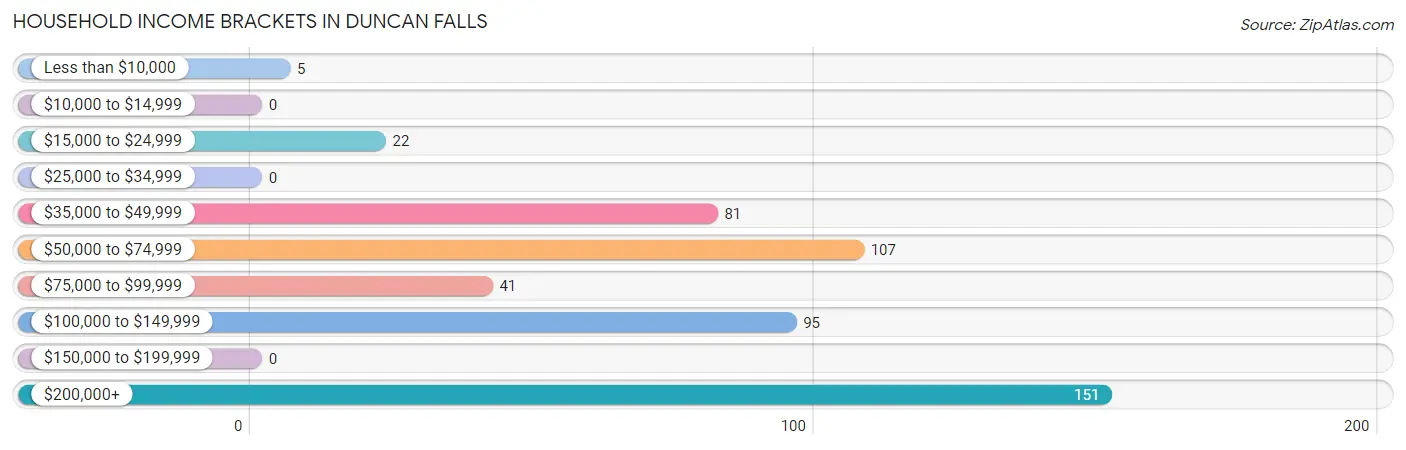
| Income Bracket | # Households | % Households |
| Less than $10,000 | 5 | 1.0% |
| $10,000 to $14,999 | 0 | 0.0% |
| $15,000 to $24,999 | 22 | 4.4% |
| $25,000 to $34,999 | 0 | 0.0% |
| $35,000 to $49,999 | 81 | 16.1% |
| $50,000 to $74,999 | 107 | 21.3% |
| $75,000 to $99,999 | 41 | 8.2% |
| $100,000 to $149,999 | 95 | 18.9% |
| $150,000 to $199,999 | 0 | 0.0% |
| $200,000+ | 151 | 30.1% |
Household Income by Householder Age in Duncan Falls
The median household income in Duncan Falls is $91,875, with the highest median household income of $235,853 found in the 65+ years age bracket for the primary householder. A total of 199 households (39.6%) fall into this category. Meanwhile, the 15 to 24 years age bracket for the primary householder has the lowest median household income of $0, with 5 households (1.0%) in this group.
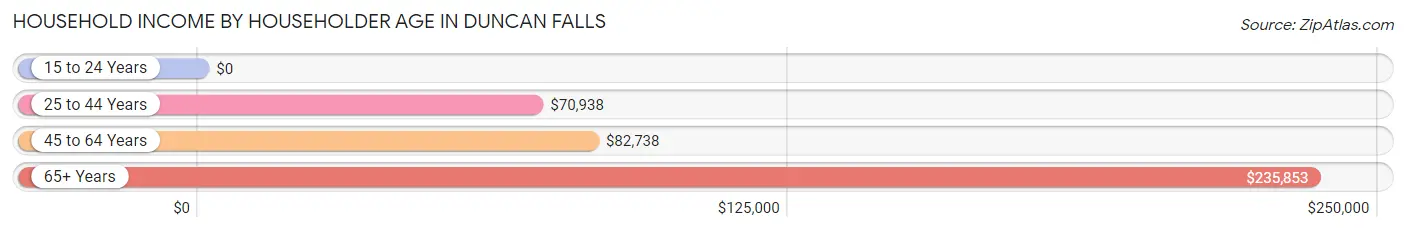
| Income Bracket | # Households | Median Income |
| 15 to 24 Years | 5 (1.0%) | $0 |
| 25 to 44 Years | 164 (32.7%) | $70,938 |
| 45 to 64 Years | 134 (26.7%) | $82,738 |
| 65+ Years | 199 (39.6%) | $235,853 |
| Total | 502 (100.0%) | $91,875 |
Poverty in Duncan Falls
Income Below Poverty by Sex and Age in Duncan Falls
With 7.0% poverty level for males and 5.8% for females among the residents of Duncan Falls, 15 year old males and 18 to 24 year old females are the most vulnerable to poverty, with 15 males (100.0%) and 5 females (100.0%) in their respective age groups living below the poverty level.
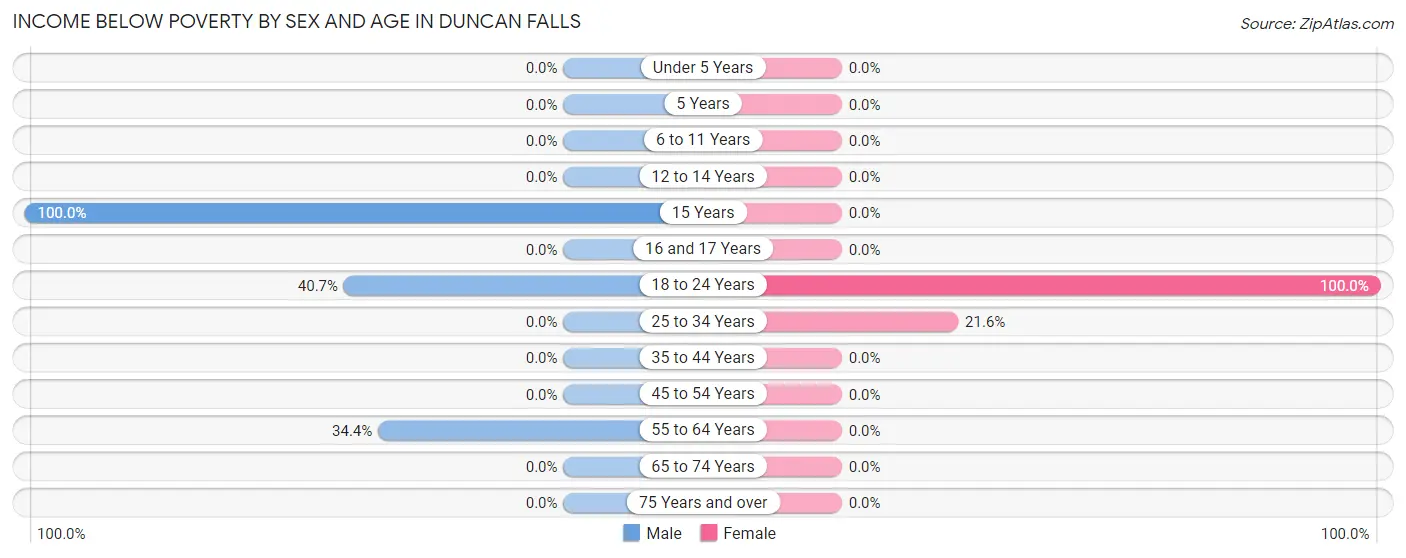
| Age Bracket | Male | Female |
| Under 5 Years | 0 (0.0%) | 0 (0.0%) |
| 5 Years | 0 (0.0%) | 0 (0.0%) |
| 6 to 11 Years | 0 (0.0%) | 0 (0.0%) |
| 12 to 14 Years | 0 (0.0%) | 0 (0.0%) |
| 15 Years | 15 (100.0%) | 0 (0.0%) |
| 16 and 17 Years | 0 (0.0%) | 0 (0.0%) |
| 18 to 24 Years | 22 (40.7%) | 5 (100.0%) |
| 25 to 34 Years | 0 (0.0%) | 35 (21.6%) |
| 35 to 44 Years | 0 (0.0%) | 0 (0.0%) |
| 45 to 54 Years | 0 (0.0%) | 0 (0.0%) |
| 55 to 64 Years | 22 (34.4%) | 0 (0.0%) |
| 65 to 74 Years | 0 (0.0%) | 0 (0.0%) |
| 75 Years and over | 0 (0.0%) | 0 (0.0%) |
| Total | 59 (7.0%) | 40 (5.8%) |
Income Above Poverty by Sex and Age in Duncan Falls
According to the poverty statistics in Duncan Falls, males aged under 5 years and females aged under 5 years are the age groups that are most secure financially, with 100.0% of males and 100.0% of females in these age groups living above the poverty line.
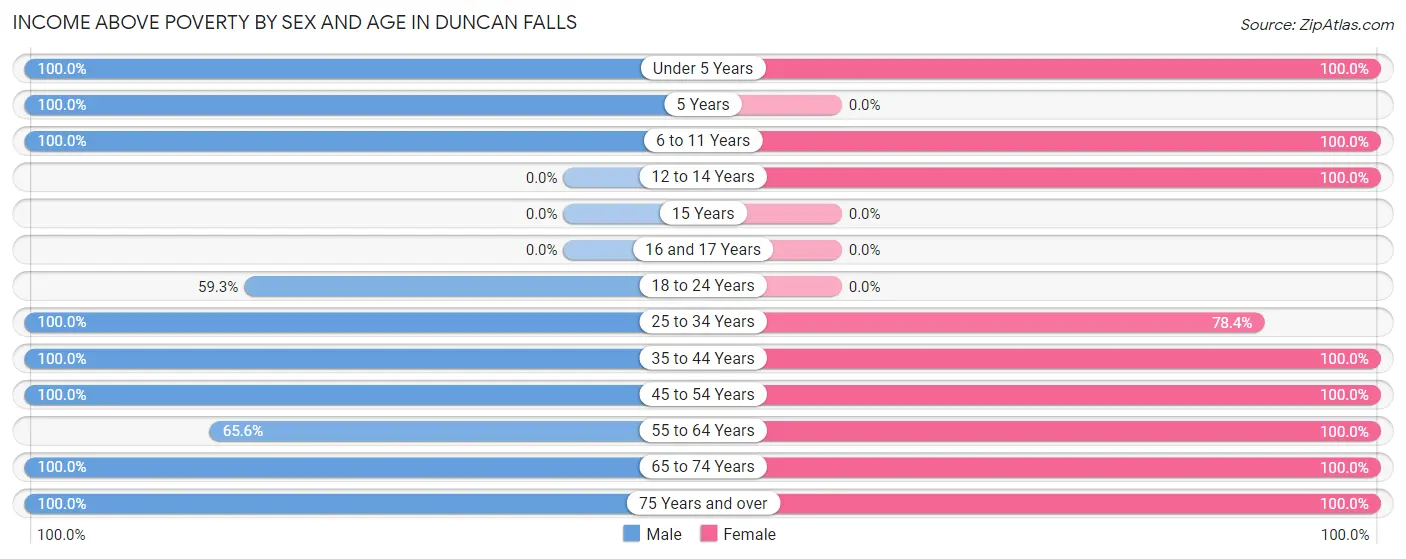
| Age Bracket | Male | Female |
| Under 5 Years | 99 (100.0%) | 15 (100.0%) |
| 5 Years | 25 (100.0%) | 0 (0.0%) |
| 6 to 11 Years | 99 (100.0%) | 19 (100.0%) |
| 12 to 14 Years | 0 (0.0%) | 31 (100.0%) |
| 15 Years | 0 (0.0%) | 0 (0.0%) |
| 16 and 17 Years | 0 (0.0%) | 0 (0.0%) |
| 18 to 24 Years | 32 (59.3%) | 0 (0.0%) |
| 25 to 34 Years | 218 (100.0%) | 127 (78.4%) |
| 35 to 44 Years | 33 (100.0%) | 181 (100.0%) |
| 45 to 54 Years | 46 (100.0%) | 101 (100.0%) |
| 55 to 64 Years | 42 (65.6%) | 10 (100.0%) |
| 65 to 74 Years | 181 (100.0%) | 159 (100.0%) |
| 75 Years and over | 9 (100.0%) | 10 (100.0%) |
| Total | 784 (93.0%) | 653 (94.2%) |
Income Below Poverty Among Married-Couple Families in Duncan Falls
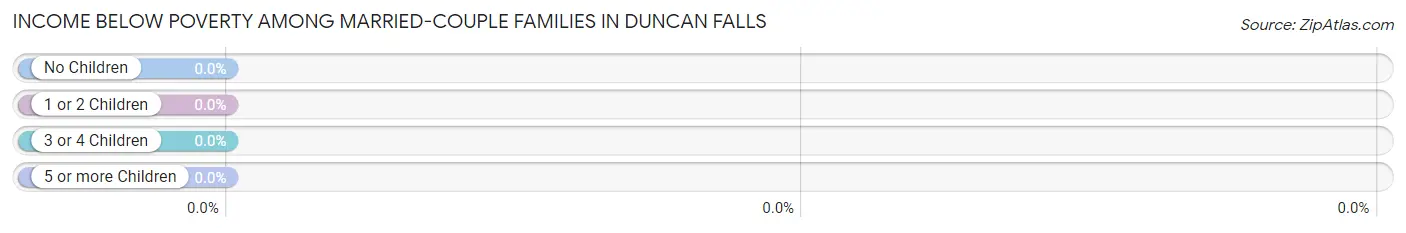
| Children | Above Poverty | Below Poverty |
| No Children | 279 (100.0%) | 0 (0.0%) |
| 1 or 2 Children | 62 (100.0%) | 0 (0.0%) |
| 3 or 4 Children | 0 (0.0%) | 0 (0.0%) |
| 5 or more Children | 0 (0.0%) | 0 (0.0%) |
| Total | 341 (100.0%) | 0 (0.0%) |
Income Below Poverty Among Single-Parent Households in Duncan Falls
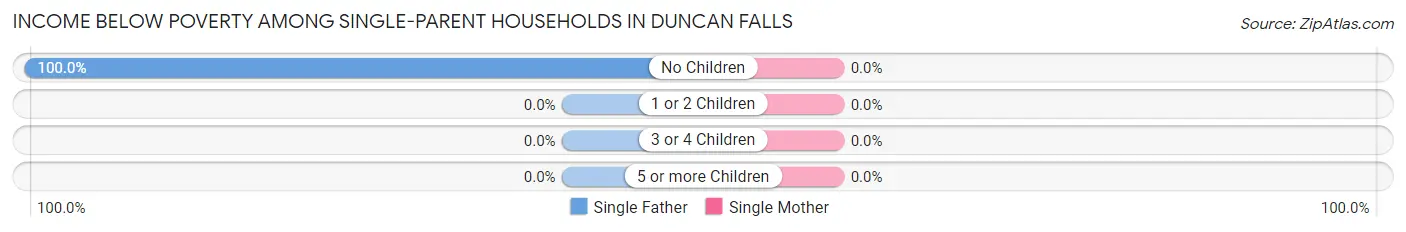
| Children | Single Father | Single Mother |
| No Children | 22 (100.0%) | 0 (0.0%) |
| 1 or 2 Children | 0 (0.0%) | 0 (0.0%) |
| 3 or 4 Children | 0 (0.0%) | 0 (0.0%) |
| 5 or more Children | 0 (0.0%) | 0 (0.0%) |
| Total | 22 (29.3%) | 0 (0.0%) |
Income Below Poverty Among Married-Couple vs Single-Parent Households in Duncan Falls
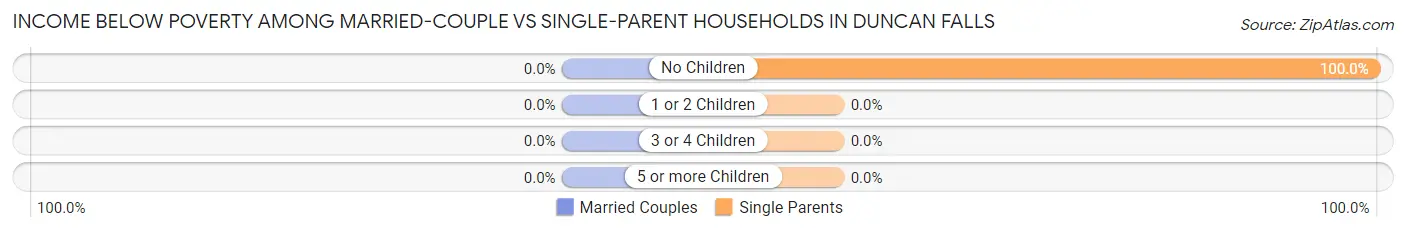
| Children | Married-Couple Families | Single-Parent Households |
| No Children | 0 (0.0%) | 22 (100.0%) |
| 1 or 2 Children | 0 (0.0%) | 0 (0.0%) |
| 3 or 4 Children | 0 (0.0%) | 0 (0.0%) |
| 5 or more Children | 0 (0.0%) | 0 (0.0%) |
| Total | 0 (0.0%) | 22 (22.0%) |
Race in Duncan Falls
The most populous races in Duncan Falls are White / Caucasian (1,555 | 98.6%), and Two or more Races (22 | 1.4%).
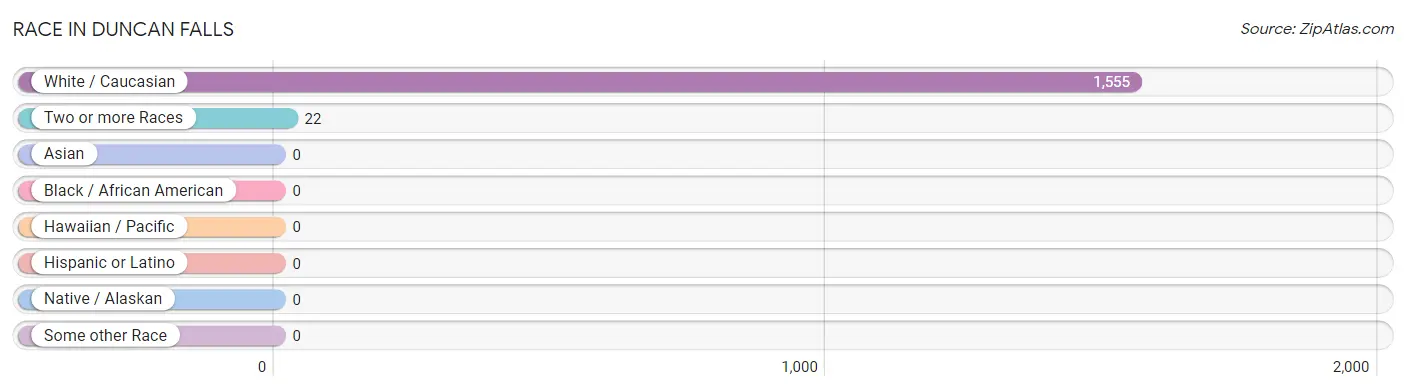
| Race | # Population | % Population |
| Asian | 0 | 0.0% |
| Black / African American | 0 | 0.0% |
| Hawaiian / Pacific | 0 | 0.0% |
| Hispanic or Latino | 0 | 0.0% |
| Native / Alaskan | 0 | 0.0% |
| White / Caucasian | 1,555 | 98.6% |
| Two or more Races | 22 | 1.4% |
| Some other Race | 0 | 0.0% |
| Total | 1,577 | 100.0% |
Ancestry in Duncan Falls
The most populous ancestries reported in Duncan Falls are English (497 | 31.5%), German (480 | 30.4%), American (160 | 10.2%), Scottish (89 | 5.6%), and Italian (32 | 2.0%), together accounting for 79.8% of all Duncan Falls residents.
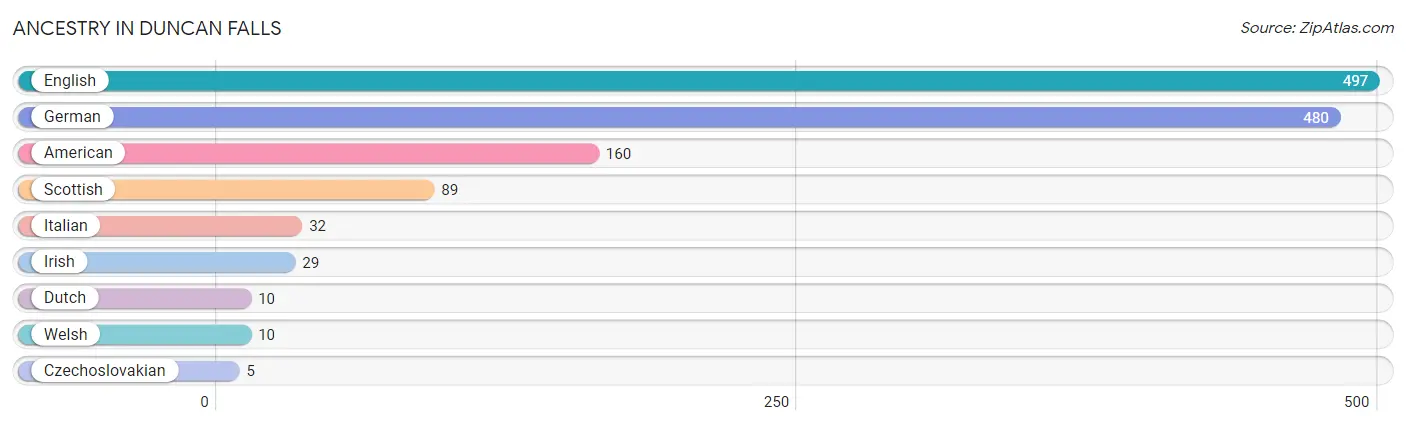
| Ancestry | # Population | % Population |
| American | 160 | 10.2% |
| Czechoslovakian | 5 | 0.3% |
| Dutch | 10 | 0.6% |
| English | 497 | 31.5% |
| German | 480 | 30.4% |
| Irish | 29 | 1.8% |
| Italian | 32 | 2.0% |
| Scottish | 89 | 5.6% |
| Welsh | 10 | 0.6% | View All 9 Rows |
Immigrants in Duncan Falls

| Immigration Origin | # Population | % Population | View All 0 Rows |
Sex and Age in Duncan Falls
Sex and Age in Duncan Falls
The most populous age groups in Duncan Falls are 65 to 69 Years (181 | 21.5%) for men and 40 to 44 Years (168 | 22.9%) for women.
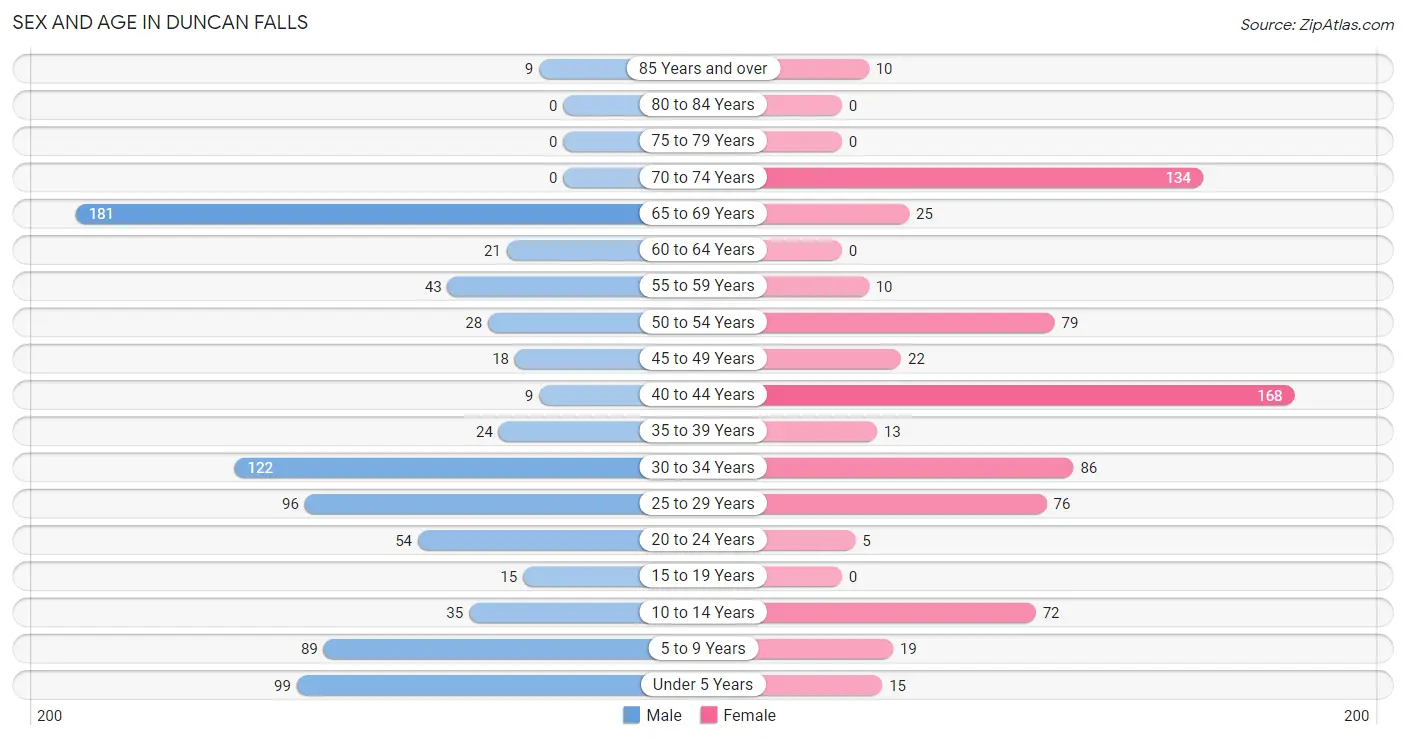
| Age Bracket | Male | Female |
| Under 5 Years | 99 (11.7%) | 15 (2.0%) |
| 5 to 9 Years | 89 (10.6%) | 19 (2.6%) |
| 10 to 14 Years | 35 (4.2%) | 72 (9.8%) |
| 15 to 19 Years | 15 (1.8%) | 0 (0.0%) |
| 20 to 24 Years | 54 (6.4%) | 5 (0.7%) |
| 25 to 29 Years | 96 (11.4%) | 76 (10.3%) |
| 30 to 34 Years | 122 (14.5%) | 86 (11.7%) |
| 35 to 39 Years | 24 (2.9%) | 13 (1.8%) |
| 40 to 44 Years | 9 (1.1%) | 168 (22.9%) |
| 45 to 49 Years | 18 (2.1%) | 22 (3.0%) |
| 50 to 54 Years | 28 (3.3%) | 79 (10.8%) |
| 55 to 59 Years | 43 (5.1%) | 10 (1.4%) |
| 60 to 64 Years | 21 (2.5%) | 0 (0.0%) |
| 65 to 69 Years | 181 (21.5%) | 25 (3.4%) |
| 70 to 74 Years | 0 (0.0%) | 134 (18.3%) |
| 75 to 79 Years | 0 (0.0%) | 0 (0.0%) |
| 80 to 84 Years | 0 (0.0%) | 0 (0.0%) |
| 85 Years and over | 9 (1.1%) | 10 (1.4%) |
| Total | 843 (100.0%) | 734 (100.0%) |
Families and Households in Duncan Falls
Median Family Size in Duncan Falls
The median family size in Duncan Falls is 3.08 persons per family, with single male/father families (75 | 17.0%) accounting for the largest median family size of 3.41 persons per family. On the other hand, single female/mother families (25 | 5.7%) represent the smallest median family size with 2.08 persons per family.
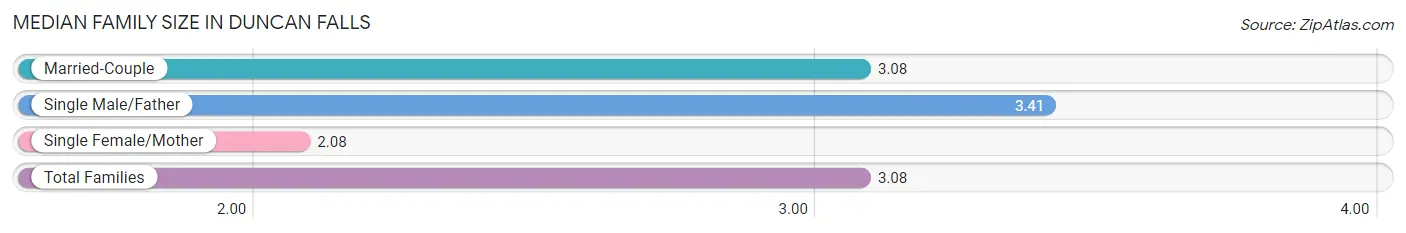
| Family Type | # Families | Family Size |
| Married-Couple | 341 (77.3%) | 3.08 |
| Single Male/Father | 75 (17.0%) | 3.41 |
| Single Female/Mother | 25 (5.7%) | 2.08 |
| Total Families | 441 (100.0%) | 3.08 |
Median Household Size in Duncan Falls
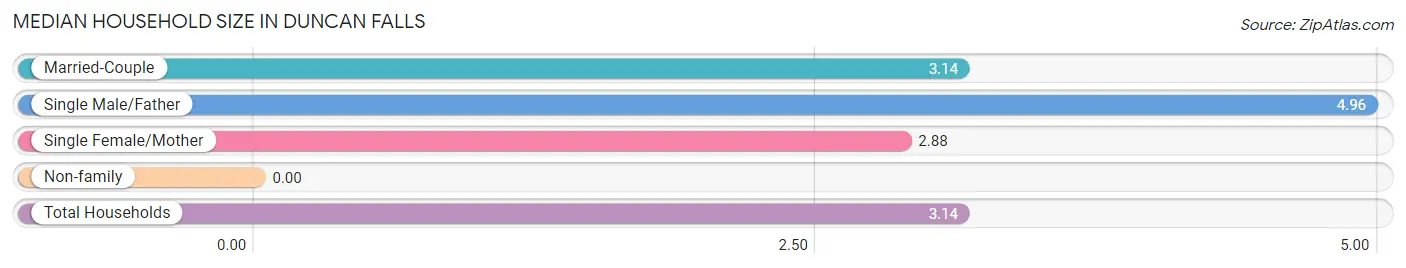
| Household Type | # Households | Household Size |
| Married-Couple | 341 (67.9%) | 3.14 |
| Single Male/Father | 75 (14.9%) | 4.96 |
| Single Female/Mother | 25 (5.0%) | 2.88 |
| Non-family | 61 (12.1%) | - |
| Total Households | 502 (100.0%) | 3.14 |
Household Size by Marriage Status in Duncan Falls
Out of a total of 502 households in Duncan Falls, 441 (87.8%) are family households, while 61 (12.1%) are nonfamily households. The most numerous type of family households are 3-person households, comprising 176, and the most common type of nonfamily households are 1-person households, comprising 61.
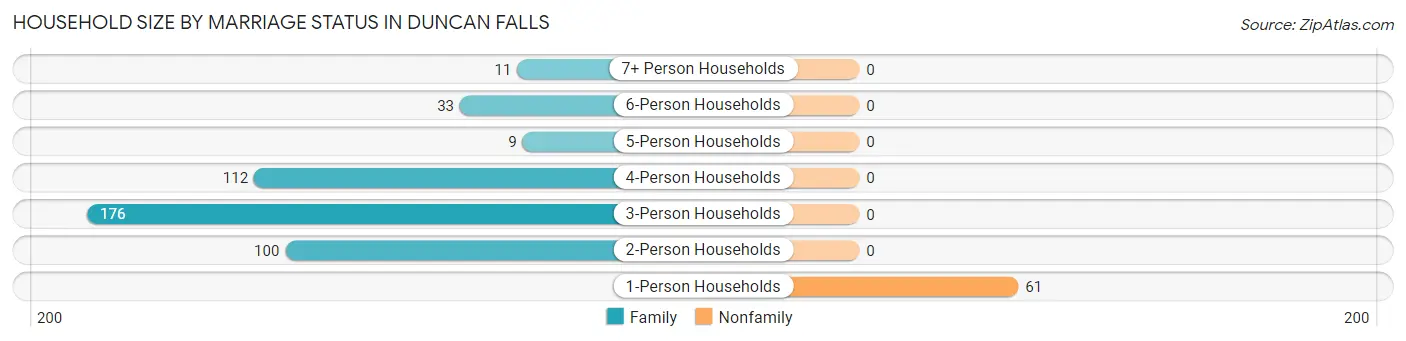
| Household Size | Family Households | Nonfamily Households |
| 1-Person Households | - | 61 (12.1%) |
| 2-Person Households | 100 (19.9%) | 0 (0.0%) |
| 3-Person Households | 176 (35.1%) | 0 (0.0%) |
| 4-Person Households | 112 (22.3%) | 0 (0.0%) |
| 5-Person Households | 9 (1.8%) | 0 (0.0%) |
| 6-Person Households | 33 (6.6%) | 0 (0.0%) |
| 7+ Person Households | 11 (2.2%) | 0 (0.0%) |
| Total | 441 (87.8%) | 61 (12.1%) |
Female Fertility in Duncan Falls
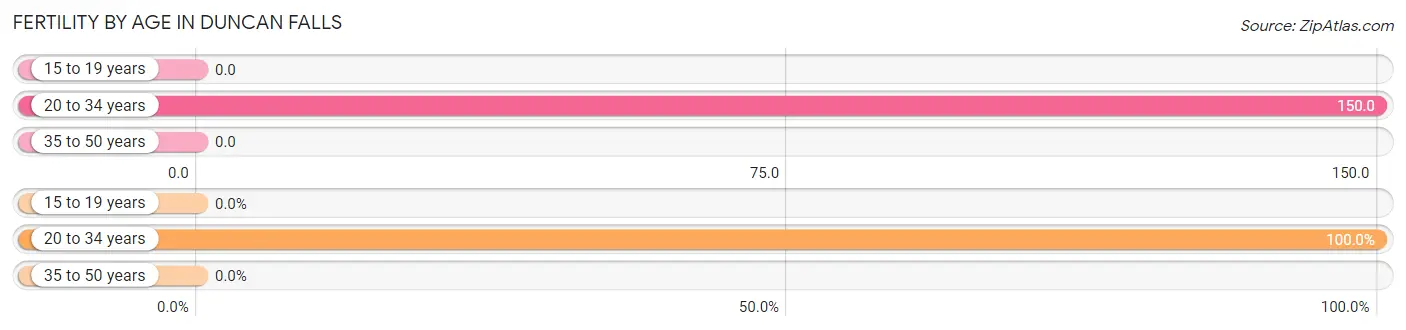
Fertility by Age in Duncan Falls
Average fertility rate in Duncan Falls is 64.0 births per 1,000 women. Women in the age bracket of 20 to 34 years have the highest fertility rate with 150.0 births per 1,000 women. Women in the age bracket of 20 to 34 years acount for 100.0% of all women with births.
| Age Bracket | Women with Births | Births / 1,000 Women |
| 15 to 19 years | 0 (0.0%) | 0.0 |
| 20 to 34 years | 25 (100.0%) | 150.0 |
| 35 to 50 years | 0 (0.0%) | 0.0 |
| Total | 25 (100.0%) | 64.0 |
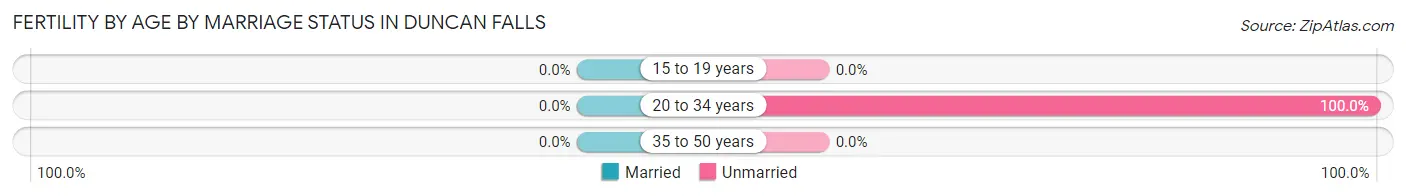
Fertility by Age by Marriage Status in Duncan Falls
| Age Bracket | Married | Unmarried |
| 15 to 19 years | 0 (0.0%) | 0 (0.0%) |
| 20 to 34 years | 0 (0.0%) | 25 (100.0%) |
| 35 to 50 years | 0 (0.0%) | 0 (0.0%) |
| Total | 0 (0.0%) | 25 (100.0%) |
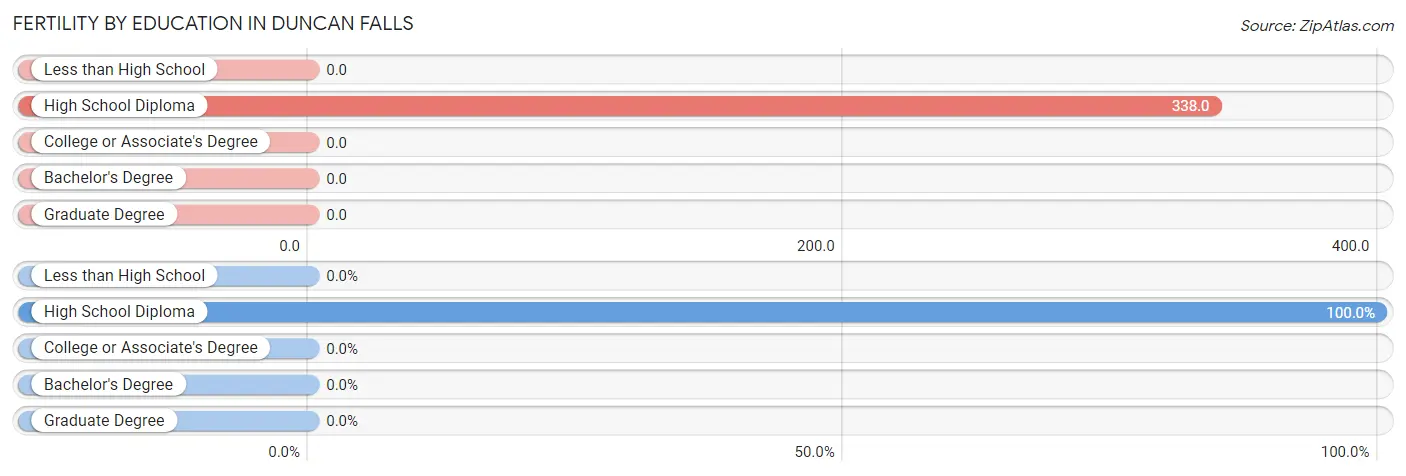
Fertility by Education in Duncan Falls
| Educational Attainment | Women with Births | Births / 1,000 Women |
| Less than High School | 0 (0.0%) | 0.0 |
| High School Diploma | 25 (100.0%) | 338.0 |
| College or Associate's Degree | 0 (0.0%) | 0.0 |
| Bachelor's Degree | 0 (0.0%) | 0.0 |
| Graduate Degree | 0 (0.0%) | 0.0 |
| Total | 25 (100.0%) | 64.0 |
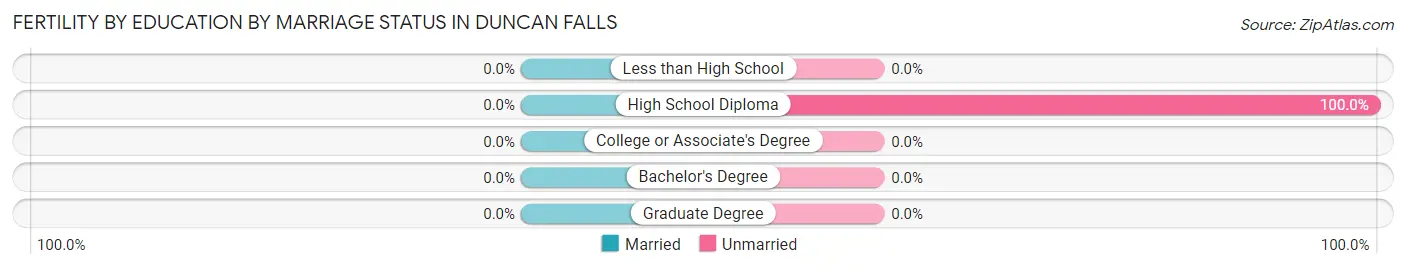
Fertility by Education by Marriage Status in Duncan Falls
| Educational Attainment | Married | Unmarried |
| Less than High School | 0 (0.0%) | 0 (0.0%) |
| High School Diploma | 0 (0.0%) | 25 (100.0%) |
| College or Associate's Degree | 0 (0.0%) | 0 (0.0%) |
| Bachelor's Degree | 0 (0.0%) | 0 (0.0%) |
| Graduate Degree | 0 (0.0%) | 0 (0.0%) |
| Total | 0 (0.0%) | 25 (100.0%) |
Employment Characteristics in Duncan Falls
Employment by Class of Employer in Duncan Falls
Among the 732 employed individuals in Duncan Falls, private company employees (575 | 78.5%), federal government employees (66 | 9.0%), and local government employees (62 | 8.5%) make up the most common classes of employment.
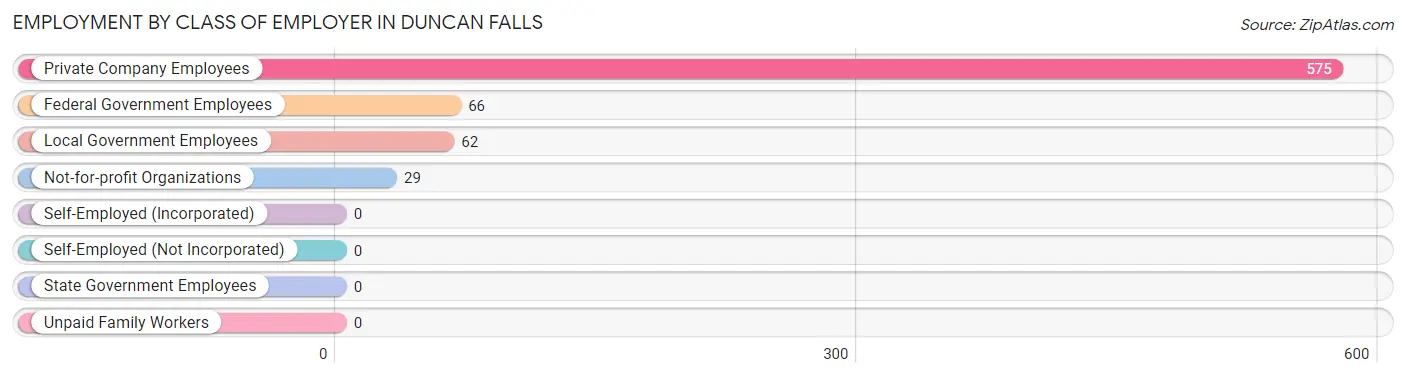
| Employer Class | # Employees | % Employees |
| Private Company Employees | 575 | 78.5% |
| Self-Employed (Incorporated) | 0 | 0.0% |
| Self-Employed (Not Incorporated) | 0 | 0.0% |
| Not-for-profit Organizations | 29 | 4.0% |
| Local Government Employees | 62 | 8.5% |
| State Government Employees | 0 | 0.0% |
| Federal Government Employees | 66 | 9.0% |
| Unpaid Family Workers | 0 | 0.0% |
| Total | 732 | 100.0% |
Employment Status by Age in Duncan Falls
According to the labor force statistics for Duncan Falls, out of the total population over 16 years of age (1,233), 62.2% or 767 individuals are in the labor force, with 4.6% or 35 of them unemployed. The age group with the highest labor force participation rate is 30 to 34 years, with 100.0% or 208 individuals in the labor force. Within the labor force, the 30 to 34 years age range has the highest percentage of unemployed individuals, with 16.8% or 35 of them being unemployed.
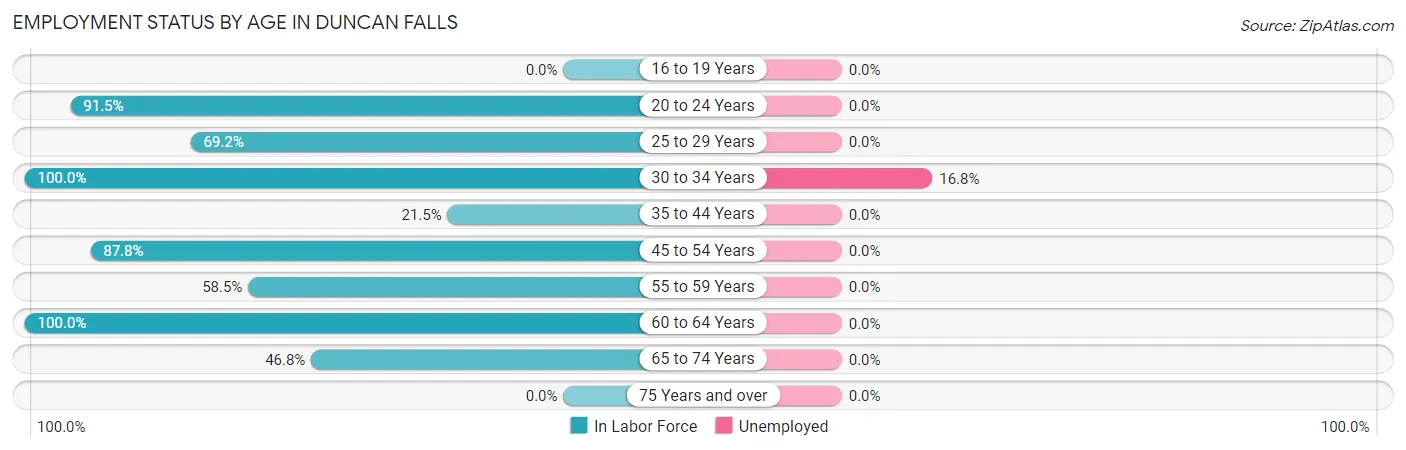
| Age Bracket | In Labor Force | Unemployed |
| 16 to 19 Years | 0 (0.0%) | 0 (0.0%) |
| 20 to 24 Years | 54 (91.5%) | 0 (0.0%) |
| 25 to 29 Years | 119 (69.2%) | 0 (0.0%) |
| 30 to 34 Years | 208 (100.0%) | 35 (16.8%) |
| 35 to 44 Years | 46 (21.5%) | 0 (0.0%) |
| 45 to 54 Years | 129 (87.8%) | 0 (0.0%) |
| 55 to 59 Years | 31 (58.5%) | 0 (0.0%) |
| 60 to 64 Years | 21 (100.0%) | 0 (0.0%) |
| 65 to 74 Years | 159 (46.8%) | 0 (0.0%) |
| 75 Years and over | 0 (0.0%) | 0 (0.0%) |
| Total | 767 (62.2%) | 35 (4.6%) |
Employment Status by Educational Attainment in Duncan Falls
According to labor force statistics for Duncan Falls, 68.0% of individuals (554) out of the total population between 25 and 64 years of age (815) are in the labor force, with 6.3% or 35 of them being unemployed. The group with the highest labor force participation rate are those with the educational attainment of high school diploma, with 100.0% or 246 individuals in the labor force. Within the labor force, individuals with high school diploma education have the highest percentage of unemployment, with 8.9% or 22 of them being unemployed.
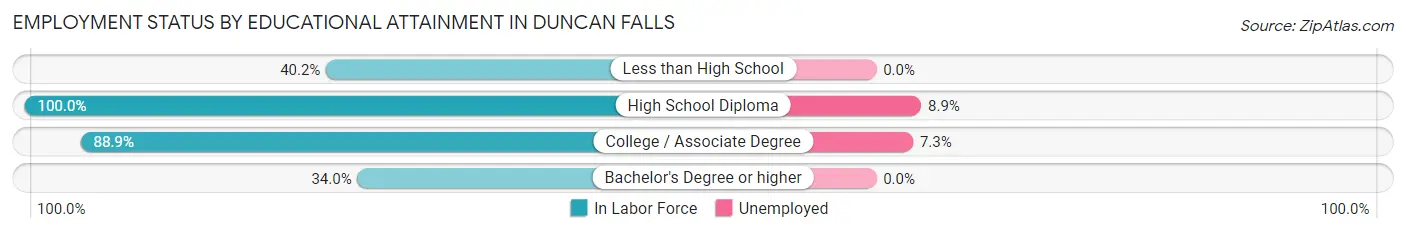
| Educational Attainment | In Labor Force | Unemployed |
| Less than High School | 33 (40.2%) | 0 (0.0%) |
| High School Diploma | 246 (100.0%) | 22 (8.9%) |
| College / Associate Degree | 177 (88.9%) | 15 (7.3%) |
| Bachelor's Degree or higher | 98 (34.0%) | 0 (0.0%) |
| Total | 554 (68.0%) | 51 (6.3%) |
Employment Occupations by Sex in Duncan Falls
Management, Business, Science and Arts Occupations
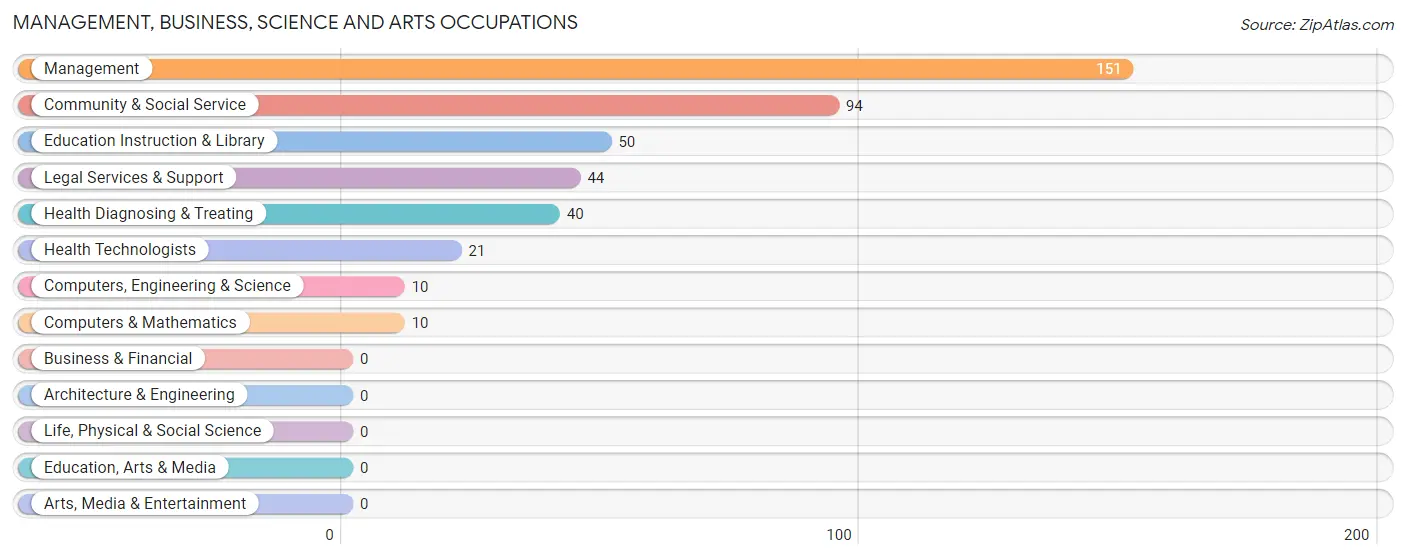
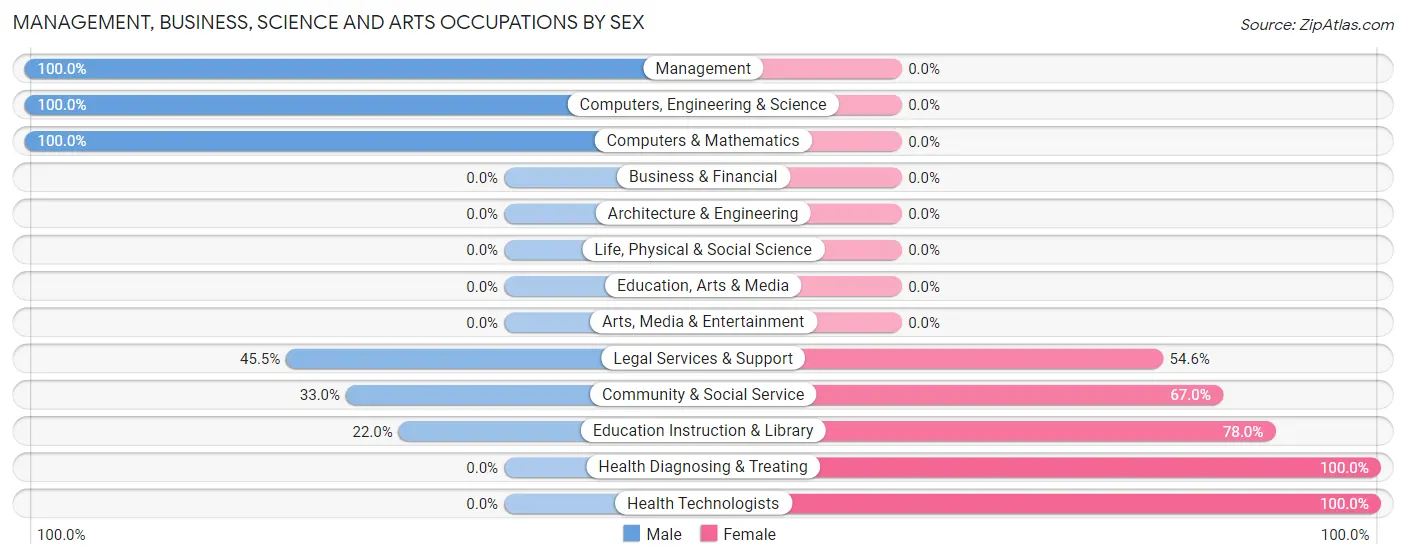
The most common Management, Business, Science and Arts occupations in Duncan Falls are Management (151 | 20.6%), Community & Social Service (94 | 12.8%), Education Instruction & Library (50 | 6.8%), Legal Services & Support (44 | 6.0%), and Health Diagnosing & Treating (40 | 5.5%).
Management, Business, Science and Arts Occupations by Sex
Within the Management, Business, Science and Arts occupations in Duncan Falls, the most male-oriented occupations are Management (100.0%), Computers, Engineering & Science (100.0%), and Computers & Mathematics (100.0%), while the most female-oriented occupations are Health Diagnosing & Treating (100.0%), Health Technologists (100.0%), and Education Instruction & Library (78.0%).
| Occupation | Male | Female |
| Management | 151 (100.0%) | 0 (0.0%) |
| Business & Financial | 0 (0.0%) | 0 (0.0%) |
| Computers, Engineering & Science | 10 (100.0%) | 0 (0.0%) |
| Computers & Mathematics | 10 (100.0%) | 0 (0.0%) |
| Architecture & Engineering | 0 (0.0%) | 0 (0.0%) |
| Life, Physical & Social Science | 0 (0.0%) | 0 (0.0%) |
| Community & Social Service | 31 (33.0%) | 63 (67.0%) |
| Education, Arts & Media | 0 (0.0%) | 0 (0.0%) |
| Legal Services & Support | 20 (45.5%) | 24 (54.5%) |
| Education Instruction & Library | 11 (22.0%) | 39 (78.0%) |
| Arts, Media & Entertainment | 0 (0.0%) | 0 (0.0%) |
| Health Diagnosing & Treating | 0 (0.0%) | 40 (100.0%) |
| Health Technologists | 0 (0.0%) | 21 (100.0%) |
| Total (Category) | 192 (65.1%) | 103 (34.9%) |
| Total (Overall) | 473 (64.6%) | 259 (35.4%) |
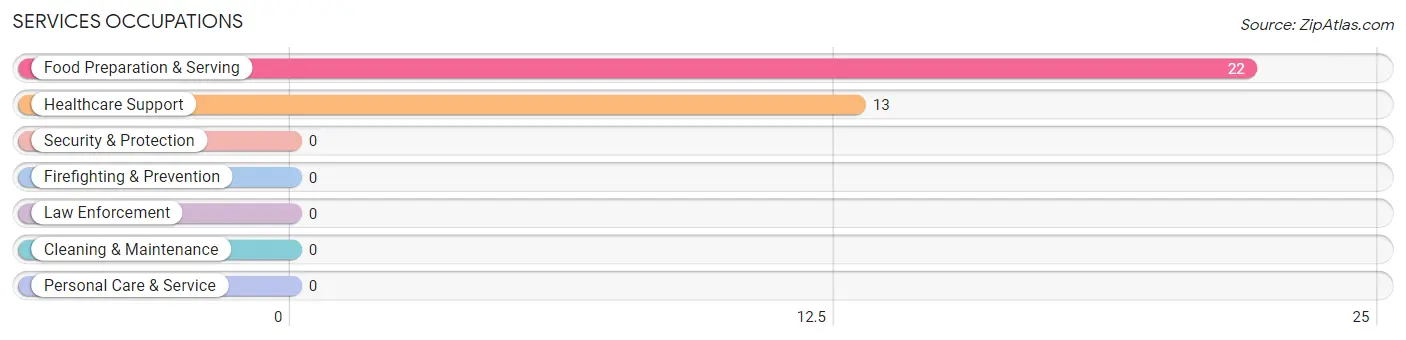
Services Occupations
The most common Services occupations in Duncan Falls are Food Preparation & Serving (22 | 3.0%), and Healthcare Support (13 | 1.8%).
Services Occupations by Sex
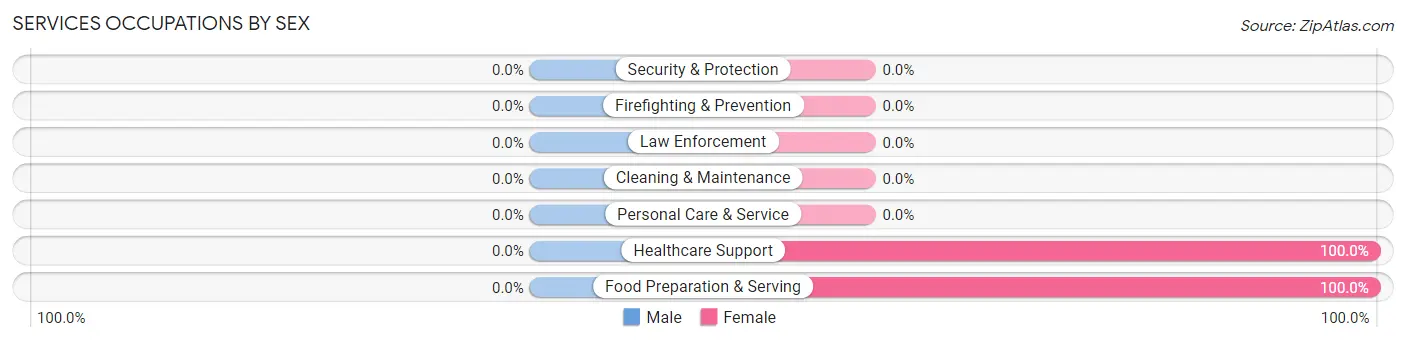
| Occupation | Male | Female |
| Healthcare Support | 0 (0.0%) | 13 (100.0%) |
| Security & Protection | 0 (0.0%) | 0 (0.0%) |
| Firefighting & Prevention | 0 (0.0%) | 0 (0.0%) |
| Law Enforcement | 0 (0.0%) | 0 (0.0%) |
| Food Preparation & Serving | 0 (0.0%) | 22 (100.0%) |
| Cleaning & Maintenance | 0 (0.0%) | 0 (0.0%) |
| Personal Care & Service | 0 (0.0%) | 0 (0.0%) |
| Total (Category) | 0 (0.0%) | 35 (100.0%) |
| Total (Overall) | 473 (64.6%) | 259 (35.4%) |
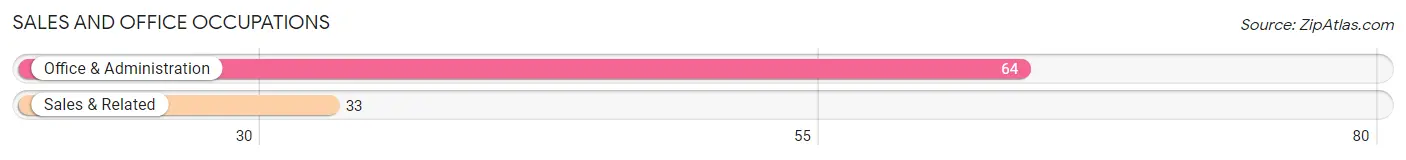
Sales and Office Occupations
The most common Sales and Office occupations in Duncan Falls are Office & Administration (64 | 8.7%), and Sales & Related (33 | 4.5%).
Sales and Office Occupations by Sex
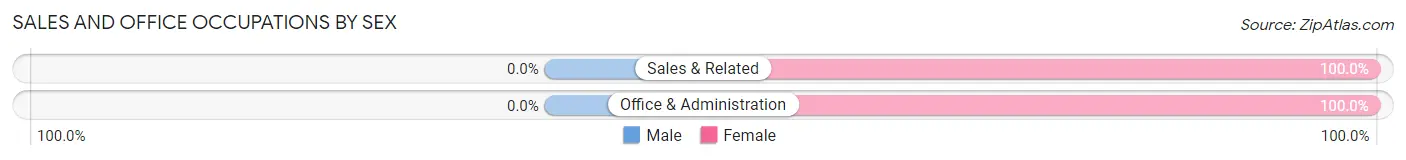
| Occupation | Male | Female |
| Sales & Related | 0 (0.0%) | 33 (100.0%) |
| Office & Administration | 0 (0.0%) | 64 (100.0%) |
| Total (Category) | 0 (0.0%) | 97 (100.0%) |
| Total (Overall) | 473 (64.6%) | 259 (35.4%) |
Natural Resources, Construction and Maintenance Occupations
The most common Natural Resources, Construction and Maintenance occupations in Duncan Falls are , and Installation, Maintenance & Repair (34 | 4.6%).
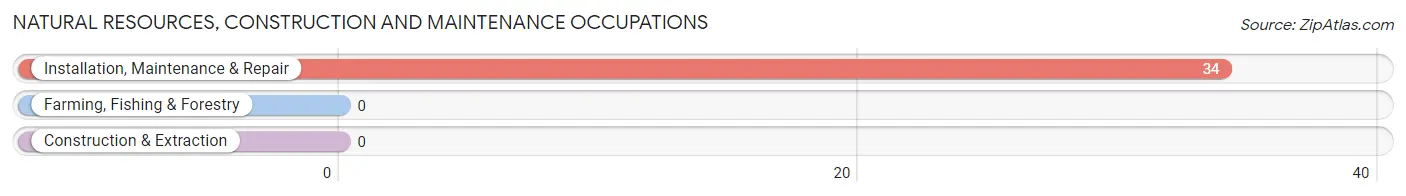
Natural Resources, Construction and Maintenance Occupations by Sex
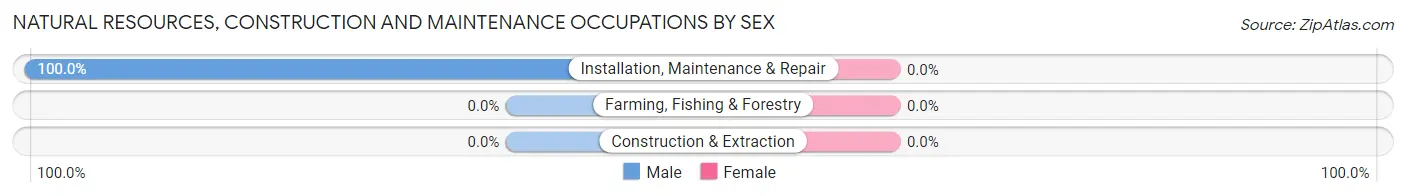
| Occupation | Male | Female |
| Farming, Fishing & Forestry | 0 (0.0%) | 0 (0.0%) |
| Construction & Extraction | 0 (0.0%) | 0 (0.0%) |
| Installation, Maintenance & Repair | 34 (100.0%) | 0 (0.0%) |
| Total (Category) | 34 (100.0%) | 0 (0.0%) |
| Total (Overall) | 473 (64.6%) | 259 (35.4%) |
Production, Transportation and Moving Occupations
The most common Production, Transportation and Moving occupations in Duncan Falls are Material Moving (155 | 21.2%), and Production (116 | 15.9%).
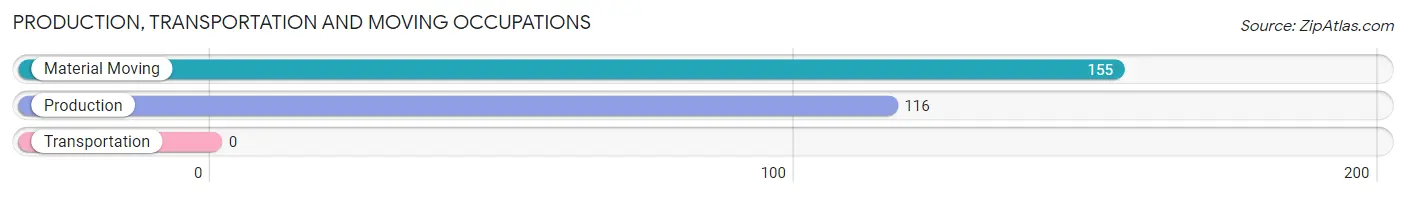
Production, Transportation and Moving Occupations by Sex
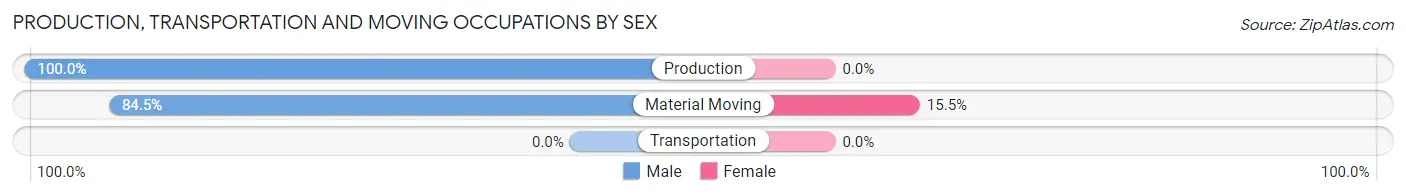
| Occupation | Male | Female |
| Production | 116 (100.0%) | 0 (0.0%) |
| Transportation | 0 (0.0%) | 0 (0.0%) |
| Material Moving | 131 (84.5%) | 24 (15.5%) |
| Total (Category) | 247 (91.1%) | 24 (8.9%) |
| Total (Overall) | 473 (64.6%) | 259 (35.4%) |
Employment Industries by Sex in Duncan Falls
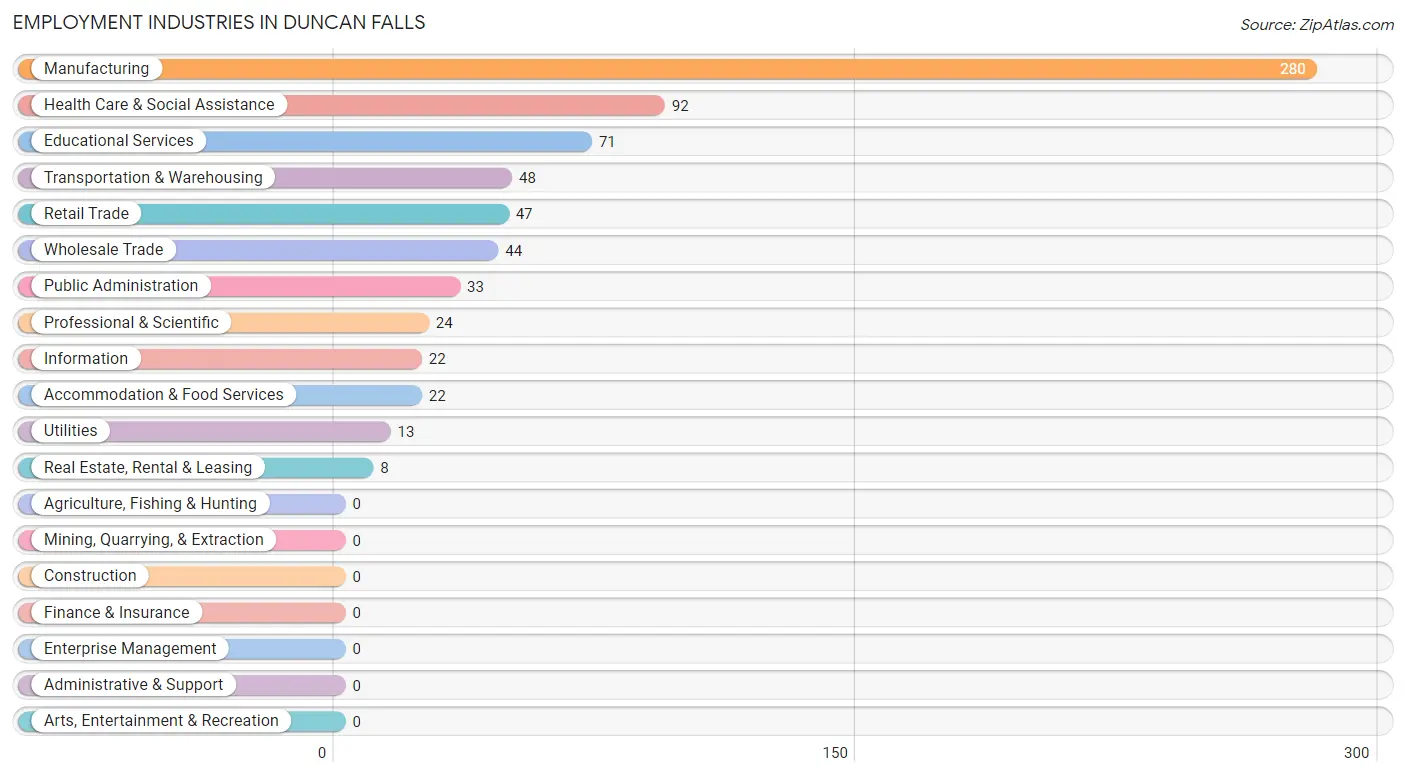
Employment Industries in Duncan Falls
The major employment industries in Duncan Falls include Manufacturing (280 | 38.3%), Health Care & Social Assistance (92 | 12.6%), Educational Services (71 | 9.7%), Transportation & Warehousing (48 | 6.6%), and Retail Trade (47 | 6.4%).
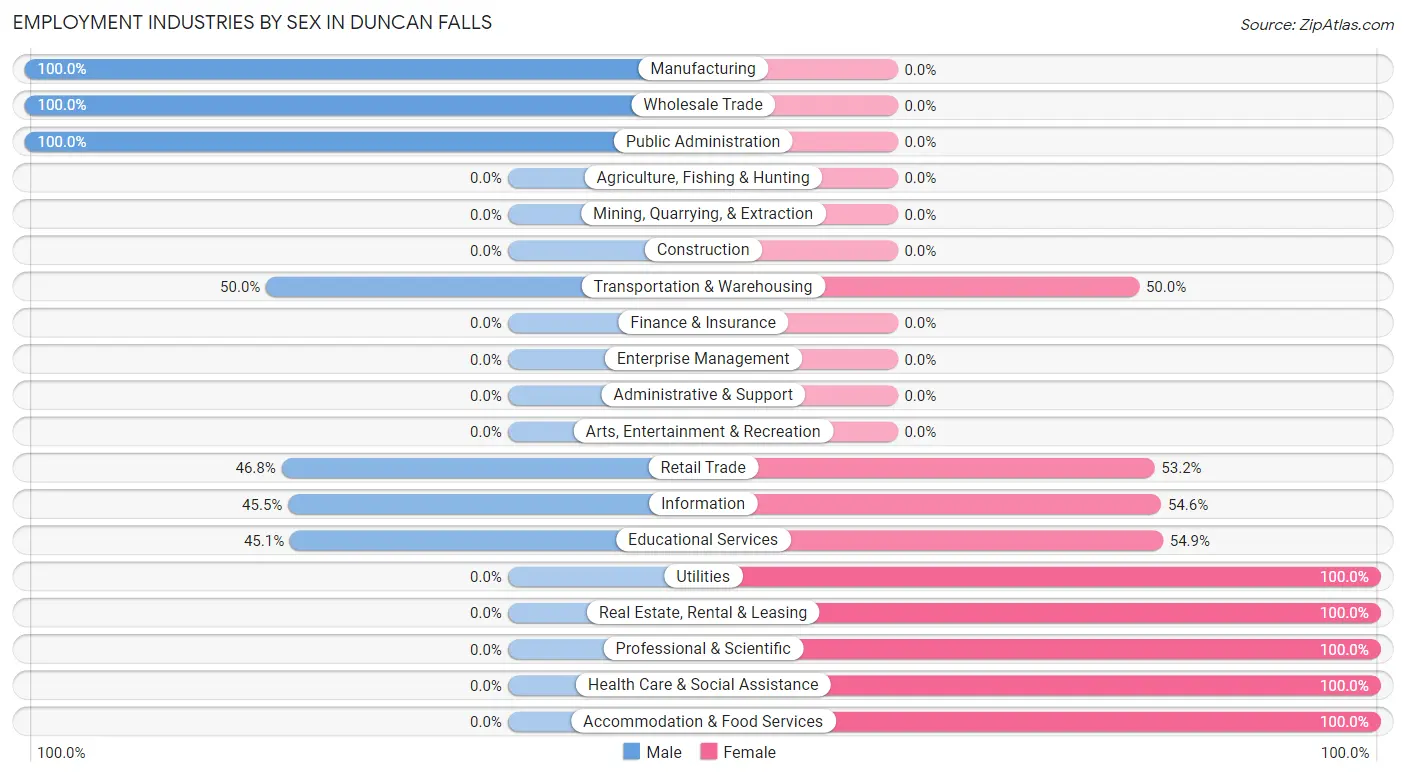
Employment Industries by Sex in Duncan Falls
The Duncan Falls industries that see more men than women are Manufacturing (100.0%), Wholesale Trade (100.0%), and Public Administration (100.0%), whereas the industries that tend to have a higher number of women are Utilities (100.0%), Real Estate, Rental & Leasing (100.0%), and Professional & Scientific (100.0%).
| Industry | Male | Female |
| Agriculture, Fishing & Hunting | 0 (0.0%) | 0 (0.0%) |
| Mining, Quarrying, & Extraction | 0 (0.0%) | 0 (0.0%) |
| Construction | 0 (0.0%) | 0 (0.0%) |
| Manufacturing | 280 (100.0%) | 0 (0.0%) |
| Wholesale Trade | 44 (100.0%) | 0 (0.0%) |
| Retail Trade | 22 (46.8%) | 25 (53.2%) |
| Transportation & Warehousing | 24 (50.0%) | 24 (50.0%) |
| Utilities | 0 (0.0%) | 13 (100.0%) |
| Information | 10 (45.5%) | 12 (54.5%) |
| Finance & Insurance | 0 (0.0%) | 0 (0.0%) |
| Real Estate, Rental & Leasing | 0 (0.0%) | 8 (100.0%) |
| Professional & Scientific | 0 (0.0%) | 24 (100.0%) |
| Enterprise Management | 0 (0.0%) | 0 (0.0%) |
| Administrative & Support | 0 (0.0%) | 0 (0.0%) |
| Educational Services | 32 (45.1%) | 39 (54.9%) |
| Health Care & Social Assistance | 0 (0.0%) | 92 (100.0%) |
| Arts, Entertainment & Recreation | 0 (0.0%) | 0 (0.0%) |
| Accommodation & Food Services | 0 (0.0%) | 22 (100.0%) |
| Public Administration | 33 (100.0%) | 0 (0.0%) |
| Total | 473 (64.6%) | 259 (35.4%) |
Education in Duncan Falls
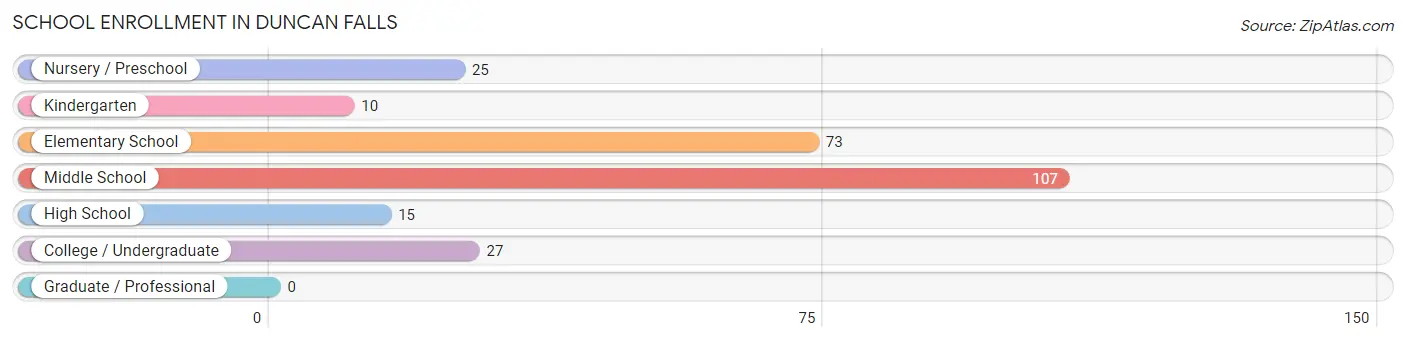
School Enrollment in Duncan Falls
The most common levels of schooling among the 257 students in Duncan Falls are middle school (107 | 41.6%), elementary school (73 | 28.4%), and college / undergraduate (27 | 10.5%).
| School Level | # Students | % Students |
| Nursery / Preschool | 25 | 9.7% |
| Kindergarten | 10 | 3.9% |
| Elementary School | 73 | 28.4% |
| Middle School | 107 | 41.6% |
| High School | 15 | 5.8% |
| College / Undergraduate | 27 | 10.5% |
| Graduate / Professional | 0 | 0.0% |
| Total | 257 | 100.0% |
School Enrollment by Age by Funding Source in Duncan Falls
Out of a total of 257 students who are enrolled in schools in Duncan Falls, 5 (1.9%) attend a private institution, while the remaining 252 (98.1%) are enrolled in public schools. The age group of 20 to 24 year olds has the highest likelihood of being enrolled in private schools, with 5 (100.0% in the age bracket) enrolled. Conversely, the age group of 5 to 9 year old has the lowest likelihood of being enrolled in a private school, with 108 (100.0% in the age bracket) attending a public institution.
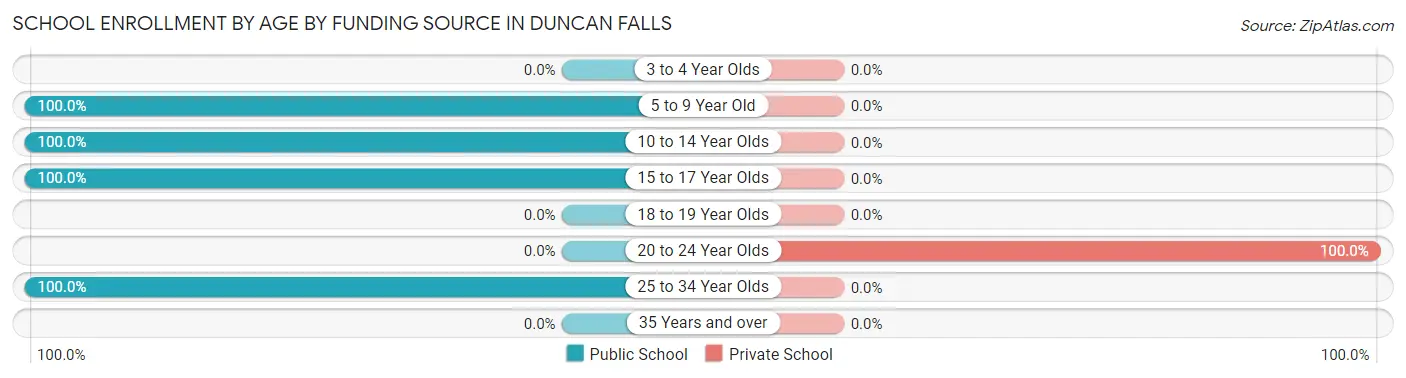
| Age Bracket | Public School | Private School |
| 3 to 4 Year Olds | 0 (0.0%) | 0 (0.0%) |
| 5 to 9 Year Old | 108 (100.0%) | 0 (0.0%) |
| 10 to 14 Year Olds | 107 (100.0%) | 0 (0.0%) |
| 15 to 17 Year Olds | 15 (100.0%) | 0 (0.0%) |
| 18 to 19 Year Olds | 0 (0.0%) | 0 (0.0%) |
| 20 to 24 Year Olds | 0 (0.0%) | 5 (100.0%) |
| 25 to 34 Year Olds | 22 (100.0%) | 0 (0.0%) |
| 35 Years and over | 0 (0.0%) | 0 (0.0%) |
| Total | 252 (98.1%) | 5 (1.9%) |
Educational Attainment by Field of Study in Duncan Falls
Business (319 | 69.2%), education (62 | 13.5%), visual & performing arts (49 | 10.6%), science & technology (21 | 4.6%), and computers & mathematics (10 | 2.2%) are the most common fields of study among 461 individuals in Duncan Falls who have obtained a bachelor's degree or higher.
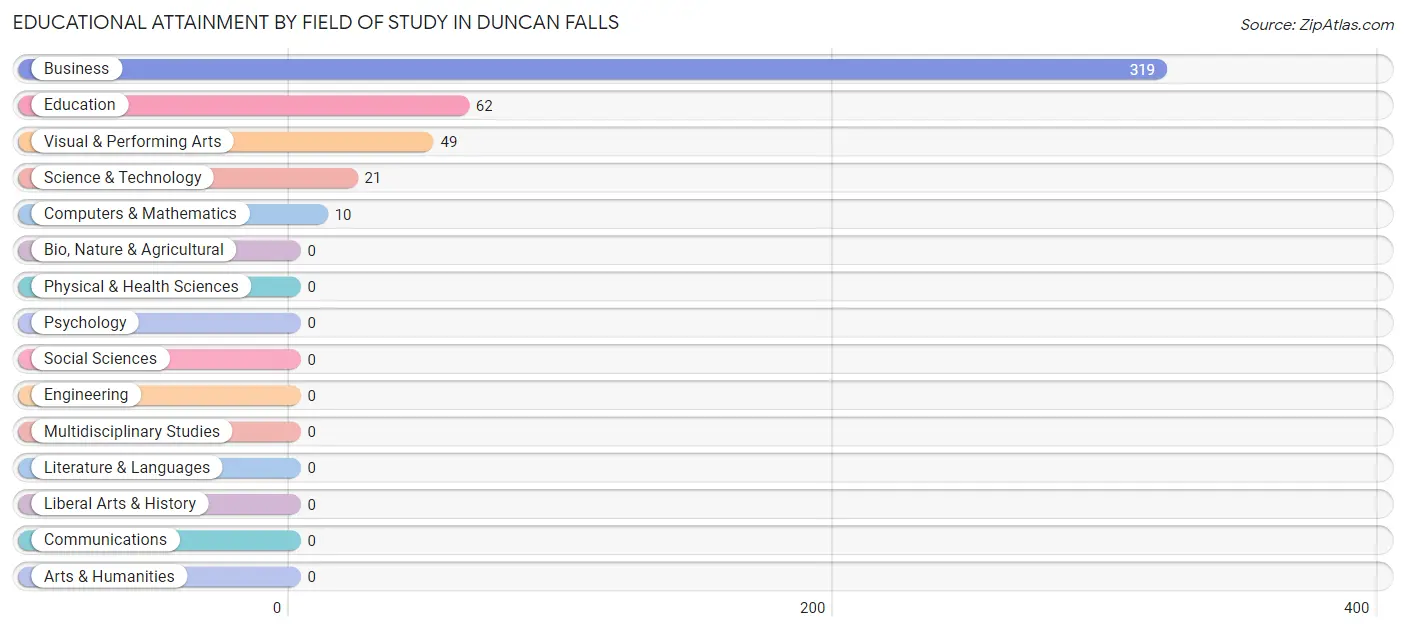
| Field of Study | # Graduates | % Graduates |
| Computers & Mathematics | 10 | 2.2% |
| Bio, Nature & Agricultural | 0 | 0.0% |
| Physical & Health Sciences | 0 | 0.0% |
| Psychology | 0 | 0.0% |
| Social Sciences | 0 | 0.0% |
| Engineering | 0 | 0.0% |
| Multidisciplinary Studies | 0 | 0.0% |
| Science & Technology | 21 | 4.6% |
| Business | 319 | 69.2% |
| Education | 62 | 13.5% |
| Literature & Languages | 0 | 0.0% |
| Liberal Arts & History | 0 | 0.0% |
| Visual & Performing Arts | 49 | 10.6% |
| Communications | 0 | 0.0% |
| Arts & Humanities | 0 | 0.0% |
| Total | 461 | 100.0% |
Transportation & Commute in Duncan Falls
Vehicle Availability by Sex in Duncan Falls
The most prevalent vehicle ownership categories in Duncan Falls are males with 3 vehicles (241, accounting for 50.9%) and females with 3 vehicles (119, making up 93.0%).
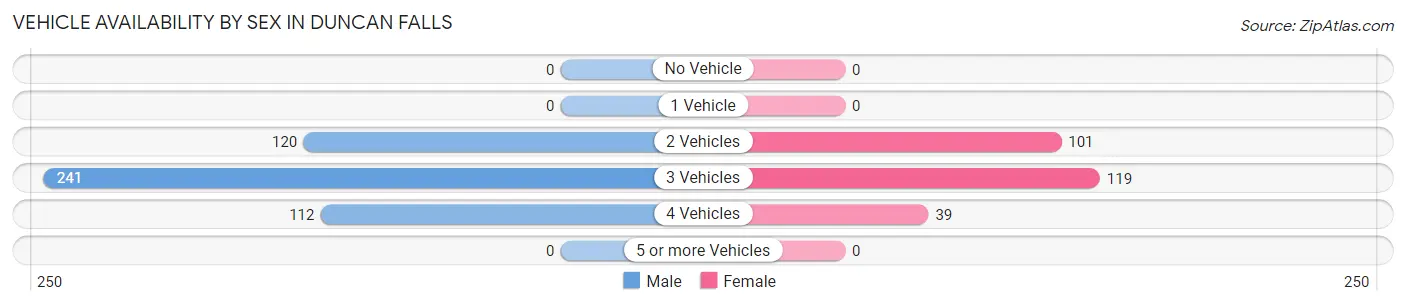
| Vehicles Available | Male | Female |
| No Vehicle | 0 (0.0%) | 0 (0.0%) |
| 1 Vehicle | 0 (0.0%) | 0 (0.0%) |
| 2 Vehicles | 120 (25.4%) | 101 (39.0%) |
| 3 Vehicles | 241 (50.9%) | 119 (46.0%) |
| 4 Vehicles | 112 (23.7%) | 39 (15.1%) |
| 5 or more Vehicles | 0 (0.0%) | 0 (0.0%) |
| Total | 473 (100.0%) | 259 (100.0%) |
Commute Time in Duncan Falls
The most frequently occuring commute durations in Duncan Falls are 30 to 34 minutes (212 commuters, 29.0%), 20 to 24 minutes (131 commuters, 17.9%), and 15 to 19 minutes (124 commuters, 16.9%).
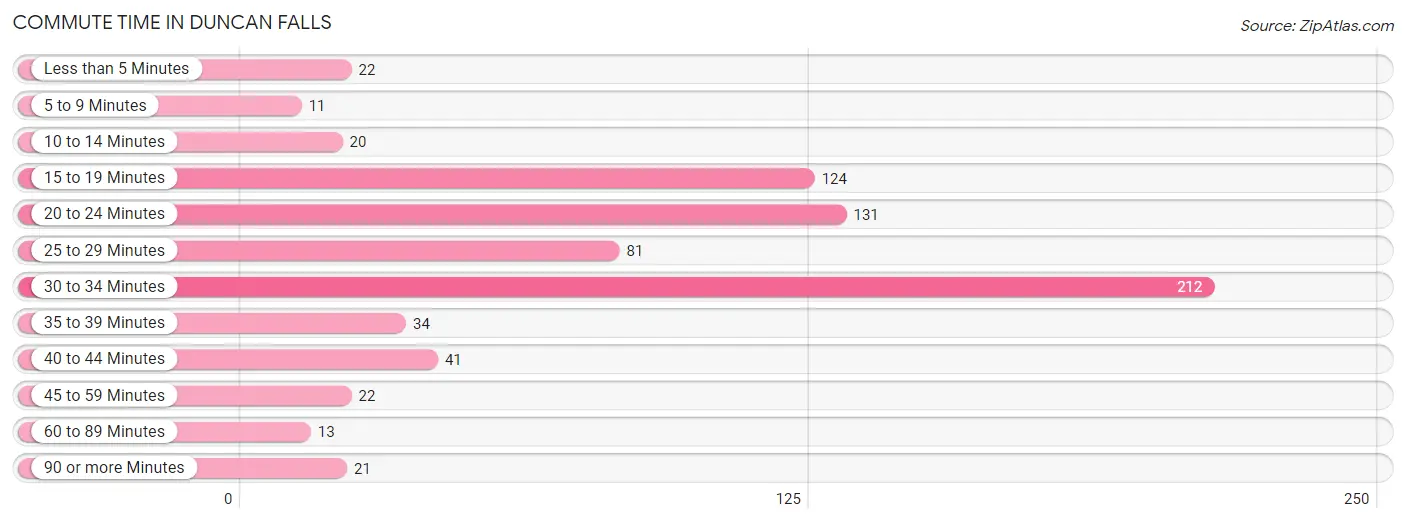
| Commute Time | # Commuters | % Commuters |
| Less than 5 Minutes | 22 | 3.0% |
| 5 to 9 Minutes | 11 | 1.5% |
| 10 to 14 Minutes | 20 | 2.7% |
| 15 to 19 Minutes | 124 | 16.9% |
| 20 to 24 Minutes | 131 | 17.9% |
| 25 to 29 Minutes | 81 | 11.1% |
| 30 to 34 Minutes | 212 | 29.0% |
| 35 to 39 Minutes | 34 | 4.6% |
| 40 to 44 Minutes | 41 | 5.6% |
| 45 to 59 Minutes | 22 | 3.0% |
| 60 to 89 Minutes | 13 | 1.8% |
| 90 or more Minutes | 21 | 2.9% |
Commute Time by Sex in Duncan Falls
The most common commute times in Duncan Falls are 30 to 34 minutes (171 commuters, 36.1%) for males and 15 to 19 minutes (67 commuters, 25.9%) for females.
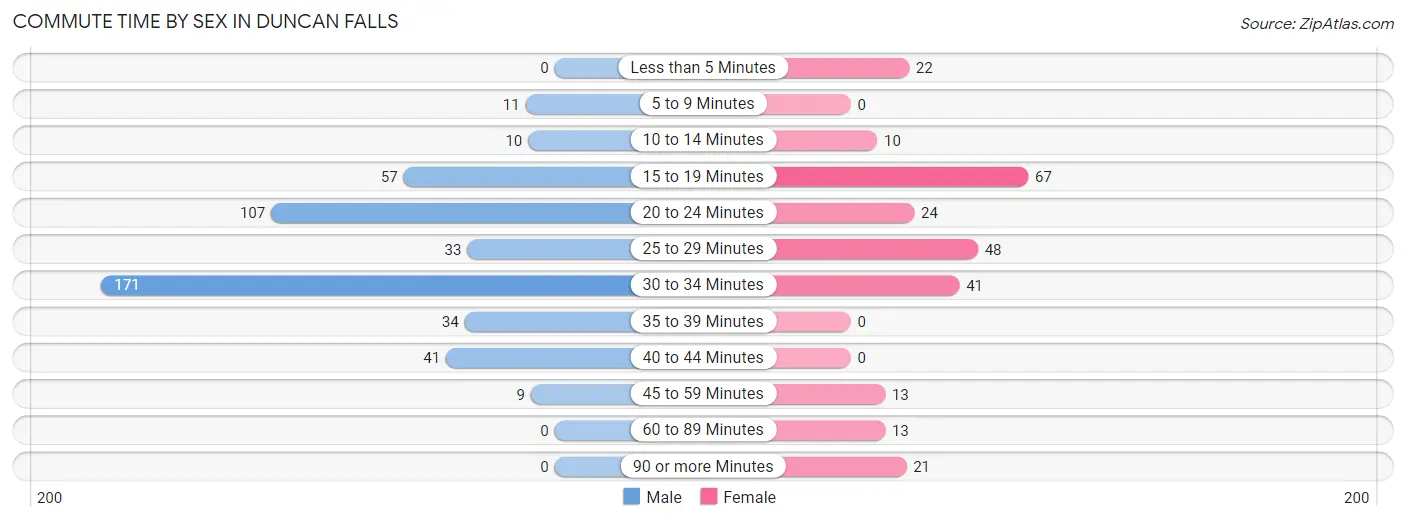
| Commute Time | Male | Female |
| Less than 5 Minutes | 0 (0.0%) | 22 (8.5%) |
| 5 to 9 Minutes | 11 (2.3%) | 0 (0.0%) |
| 10 to 14 Minutes | 10 (2.1%) | 10 (3.9%) |
| 15 to 19 Minutes | 57 (12.0%) | 67 (25.9%) |
| 20 to 24 Minutes | 107 (22.6%) | 24 (9.3%) |
| 25 to 29 Minutes | 33 (7.0%) | 48 (18.5%) |
| 30 to 34 Minutes | 171 (36.1%) | 41 (15.8%) |
| 35 to 39 Minutes | 34 (7.2%) | 0 (0.0%) |
| 40 to 44 Minutes | 41 (8.7%) | 0 (0.0%) |
| 45 to 59 Minutes | 9 (1.9%) | 13 (5.0%) |
| 60 to 89 Minutes | 0 (0.0%) | 13 (5.0%) |
| 90 or more Minutes | 0 (0.0%) | 21 (8.1%) |
Time of Departure to Work by Sex in Duncan Falls
The most frequent times of departure to work in Duncan Falls are 7:30 AM to 7:59 AM (151, 31.9%) for males and 7:00 AM to 7:29 AM (91, 35.1%) for females.
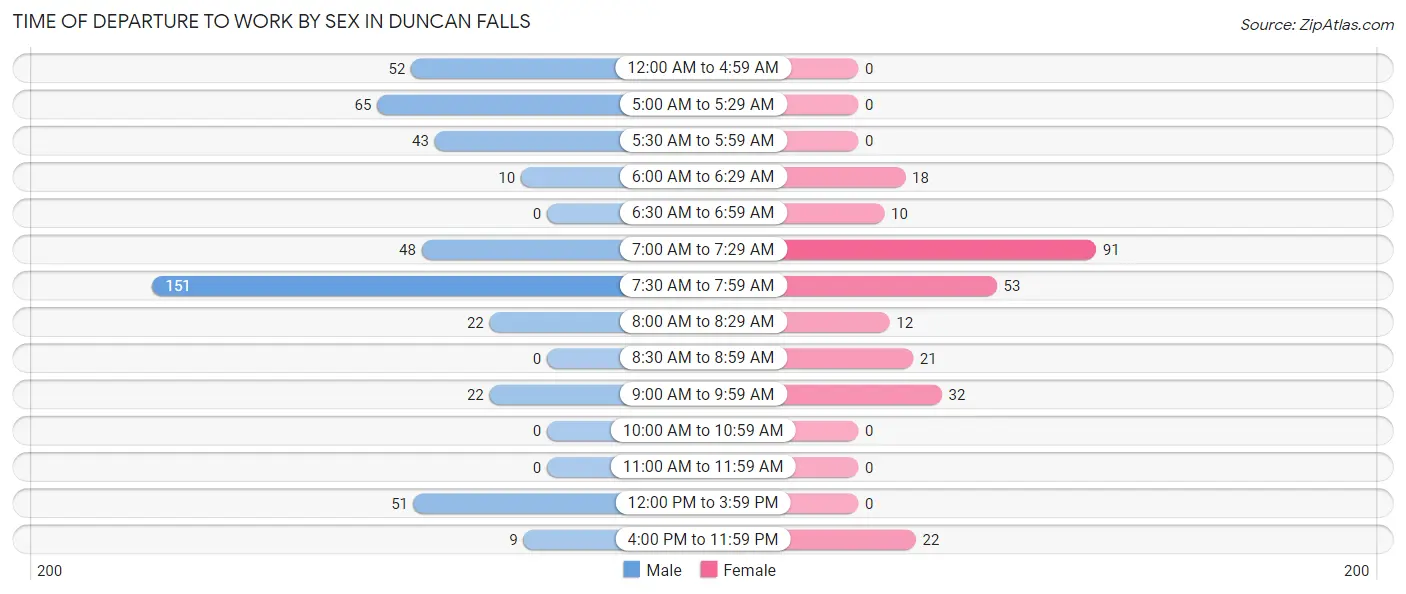
| Time of Departure | Male | Female |
| 12:00 AM to 4:59 AM | 52 (11.0%) | 0 (0.0%) |
| 5:00 AM to 5:29 AM | 65 (13.7%) | 0 (0.0%) |
| 5:30 AM to 5:59 AM | 43 (9.1%) | 0 (0.0%) |
| 6:00 AM to 6:29 AM | 10 (2.1%) | 18 (7.0%) |
| 6:30 AM to 6:59 AM | 0 (0.0%) | 10 (3.9%) |
| 7:00 AM to 7:29 AM | 48 (10.2%) | 91 (35.1%) |
| 7:30 AM to 7:59 AM | 151 (31.9%) | 53 (20.5%) |
| 8:00 AM to 8:29 AM | 22 (4.6%) | 12 (4.6%) |
| 8:30 AM to 8:59 AM | 0 (0.0%) | 21 (8.1%) |
| 9:00 AM to 9:59 AM | 22 (4.6%) | 32 (12.4%) |
| 10:00 AM to 10:59 AM | 0 (0.0%) | 0 (0.0%) |
| 11:00 AM to 11:59 AM | 0 (0.0%) | 0 (0.0%) |
| 12:00 PM to 3:59 PM | 51 (10.8%) | 0 (0.0%) |
| 4:00 PM to 11:59 PM | 9 (1.9%) | 22 (8.5%) |
| Total | 473 (100.0%) | 259 (100.0%) |
Housing Occupancy in Duncan Falls
Occupancy by Ownership in Duncan Falls
Of the total 502 dwellings in Duncan Falls, owner-occupied units account for 445 (88.6%), while renter-occupied units make up 57 (11.4%).
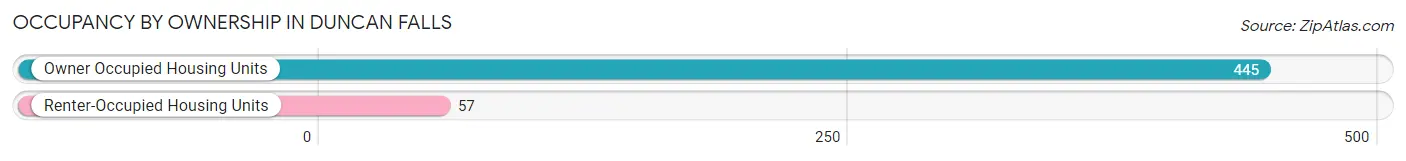
| Occupancy | # Housing Units | % Housing Units |
| Owner Occupied Housing Units | 445 | 88.6% |
| Renter-Occupied Housing Units | 57 | 11.4% |
| Total Occupied Housing Units | 502 | 100.0% |
Occupancy by Household Size in Duncan Falls
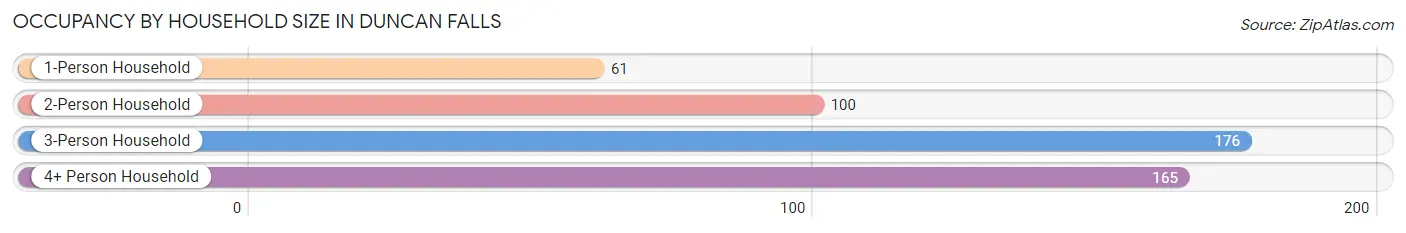
| Household Size | # Housing Units | % Housing Units |
| 1-Person Household | 61 | 12.1% |
| 2-Person Household | 100 | 19.9% |
| 3-Person Household | 176 | 35.1% |
| 4+ Person Household | 165 | 32.9% |
| Total Housing Units | 502 | 100.0% |
Occupancy by Ownership by Household Size in Duncan Falls
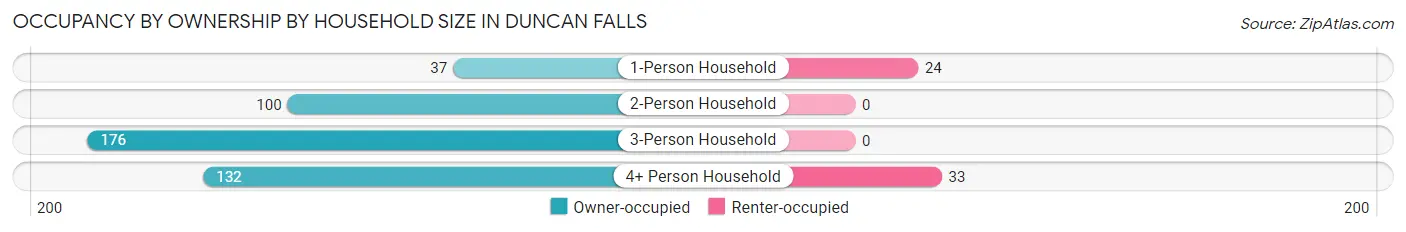
| Household Size | Owner-occupied | Renter-occupied |
| 1-Person Household | 37 (60.7%) | 24 (39.3%) |
| 2-Person Household | 100 (100.0%) | 0 (0.0%) |
| 3-Person Household | 176 (100.0%) | 0 (0.0%) |
| 4+ Person Household | 132 (80.0%) | 33 (20.0%) |
| Total Housing Units | 445 (88.6%) | 57 (11.4%) |
Occupancy by Educational Attainment in Duncan Falls
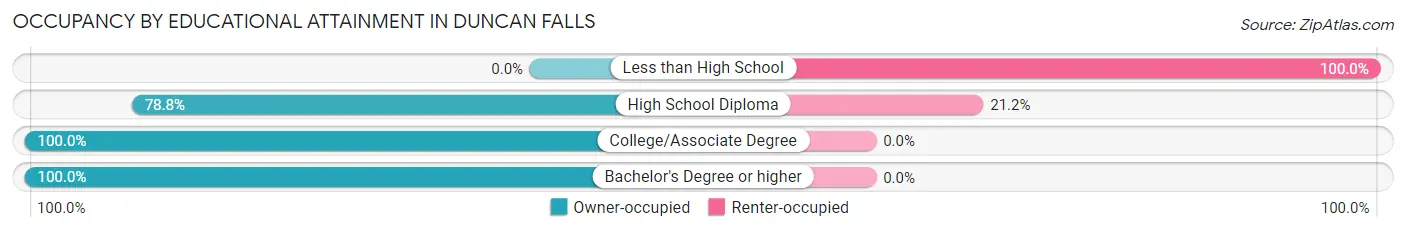
| Household Size | Owner-occupied | Renter-occupied |
| Less than High School | 0 (0.0%) | 33 (100.0%) |
| High School Diploma | 89 (78.8%) | 24 (21.2%) |
| College/Associate Degree | 123 (100.0%) | 0 (0.0%) |
| Bachelor's Degree or higher | 233 (100.0%) | 0 (0.0%) |
Occupancy by Age of Householder in Duncan Falls
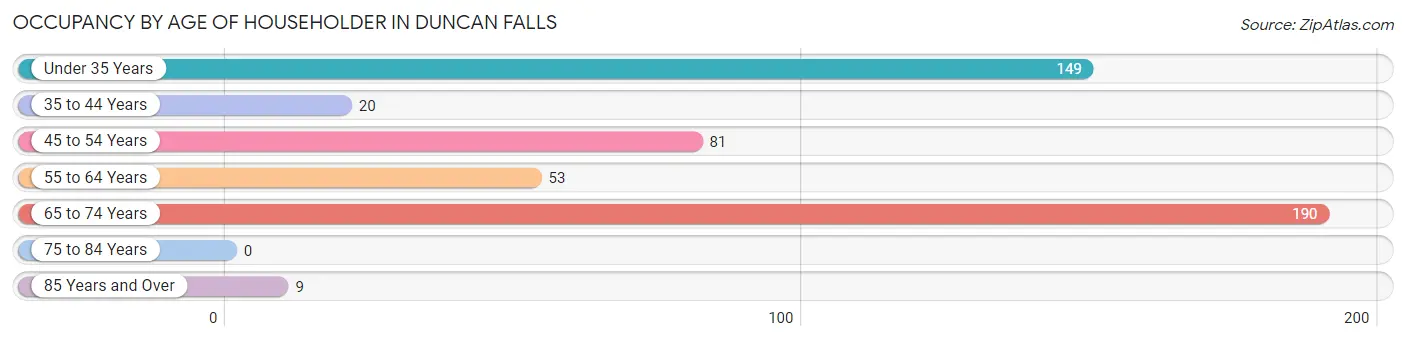
| Age Bracket | # Households | % Households |
| Under 35 Years | 149 | 29.7% |
| 35 to 44 Years | 20 | 4.0% |
| 45 to 54 Years | 81 | 16.1% |
| 55 to 64 Years | 53 | 10.6% |
| 65 to 74 Years | 190 | 37.9% |
| 75 to 84 Years | 0 | 0.0% |
| 85 Years and Over | 9 | 1.8% |
| Total | 502 | 100.0% |
Housing Finances in Duncan Falls
Median Income by Occupancy in Duncan Falls
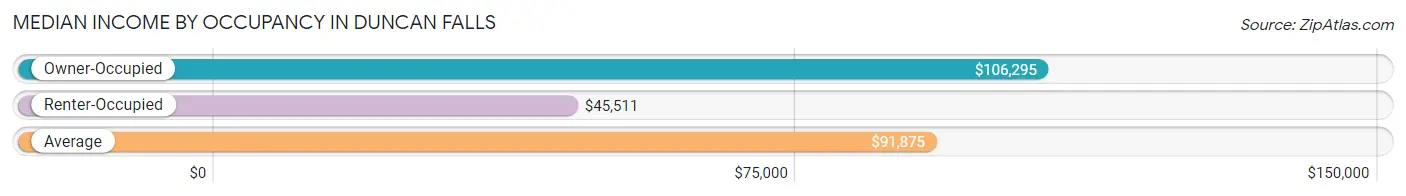
| Occupancy Type | # Households | Median Income |
| Owner-Occupied | 445 (88.6%) | $106,295 |
| Renter-Occupied | 57 (11.4%) | $45,511 |
| Average | 502 (100.0%) | $91,875 |
Occupancy by Householder Income Bracket in Duncan Falls
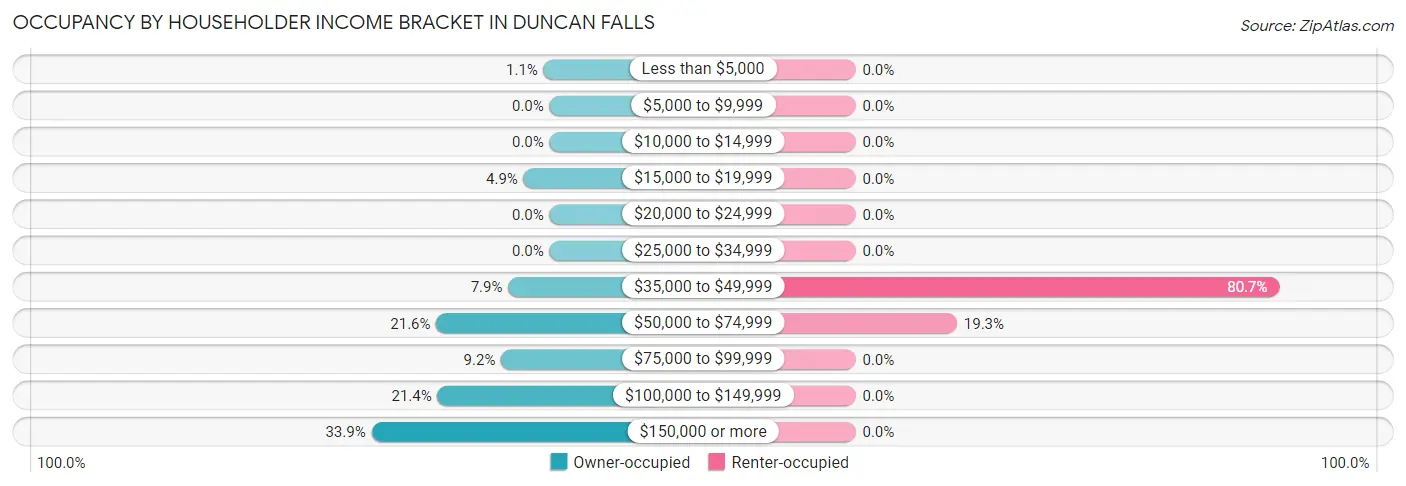
| Income Bracket | Owner-occupied | Renter-occupied |
| Less than $5,000 | 5 (1.1%) | 0 (0.0%) |
| $5,000 to $9,999 | 0 (0.0%) | 0 (0.0%) |
| $10,000 to $14,999 | 0 (0.0%) | 0 (0.0%) |
| $15,000 to $19,999 | 22 (4.9%) | 0 (0.0%) |
| $20,000 to $24,999 | 0 (0.0%) | 0 (0.0%) |
| $25,000 to $34,999 | 0 (0.0%) | 0 (0.0%) |
| $35,000 to $49,999 | 35 (7.9%) | 46 (80.7%) |
| $50,000 to $74,999 | 96 (21.6%) | 11 (19.3%) |
| $75,000 to $99,999 | 41 (9.2%) | 0 (0.0%) |
| $100,000 to $149,999 | 95 (21.3%) | 0 (0.0%) |
| $150,000 or more | 151 (33.9%) | 0 (0.0%) |
| Total | 445 (100.0%) | 57 (100.0%) |
Monthly Housing Cost Tiers in Duncan Falls
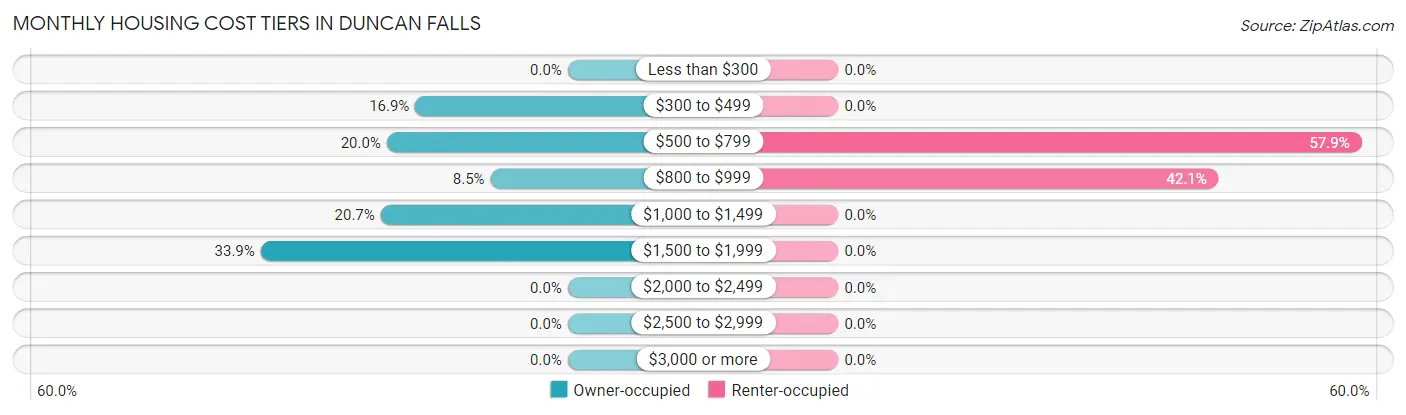
| Monthly Cost | Owner-occupied | Renter-occupied |
| Less than $300 | 0 (0.0%) | 0 (0.0%) |
| $300 to $499 | 75 (16.9%) | 0 (0.0%) |
| $500 to $799 | 89 (20.0%) | 33 (57.9%) |
| $800 to $999 | 38 (8.5%) | 24 (42.1%) |
| $1,000 to $1,499 | 92 (20.7%) | 0 (0.0%) |
| $1,500 to $1,999 | 151 (33.9%) | 0 (0.0%) |
| $2,000 to $2,499 | 0 (0.0%) | 0 (0.0%) |
| $2,500 to $2,999 | 0 (0.0%) | 0 (0.0%) |
| $3,000 or more | 0 (0.0%) | 0 (0.0%) |
| Total | 445 (100.0%) | 57 (100.0%) |
Physical Housing Characteristics in Duncan Falls
Housing Structures in Duncan Falls
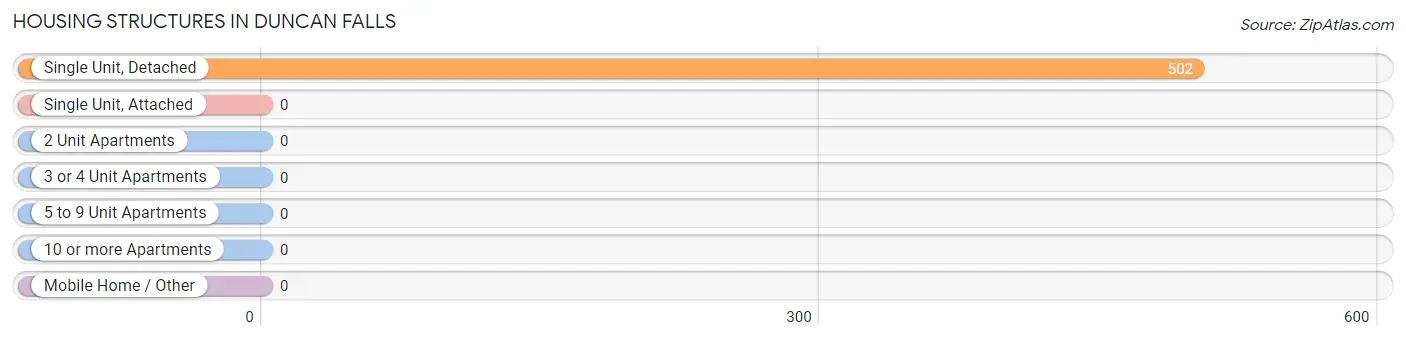
| Structure Type | # Housing Units | % Housing Units |
| Single Unit, Detached | 502 | 100.0% |
| Single Unit, Attached | 0 | 0.0% |
| 2 Unit Apartments | 0 | 0.0% |
| 3 or 4 Unit Apartments | 0 | 0.0% |
| 5 to 9 Unit Apartments | 0 | 0.0% |
| 10 or more Apartments | 0 | 0.0% |
| Mobile Home / Other | 0 | 0.0% |
| Total | 502 | 100.0% |
Housing Structures by Occupancy in Duncan Falls
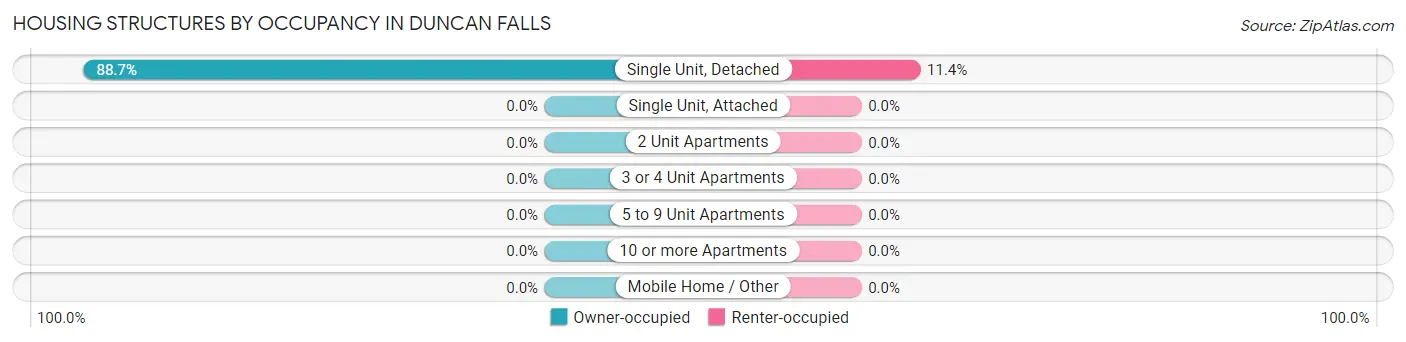
| Structure Type | Owner-occupied | Renter-occupied |
| Single Unit, Detached | 445 (88.6%) | 57 (11.4%) |
| Single Unit, Attached | 0 (0.0%) | 0 (0.0%) |
| 2 Unit Apartments | 0 (0.0%) | 0 (0.0%) |
| 3 or 4 Unit Apartments | 0 (0.0%) | 0 (0.0%) |
| 5 to 9 Unit Apartments | 0 (0.0%) | 0 (0.0%) |
| 10 or more Apartments | 0 (0.0%) | 0 (0.0%) |
| Mobile Home / Other | 0 (0.0%) | 0 (0.0%) |
| Total | 445 (88.6%) | 57 (11.4%) |
Housing Structures by Number of Rooms in Duncan Falls
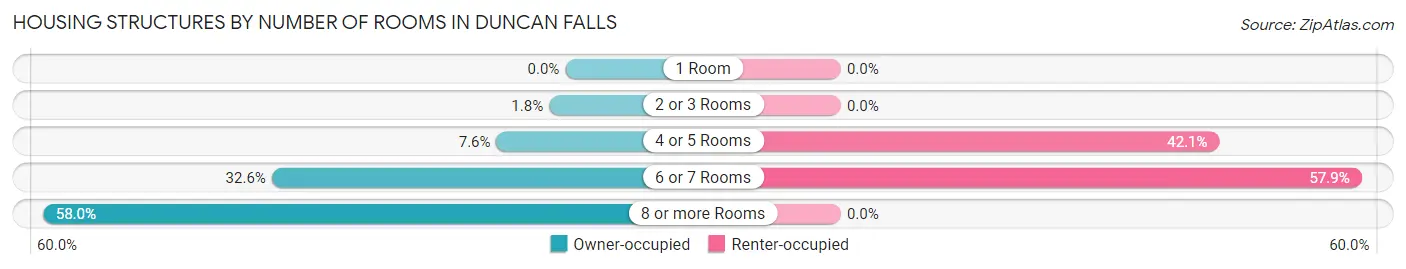
| Number of Rooms | Owner-occupied | Renter-occupied |
| 1 Room | 0 (0.0%) | 0 (0.0%) |
| 2 or 3 Rooms | 8 (1.8%) | 0 (0.0%) |
| 4 or 5 Rooms | 34 (7.6%) | 24 (42.1%) |
| 6 or 7 Rooms | 145 (32.6%) | 33 (57.9%) |
| 8 or more Rooms | 258 (58.0%) | 0 (0.0%) |
| Total | 445 (100.0%) | 57 (100.0%) |
Housing Structure by Heating Type in Duncan Falls
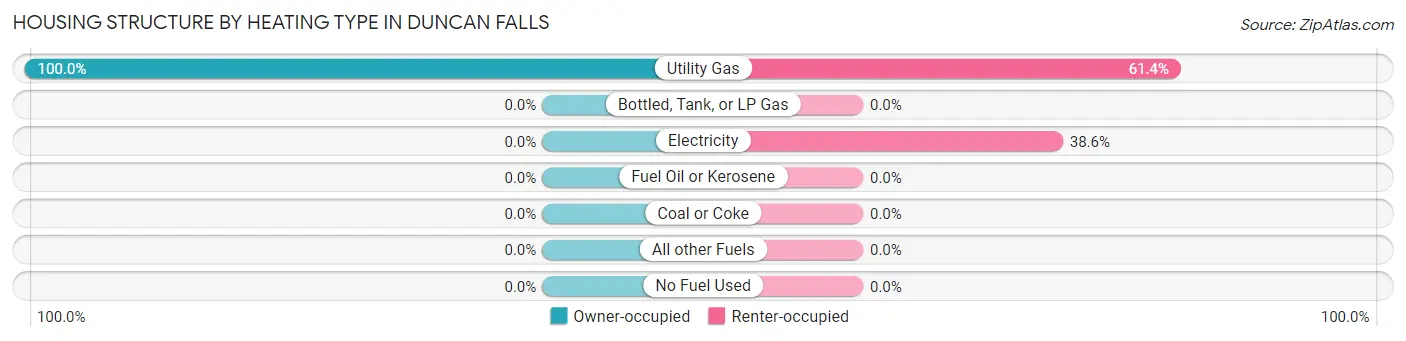
| Heating Type | Owner-occupied | Renter-occupied |
| Utility Gas | 445 (100.0%) | 35 (61.4%) |
| Bottled, Tank, or LP Gas | 0 (0.0%) | 0 (0.0%) |
| Electricity | 0 (0.0%) | 22 (38.6%) |
| Fuel Oil or Kerosene | 0 (0.0%) | 0 (0.0%) |
| Coal or Coke | 0 (0.0%) | 0 (0.0%) |
| All other Fuels | 0 (0.0%) | 0 (0.0%) |
| No Fuel Used | 0 (0.0%) | 0 (0.0%) |
| Total | 445 (100.0%) | 57 (100.0%) |
Household Vehicle Usage in Duncan Falls
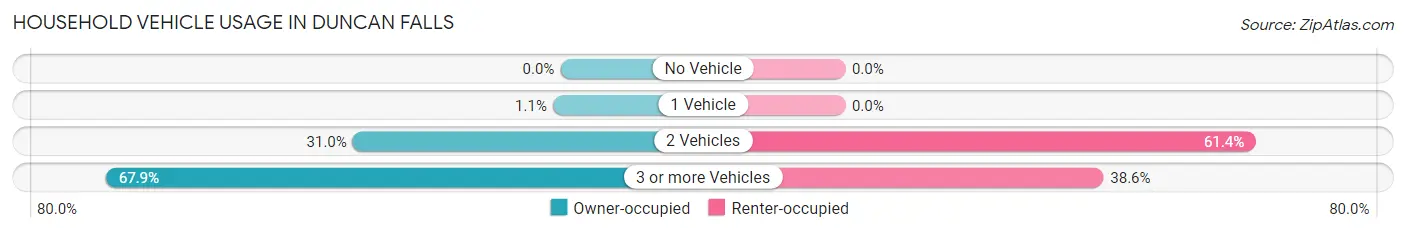
| Vehicles per Household | Owner-occupied | Renter-occupied |
| No Vehicle | 0 (0.0%) | 0 (0.0%) |
| 1 Vehicle | 5 (1.1%) | 0 (0.0%) |
| 2 Vehicles | 138 (31.0%) | 35 (61.4%) |
| 3 or more Vehicles | 302 (67.9%) | 22 (38.6%) |
| Total | 445 (100.0%) | 57 (100.0%) |
Real Estate & Mortgages in Duncan Falls
Real Estate and Mortgage Overview in Duncan Falls
| Characteristic | Without Mortgage | With Mortgage |
| Housing Units | 115 | 330 |
| Median Property Value | $137,800 | $240,900 |
| Median Household Income | $66,174 | $151 |
| Monthly Housing Costs | $458 | $0 |
| Real Estate Taxes | $1,164 | $0 |
Property Value by Mortgage Status in Duncan Falls
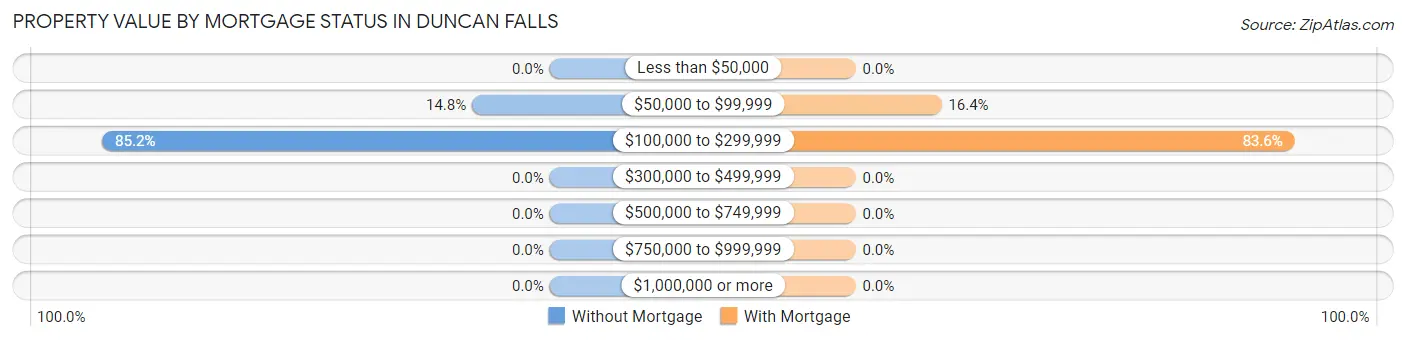
| Property Value | Without Mortgage | With Mortgage |
| Less than $50,000 | 0 (0.0%) | 0 (0.0%) |
| $50,000 to $99,999 | 17 (14.8%) | 54 (16.4%) |
| $100,000 to $299,999 | 98 (85.2%) | 276 (83.6%) |
| $300,000 to $499,999 | 0 (0.0%) | 0 (0.0%) |
| $500,000 to $749,999 | 0 (0.0%) | 0 (0.0%) |
| $750,000 to $999,999 | 0 (0.0%) | 0 (0.0%) |
| $1,000,000 or more | 0 (0.0%) | 0 (0.0%) |
| Total | 115 (100.0%) | 330 (100.0%) |
Household Income by Mortgage Status in Duncan Falls
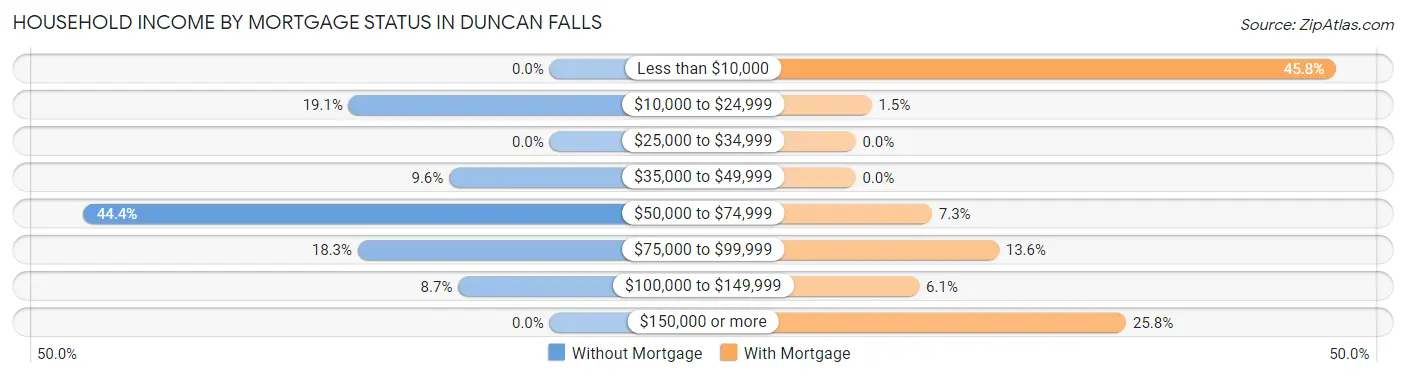
| Household Income | Without Mortgage | With Mortgage |
| Less than $10,000 | 0 (0.0%) | 151 (45.8%) |
| $10,000 to $24,999 | 22 (19.1%) | 5 (1.5%) |
| $25,000 to $34,999 | 0 (0.0%) | 0 (0.0%) |
| $35,000 to $49,999 | 11 (9.6%) | 0 (0.0%) |
| $50,000 to $74,999 | 51 (44.4%) | 24 (7.3%) |
| $75,000 to $99,999 | 21 (18.3%) | 45 (13.6%) |
| $100,000 to $149,999 | 10 (8.7%) | 20 (6.1%) |
| $150,000 or more | 0 (0.0%) | 85 (25.8%) |
| Total | 115 (100.0%) | 330 (100.0%) |
Property Value to Household Income Ratio in Duncan Falls
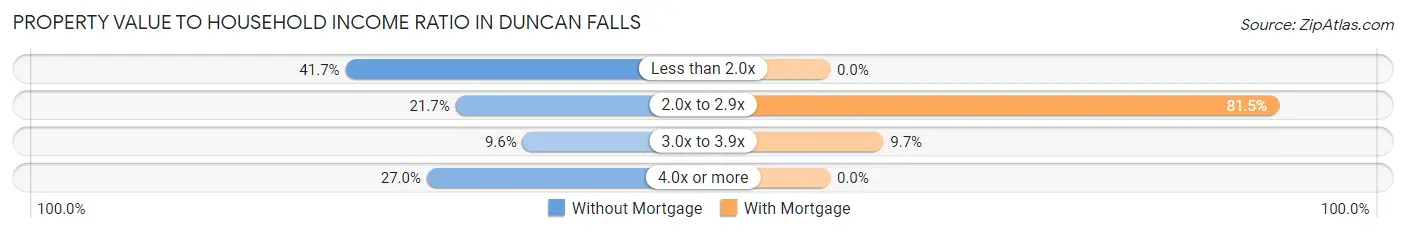
| Value-to-Income Ratio | Without Mortgage | With Mortgage |
| Less than 2.0x | 48 (41.7%) | 0 (0.0%) |
| 2.0x to 2.9x | 25 (21.7%) | 269 (81.5%) |
| 3.0x to 3.9x | 11 (9.6%) | 32 (9.7%) |
| 4.0x or more | 31 (27.0%) | 0 (0.0%) |
| Total | 115 (100.0%) | 330 (100.0%) |
Real Estate Taxes by Mortgage Status in Duncan Falls
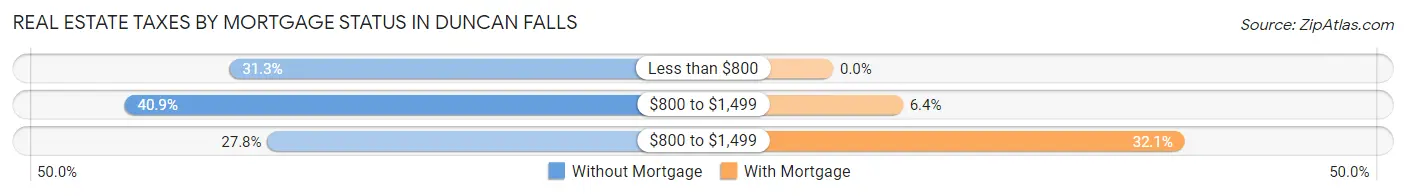
| Property Taxes | Without Mortgage | With Mortgage |
| Less than $800 | 36 (31.3%) | 0 (0.0%) |
| $800 to $1,499 | 47 (40.9%) | 21 (6.4%) |
| $800 to $1,499 | 32 (27.8%) | 106 (32.1%) |
| Total | 115 (100.0%) | 330 (100.0%) |
Health & Disability in Duncan Falls
Health Insurance Coverage by Age in Duncan Falls
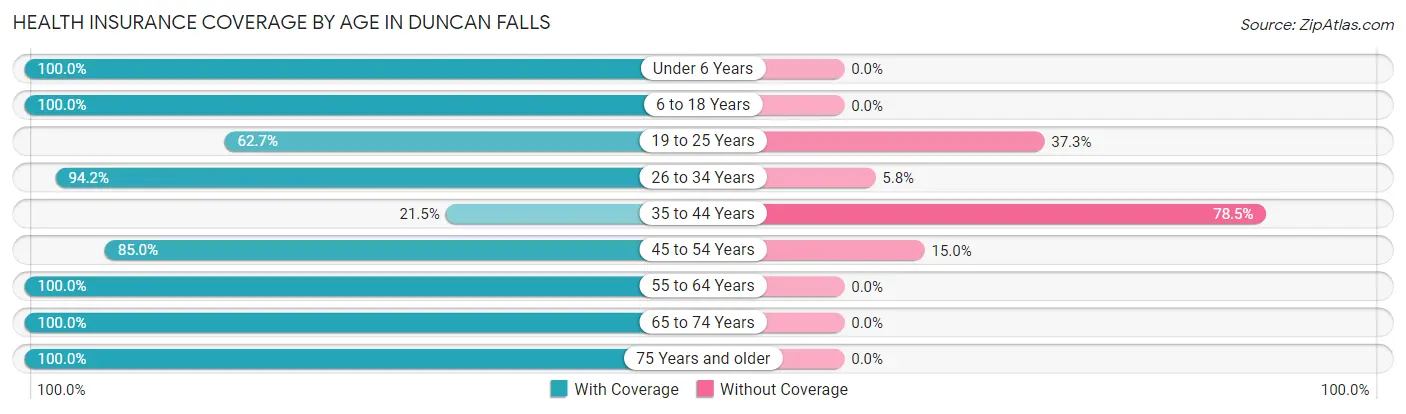
| Age Bracket | With Coverage | Without Coverage |
| Under 6 Years | 139 (100.0%) | 0 (0.0%) |
| 6 to 18 Years | 205 (100.0%) | 0 (0.0%) |
| 19 to 25 Years | 37 (62.7%) | 22 (37.3%) |
| 26 to 34 Years | 358 (94.2%) | 22 (5.8%) |
| 35 to 44 Years | 46 (21.5%) | 168 (78.5%) |
| 45 to 54 Years | 125 (85.0%) | 22 (15.0%) |
| 55 to 64 Years | 74 (100.0%) | 0 (0.0%) |
| 65 to 74 Years | 340 (100.0%) | 0 (0.0%) |
| 75 Years and older | 19 (100.0%) | 0 (0.0%) |
| Total | 1,343 (85.2%) | 234 (14.8%) |
Health Insurance Coverage by Citizenship Status in Duncan Falls
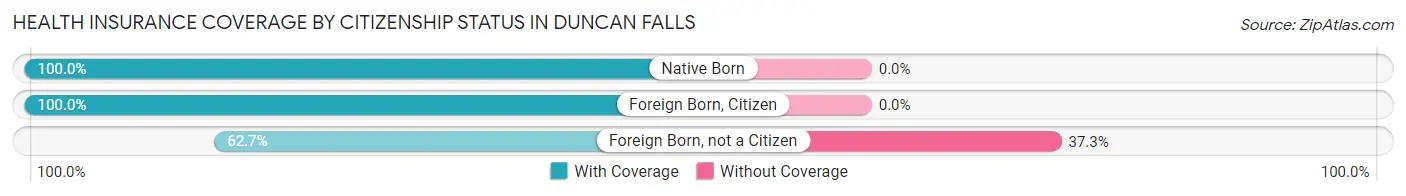
| Citizenship Status | With Coverage | Without Coverage |
| Native Born | 139 (100.0%) | 0 (0.0%) |
| Foreign Born, Citizen | 205 (100.0%) | 0 (0.0%) |
| Foreign Born, not a Citizen | 37 (62.7%) | 22 (37.3%) |
Health Insurance Coverage by Household Income in Duncan Falls
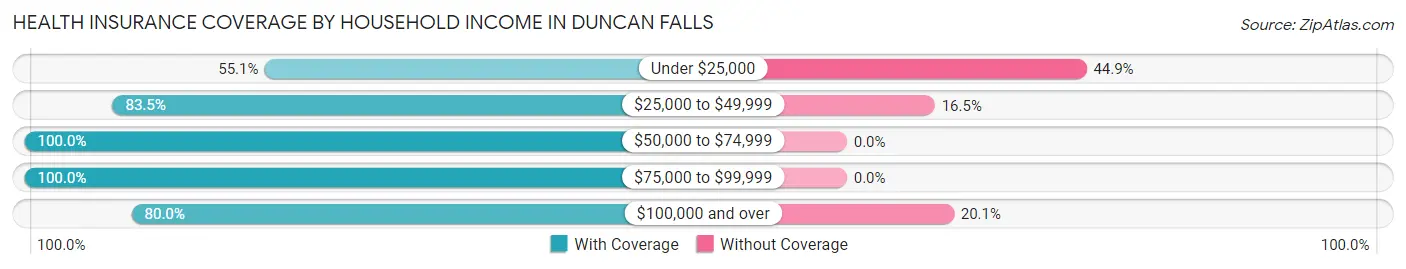
| Household Income | With Coverage | Without Coverage |
| Under $25,000 | 27 (55.1%) | 22 (44.9%) |
| $25,000 to $49,999 | 223 (83.5%) | 44 (16.5%) |
| $50,000 to $74,999 | 294 (100.0%) | 0 (0.0%) |
| $75,000 to $99,999 | 129 (100.0%) | 0 (0.0%) |
| $100,000 and over | 670 (79.9%) | 168 (20.1%) |
Public vs Private Health Insurance Coverage by Age in Duncan Falls
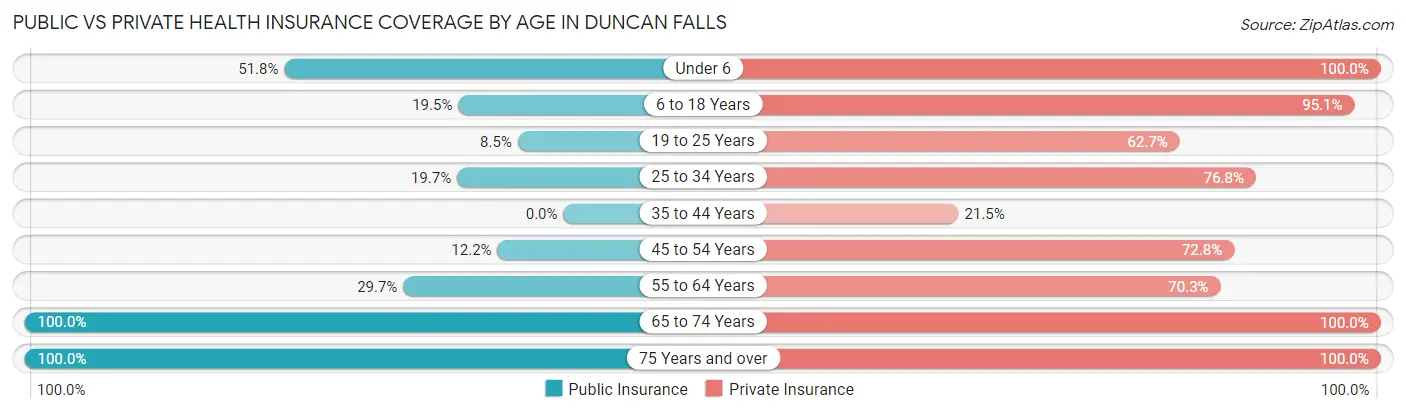
| Age Bracket | Public Insurance | Private Insurance |
| Under 6 | 72 (51.8%) | 139 (100.0%) |
| 6 to 18 Years | 40 (19.5%) | 195 (95.1%) |
| 19 to 25 Years | 5 (8.5%) | 37 (62.7%) |
| 25 to 34 Years | 75 (19.7%) | 292 (76.8%) |
| 35 to 44 Years | 0 (0.0%) | 46 (21.5%) |
| 45 to 54 Years | 18 (12.2%) | 107 (72.8%) |
| 55 to 64 Years | 22 (29.7%) | 52 (70.3%) |
| 65 to 74 Years | 340 (100.0%) | 340 (100.0%) |
| 75 Years and over | 19 (100.0%) | 19 (100.0%) |
| Total | 591 (37.5%) | 1,227 (77.8%) |
Disability Status by Sex by Age in Duncan Falls
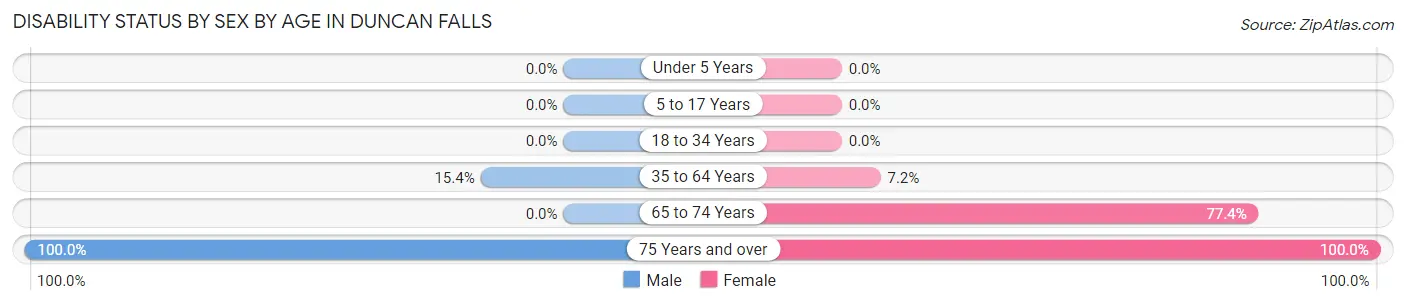
| Age Bracket | Male | Female |
| Under 5 Years | 0 (0.0%) | 0 (0.0%) |
| 5 to 17 Years | 0 (0.0%) | 0 (0.0%) |
| 18 to 34 Years | 0 (0.0%) | 0 (0.0%) |
| 35 to 64 Years | 22 (15.4%) | 21 (7.2%) |
| 65 to 74 Years | 0 (0.0%) | 123 (77.4%) |
| 75 Years and over | 9 (100.0%) | 10 (100.0%) |
Disability Class by Sex by Age in Duncan Falls
Disability Class: Hearing Difficulty
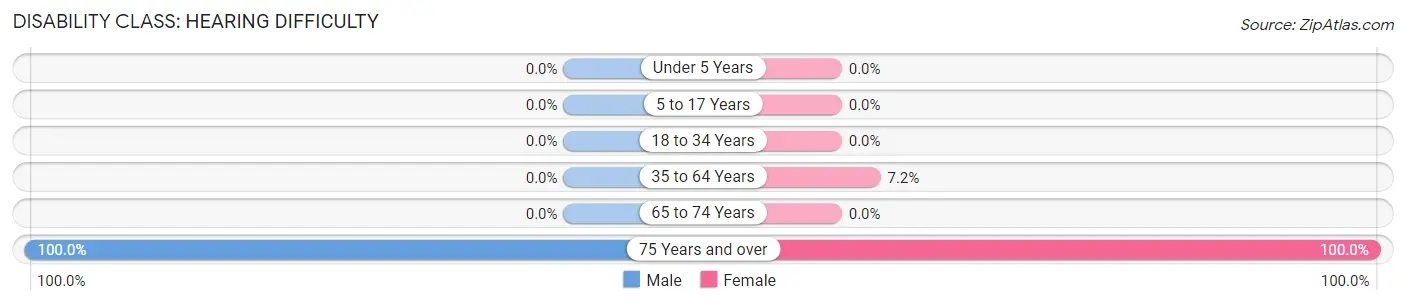
| Age Bracket | Male | Female |
| Under 5 Years | 0 (0.0%) | 0 (0.0%) |
| 5 to 17 Years | 0 (0.0%) | 0 (0.0%) |
| 18 to 34 Years | 0 (0.0%) | 0 (0.0%) |
| 35 to 64 Years | 0 (0.0%) | 21 (7.2%) |
| 65 to 74 Years | 0 (0.0%) | 0 (0.0%) |
| 75 Years and over | 9 (100.0%) | 10 (100.0%) |
Disability Class: Vision Difficulty
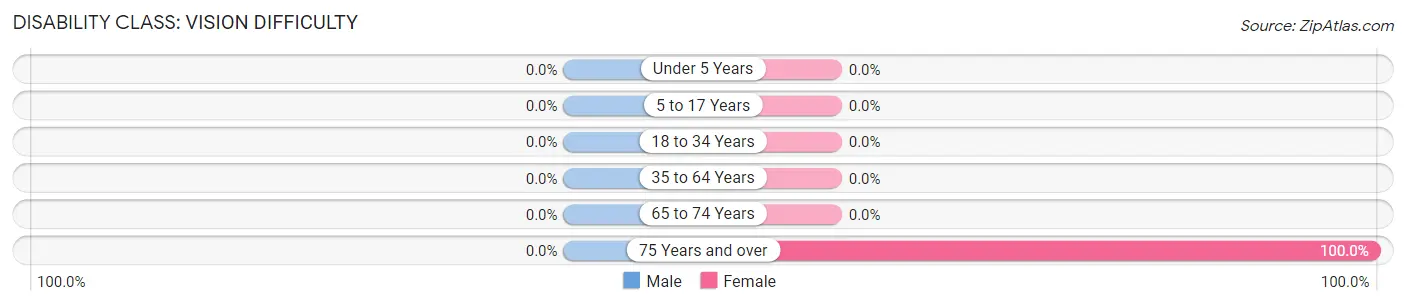
| Age Bracket | Male | Female |
| Under 5 Years | 0 (0.0%) | 0 (0.0%) |
| 5 to 17 Years | 0 (0.0%) | 0 (0.0%) |
| 18 to 34 Years | 0 (0.0%) | 0 (0.0%) |
| 35 to 64 Years | 0 (0.0%) | 0 (0.0%) |
| 65 to 74 Years | 0 (0.0%) | 0 (0.0%) |
| 75 Years and over | 0 (0.0%) | 10 (100.0%) |
Disability Class: Cognitive Difficulty
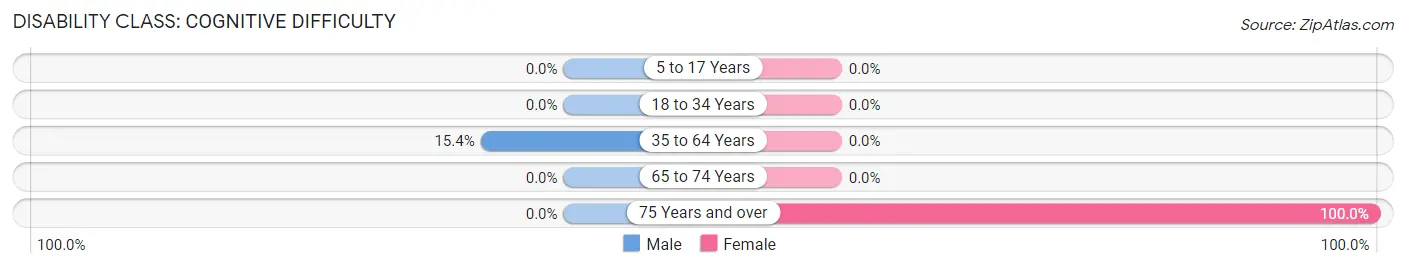
| Age Bracket | Male | Female |
| 5 to 17 Years | 0 (0.0%) | 0 (0.0%) |
| 18 to 34 Years | 0 (0.0%) | 0 (0.0%) |
| 35 to 64 Years | 22 (15.4%) | 0 (0.0%) |
| 65 to 74 Years | 0 (0.0%) | 0 (0.0%) |
| 75 Years and over | 0 (0.0%) | 10 (100.0%) |
Disability Class: Ambulatory Difficulty
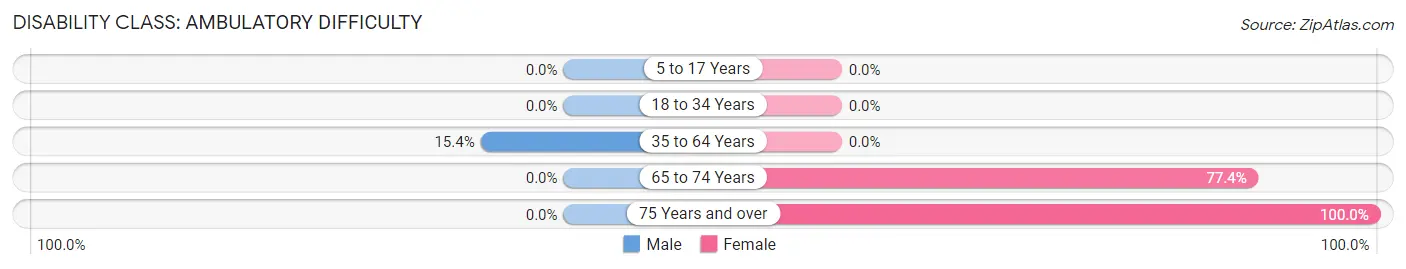
| Age Bracket | Male | Female |
| 5 to 17 Years | 0 (0.0%) | 0 (0.0%) |
| 18 to 34 Years | 0 (0.0%) | 0 (0.0%) |
| 35 to 64 Years | 22 (15.4%) | 0 (0.0%) |
| 65 to 74 Years | 0 (0.0%) | 123 (77.4%) |
| 75 Years and over | 0 (0.0%) | 10 (100.0%) |
Disability Class: Self-Care Difficulty
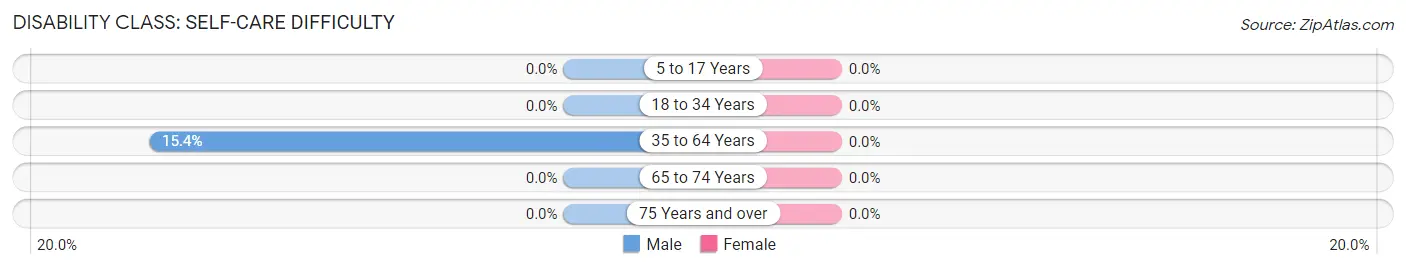
| Age Bracket | Male | Female |
| 5 to 17 Years | 0 (0.0%) | 0 (0.0%) |
| 18 to 34 Years | 0 (0.0%) | 0 (0.0%) |
| 35 to 64 Years | 22 (15.4%) | 0 (0.0%) |
| 65 to 74 Years | 0 (0.0%) | 0 (0.0%) |
| 75 Years and over | 0 (0.0%) | 0 (0.0%) |
Technology Access in Duncan Falls
Computing Device Access in Duncan Falls
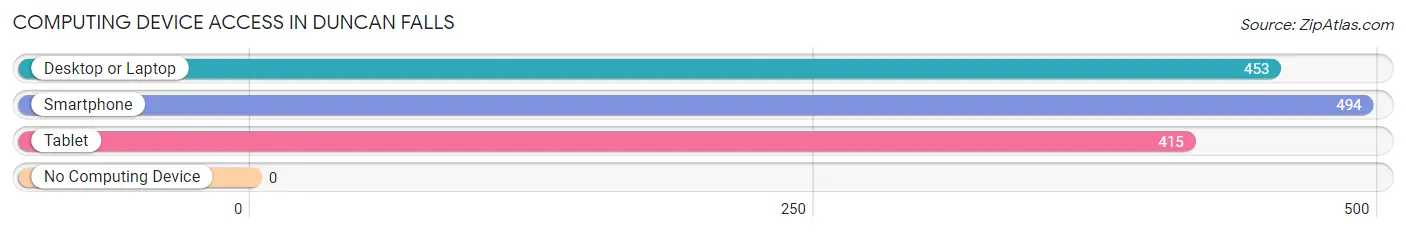
| Device Type | # Households | % Households |
| Desktop or Laptop | 453 | 90.2% |
| Smartphone | 494 | 98.4% |
| Tablet | 415 | 82.7% |
| No Computing Device | 0 | 0.0% |
| Total | 502 | 100.0% |
Internet Access in Duncan Falls
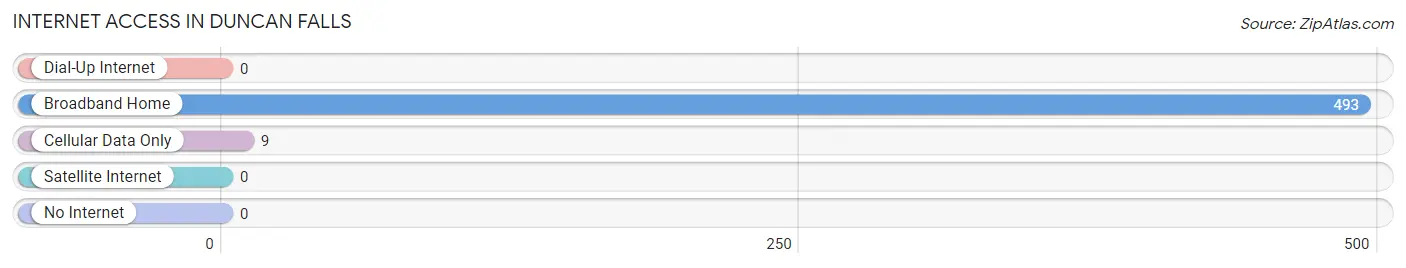
| Internet Type | # Households | % Households |
| Dial-Up Internet | 0 | 0.0% |
| Broadband Home | 493 | 98.2% |
| Cellular Data Only | 9 | 1.8% |
| Satellite Internet | 0 | 0.0% |
| No Internet | 0 | 0.0% |
| Total | 502 | 100.0% |
Duncan Falls Summary
Duncan Falls is a small village located in Muskingum County, Ohio. It is situated along the Muskingum River, approximately 10 miles east of Zanesville. The village has a population of approximately 1,000 people and is part of the Zanesville Metropolitan Statistical Area.
History
The area that is now Duncan Falls was first settled in 1805 by a group of settlers from Pennsylvania. The village was originally known as “Duncan’s Falls” after the first settler, John Duncan. The village was officially incorporated in 1837 and was named after Duncan.
The village was a major stop on the Ohio and Erie Canal, which was completed in 1832. The canal provided a major transportation route for goods and people between the Ohio River and Lake Erie. The canal was a major economic driver for the village and the surrounding area.
The village was also home to a number of industries, including a flour mill, a sawmill, a grist mill, and a woolen mill. These industries provided employment for many of the village’s residents.
Geography
Duncan Falls is located in Muskingum County, Ohio. It is situated along the Muskingum River, approximately 10 miles east of Zanesville. The village is located in a rural area and is surrounded by rolling hills and farmland.
The village is located at an elevation of 845 feet above sea level. The climate is humid continental, with hot summers and cold winters. The average annual temperature is 52 degrees Fahrenheit.
Economy
The economy of Duncan Falls is largely based on agriculture and tourism. The village is home to a number of farms, which produce a variety of crops, including corn, soybeans, and wheat. The village is also home to a number of tourist attractions, including the Ohio and Erie Canal, the Muskingum River, and the Duncan Falls Historical Society.
The village is also home to a number of small businesses, including restaurants, retail stores, and service providers. The village is served by a number of local and regional transportation services, including bus and rail.
Demographics
As of the 2010 census, the population of Duncan Falls was 1,000. The racial makeup of the village was 97.2% White, 0.7% African American, 0.2% Native American, 0.2% Asian, and 1.7% from other races. The median household income was $37,500, and the median family income was $45,000.
The village is served by the Duncan Falls Local School District. The district consists of two elementary schools, one middle school, and one high school. The village is also home to a number of churches, including the Duncan Falls United Methodist Church and the Duncan Falls Baptist Church.
Conclusion
Duncan Falls is a small village located in Muskingum County, Ohio. It is situated along the Muskingum River, approximately 10 miles east of Zanesville. The village has a population of approximately 1,000 people and is part of the Zanesville Metropolitan Statistical Area. The economy of Duncan Falls is largely based on agriculture and tourism, and the village is served by a number of local and regional transportation services. The village is also home to a number of small businesses, churches, and schools.
Common Questions
What is Per Capita Income in Duncan Falls?
Per Capita income in Duncan Falls is $38,069.
What is the Median Family Income in Duncan Falls?
Median Family Income in Duncan Falls is $105,670.
What is the Median Household income in Duncan Falls?
Median Household Income in Duncan Falls is $91,875.
What is Inequality or Gini Index in Duncan Falls?
Inequality or Gini Index in Duncan Falls is 0.36.
What is the Total Population of Duncan Falls?
Total Population of Duncan Falls is 1,577.
What is the Total Male Population of Duncan Falls?
Total Male Population of Duncan Falls is 843.
What is the Total Female Population of Duncan Falls?
Total Female Population of Duncan Falls is 734.
What is the Ratio of Males per 100 Females in Duncan Falls?
There are 114.85 Males per 100 Females in Duncan Falls.
What is the Ratio of Females per 100 Males in Duncan Falls?
There are 87.07 Females per 100 Males in Duncan Falls.
What is the Median Population Age in Duncan Falls?
Median Population Age in Duncan Falls is 35.4 Years.
What is the Average Family Size in Duncan Falls
Average Family Size in Duncan Falls is 3.1 People.
What is the Average Household Size in Duncan Falls
Average Household Size in Duncan Falls is 3.1 People.
How Large is the Labor Force in Duncan Falls?
There are 767 People in the Labor Forcein in Duncan Falls.
What is the Percentage of People in the Labor Force in Duncan Falls?
62.2% of People are in the Labor Force in Duncan Falls.
What is the Unemployment Rate in Duncan Falls?
Unemployment Rate in Duncan Falls is 4.6%.