Washingtonville, OH Map & Demographics
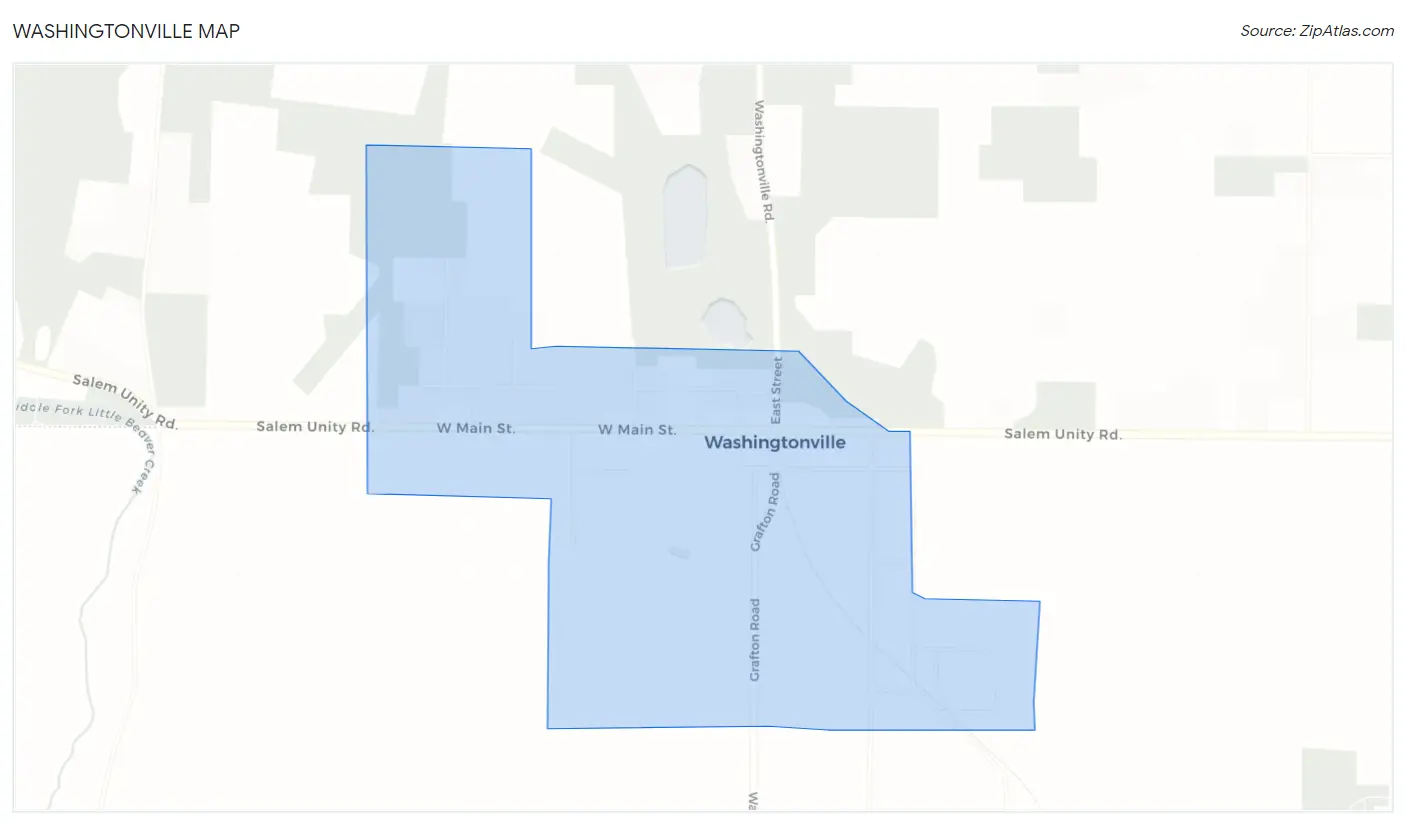
Washingtonville Map
Washingtonville Overview
$28,816
PER CAPITA INCOME
$45,938
AVG FAMILY INCOME
$44,886
AVG HOUSEHOLD INCOME
23.3%
WAGE / INCOME GAP [ % ]
76.7¢/ $1
WAGE / INCOME GAP [ $ ]
$12,515
FAMILY INCOME DEFICIT
0.53
INEQUALITY / GINI INDEX
746
TOTAL POPULATION
356
MALE POPULATION
390
FEMALE POPULATION
91.28
MALES / 100 FEMALES
109.55
FEMALES / 100 MALES
42.1
MEDIAN AGE
2.7
AVG FAMILY SIZE
2.4
AVG HOUSEHOLD SIZE
310
LABOR FORCE [ PEOPLE ]
55.3%
PERCENT IN LABOR FORCE
8.7%
UNEMPLOYMENT RATE
Washingtonville Zip Codes
Washingtonville Area Codes
Income in Washingtonville
Income Overview in Washingtonville
Per Capita Income in Washingtonville is $28,816, while median incomes of families and households are $45,938 and $44,886 respectively.
| Characteristic | Number | Measure |
| Per Capita Income | 746 | $28,816 |
| Median Family Income | 223 | $45,938 |
| Mean Family Income | 223 | $68,123 |
| Median Household Income | 313 | $44,886 |
| Mean Household Income | 313 | $67,165 |
| Income Deficit | 223 | $12,515 |
| Wage / Income Gap (%) | 746 | 23.26% |
| Wage / Income Gap ($) | 746 | 76.74¢ per $1 |
| Gini / Inequality Index | 746 | 0.53 |
Earnings by Sex in Washingtonville
Average Earnings in Washingtonville are $29,479, $35,833 for men and $27,500 for women, a difference of 23.3%.
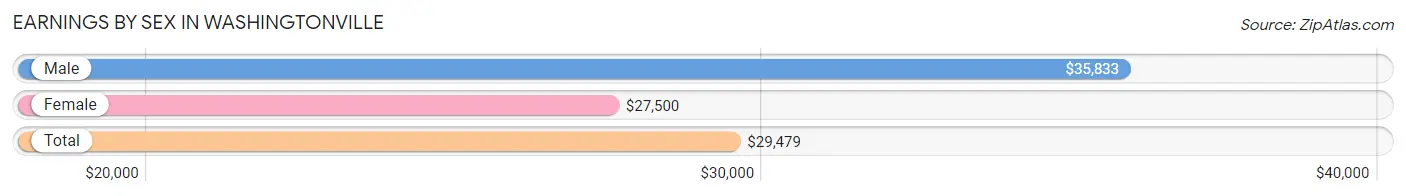
| Sex | Number | Average Earnings |
| Male | 152 (46.6%) | $35,833 |
| Female | 174 (53.4%) | $27,500 |
| Total | 326 (100.0%) | $29,479 |
Earnings by Sex by Income Bracket in Washingtonville
The most common earnings brackets in Washingtonville are $40,000 to $44,999 for men (23 | 15.1%) and $25,000 to $29,999 for women (30 | 17.2%).
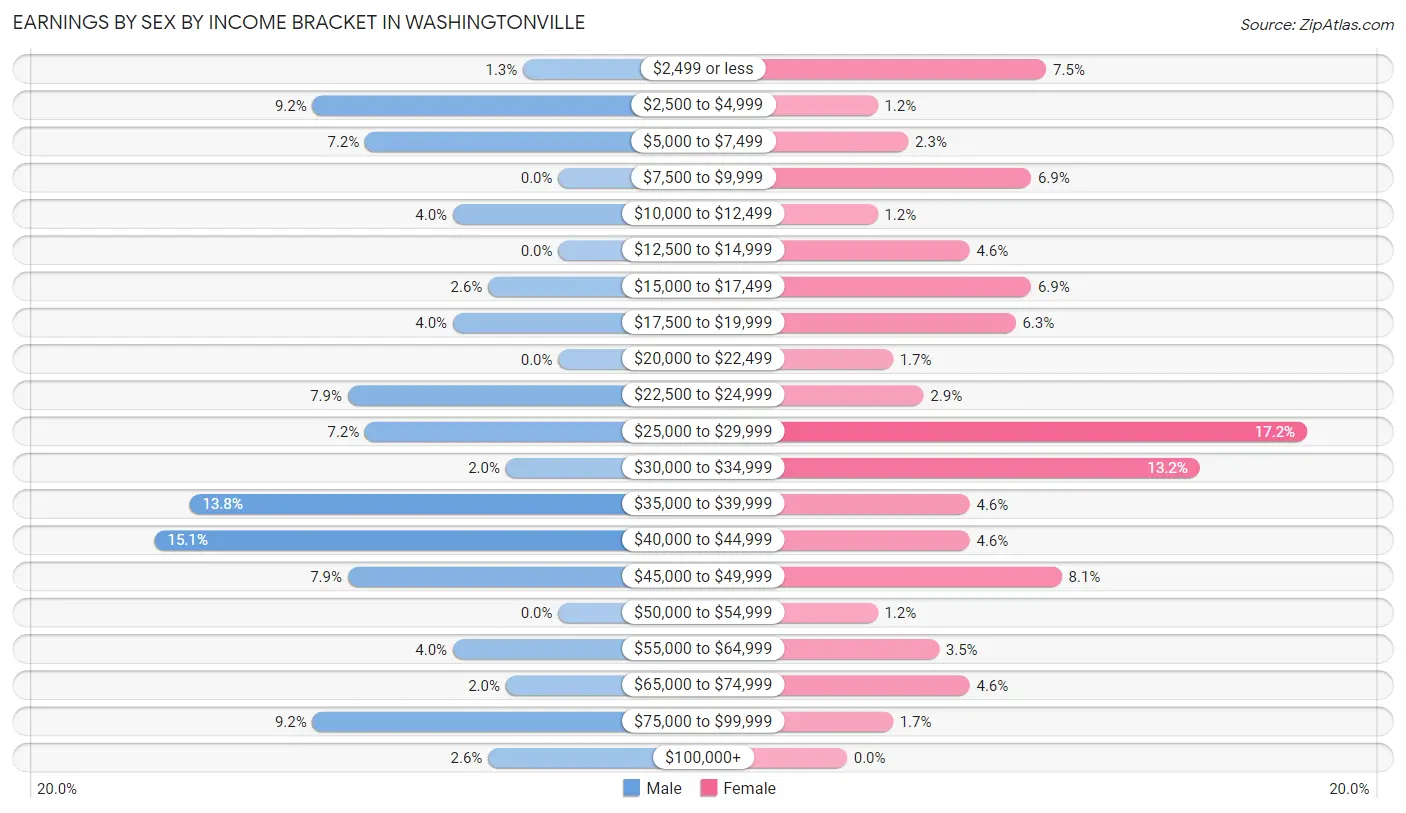
| Income | Male | Female |
| $2,499 or less | 2 (1.3%) | 13 (7.5%) |
| $2,500 to $4,999 | 14 (9.2%) | 2 (1.1%) |
| $5,000 to $7,499 | 11 (7.2%) | 4 (2.3%) |
| $7,500 to $9,999 | 0 (0.0%) | 12 (6.9%) |
| $10,000 to $12,499 | 6 (4.0%) | 2 (1.1%) |
| $12,500 to $14,999 | 0 (0.0%) | 8 (4.6%) |
| $15,000 to $17,499 | 4 (2.6%) | 12 (6.9%) |
| $17,500 to $19,999 | 6 (4.0%) | 11 (6.3%) |
| $20,000 to $22,499 | 0 (0.0%) | 3 (1.7%) |
| $22,500 to $24,999 | 12 (7.9%) | 5 (2.9%) |
| $25,000 to $29,999 | 11 (7.2%) | 30 (17.2%) |
| $30,000 to $34,999 | 3 (2.0%) | 23 (13.2%) |
| $35,000 to $39,999 | 21 (13.8%) | 8 (4.6%) |
| $40,000 to $44,999 | 23 (15.1%) | 8 (4.6%) |
| $45,000 to $49,999 | 12 (7.9%) | 14 (8.1%) |
| $50,000 to $54,999 | 0 (0.0%) | 2 (1.1%) |
| $55,000 to $64,999 | 6 (4.0%) | 6 (3.5%) |
| $65,000 to $74,999 | 3 (2.0%) | 8 (4.6%) |
| $75,000 to $99,999 | 14 (9.2%) | 3 (1.7%) |
| $100,000+ | 4 (2.6%) | 0 (0.0%) |
| Total | 152 (100.0%) | 174 (100.0%) |
Earnings by Sex by Educational Attainment in Washingtonville
Average earnings in Washingtonville are $36,488 for men and $28,500 for women, a difference of 21.9%. Men with an educational attainment of bachelor's degree enjoy the highest average annual earnings of $42,750, while those with college or associate's degree education earn the least with $35,833. Women with an educational attainment of bachelor's degree earn the most with the average annual earnings of $57,917, while those with high school diploma education have the smallest earnings of $18,125.
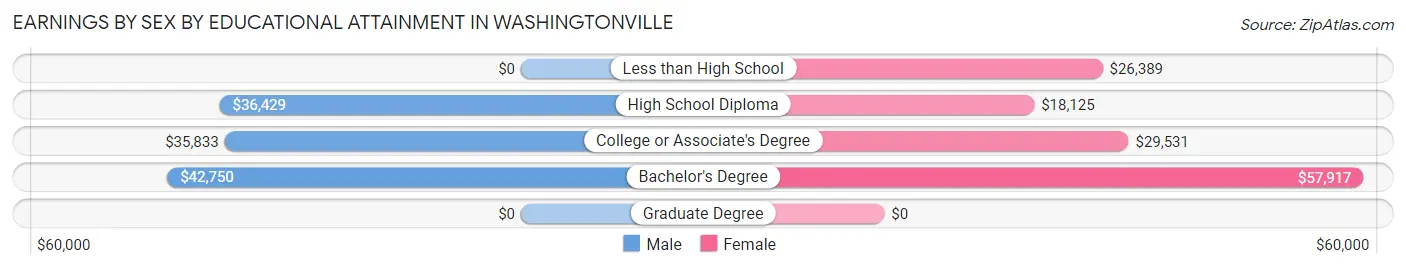
| Educational Attainment | Male Income | Female Income |
| Less than High School | - | - |
| High School Diploma | $36,429 | $18,125 |
| College or Associate's Degree | $35,833 | $29,531 |
| Bachelor's Degree | $42,750 | $57,917 |
| Graduate Degree | - | - |
| Total | $36,488 | $28,500 |
Family Income in Washingtonville
Family Income Brackets in Washingtonville
According to the Washingtonville family income data, there are 49 families falling into the $50,000 to $74,999 income range, which is the most common income bracket and makes up 22.0% of all families.
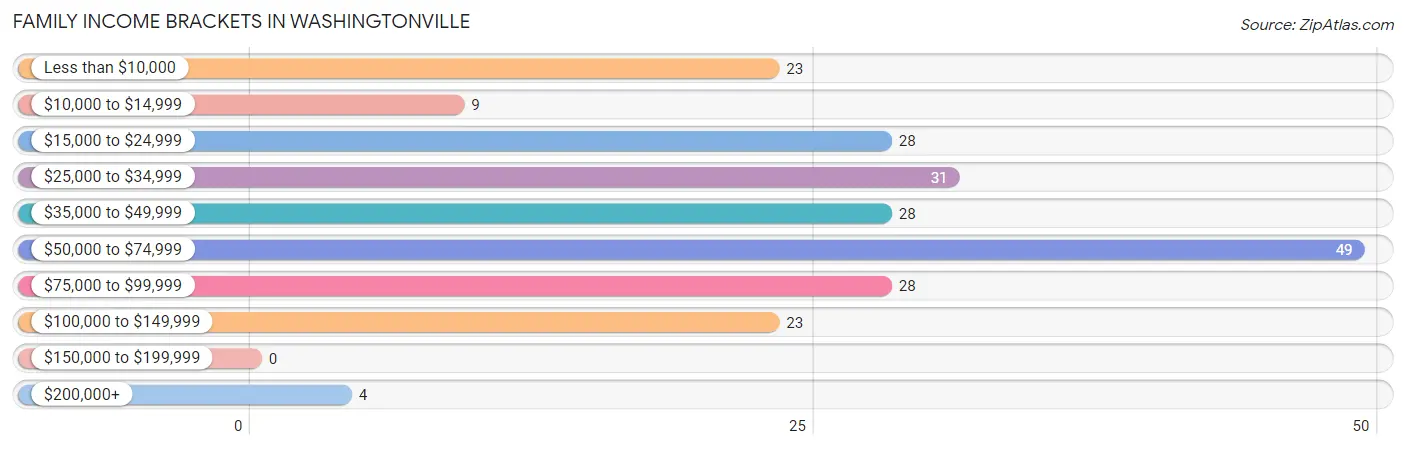
| Income Bracket | # Families | % Families |
| Less than $10,000 | 23 | 10.3% |
| $10,000 to $14,999 | 9 | 4.0% |
| $15,000 to $24,999 | 28 | 12.6% |
| $25,000 to $34,999 | 31 | 13.9% |
| $35,000 to $49,999 | 28 | 12.6% |
| $50,000 to $74,999 | 49 | 22.0% |
| $75,000 to $99,999 | 28 | 12.6% |
| $100,000 to $149,999 | 23 | 10.3% |
| $150,000 to $199,999 | 0 | 0.0% |
| $200,000+ | 4 | 1.8% |
Family Income by Famaliy Size in Washingtonville
3-person families (61 | 27.4%) account for the highest median family income in Washingtonville with $64,583 per family, while 2-person families (120 | 53.8%) have the highest median income of $21,875 per family member.
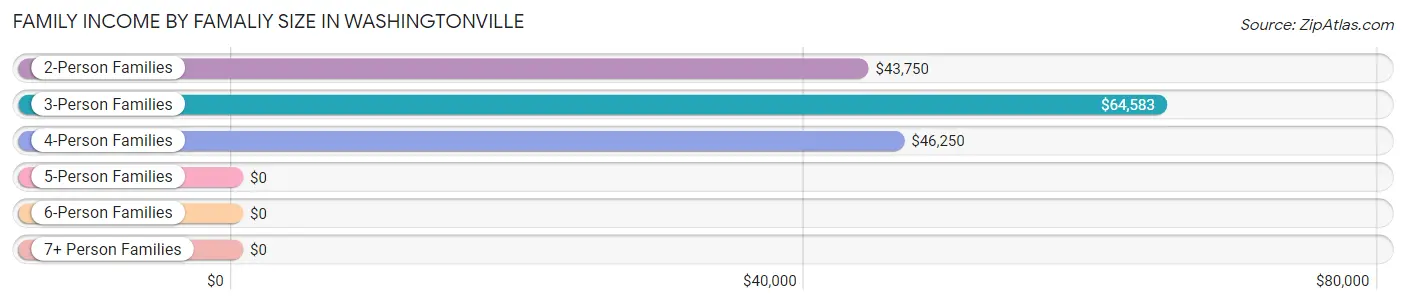
| Income Bracket | # Families | Median Income |
| 2-Person Families | 120 (53.8%) | $43,750 |
| 3-Person Families | 61 (27.4%) | $64,583 |
| 4-Person Families | 33 (14.8%) | $46,250 |
| 5-Person Families | 9 (4.0%) | $0 |
| 6-Person Families | 0 (0.0%) | $0 |
| 7+ Person Families | 0 (0.0%) | $0 |
| Total | 223 (100.0%) | $45,938 |
Family Income by Number of Earners in Washingtonville
The median family income in Washingtonville is $45,938, with families comprising 3+ earners (5) having the highest median family income of $126,250, while families with no earners (49) have the lowest median family income of $26,250, accounting for 2.2% and 22.0% of families, respectively.
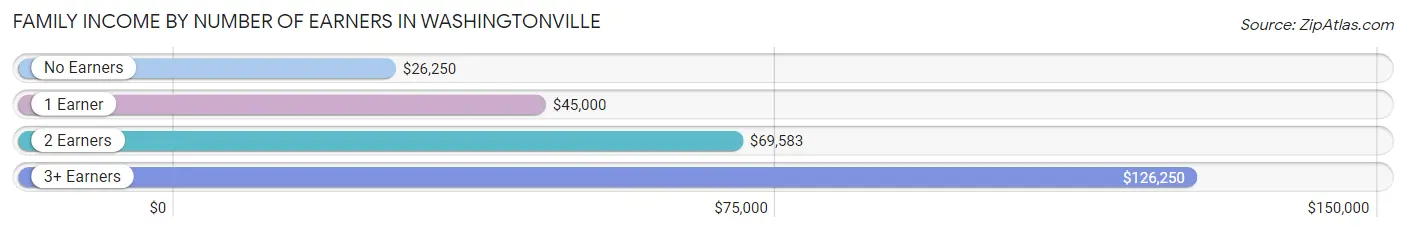
| Number of Earners | # Families | Median Income |
| No Earners | 49 (22.0%) | $26,250 |
| 1 Earner | 118 (52.9%) | $45,000 |
| 2 Earners | 51 (22.9%) | $69,583 |
| 3+ Earners | 5 (2.2%) | $126,250 |
| Total | 223 (100.0%) | $45,938 |
Household Income in Washingtonville
Household Income Brackets in Washingtonville
With 70 households falling in the category, the $50,000 to $74,999 income range is the most frequent in Washingtonville, accounting for 22.4% of all households.
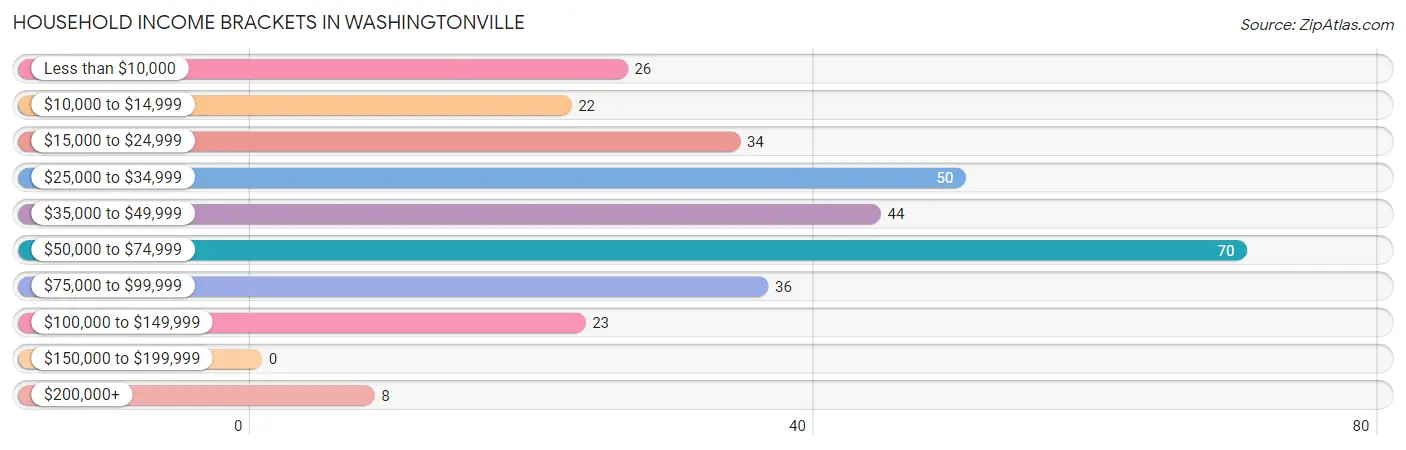
| Income Bracket | # Households | % Households |
| Less than $10,000 | 26 | 8.3% |
| $10,000 to $14,999 | 22 | 7.0% |
| $15,000 to $24,999 | 34 | 10.9% |
| $25,000 to $34,999 | 50 | 16.0% |
| $35,000 to $49,999 | 44 | 14.1% |
| $50,000 to $74,999 | 70 | 22.4% |
| $75,000 to $99,999 | 36 | 11.5% |
| $100,000 to $149,999 | 23 | 7.3% |
| $150,000 to $199,999 | 0 | 0.0% |
| $200,000+ | 8 | 2.6% |
Household Income by Householder Age in Washingtonville
The median household income in Washingtonville is $44,886, with the highest median household income of $47,250 found in the 65+ years age bracket for the primary householder. A total of 84 households (26.8%) fall into this category. Meanwhile, the 15 to 24 years age bracket for the primary householder has the lowest median household income of $0, with 12 households (3.8%) in this group.
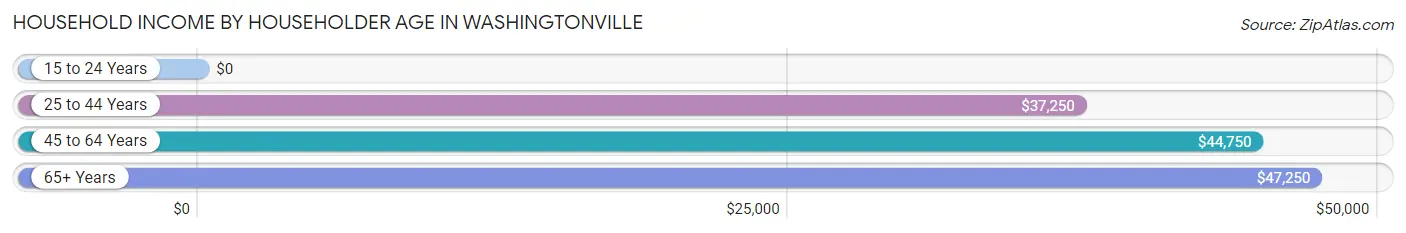
| Income Bracket | # Households | Median Income |
| 15 to 24 Years | 12 (3.8%) | $0 |
| 25 to 44 Years | 88 (28.1%) | $37,250 |
| 45 to 64 Years | 129 (41.2%) | $44,750 |
| 65+ Years | 84 (26.8%) | $47,250 |
| Total | 313 (100.0%) | $44,886 |
Poverty in Washingtonville
Income Below Poverty by Sex and Age in Washingtonville
With 20.8% poverty level for males and 31.3% for females among the residents of Washingtonville, under 5 year old males and under 5 year old females are the most vulnerable to poverty, with 11 males (68.8%) and 19 females (63.3%) in their respective age groups living below the poverty level.
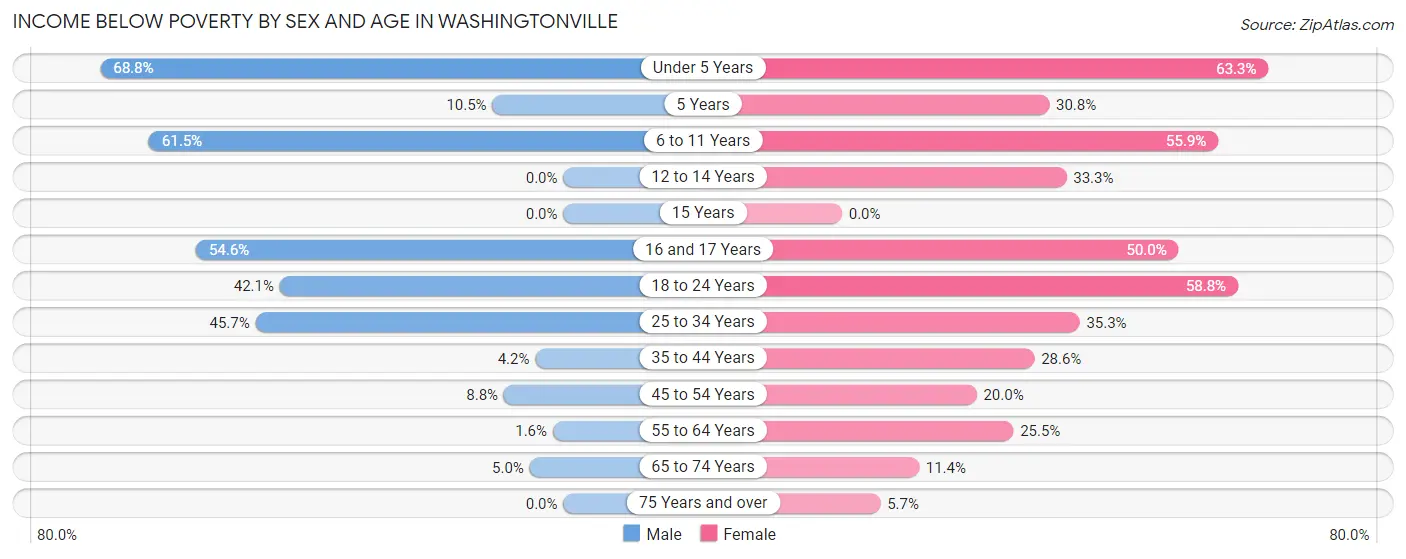
| Age Bracket | Male | Female |
| Under 5 Years | 11 (68.8%) | 19 (63.3%) |
| 5 Years | 2 (10.5%) | 4 (30.8%) |
| 6 to 11 Years | 24 (61.5%) | 19 (55.9%) |
| 12 to 14 Years | 0 (0.0%) | 5 (33.3%) |
| 15 Years | 0 (0.0%) | 0 (0.0%) |
| 16 and 17 Years | 6 (54.5%) | 3 (50.0%) |
| 18 to 24 Years | 8 (42.1%) | 10 (58.8%) |
| 25 to 34 Years | 16 (45.7%) | 18 (35.3%) |
| 35 to 44 Years | 1 (4.2%) | 14 (28.6%) |
| 45 to 54 Years | 3 (8.8%) | 10 (20.0%) |
| 55 to 64 Years | 1 (1.6%) | 14 (25.5%) |
| 65 to 74 Years | 2 (5.0%) | 4 (11.4%) |
| 75 Years and over | 0 (0.0%) | 2 (5.7%) |
| Total | 74 (20.8%) | 122 (31.3%) |
Income Above Poverty by Sex and Age in Washingtonville
According to the poverty statistics in Washingtonville, males aged 12 to 14 years and females aged 75 years and over are the age groups that are most secure financially, with 100.0% of males and 94.3% of females in these age groups living above the poverty line.
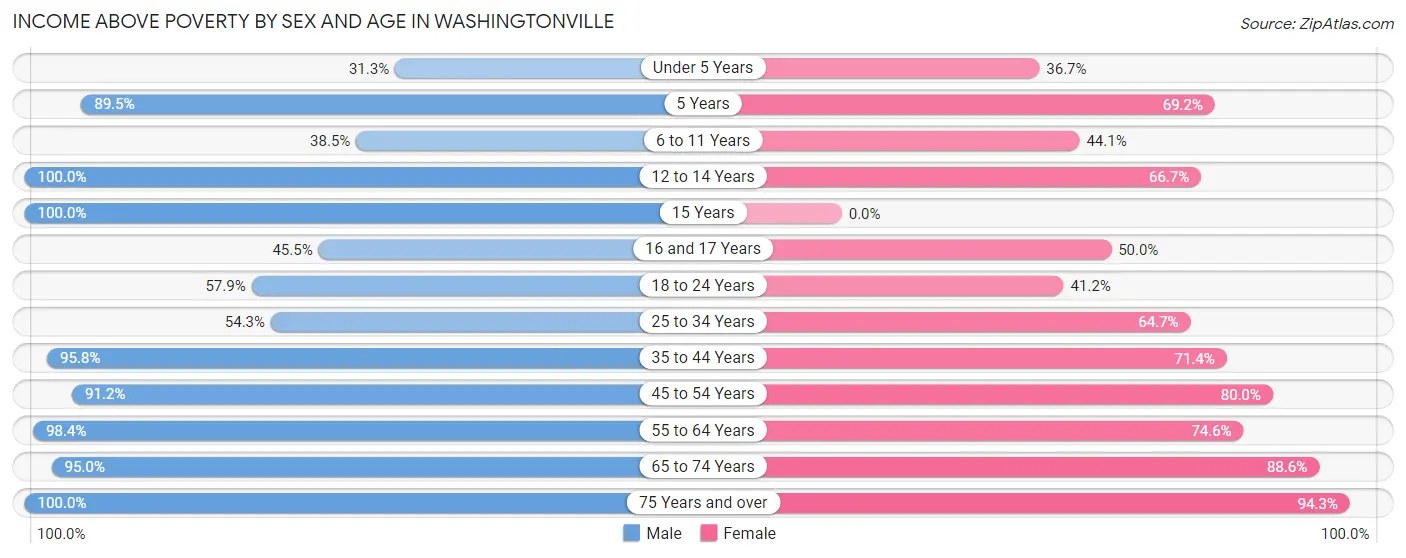
| Age Bracket | Male | Female |
| Under 5 Years | 5 (31.2%) | 11 (36.7%) |
| 5 Years | 17 (89.5%) | 9 (69.2%) |
| 6 to 11 Years | 15 (38.5%) | 15 (44.1%) |
| 12 to 14 Years | 11 (100.0%) | 10 (66.7%) |
| 15 Years | 8 (100.0%) | 0 (0.0%) |
| 16 and 17 Years | 5 (45.5%) | 3 (50.0%) |
| 18 to 24 Years | 11 (57.9%) | 7 (41.2%) |
| 25 to 34 Years | 19 (54.3%) | 33 (64.7%) |
| 35 to 44 Years | 23 (95.8%) | 35 (71.4%) |
| 45 to 54 Years | 31 (91.2%) | 40 (80.0%) |
| 55 to 64 Years | 63 (98.4%) | 41 (74.6%) |
| 65 to 74 Years | 38 (95.0%) | 31 (88.6%) |
| 75 Years and over | 36 (100.0%) | 33 (94.3%) |
| Total | 282 (79.2%) | 268 (68.7%) |
Income Below Poverty Among Married-Couple Families in Washingtonville
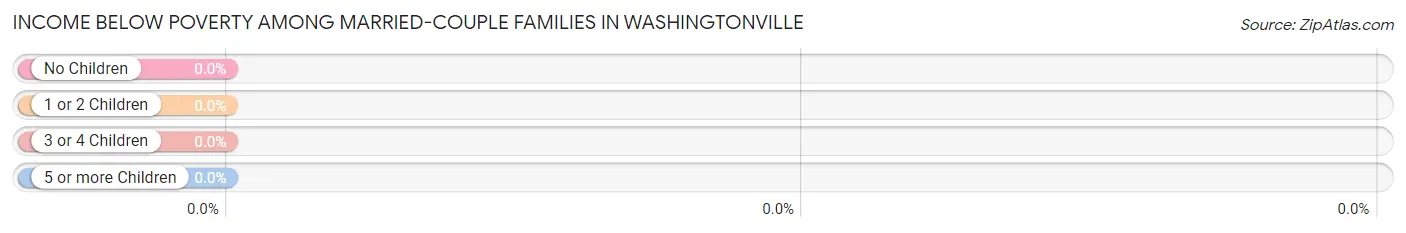
| Children | Above Poverty | Below Poverty |
| No Children | 86 (100.0%) | 0 (0.0%) |
| 1 or 2 Children | 31 (100.0%) | 0 (0.0%) |
| 3 or 4 Children | 1 (100.0%) | 0 (0.0%) |
| 5 or more Children | 0 (0.0%) | 0 (0.0%) |
| Total | 118 (100.0%) | 0 (0.0%) |
Income Below Poverty Among Single-Parent Households in Washingtonville
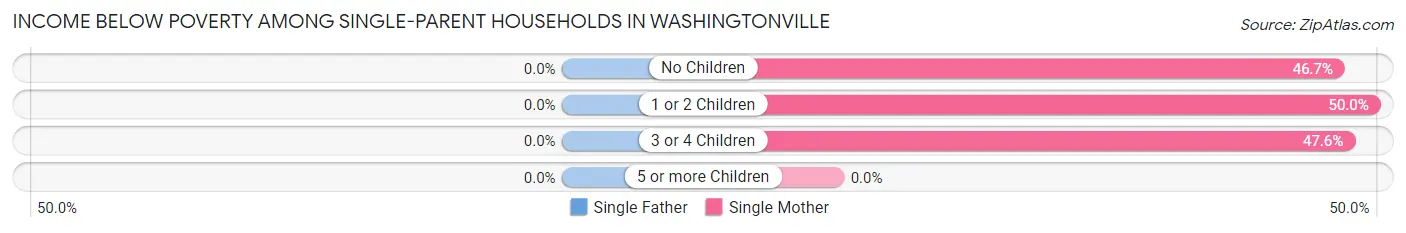
| Children | Single Father | Single Mother |
| No Children | 0 (0.0%) | 7 (46.7%) |
| 1 or 2 Children | 0 (0.0%) | 30 (50.0%) |
| 3 or 4 Children | 0 (0.0%) | 10 (47.6%) |
| 5 or more Children | 0 (0.0%) | 0 (0.0%) |
| Total | 0 (0.0%) | 47 (49.0%) |
Income Below Poverty Among Married-Couple vs Single-Parent Households in Washingtonville
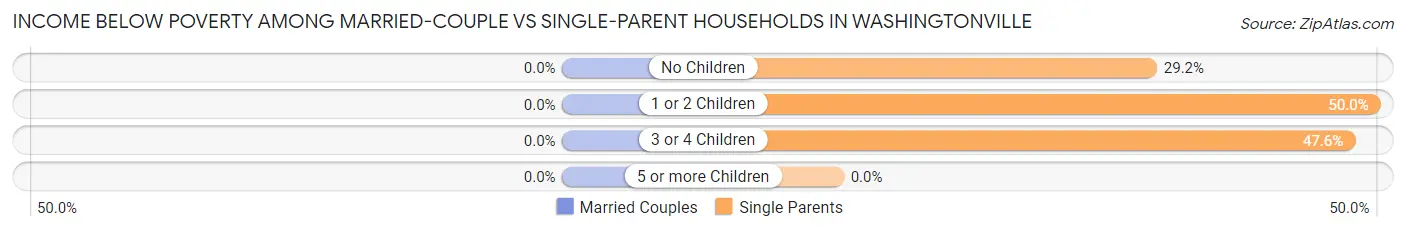
| Children | Married-Couple Families | Single-Parent Households |
| No Children | 0 (0.0%) | 7 (29.2%) |
| 1 or 2 Children | 0 (0.0%) | 30 (50.0%) |
| 3 or 4 Children | 0 (0.0%) | 10 (47.6%) |
| 5 or more Children | 0 (0.0%) | 0 (0.0%) |
| Total | 0 (0.0%) | 47 (44.8%) |
Race in Washingtonville
The most populous races in Washingtonville are White / Caucasian (710 | 95.2%), Two or more Races (27 | 3.6%), and Hispanic or Latino (13 | 1.7%).
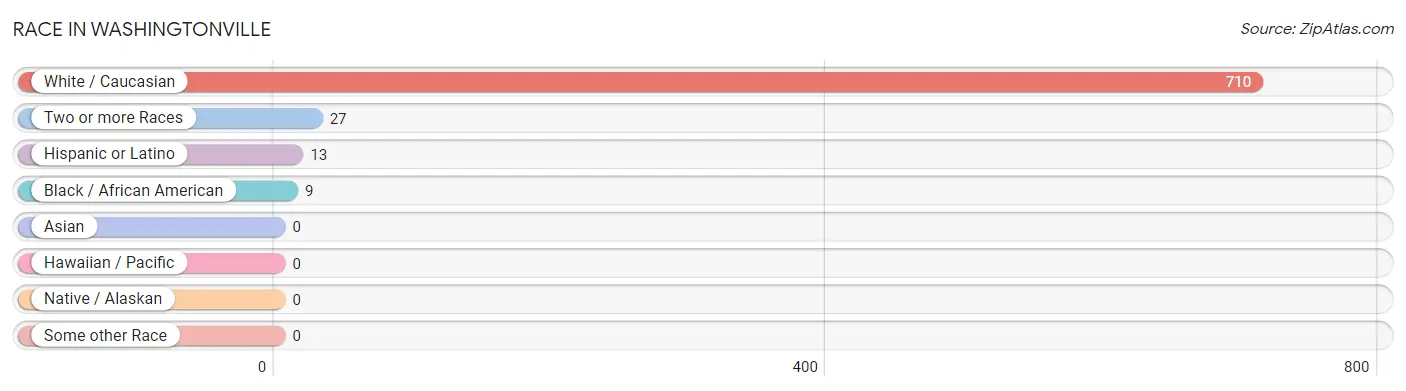
| Race | # Population | % Population |
| Asian | 0 | 0.0% |
| Black / African American | 9 | 1.2% |
| Hawaiian / Pacific | 0 | 0.0% |
| Hispanic or Latino | 13 | 1.7% |
| Native / Alaskan | 0 | 0.0% |
| White / Caucasian | 710 | 95.2% |
| Two or more Races | 27 | 3.6% |
| Some other Race | 0 | 0.0% |
| Total | 746 | 100.0% |
Ancestry in Washingtonville
The most populous ancestries reported in Washingtonville are German (158 | 21.2%), Italian (138 | 18.5%), English (105 | 14.1%), Irish (91 | 12.2%), and European (56 | 7.5%), together accounting for 73.5% of all Washingtonville residents.
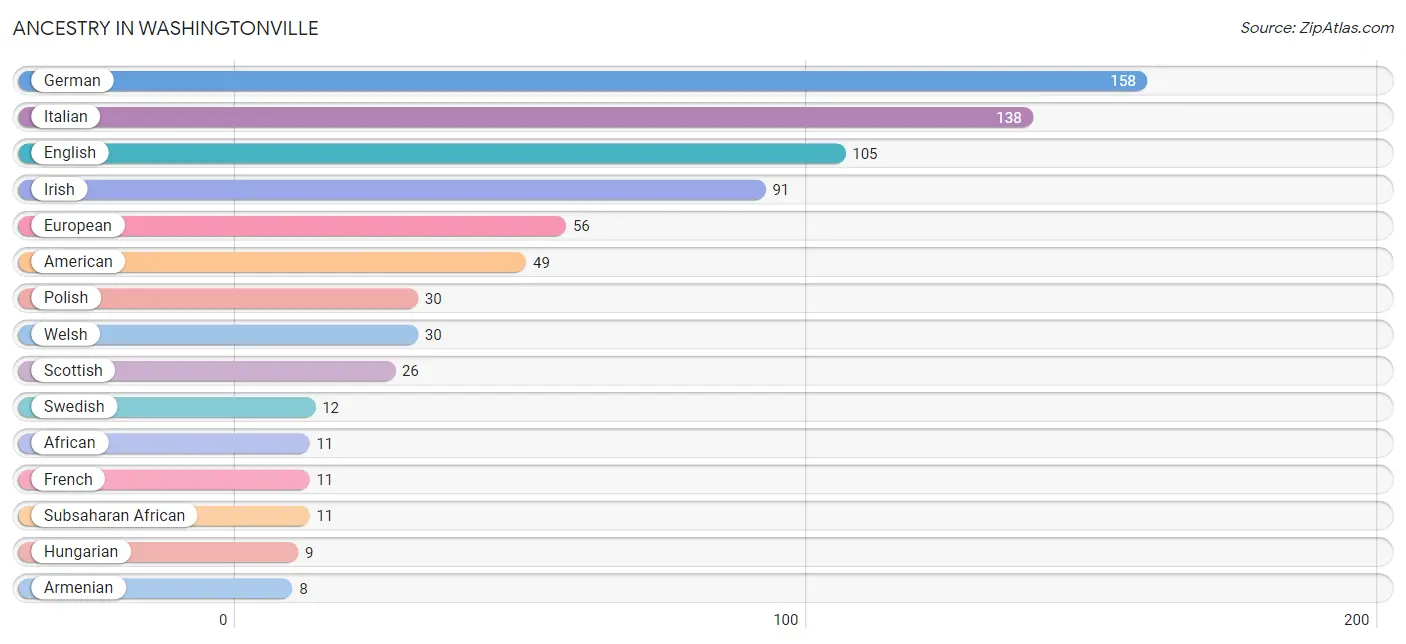
| Ancestry | # Population | % Population |
| African | 11 | 1.5% |
| American | 49 | 6.6% |
| Armenian | 8 | 1.1% |
| Austrian | 4 | 0.5% |
| Blackfeet | 1 | 0.1% |
| Cherokee | 1 | 0.1% |
| Croatian | 3 | 0.4% |
| Czech | 8 | 1.1% |
| Czechoslovakian | 2 | 0.3% |
| Dutch | 2 | 0.3% |
| Eastern European | 5 | 0.7% |
| English | 105 | 14.1% |
| European | 56 | 7.5% |
| Finnish | 2 | 0.3% |
| French | 11 | 1.5% |
| German | 158 | 21.2% |
| Greek | 8 | 1.1% |
| Hungarian | 9 | 1.2% |
| Irish | 91 | 12.2% |
| Italian | 138 | 18.5% |
| Mexican | 5 | 0.7% |
| Norwegian | 2 | 0.3% |
| Polish | 30 | 4.0% |
| Puerto Rican | 8 | 1.1% |
| Russian | 2 | 0.3% |
| Scotch-Irish | 6 | 0.8% |
| Scottish | 26 | 3.5% |
| Slovak | 6 | 0.8% |
| Subsaharan African | 11 | 1.5% |
| Swedish | 12 | 1.6% |
| Ukrainian | 3 | 0.4% |
| Welsh | 30 | 4.0% | View All 32 Rows |
Immigrants in Washingtonville

| Immigration Origin | # Population | % Population | View All 0 Rows |
Sex and Age in Washingtonville
Sex and Age in Washingtonville
The most populous age groups in Washingtonville are 5 to 9 Years (47 | 13.2%) for men and 5 to 9 Years (44 | 11.3%) for women.
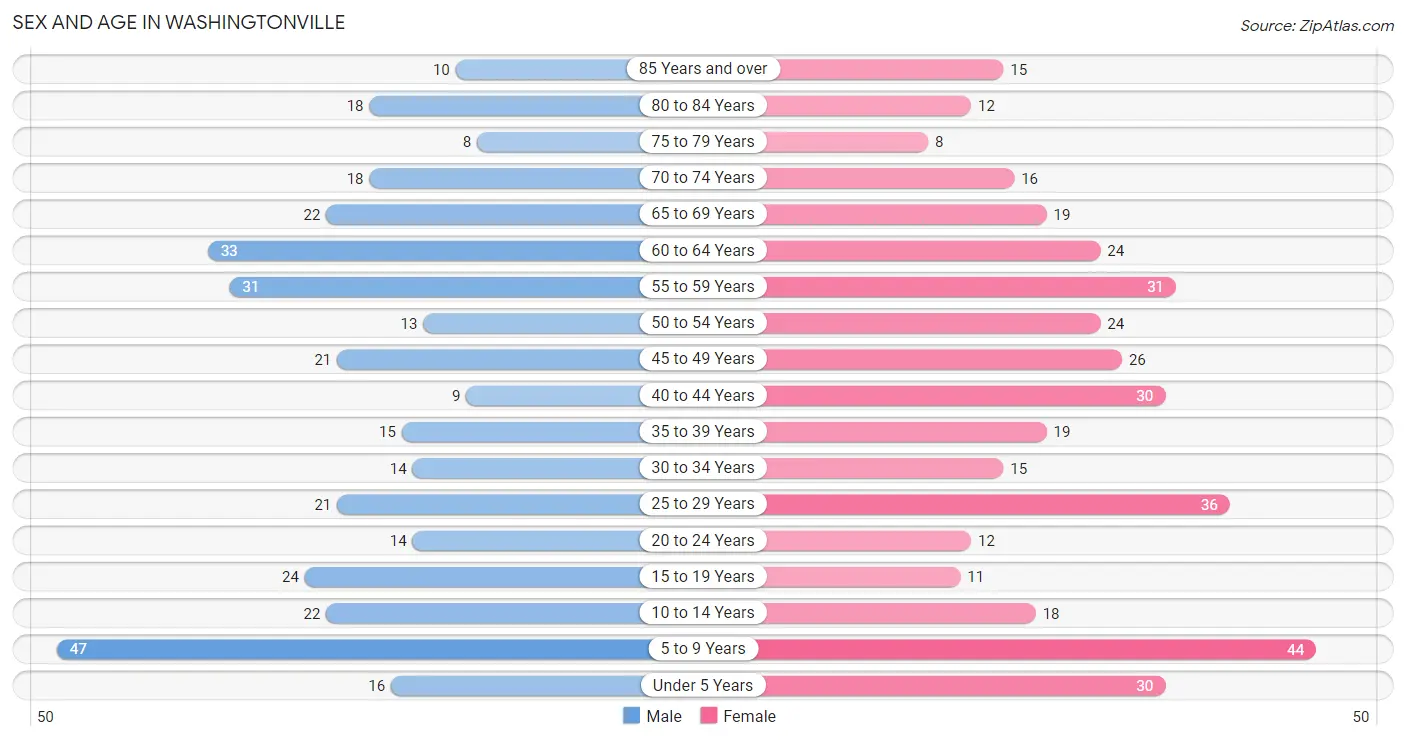
| Age Bracket | Male | Female |
| Under 5 Years | 16 (4.5%) | 30 (7.7%) |
| 5 to 9 Years | 47 (13.2%) | 44 (11.3%) |
| 10 to 14 Years | 22 (6.2%) | 18 (4.6%) |
| 15 to 19 Years | 24 (6.7%) | 11 (2.8%) |
| 20 to 24 Years | 14 (3.9%) | 12 (3.1%) |
| 25 to 29 Years | 21 (5.9%) | 36 (9.2%) |
| 30 to 34 Years | 14 (3.9%) | 15 (3.8%) |
| 35 to 39 Years | 15 (4.2%) | 19 (4.9%) |
| 40 to 44 Years | 9 (2.5%) | 30 (7.7%) |
| 45 to 49 Years | 21 (5.9%) | 26 (6.7%) |
| 50 to 54 Years | 13 (3.6%) | 24 (6.1%) |
| 55 to 59 Years | 31 (8.7%) | 31 (8.0%) |
| 60 to 64 Years | 33 (9.3%) | 24 (6.1%) |
| 65 to 69 Years | 22 (6.2%) | 19 (4.9%) |
| 70 to 74 Years | 18 (5.1%) | 16 (4.1%) |
| 75 to 79 Years | 8 (2.2%) | 8 (2.1%) |
| 80 to 84 Years | 18 (5.1%) | 12 (3.1%) |
| 85 Years and over | 10 (2.8%) | 15 (3.8%) |
| Total | 356 (100.0%) | 390 (100.0%) |
Families and Households in Washingtonville
Median Family Size in Washingtonville
The median family size in Washingtonville is 2.69 persons per family, with single female/mother families (96 | 43.0%) accounting for the largest median family size of 2.88 persons per family. On the other hand, single male/father families (9 | 4.0%) represent the smallest median family size with 2.44 persons per family.
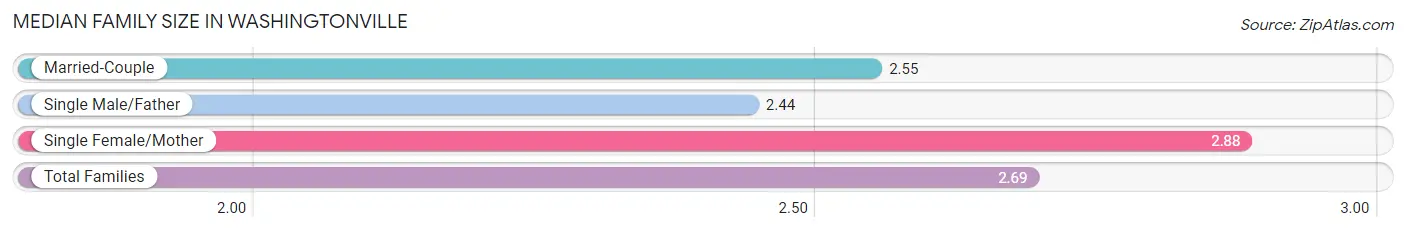
| Family Type | # Families | Family Size |
| Married-Couple | 118 (52.9%) | 2.55 |
| Single Male/Father | 9 (4.0%) | 2.44 |
| Single Female/Mother | 96 (43.0%) | 2.88 |
| Total Families | 223 (100.0%) | 2.69 |
Median Household Size in Washingtonville
The median household size in Washingtonville is 2.37 persons per household, with single female/mother households (96 | 30.7%) accounting for the largest median household size of 3.21 persons per household. non-family households (90 | 28.7%) represent the smallest median household size with 1.23 persons per household.
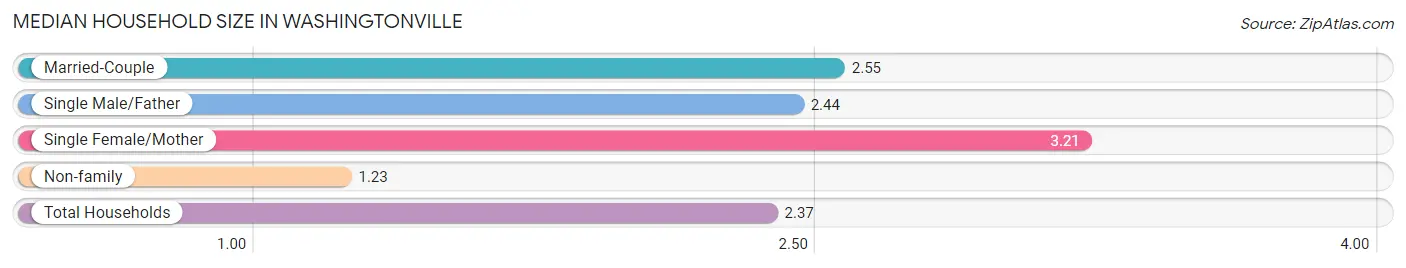
| Household Type | # Households | Household Size |
| Married-Couple | 118 (37.7%) | 2.55 |
| Single Male/Father | 9 (2.9%) | 2.44 |
| Single Female/Mother | 96 (30.7%) | 3.21 |
| Non-family | 90 (28.7%) | 1.23 |
| Total Households | 313 (100.0%) | 2.37 |
Household Size by Marriage Status in Washingtonville
Out of a total of 313 households in Washingtonville, 223 (71.3%) are family households, while 90 (28.7%) are nonfamily households. The most numerous type of family households are 2-person households, comprising 120, and the most common type of nonfamily households are 1-person households, comprising 81.
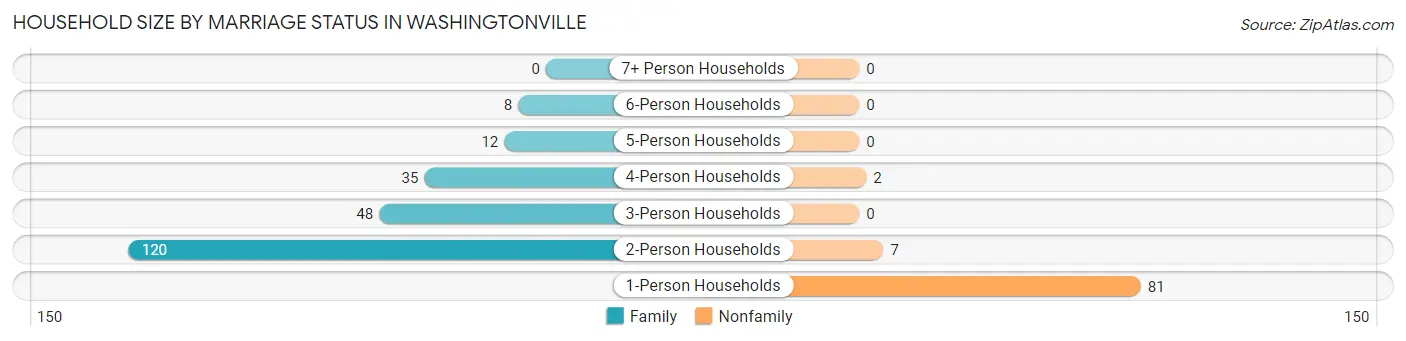
| Household Size | Family Households | Nonfamily Households |
| 1-Person Households | - | 81 (25.9%) |
| 2-Person Households | 120 (38.3%) | 7 (2.2%) |
| 3-Person Households | 48 (15.3%) | 0 (0.0%) |
| 4-Person Households | 35 (11.2%) | 2 (0.6%) |
| 5-Person Households | 12 (3.8%) | 0 (0.0%) |
| 6-Person Households | 8 (2.6%) | 0 (0.0%) |
| 7+ Person Households | 0 (0.0%) | 0 (0.0%) |
| Total | 223 (71.3%) | 90 (28.7%) |
Female Fertility in Washingtonville
Fertility by Age in Washingtonville
Average fertility rate in Washingtonville is 33.0 births per 1,000 women. Women in the age bracket of 20 to 34 years have the highest fertility rate with 79.0 births per 1,000 women. Women in the age bracket of 20 to 34 years acount for 100.0% of all women with births.
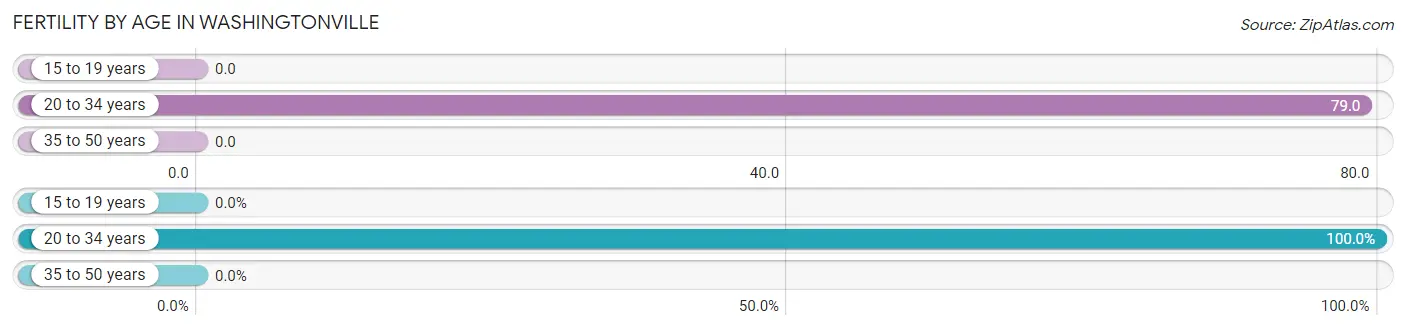
| Age Bracket | Women with Births | Births / 1,000 Women |
| 15 to 19 years | 0 (0.0%) | 0.0 |
| 20 to 34 years | 5 (100.0%) | 79.0 |
| 35 to 50 years | 0 (0.0%) | 0.0 |
| Total | 5 (100.0%) | 33.0 |
Fertility by Age by Marriage Status in Washingtonville
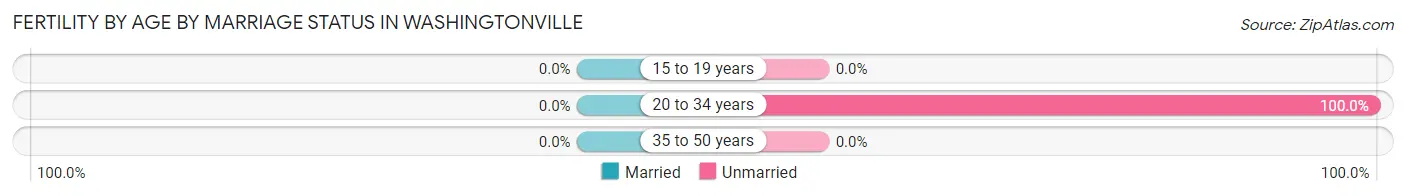
| Age Bracket | Married | Unmarried |
| 15 to 19 years | 0 (0.0%) | 0 (0.0%) |
| 20 to 34 years | 0 (0.0%) | 5 (100.0%) |
| 35 to 50 years | 0 (0.0%) | 0 (0.0%) |
| Total | 0 (0.0%) | 5 (100.0%) |
Fertility by Education in Washingtonville
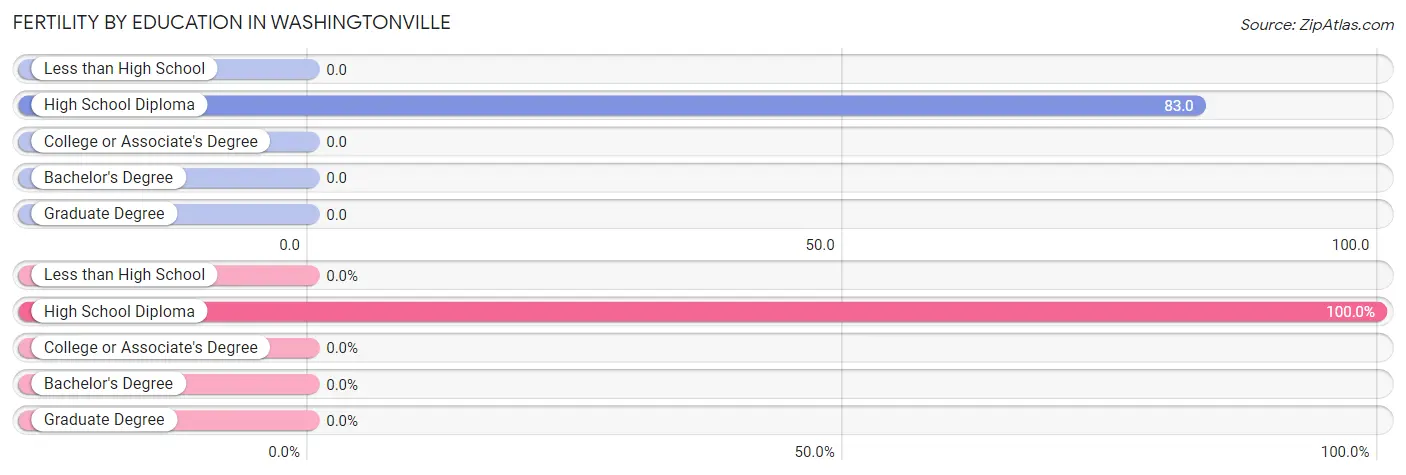
| Educational Attainment | Women with Births | Births / 1,000 Women |
| Less than High School | 0 (0.0%) | 0.0 |
| High School Diploma | 5 (100.0%) | 83.0 |
| College or Associate's Degree | 0 (0.0%) | 0.0 |
| Bachelor's Degree | 0 (0.0%) | 0.0 |
| Graduate Degree | 0 (0.0%) | 0.0 |
| Total | 5 (100.0%) | 33.0 |
Fertility by Education by Marriage Status in Washingtonville
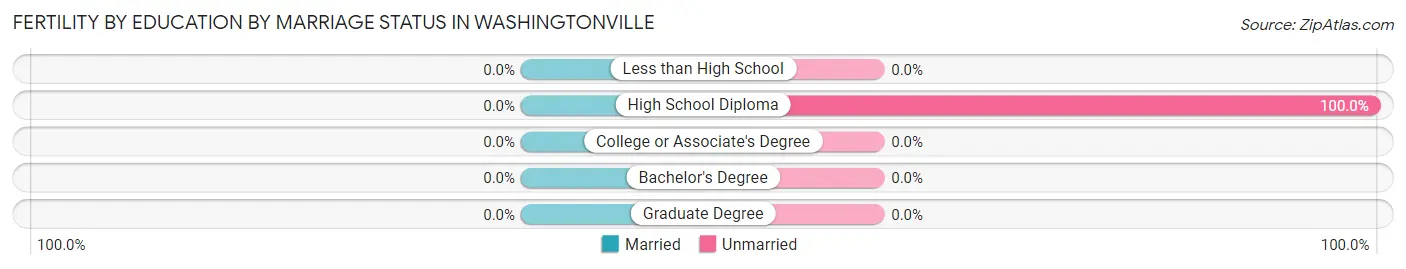
| Educational Attainment | Married | Unmarried |
| Less than High School | 0 (0.0%) | 0 (0.0%) |
| High School Diploma | 0 (0.0%) | 5 (100.0%) |
| College or Associate's Degree | 0 (0.0%) | 0 (0.0%) |
| Bachelor's Degree | 0 (0.0%) | 0 (0.0%) |
| Graduate Degree | 0 (0.0%) | 0 (0.0%) |
| Total | 0 (0.0%) | 5 (100.0%) |
Employment Characteristics in Washingtonville
Employment by Class of Employer in Washingtonville
Among the 271 employed individuals in Washingtonville, private company employees (221 | 81.6%), not-for-profit organizations (22 | 8.1%), and self-employed (not incorporated) (13 | 4.8%) make up the most common classes of employment.
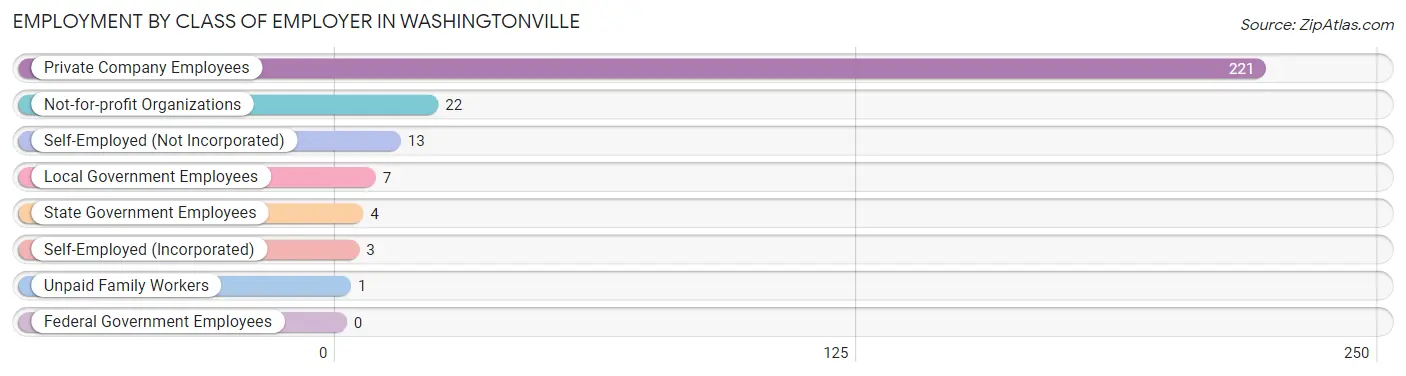
| Employer Class | # Employees | % Employees |
| Private Company Employees | 221 | 81.6% |
| Self-Employed (Incorporated) | 3 | 1.1% |
| Self-Employed (Not Incorporated) | 13 | 4.8% |
| Not-for-profit Organizations | 22 | 8.1% |
| Local Government Employees | 7 | 2.6% |
| State Government Employees | 4 | 1.5% |
| Federal Government Employees | 0 | 0.0% |
| Unpaid Family Workers | 1 | 0.4% |
| Total | 271 | 100.0% |
Employment Status by Age in Washingtonville
According to the labor force statistics for Washingtonville, out of the total population over 16 years of age (561), 55.3% or 310 individuals are in the labor force, with 8.7% or 27 of them unemployed. The age group with the highest labor force participation rate is 35 to 44 years, with 94.5% or 69 individuals in the labor force. Within the labor force, the 16 to 19 years age range has the highest percentage of unemployed individuals, with 71.4% or 5 of them being unemployed.
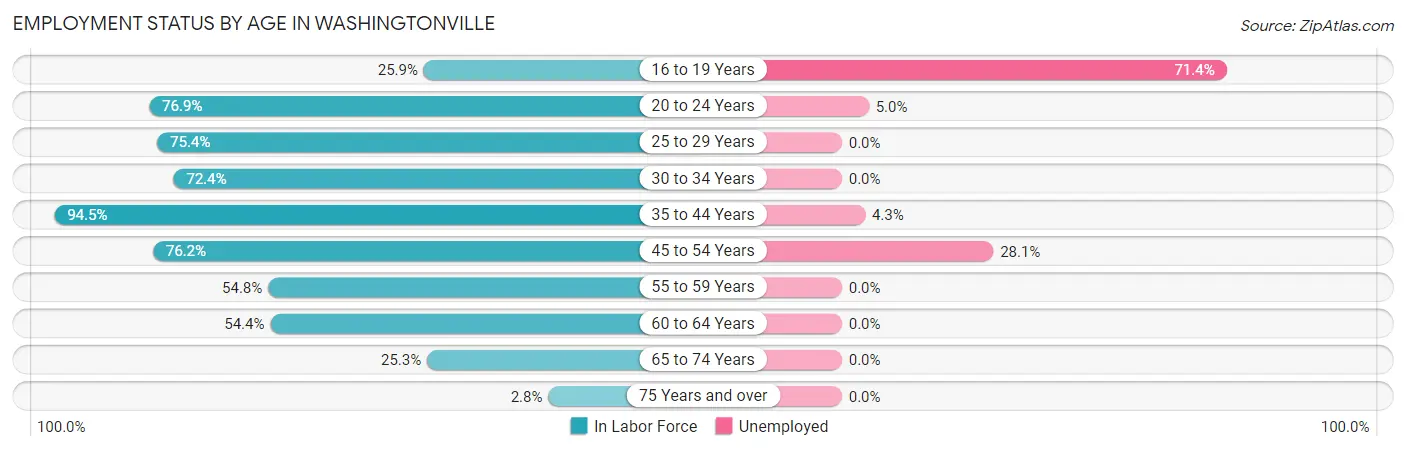
| Age Bracket | In Labor Force | Unemployed |
| 16 to 19 Years | 7 (25.9%) | 5 (71.4%) |
| 20 to 24 Years | 20 (76.9%) | 1 (5.0%) |
| 25 to 29 Years | 43 (75.4%) | 0 (0.0%) |
| 30 to 34 Years | 21 (72.4%) | 0 (0.0%) |
| 35 to 44 Years | 69 (94.5%) | 3 (4.3%) |
| 45 to 54 Years | 64 (76.2%) | 18 (28.1%) |
| 55 to 59 Years | 34 (54.8%) | 0 (0.0%) |
| 60 to 64 Years | 31 (54.4%) | 0 (0.0%) |
| 65 to 74 Years | 19 (25.3%) | 0 (0.0%) |
| 75 Years and over | 2 (2.8%) | 0 (0.0%) |
| Total | 310 (55.3%) | 27 (8.7%) |
Employment Status by Educational Attainment in Washingtonville
According to labor force statistics for Washingtonville, 72.4% of individuals (262) out of the total population between 25 and 64 years of age (362) are in the labor force, with 8.0% or 21 of them being unemployed. The group with the highest labor force participation rate are those with the educational attainment of college / associate degree, with 81.4% or 96 individuals in the labor force. Within the labor force, individuals with less than high school education have the highest percentage of unemployment, with 64.3% or 9 of them being unemployed.
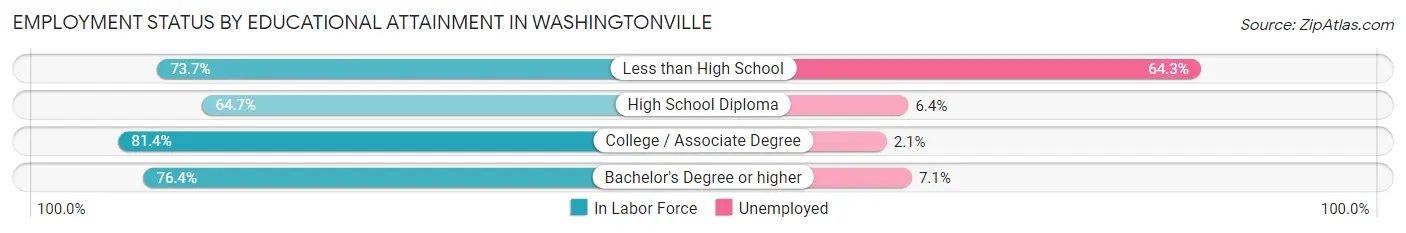
| Educational Attainment | In Labor Force | Unemployed |
| Less than High School | 14 (73.7%) | 12 (64.3%) |
| High School Diploma | 110 (64.7%) | 11 (6.4%) |
| College / Associate Degree | 96 (81.4%) | 2 (2.1%) |
| Bachelor's Degree or higher | 42 (76.4%) | 4 (7.1%) |
| Total | 262 (72.4%) | 29 (8.0%) |
Employment Occupations by Sex in Washingtonville
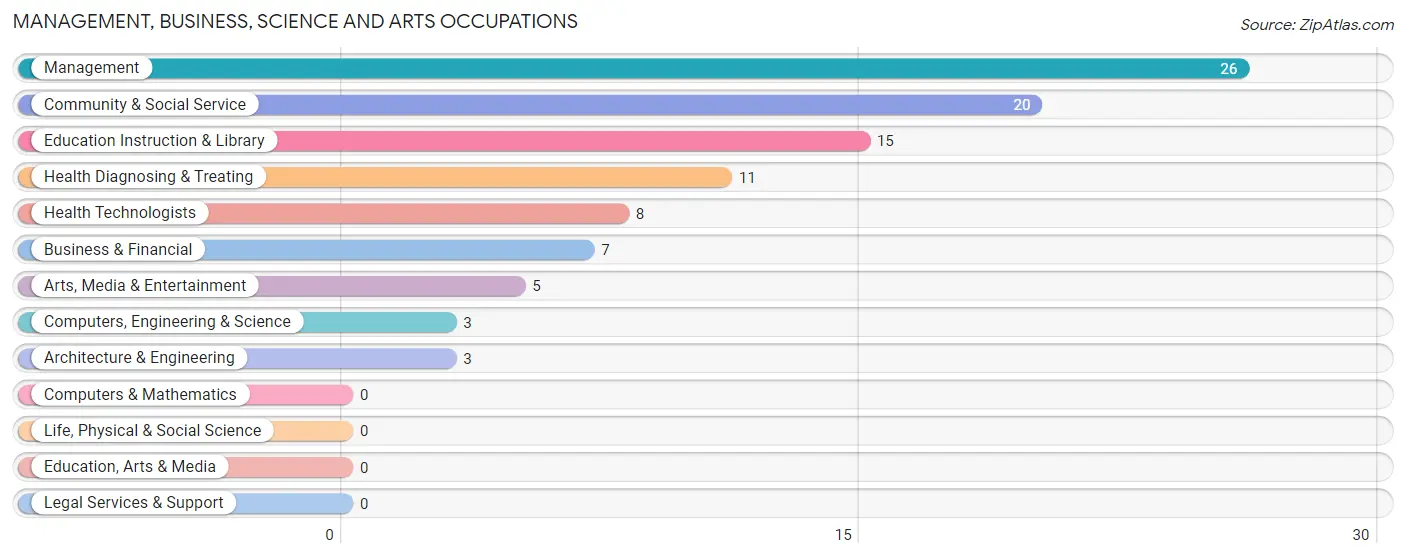
Management, Business, Science and Arts Occupations
The most common Management, Business, Science and Arts occupations in Washingtonville are Management (26 | 9.2%), Community & Social Service (20 | 7.1%), Education Instruction & Library (15 | 5.3%), Health Diagnosing & Treating (11 | 3.9%), and Health Technologists (8 | 2.8%).
Management, Business, Science and Arts Occupations by Sex
Within the Management, Business, Science and Arts occupations in Washingtonville, the most male-oriented occupations are Computers, Engineering & Science (100.0%), Architecture & Engineering (100.0%), and Arts, Media & Entertainment (60.0%), while the most female-oriented occupations are Business & Financial (100.0%), Education Instruction & Library (93.3%), and Health Diagnosing & Treating (81.8%).
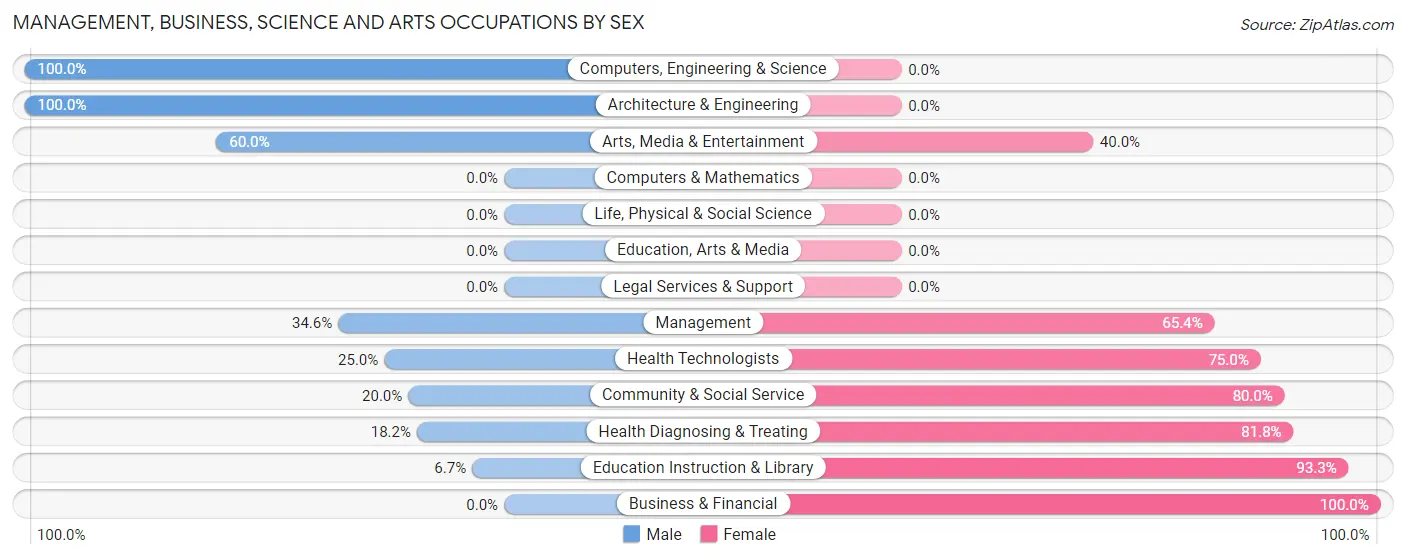
| Occupation | Male | Female |
| Management | 9 (34.6%) | 17 (65.4%) |
| Business & Financial | 0 (0.0%) | 7 (100.0%) |
| Computers, Engineering & Science | 3 (100.0%) | 0 (0.0%) |
| Computers & Mathematics | 0 (0.0%) | 0 (0.0%) |
| Architecture & Engineering | 3 (100.0%) | 0 (0.0%) |
| Life, Physical & Social Science | 0 (0.0%) | 0 (0.0%) |
| Community & Social Service | 4 (20.0%) | 16 (80.0%) |
| Education, Arts & Media | 0 (0.0%) | 0 (0.0%) |
| Legal Services & Support | 0 (0.0%) | 0 (0.0%) |
| Education Instruction & Library | 1 (6.7%) | 14 (93.3%) |
| Arts, Media & Entertainment | 3 (60.0%) | 2 (40.0%) |
| Health Diagnosing & Treating | 2 (18.2%) | 9 (81.8%) |
| Health Technologists | 2 (25.0%) | 6 (75.0%) |
| Total (Category) | 18 (26.9%) | 49 (73.1%) |
| Total (Overall) | 134 (47.3%) | 149 (52.6%) |
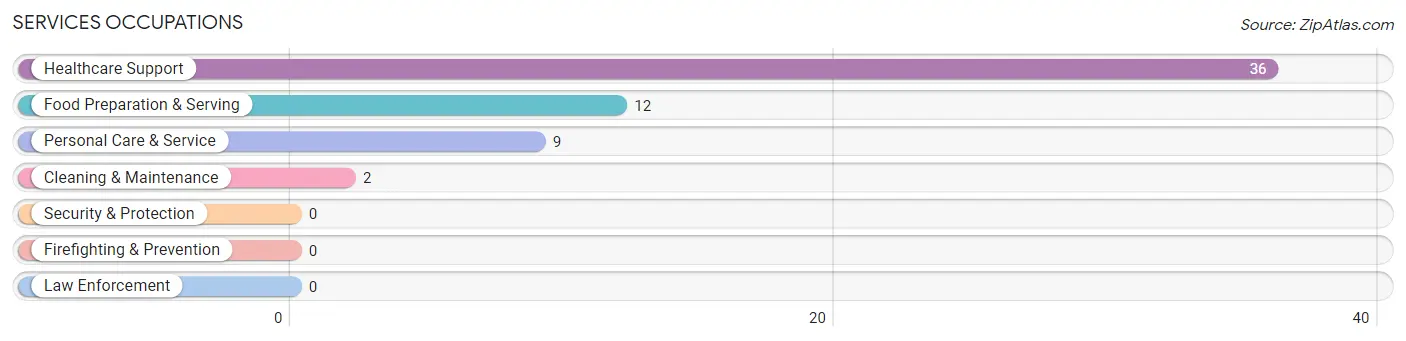
Services Occupations
The most common Services occupations in Washingtonville are Healthcare Support (36 | 12.7%), Food Preparation & Serving (12 | 4.2%), Personal Care & Service (9 | 3.2%), and Cleaning & Maintenance (2 | 0.7%).
Services Occupations by Sex
Within the Services occupations in Washingtonville, the most male-oriented occupations are Cleaning & Maintenance (100.0%), and Healthcare Support (8.3%), while the most female-oriented occupations are Food Preparation & Serving (100.0%), Personal Care & Service (100.0%), and Healthcare Support (91.7%).
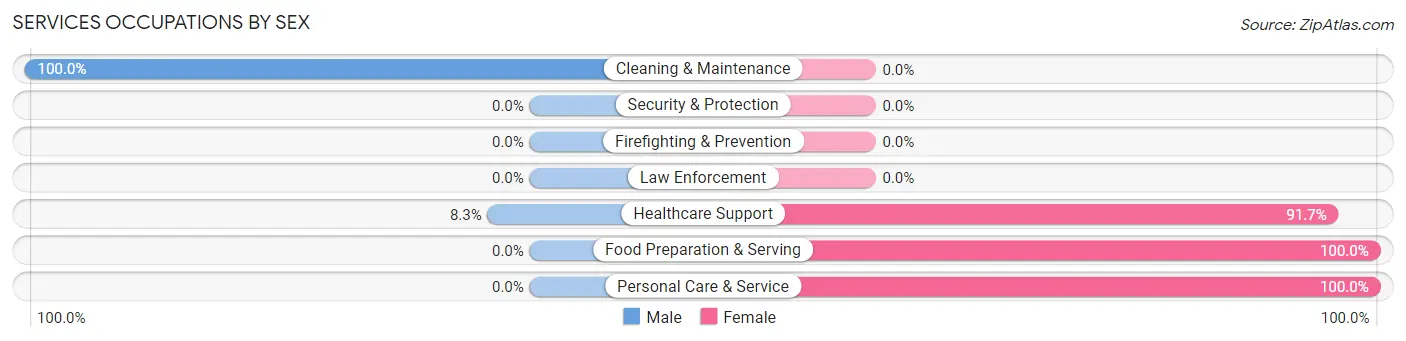
| Occupation | Male | Female |
| Healthcare Support | 3 (8.3%) | 33 (91.7%) |
| Security & Protection | 0 (0.0%) | 0 (0.0%) |
| Firefighting & Prevention | 0 (0.0%) | 0 (0.0%) |
| Law Enforcement | 0 (0.0%) | 0 (0.0%) |
| Food Preparation & Serving | 0 (0.0%) | 12 (100.0%) |
| Cleaning & Maintenance | 2 (100.0%) | 0 (0.0%) |
| Personal Care & Service | 0 (0.0%) | 9 (100.0%) |
| Total (Category) | 5 (8.5%) | 54 (91.5%) |
| Total (Overall) | 134 (47.3%) | 149 (52.6%) |
Sales and Office Occupations
The most common Sales and Office occupations in Washingtonville are Sales & Related (27 | 9.5%), and Office & Administration (25 | 8.8%).

Sales and Office Occupations by Sex
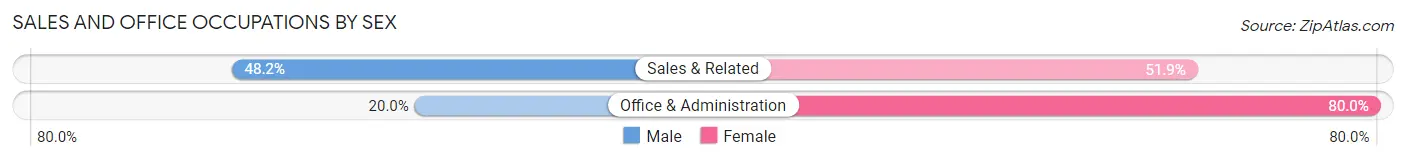
| Occupation | Male | Female |
| Sales & Related | 13 (48.1%) | 14 (51.8%) |
| Office & Administration | 5 (20.0%) | 20 (80.0%) |
| Total (Category) | 18 (34.6%) | 34 (65.4%) |
| Total (Overall) | 134 (47.3%) | 149 (52.6%) |
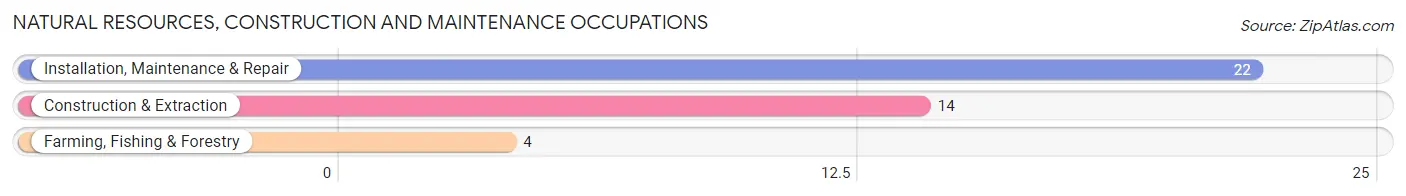
Natural Resources, Construction and Maintenance Occupations
The most common Natural Resources, Construction and Maintenance occupations in Washingtonville are Installation, Maintenance & Repair (22 | 7.8%), Construction & Extraction (14 | 5.0%), and Farming, Fishing & Forestry (4 | 1.4%).
Natural Resources, Construction and Maintenance Occupations by Sex
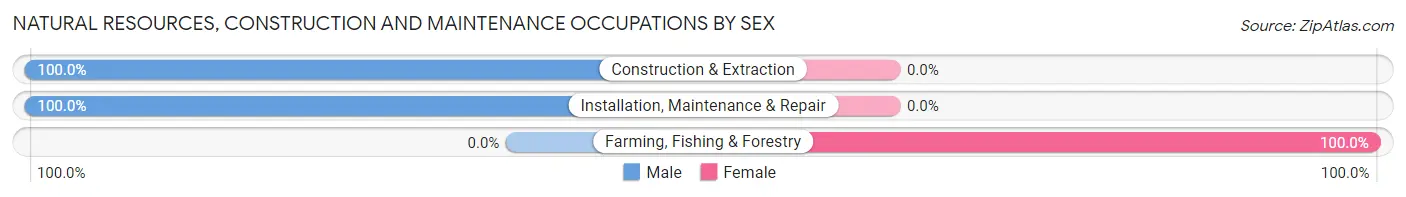
| Occupation | Male | Female |
| Farming, Fishing & Forestry | 0 (0.0%) | 4 (100.0%) |
| Construction & Extraction | 14 (100.0%) | 0 (0.0%) |
| Installation, Maintenance & Repair | 22 (100.0%) | 0 (0.0%) |
| Total (Category) | 36 (90.0%) | 4 (10.0%) |
| Total (Overall) | 134 (47.3%) | 149 (52.6%) |
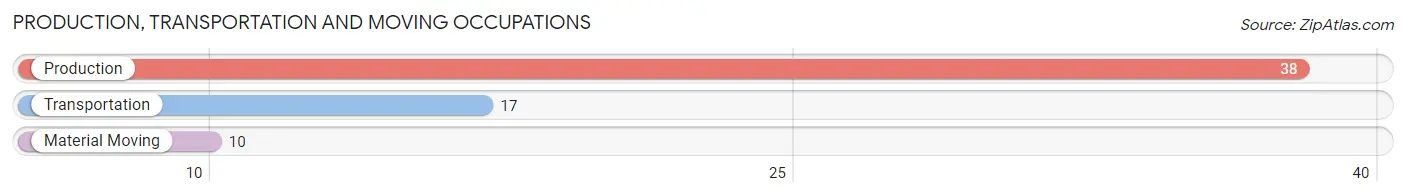
Production, Transportation and Moving Occupations
The most common Production, Transportation and Moving occupations in Washingtonville are Production (38 | 13.4%), Transportation (17 | 6.0%), and Material Moving (10 | 3.5%).
Production, Transportation and Moving Occupations by Sex
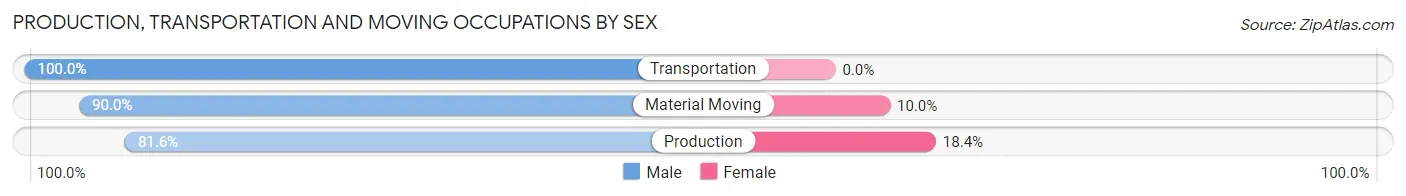
| Occupation | Male | Female |
| Production | 31 (81.6%) | 7 (18.4%) |
| Transportation | 17 (100.0%) | 0 (0.0%) |
| Material Moving | 9 (90.0%) | 1 (10.0%) |
| Total (Category) | 57 (87.7%) | 8 (12.3%) |
| Total (Overall) | 134 (47.3%) | 149 (52.6%) |
Employment Industries by Sex in Washingtonville
Employment Industries in Washingtonville
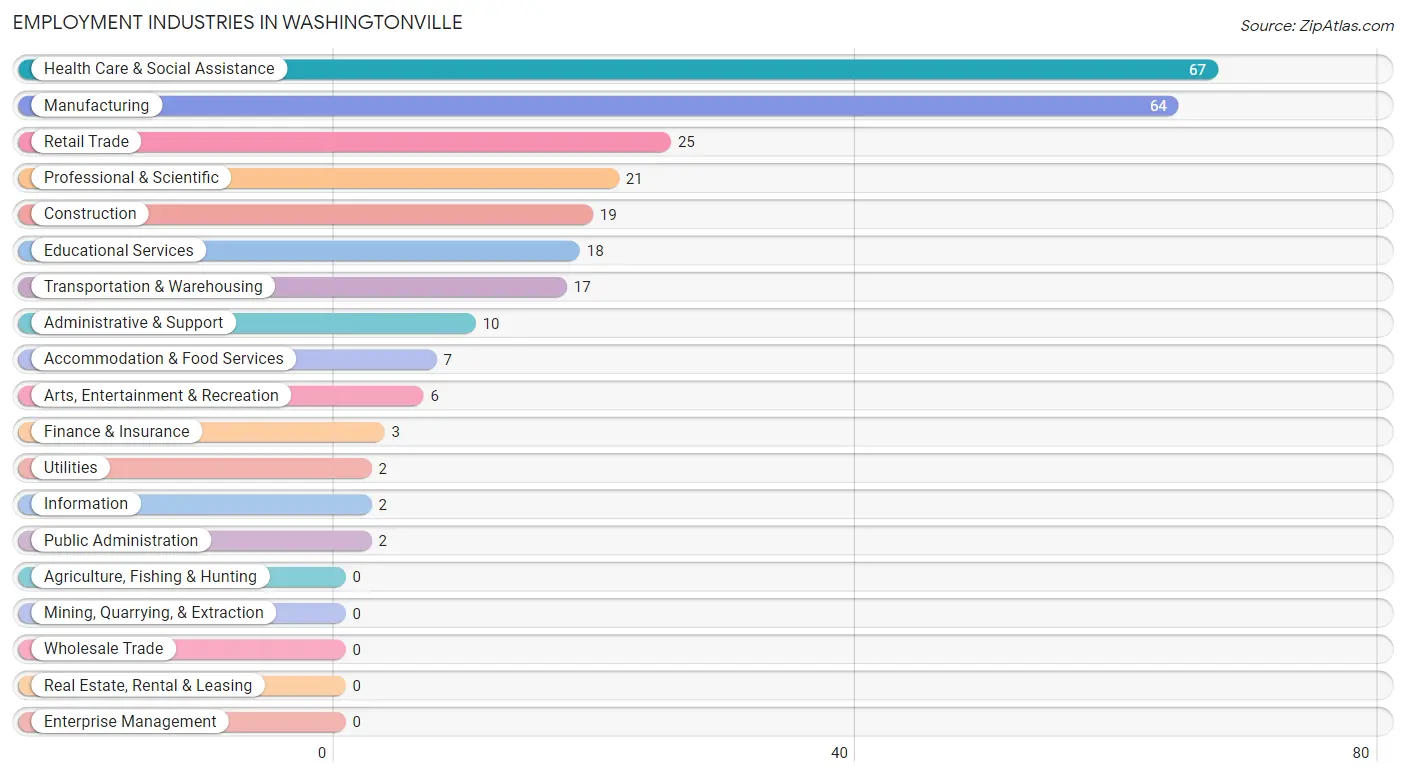
The major employment industries in Washingtonville include Health Care & Social Assistance (67 | 23.7%), Manufacturing (64 | 22.6%), Retail Trade (25 | 8.8%), Professional & Scientific (21 | 7.4%), and Construction (19 | 6.7%).
Employment Industries by Sex in Washingtonville
The Washingtonville industries that see more men than women are Transportation & Warehousing (100.0%), Finance & Insurance (100.0%), and Public Administration (100.0%), whereas the industries that tend to have a higher number of women are Utilities (100.0%), Information (100.0%), and Health Care & Social Assistance (95.5%).
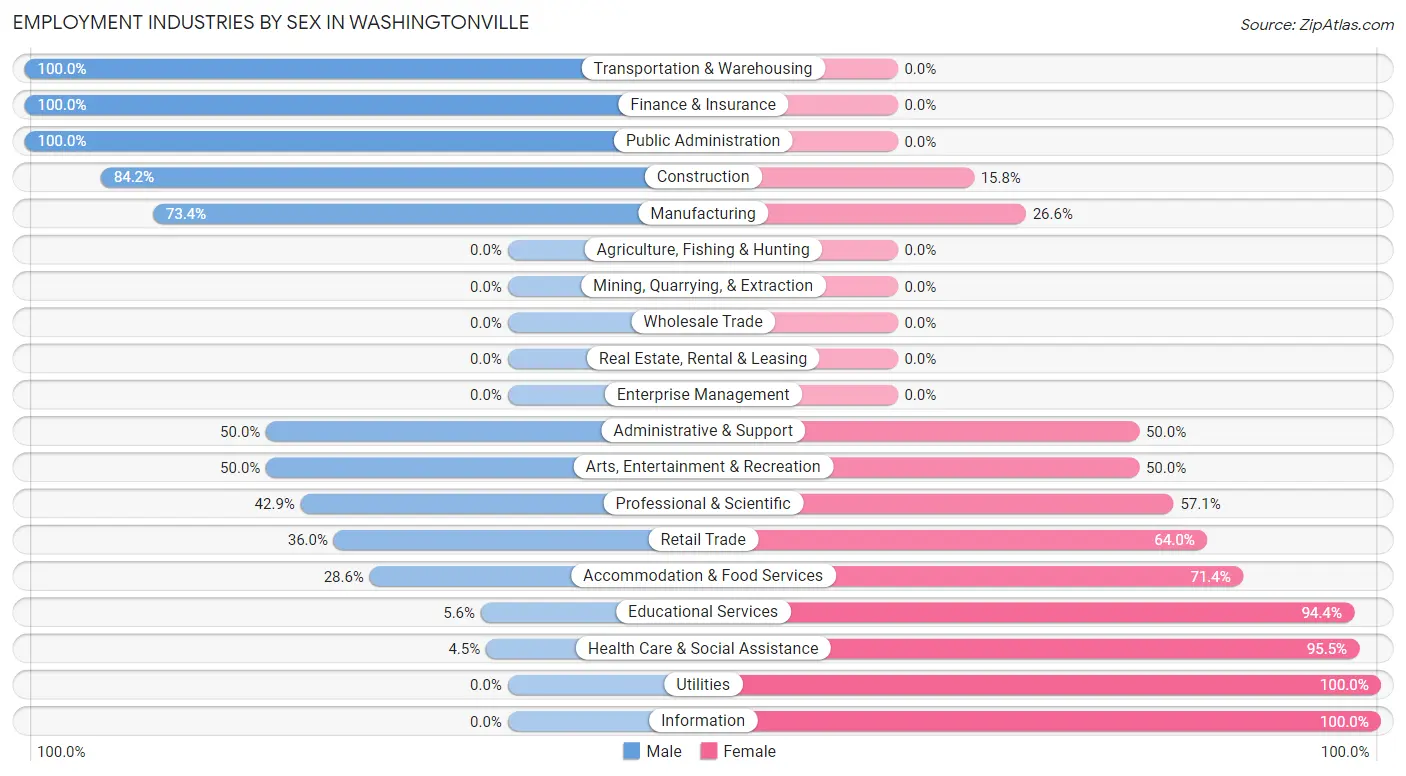
| Industry | Male | Female |
| Agriculture, Fishing & Hunting | 0 (0.0%) | 0 (0.0%) |
| Mining, Quarrying, & Extraction | 0 (0.0%) | 0 (0.0%) |
| Construction | 16 (84.2%) | 3 (15.8%) |
| Manufacturing | 47 (73.4%) | 17 (26.6%) |
| Wholesale Trade | 0 (0.0%) | 0 (0.0%) |
| Retail Trade | 9 (36.0%) | 16 (64.0%) |
| Transportation & Warehousing | 17 (100.0%) | 0 (0.0%) |
| Utilities | 0 (0.0%) | 2 (100.0%) |
| Information | 0 (0.0%) | 2 (100.0%) |
| Finance & Insurance | 3 (100.0%) | 0 (0.0%) |
| Real Estate, Rental & Leasing | 0 (0.0%) | 0 (0.0%) |
| Professional & Scientific | 9 (42.9%) | 12 (57.1%) |
| Enterprise Management | 0 (0.0%) | 0 (0.0%) |
| Administrative & Support | 5 (50.0%) | 5 (50.0%) |
| Educational Services | 1 (5.6%) | 17 (94.4%) |
| Health Care & Social Assistance | 3 (4.5%) | 64 (95.5%) |
| Arts, Entertainment & Recreation | 3 (50.0%) | 3 (50.0%) |
| Accommodation & Food Services | 2 (28.6%) | 5 (71.4%) |
| Public Administration | 2 (100.0%) | 0 (0.0%) |
| Total | 134 (47.3%) | 149 (52.6%) |
Education in Washingtonville
School Enrollment in Washingtonville
The most common levels of schooling among the 176 students in Washingtonville are kindergarten (51 | 29.0%), elementary school (38 | 21.6%), and middle school (37 | 21.0%).
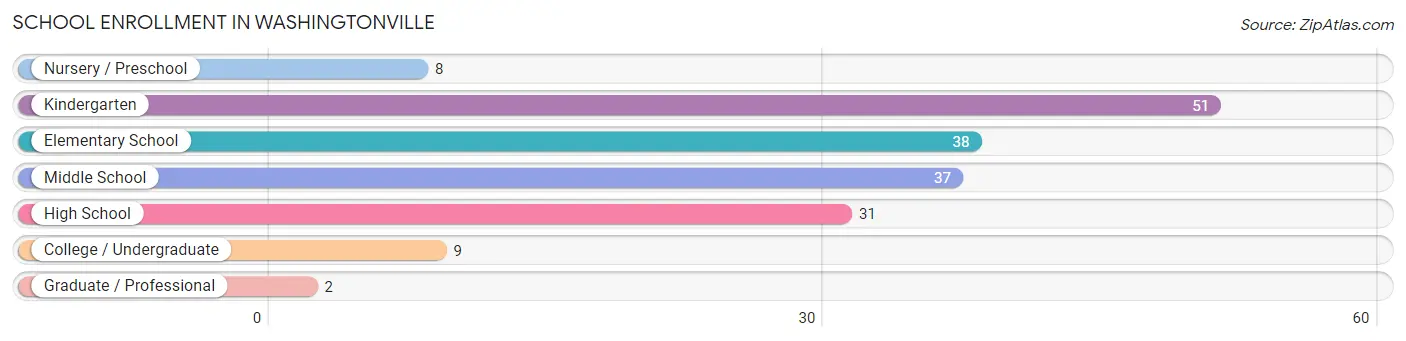
| School Level | # Students | % Students |
| Nursery / Preschool | 8 | 4.5% |
| Kindergarten | 51 | 29.0% |
| Elementary School | 38 | 21.6% |
| Middle School | 37 | 21.0% |
| High School | 31 | 17.6% |
| College / Undergraduate | 9 | 5.1% |
| Graduate / Professional | 2 | 1.1% |
| Total | 176 | 100.0% |
School Enrollment by Age by Funding Source in Washingtonville
Out of a total of 176 students who are enrolled in schools in Washingtonville, 9 (5.1%) attend a private institution, while the remaining 167 (94.9%) are enrolled in public schools. The age group of 20 to 24 year olds has the highest likelihood of being enrolled in private schools, with 3 (100.0% in the age bracket) enrolled. Conversely, the age group of 5 to 9 year old has the lowest likelihood of being enrolled in a private school, with 91 (100.0% in the age bracket) attending a public institution.
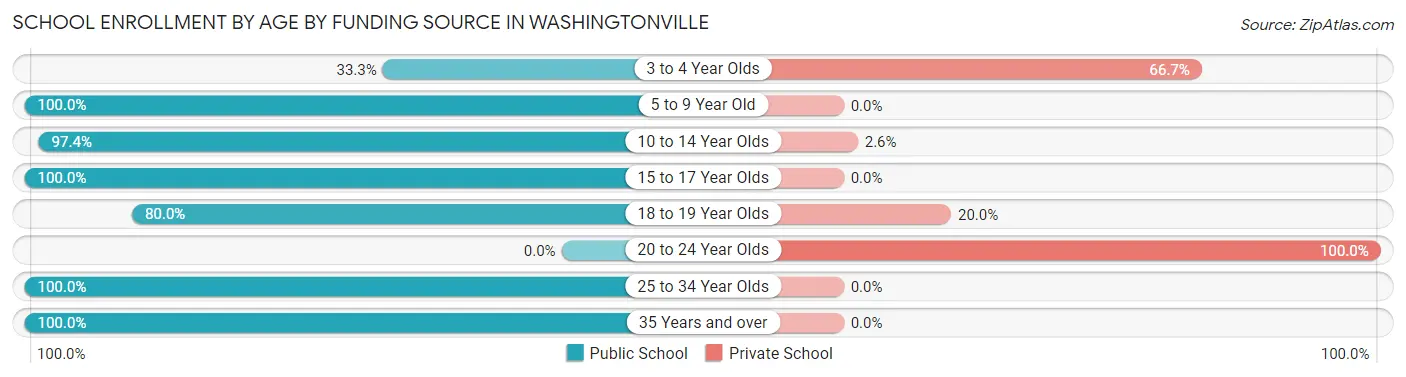
| Age Bracket | Public School | Private School |
| 3 to 4 Year Olds | 2 (33.3%) | 4 (66.7%) |
| 5 to 9 Year Old | 91 (100.0%) | 0 (0.0%) |
| 10 to 14 Year Olds | 37 (97.4%) | 1 (2.6%) |
| 15 to 17 Year Olds | 25 (100.0%) | 0 (0.0%) |
| 18 to 19 Year Olds | 4 (80.0%) | 1 (20.0%) |
| 20 to 24 Year Olds | 0 (0.0%) | 3 (100.0%) |
| 25 to 34 Year Olds | 2 (100.0%) | 0 (0.0%) |
| 35 Years and over | 6 (100.0%) | 0 (0.0%) |
| Total | 167 (94.9%) | 9 (5.1%) |
Educational Attainment by Field of Study in Washingtonville
Arts & humanities (11 | 15.3%), education (9 | 12.5%), visual & performing arts (9 | 12.5%), bio, nature & agricultural (8 | 11.1%), and science & technology (8 | 11.1%) are the most common fields of study among 72 individuals in Washingtonville who have obtained a bachelor's degree or higher.
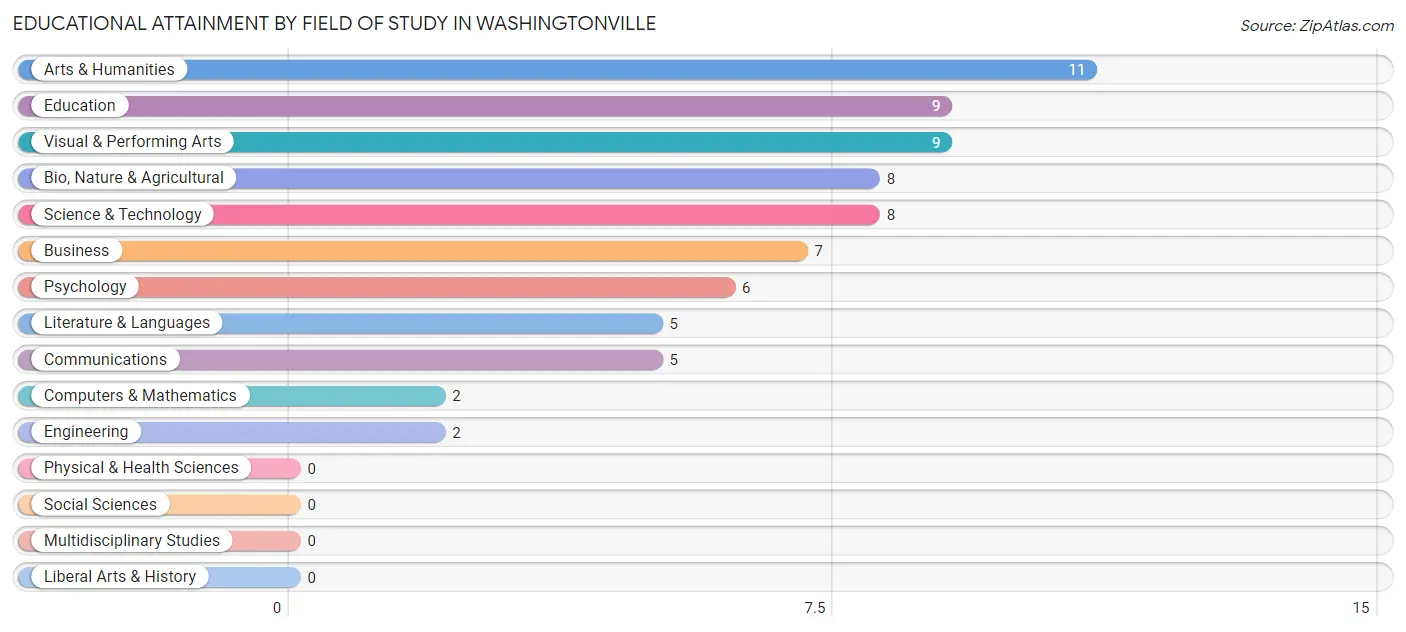
| Field of Study | # Graduates | % Graduates |
| Computers & Mathematics | 2 | 2.8% |
| Bio, Nature & Agricultural | 8 | 11.1% |
| Physical & Health Sciences | 0 | 0.0% |
| Psychology | 6 | 8.3% |
| Social Sciences | 0 | 0.0% |
| Engineering | 2 | 2.8% |
| Multidisciplinary Studies | 0 | 0.0% |
| Science & Technology | 8 | 11.1% |
| Business | 7 | 9.7% |
| Education | 9 | 12.5% |
| Literature & Languages | 5 | 6.9% |
| Liberal Arts & History | 0 | 0.0% |
| Visual & Performing Arts | 9 | 12.5% |
| Communications | 5 | 6.9% |
| Arts & Humanities | 11 | 15.3% |
| Total | 72 | 100.0% |
Transportation & Commute in Washingtonville
Vehicle Availability by Sex in Washingtonville
The most prevalent vehicle ownership categories in Washingtonville are males with 2 vehicles (58, accounting for 45.3%) and females with 2 vehicles (53, making up 40.6%).
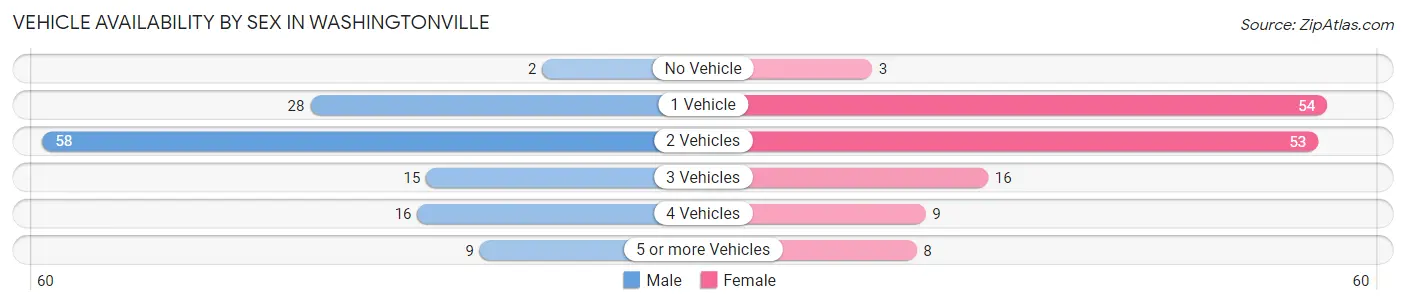
| Vehicles Available | Male | Female |
| No Vehicle | 2 (1.6%) | 3 (2.1%) |
| 1 Vehicle | 28 (21.9%) | 54 (37.8%) |
| 2 Vehicles | 58 (45.3%) | 53 (37.1%) |
| 3 Vehicles | 15 (11.7%) | 16 (11.2%) |
| 4 Vehicles | 16 (12.5%) | 9 (6.3%) |
| 5 or more Vehicles | 9 (7.0%) | 8 (5.6%) |
| Total | 128 (100.0%) | 143 (100.0%) |
Commute Time in Washingtonville
The most frequently occuring commute durations in Washingtonville are 15 to 19 minutes (40 commuters, 16.2%), 30 to 34 minutes (39 commuters, 15.8%), and 20 to 24 minutes (36 commuters, 14.6%).
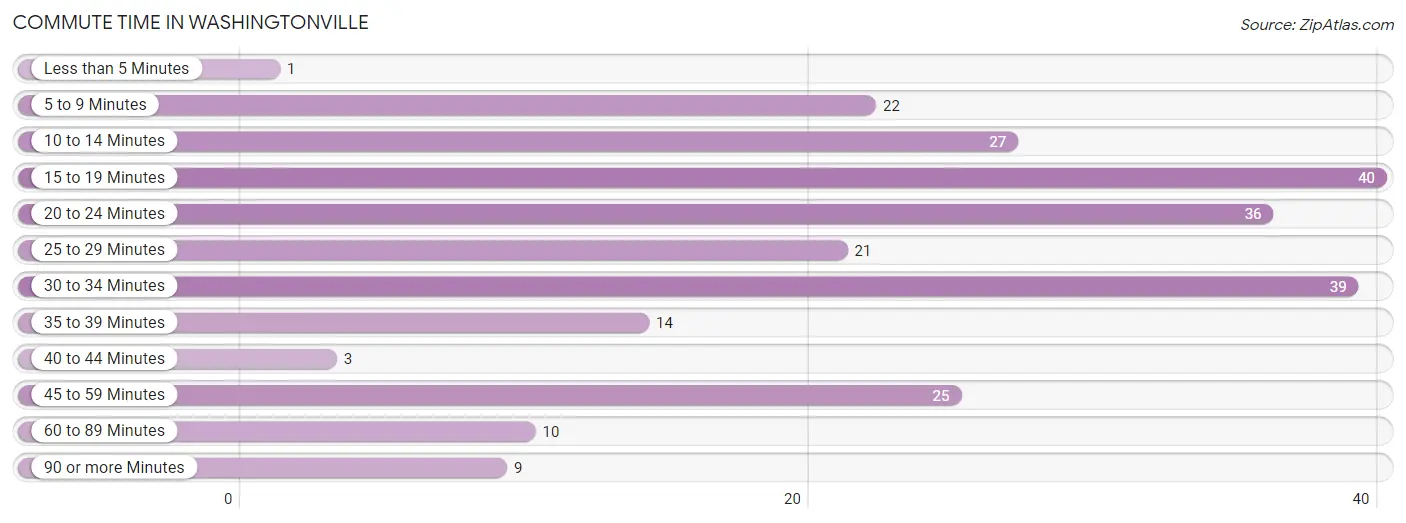
| Commute Time | # Commuters | % Commuters |
| Less than 5 Minutes | 1 | 0.4% |
| 5 to 9 Minutes | 22 | 8.9% |
| 10 to 14 Minutes | 27 | 10.9% |
| 15 to 19 Minutes | 40 | 16.2% |
| 20 to 24 Minutes | 36 | 14.6% |
| 25 to 29 Minutes | 21 | 8.5% |
| 30 to 34 Minutes | 39 | 15.8% |
| 35 to 39 Minutes | 14 | 5.7% |
| 40 to 44 Minutes | 3 | 1.2% |
| 45 to 59 Minutes | 25 | 10.1% |
| 60 to 89 Minutes | 10 | 4.1% |
| 90 or more Minutes | 9 | 3.6% |
Commute Time by Sex in Washingtonville
The most common commute times in Washingtonville are 10 to 14 minutes (20 commuters, 16.4%) for males and 20 to 24 minutes (26 commuters, 20.8%) for females.
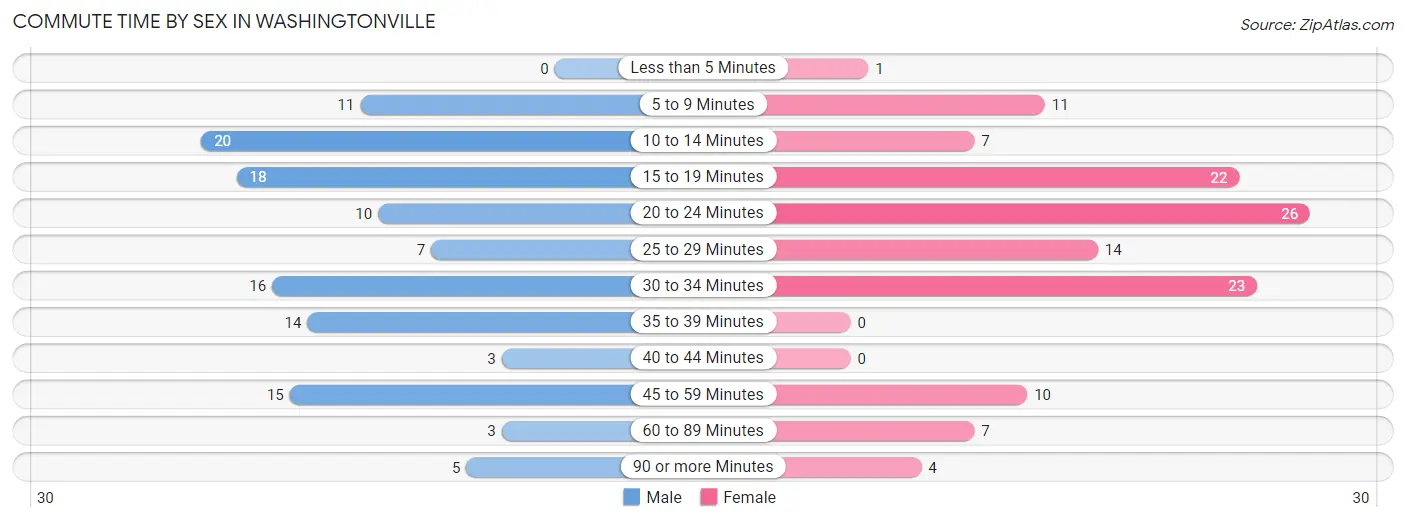
| Commute Time | Male | Female |
| Less than 5 Minutes | 0 (0.0%) | 1 (0.8%) |
| 5 to 9 Minutes | 11 (9.0%) | 11 (8.8%) |
| 10 to 14 Minutes | 20 (16.4%) | 7 (5.6%) |
| 15 to 19 Minutes | 18 (14.7%) | 22 (17.6%) |
| 20 to 24 Minutes | 10 (8.2%) | 26 (20.8%) |
| 25 to 29 Minutes | 7 (5.7%) | 14 (11.2%) |
| 30 to 34 Minutes | 16 (13.1%) | 23 (18.4%) |
| 35 to 39 Minutes | 14 (11.5%) | 0 (0.0%) |
| 40 to 44 Minutes | 3 (2.5%) | 0 (0.0%) |
| 45 to 59 Minutes | 15 (12.3%) | 10 (8.0%) |
| 60 to 89 Minutes | 3 (2.5%) | 7 (5.6%) |
| 90 or more Minutes | 5 (4.1%) | 4 (3.2%) |
Time of Departure to Work by Sex in Washingtonville
The most frequent times of departure to work in Washingtonville are 6:00 AM to 6:29 AM (30, 24.6%) for males and 7:30 AM to 7:59 AM (32, 25.6%) for females.
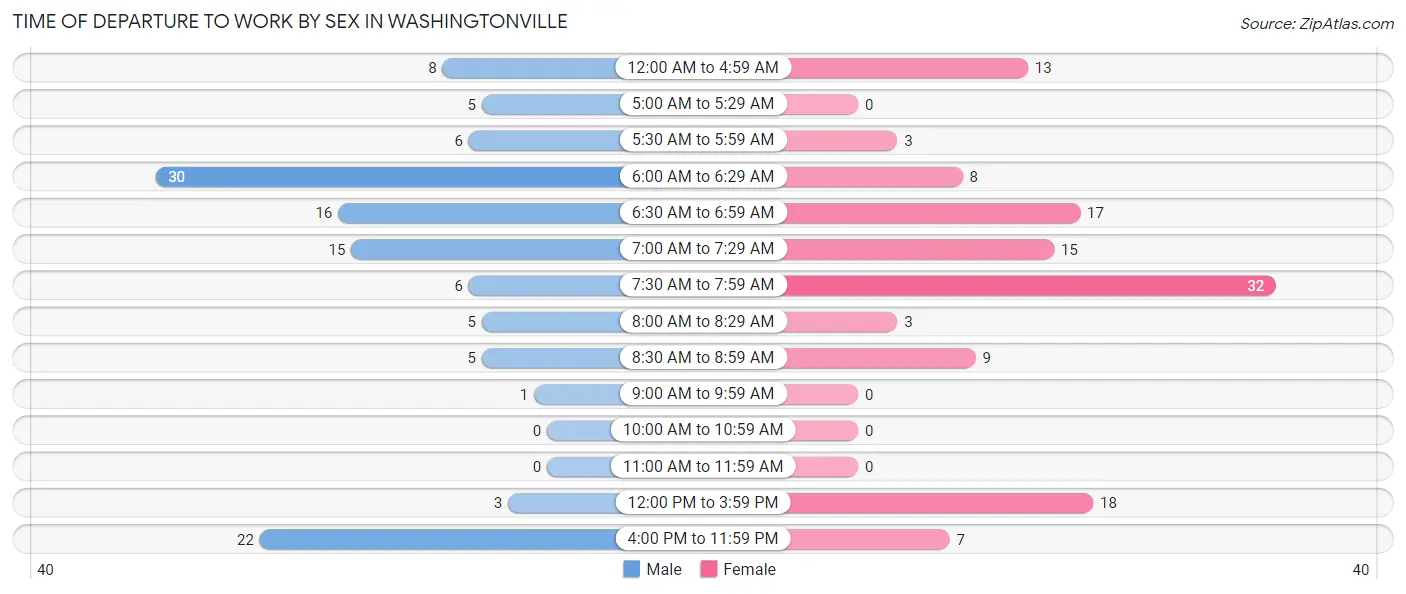
| Time of Departure | Male | Female |
| 12:00 AM to 4:59 AM | 8 (6.6%) | 13 (10.4%) |
| 5:00 AM to 5:29 AM | 5 (4.1%) | 0 (0.0%) |
| 5:30 AM to 5:59 AM | 6 (4.9%) | 3 (2.4%) |
| 6:00 AM to 6:29 AM | 30 (24.6%) | 8 (6.4%) |
| 6:30 AM to 6:59 AM | 16 (13.1%) | 17 (13.6%) |
| 7:00 AM to 7:29 AM | 15 (12.3%) | 15 (12.0%) |
| 7:30 AM to 7:59 AM | 6 (4.9%) | 32 (25.6%) |
| 8:00 AM to 8:29 AM | 5 (4.1%) | 3 (2.4%) |
| 8:30 AM to 8:59 AM | 5 (4.1%) | 9 (7.2%) |
| 9:00 AM to 9:59 AM | 1 (0.8%) | 0 (0.0%) |
| 10:00 AM to 10:59 AM | 0 (0.0%) | 0 (0.0%) |
| 11:00 AM to 11:59 AM | 0 (0.0%) | 0 (0.0%) |
| 12:00 PM to 3:59 PM | 3 (2.5%) | 18 (14.4%) |
| 4:00 PM to 11:59 PM | 22 (18.0%) | 7 (5.6%) |
| Total | 122 (100.0%) | 125 (100.0%) |
Housing Occupancy in Washingtonville
Occupancy by Ownership in Washingtonville
Of the total 313 dwellings in Washingtonville, owner-occupied units account for 183 (58.5%), while renter-occupied units make up 130 (41.5%).
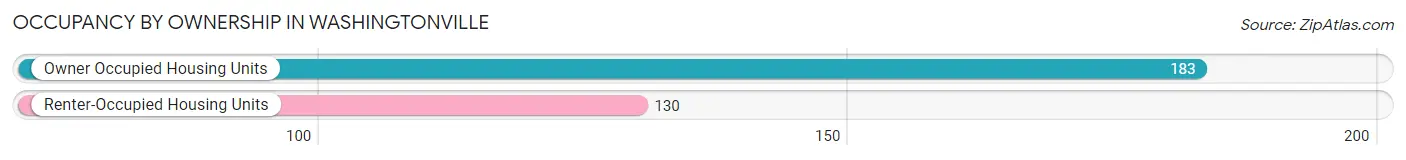
| Occupancy | # Housing Units | % Housing Units |
| Owner Occupied Housing Units | 183 | 58.5% |
| Renter-Occupied Housing Units | 130 | 41.5% |
| Total Occupied Housing Units | 313 | 100.0% |
Occupancy by Household Size in Washingtonville
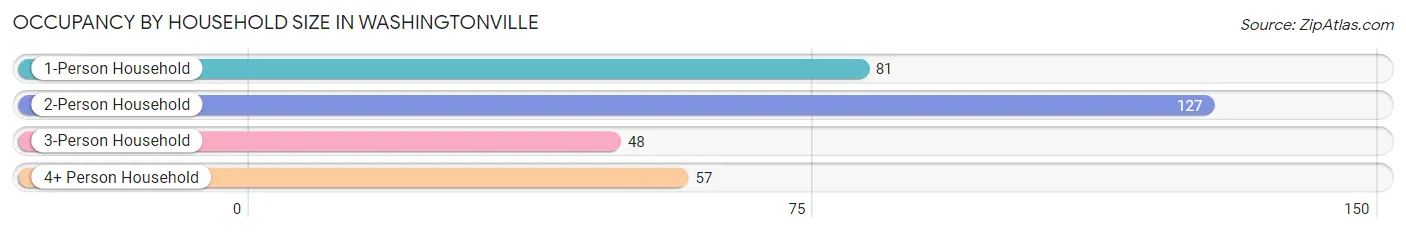
| Household Size | # Housing Units | % Housing Units |
| 1-Person Household | 81 | 25.9% |
| 2-Person Household | 127 | 40.6% |
| 3-Person Household | 48 | 15.3% |
| 4+ Person Household | 57 | 18.2% |
| Total Housing Units | 313 | 100.0% |
Occupancy by Ownership by Household Size in Washingtonville
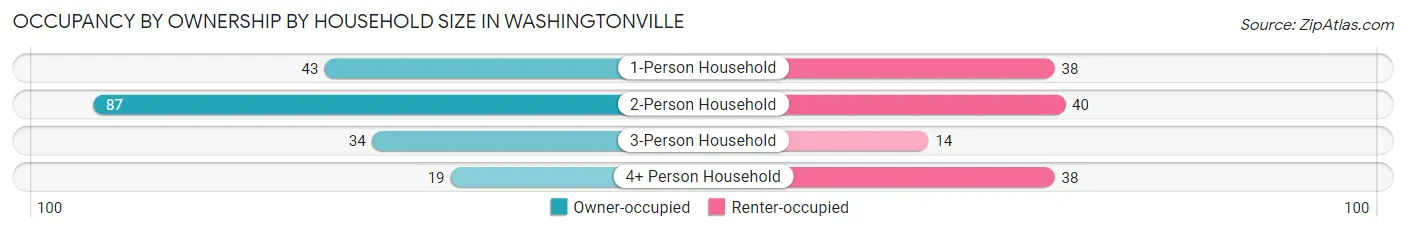
| Household Size | Owner-occupied | Renter-occupied |
| 1-Person Household | 43 (53.1%) | 38 (46.9%) |
| 2-Person Household | 87 (68.5%) | 40 (31.5%) |
| 3-Person Household | 34 (70.8%) | 14 (29.2%) |
| 4+ Person Household | 19 (33.3%) | 38 (66.7%) |
| Total Housing Units | 183 (58.5%) | 130 (41.5%) |
Occupancy by Educational Attainment in Washingtonville
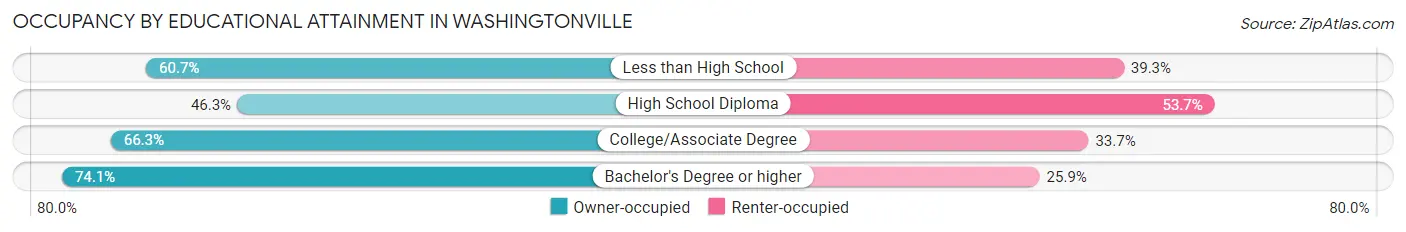
| Household Size | Owner-occupied | Renter-occupied |
| Less than High School | 17 (60.7%) | 11 (39.3%) |
| High School Diploma | 63 (46.3%) | 73 (53.7%) |
| College/Associate Degree | 63 (66.3%) | 32 (33.7%) |
| Bachelor's Degree or higher | 40 (74.1%) | 14 (25.9%) |
Occupancy by Age of Householder in Washingtonville
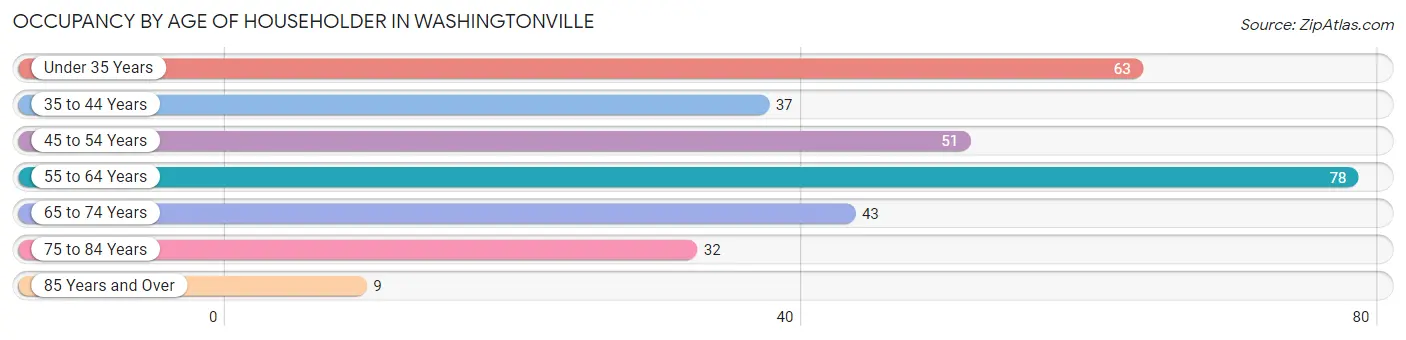
| Age Bracket | # Households | % Households |
| Under 35 Years | 63 | 20.1% |
| 35 to 44 Years | 37 | 11.8% |
| 45 to 54 Years | 51 | 16.3% |
| 55 to 64 Years | 78 | 24.9% |
| 65 to 74 Years | 43 | 13.7% |
| 75 to 84 Years | 32 | 10.2% |
| 85 Years and Over | 9 | 2.9% |
| Total | 313 | 100.0% |
Housing Finances in Washingtonville
Median Income by Occupancy in Washingtonville
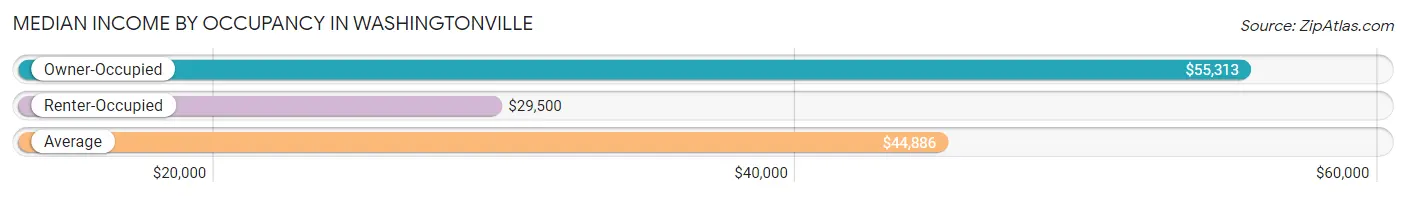
| Occupancy Type | # Households | Median Income |
| Owner-Occupied | 183 (58.5%) | $55,313 |
| Renter-Occupied | 130 (41.5%) | $29,500 |
| Average | 313 (100.0%) | $44,886 |
Occupancy by Householder Income Bracket in Washingtonville
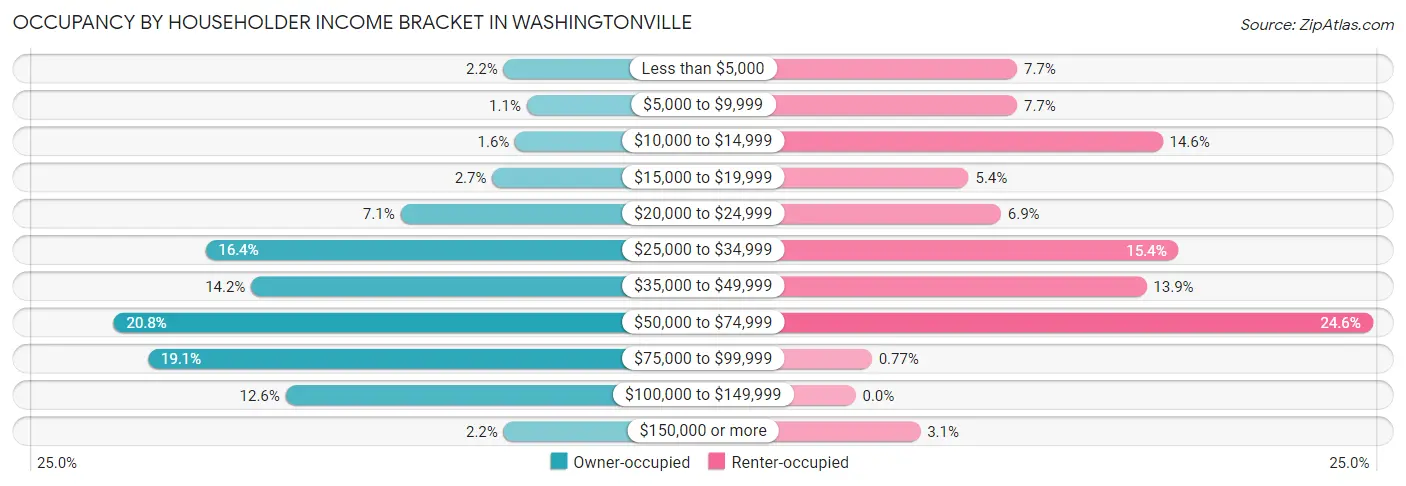
| Income Bracket | Owner-occupied | Renter-occupied |
| Less than $5,000 | 4 (2.2%) | 10 (7.7%) |
| $5,000 to $9,999 | 2 (1.1%) | 10 (7.7%) |
| $10,000 to $14,999 | 3 (1.6%) | 19 (14.6%) |
| $15,000 to $19,999 | 5 (2.7%) | 7 (5.4%) |
| $20,000 to $24,999 | 13 (7.1%) | 9 (6.9%) |
| $25,000 to $34,999 | 30 (16.4%) | 20 (15.4%) |
| $35,000 to $49,999 | 26 (14.2%) | 18 (13.9%) |
| $50,000 to $74,999 | 38 (20.8%) | 32 (24.6%) |
| $75,000 to $99,999 | 35 (19.1%) | 1 (0.8%) |
| $100,000 to $149,999 | 23 (12.6%) | 0 (0.0%) |
| $150,000 or more | 4 (2.2%) | 4 (3.1%) |
| Total | 183 (100.0%) | 130 (100.0%) |
Monthly Housing Cost Tiers in Washingtonville
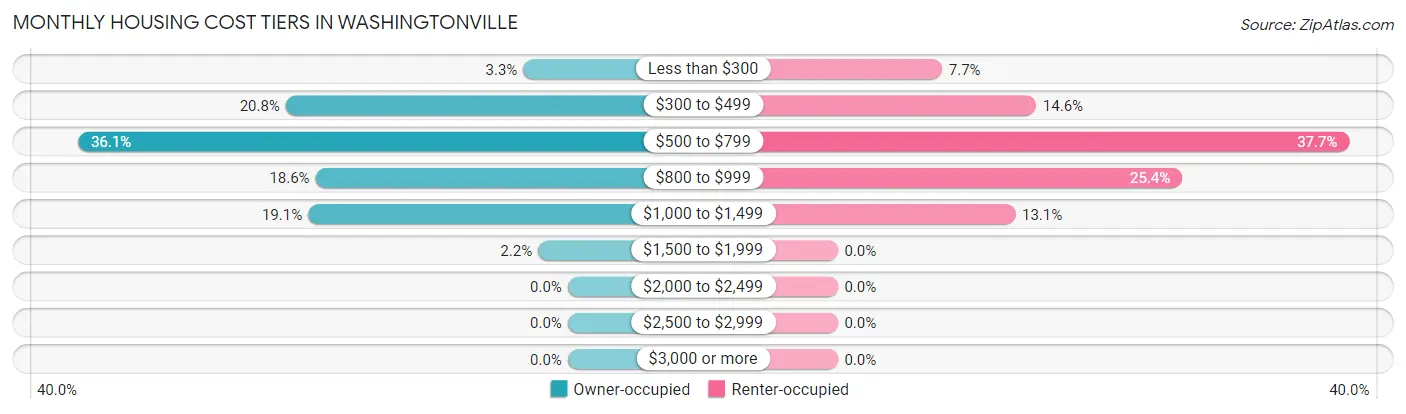
| Monthly Cost | Owner-occupied | Renter-occupied |
| Less than $300 | 6 (3.3%) | 10 (7.7%) |
| $300 to $499 | 38 (20.8%) | 19 (14.6%) |
| $500 to $799 | 66 (36.1%) | 49 (37.7%) |
| $800 to $999 | 34 (18.6%) | 33 (25.4%) |
| $1,000 to $1,499 | 35 (19.1%) | 17 (13.1%) |
| $1,500 to $1,999 | 4 (2.2%) | 0 (0.0%) |
| $2,000 to $2,499 | 0 (0.0%) | 0 (0.0%) |
| $2,500 to $2,999 | 0 (0.0%) | 0 (0.0%) |
| $3,000 or more | 0 (0.0%) | 0 (0.0%) |
| Total | 183 (100.0%) | 130 (100.0%) |
Physical Housing Characteristics in Washingtonville
Housing Structures in Washingtonville
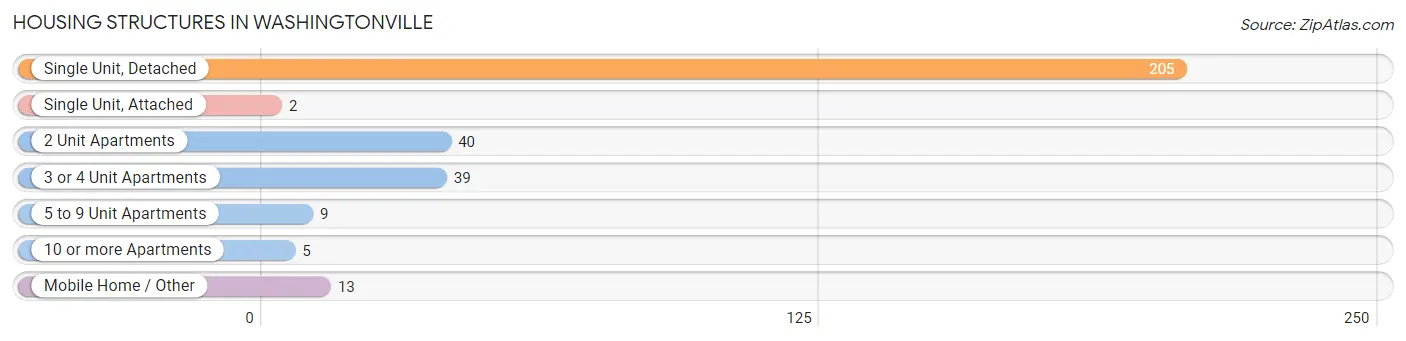
| Structure Type | # Housing Units | % Housing Units |
| Single Unit, Detached | 205 | 65.5% |
| Single Unit, Attached | 2 | 0.6% |
| 2 Unit Apartments | 40 | 12.8% |
| 3 or 4 Unit Apartments | 39 | 12.5% |
| 5 to 9 Unit Apartments | 9 | 2.9% |
| 10 or more Apartments | 5 | 1.6% |
| Mobile Home / Other | 13 | 4.2% |
| Total | 313 | 100.0% |
Housing Structures by Occupancy in Washingtonville
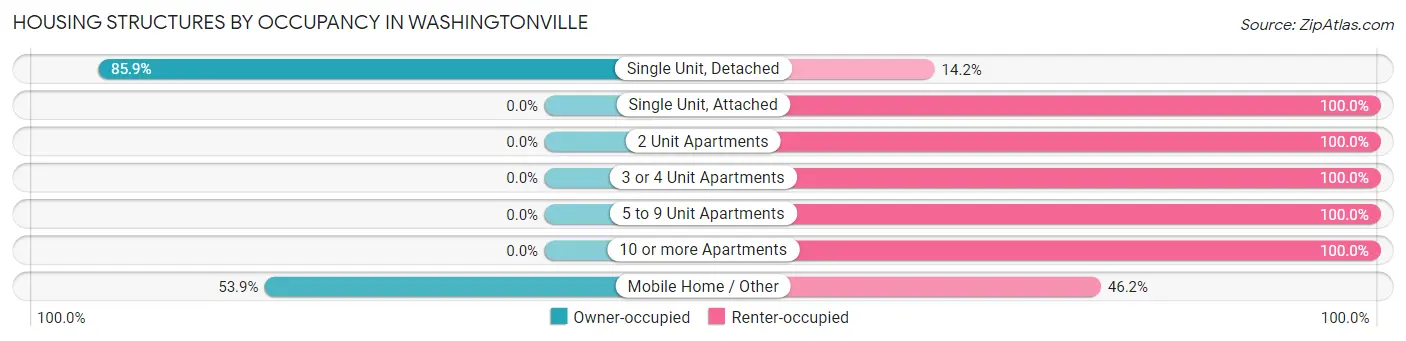
| Structure Type | Owner-occupied | Renter-occupied |
| Single Unit, Detached | 176 (85.9%) | 29 (14.1%) |
| Single Unit, Attached | 0 (0.0%) | 2 (100.0%) |
| 2 Unit Apartments | 0 (0.0%) | 40 (100.0%) |
| 3 or 4 Unit Apartments | 0 (0.0%) | 39 (100.0%) |
| 5 to 9 Unit Apartments | 0 (0.0%) | 9 (100.0%) |
| 10 or more Apartments | 0 (0.0%) | 5 (100.0%) |
| Mobile Home / Other | 7 (53.8%) | 6 (46.2%) |
| Total | 183 (58.5%) | 130 (41.5%) |
Housing Structures by Number of Rooms in Washingtonville
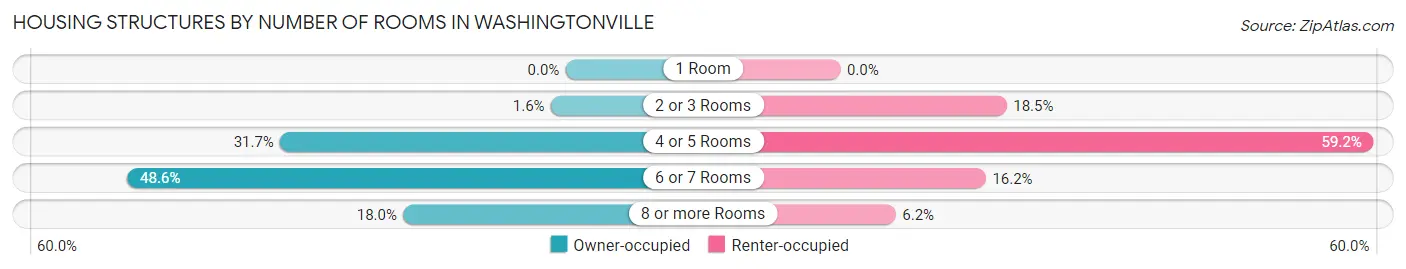
| Number of Rooms | Owner-occupied | Renter-occupied |
| 1 Room | 0 (0.0%) | 0 (0.0%) |
| 2 or 3 Rooms | 3 (1.6%) | 24 (18.5%) |
| 4 or 5 Rooms | 58 (31.7%) | 77 (59.2%) |
| 6 or 7 Rooms | 89 (48.6%) | 21 (16.2%) |
| 8 or more Rooms | 33 (18.0%) | 8 (6.1%) |
| Total | 183 (100.0%) | 130 (100.0%) |
Housing Structure by Heating Type in Washingtonville
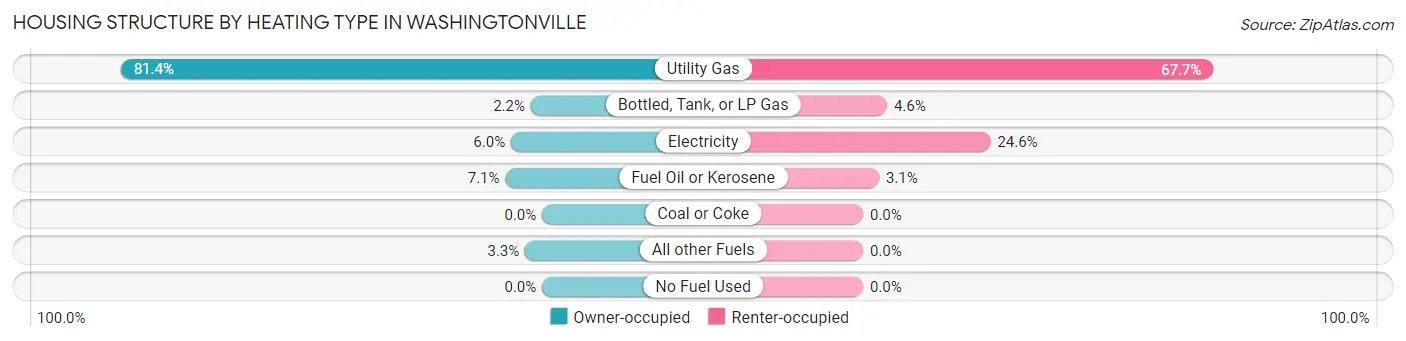
| Heating Type | Owner-occupied | Renter-occupied |
| Utility Gas | 149 (81.4%) | 88 (67.7%) |
| Bottled, Tank, or LP Gas | 4 (2.2%) | 6 (4.6%) |
| Electricity | 11 (6.0%) | 32 (24.6%) |
| Fuel Oil or Kerosene | 13 (7.1%) | 4 (3.1%) |
| Coal or Coke | 0 (0.0%) | 0 (0.0%) |
| All other Fuels | 6 (3.3%) | 0 (0.0%) |
| No Fuel Used | 0 (0.0%) | 0 (0.0%) |
| Total | 183 (100.0%) | 130 (100.0%) |
Household Vehicle Usage in Washingtonville
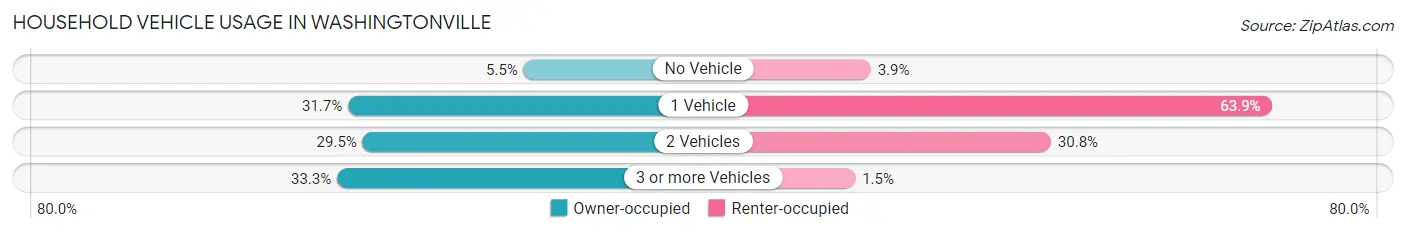
| Vehicles per Household | Owner-occupied | Renter-occupied |
| No Vehicle | 10 (5.5%) | 5 (3.8%) |
| 1 Vehicle | 58 (31.7%) | 83 (63.8%) |
| 2 Vehicles | 54 (29.5%) | 40 (30.8%) |
| 3 or more Vehicles | 61 (33.3%) | 2 (1.5%) |
| Total | 183 (100.0%) | 130 (100.0%) |
Real Estate & Mortgages in Washingtonville
Real Estate and Mortgage Overview in Washingtonville
| Characteristic | Without Mortgage | With Mortgage |
| Housing Units | 82 | 101 |
| Median Property Value | $90,900 | $95,000 |
| Median Household Income | $50,833 | $0 |
| Monthly Housing Costs | $479 | $0 |
| Real Estate Taxes | $1,319 | $7 |
Property Value by Mortgage Status in Washingtonville
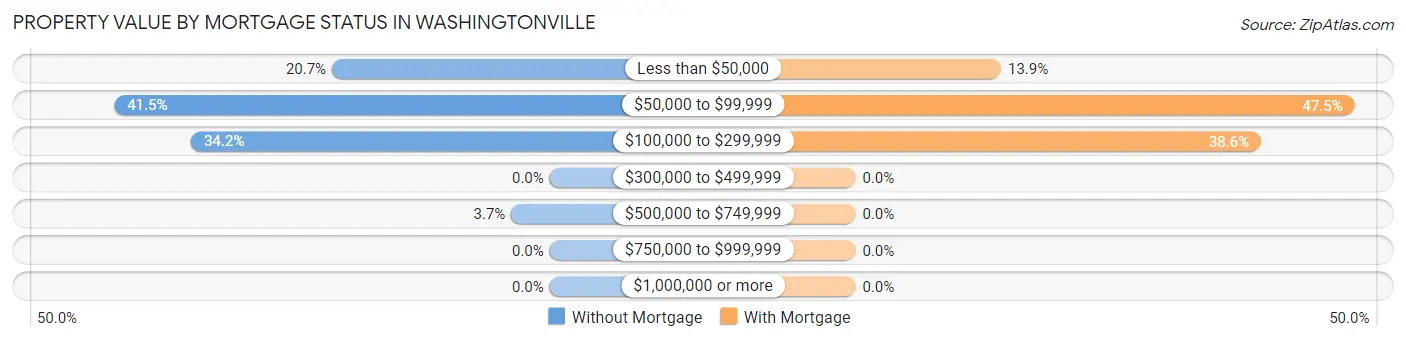
| Property Value | Without Mortgage | With Mortgage |
| Less than $50,000 | 17 (20.7%) | 14 (13.9%) |
| $50,000 to $99,999 | 34 (41.5%) | 48 (47.5%) |
| $100,000 to $299,999 | 28 (34.2%) | 39 (38.6%) |
| $300,000 to $499,999 | 0 (0.0%) | 0 (0.0%) |
| $500,000 to $749,999 | 3 (3.7%) | 0 (0.0%) |
| $750,000 to $999,999 | 0 (0.0%) | 0 (0.0%) |
| $1,000,000 or more | 0 (0.0%) | 0 (0.0%) |
| Total | 82 (100.0%) | 101 (100.0%) |
Household Income by Mortgage Status in Washingtonville
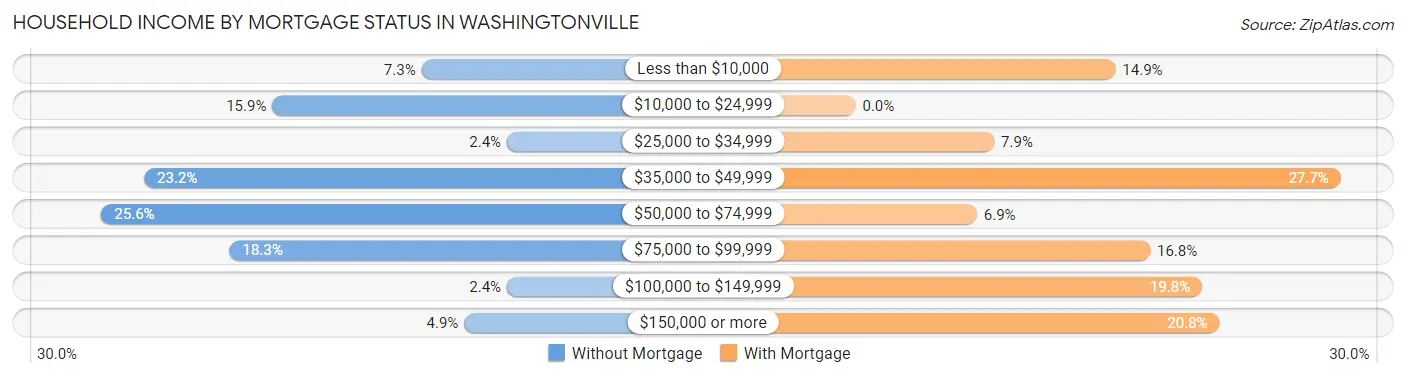
| Household Income | Without Mortgage | With Mortgage |
| Less than $10,000 | 6 (7.3%) | 15 (14.8%) |
| $10,000 to $24,999 | 13 (15.9%) | 0 (0.0%) |
| $25,000 to $34,999 | 2 (2.4%) | 8 (7.9%) |
| $35,000 to $49,999 | 19 (23.2%) | 28 (27.7%) |
| $50,000 to $74,999 | 21 (25.6%) | 7 (6.9%) |
| $75,000 to $99,999 | 15 (18.3%) | 17 (16.8%) |
| $100,000 to $149,999 | 2 (2.4%) | 20 (19.8%) |
| $150,000 or more | 4 (4.9%) | 21 (20.8%) |
| Total | 82 (100.0%) | 101 (100.0%) |
Property Value to Household Income Ratio in Washingtonville
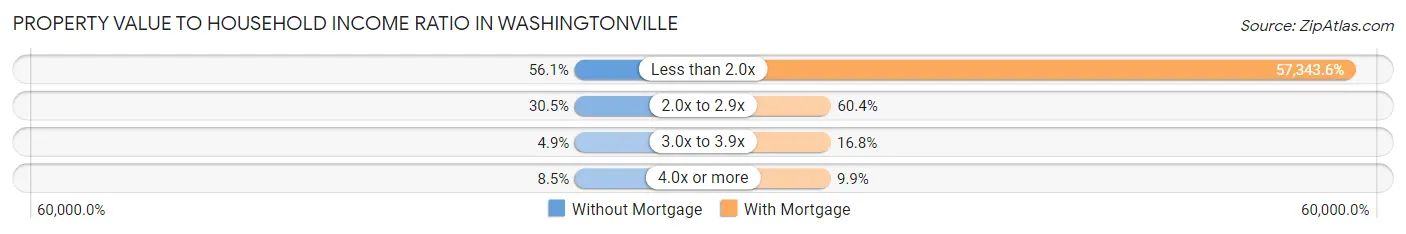
| Value-to-Income Ratio | Without Mortgage | With Mortgage |
| Less than 2.0x | 46 (56.1%) | 57,917 (57,343.6%) |
| 2.0x to 2.9x | 25 (30.5%) | 61 (60.4%) |
| 3.0x to 3.9x | 4 (4.9%) | 17 (16.8%) |
| 4.0x or more | 7 (8.5%) | 10 (9.9%) |
| Total | 82 (100.0%) | 101 (100.0%) |
Real Estate Taxes by Mortgage Status in Washingtonville
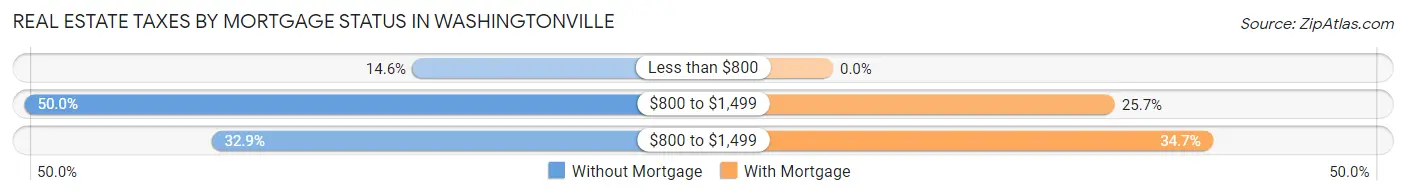
| Property Taxes | Without Mortgage | With Mortgage |
| Less than $800 | 12 (14.6%) | 0 (0.0%) |
| $800 to $1,499 | 41 (50.0%) | 26 (25.7%) |
| $800 to $1,499 | 27 (32.9%) | 35 (34.6%) |
| Total | 82 (100.0%) | 101 (100.0%) |
Health & Disability in Washingtonville
Health Insurance Coverage by Age in Washingtonville
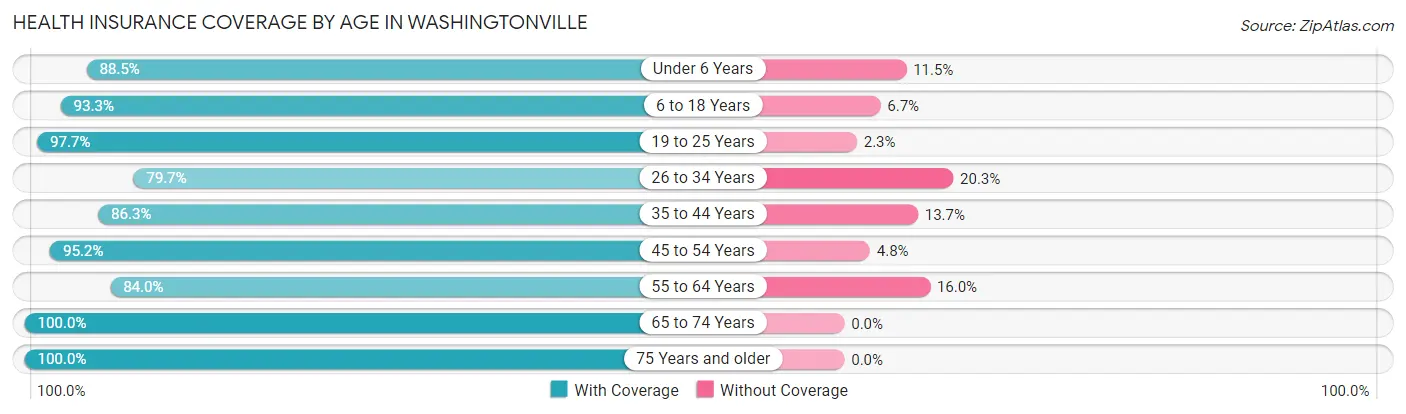
| Age Bracket | With Coverage | Without Coverage |
| Under 6 Years | 69 (88.5%) | 9 (11.5%) |
| 6 to 18 Years | 125 (93.3%) | 9 (6.7%) |
| 19 to 25 Years | 42 (97.7%) | 1 (2.3%) |
| 26 to 34 Years | 55 (79.7%) | 14 (20.3%) |
| 35 to 44 Years | 63 (86.3%) | 10 (13.7%) |
| 45 to 54 Years | 80 (95.2%) | 4 (4.8%) |
| 55 to 64 Years | 100 (84.0%) | 19 (16.0%) |
| 65 to 74 Years | 75 (100.0%) | 0 (0.0%) |
| 75 Years and older | 71 (100.0%) | 0 (0.0%) |
| Total | 680 (91.1%) | 66 (8.8%) |
Health Insurance Coverage by Citizenship Status in Washingtonville
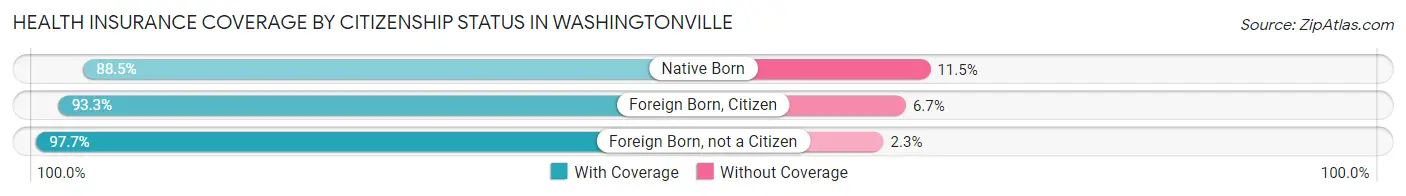
| Citizenship Status | With Coverage | Without Coverage |
| Native Born | 69 (88.5%) | 9 (11.5%) |
| Foreign Born, Citizen | 125 (93.3%) | 9 (6.7%) |
| Foreign Born, not a Citizen | 42 (97.7%) | 1 (2.3%) |
Health Insurance Coverage by Household Income in Washingtonville
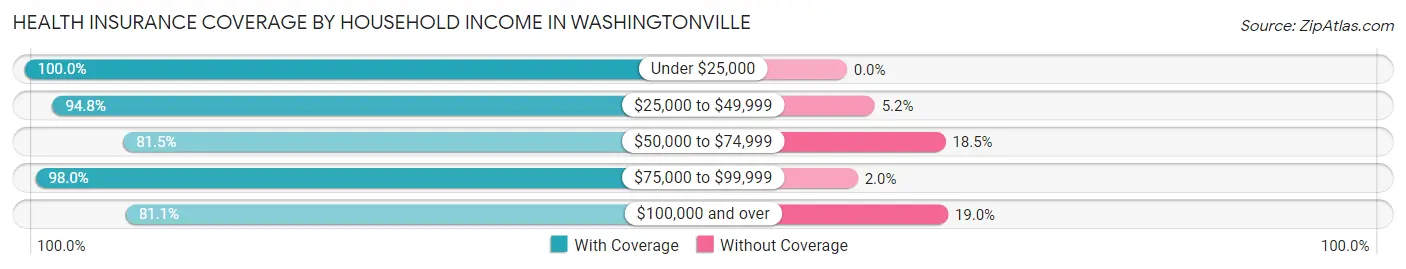
| Household Income | With Coverage | Without Coverage |
| Under $25,000 | 155 (100.0%) | 0 (0.0%) |
| $25,000 to $49,999 | 199 (94.8%) | 11 (5.2%) |
| $50,000 to $74,999 | 150 (81.5%) | 34 (18.5%) |
| $75,000 to $99,999 | 96 (98.0%) | 2 (2.0%) |
| $100,000 and over | 77 (81.0%) | 18 (19.0%) |
Public vs Private Health Insurance Coverage by Age in Washingtonville
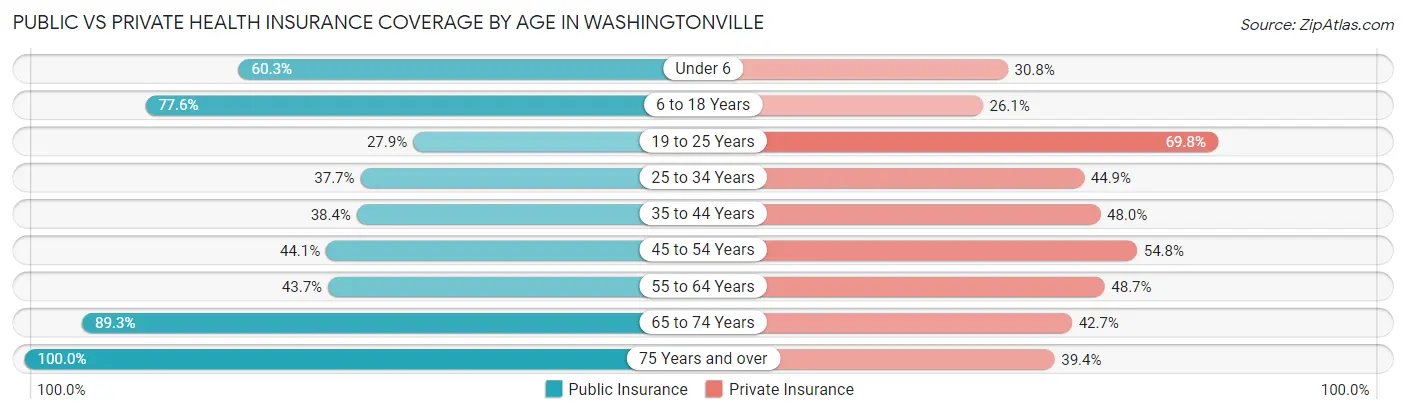
| Age Bracket | Public Insurance | Private Insurance |
| Under 6 | 47 (60.3%) | 24 (30.8%) |
| 6 to 18 Years | 104 (77.6%) | 35 (26.1%) |
| 19 to 25 Years | 12 (27.9%) | 30 (69.8%) |
| 25 to 34 Years | 26 (37.7%) | 31 (44.9%) |
| 35 to 44 Years | 28 (38.4%) | 35 (47.9%) |
| 45 to 54 Years | 37 (44.1%) | 46 (54.8%) |
| 55 to 64 Years | 52 (43.7%) | 58 (48.7%) |
| 65 to 74 Years | 67 (89.3%) | 32 (42.7%) |
| 75 Years and over | 71 (100.0%) | 28 (39.4%) |
| Total | 444 (59.5%) | 319 (42.8%) |
Disability Status by Sex by Age in Washingtonville
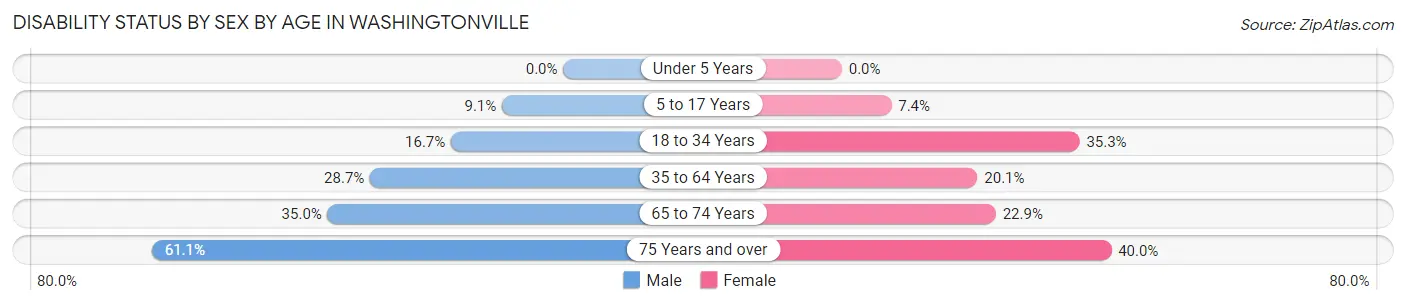
| Age Bracket | Male | Female |
| Under 5 Years | 0 (0.0%) | 0 (0.0%) |
| 5 to 17 Years | 8 (9.1%) | 5 (7.3%) |
| 18 to 34 Years | 9 (16.7%) | 24 (35.3%) |
| 35 to 64 Years | 35 (28.7%) | 31 (20.1%) |
| 65 to 74 Years | 14 (35.0%) | 8 (22.9%) |
| 75 Years and over | 22 (61.1%) | 14 (40.0%) |
Disability Class by Sex by Age in Washingtonville
Disability Class: Hearing Difficulty
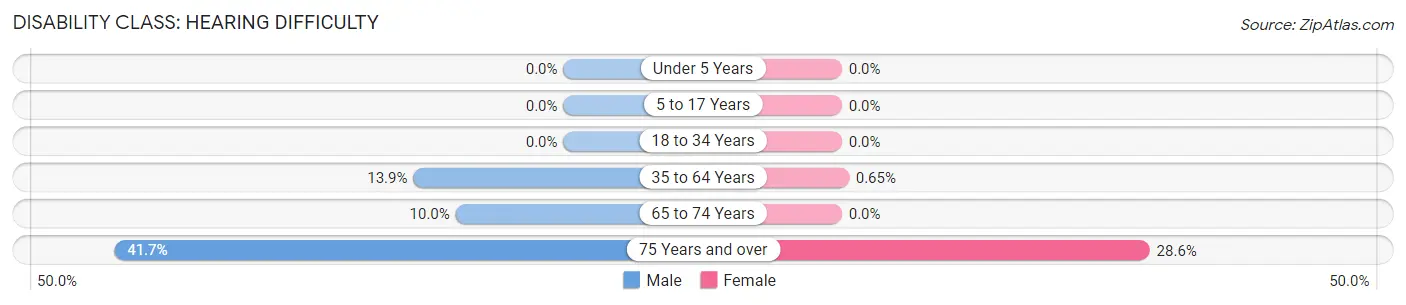
| Age Bracket | Male | Female |
| Under 5 Years | 0 (0.0%) | 0 (0.0%) |
| 5 to 17 Years | 0 (0.0%) | 0 (0.0%) |
| 18 to 34 Years | 0 (0.0%) | 0 (0.0%) |
| 35 to 64 Years | 17 (13.9%) | 1 (0.6%) |
| 65 to 74 Years | 4 (10.0%) | 0 (0.0%) |
| 75 Years and over | 15 (41.7%) | 10 (28.6%) |
Disability Class: Vision Difficulty
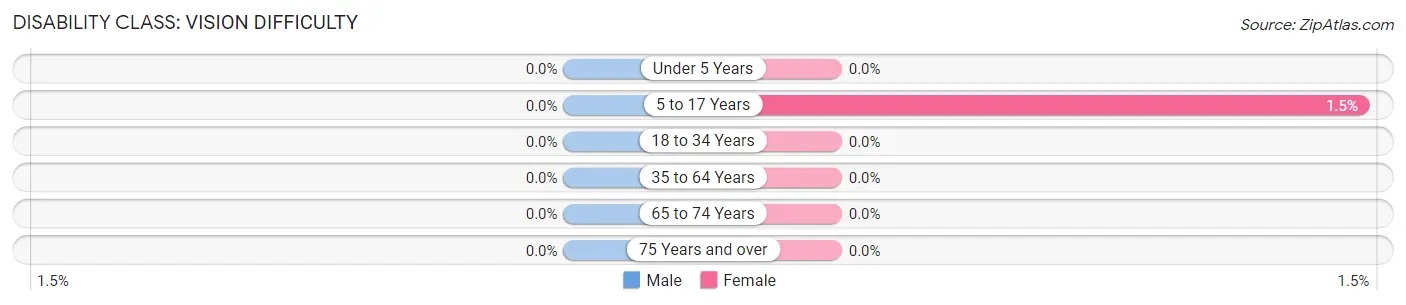
| Age Bracket | Male | Female |
| Under 5 Years | 0 (0.0%) | 0 (0.0%) |
| 5 to 17 Years | 0 (0.0%) | 1 (1.5%) |
| 18 to 34 Years | 0 (0.0%) | 0 (0.0%) |
| 35 to 64 Years | 0 (0.0%) | 0 (0.0%) |
| 65 to 74 Years | 0 (0.0%) | 0 (0.0%) |
| 75 Years and over | 0 (0.0%) | 0 (0.0%) |
Disability Class: Cognitive Difficulty
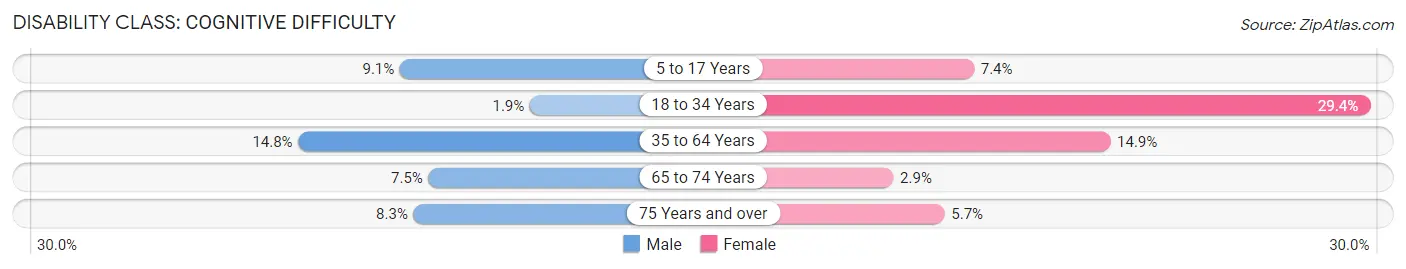
| Age Bracket | Male | Female |
| 5 to 17 Years | 8 (9.1%) | 5 (7.3%) |
| 18 to 34 Years | 1 (1.8%) | 20 (29.4%) |
| 35 to 64 Years | 18 (14.7%) | 23 (14.9%) |
| 65 to 74 Years | 3 (7.5%) | 1 (2.9%) |
| 75 Years and over | 3 (8.3%) | 2 (5.7%) |
Disability Class: Ambulatory Difficulty
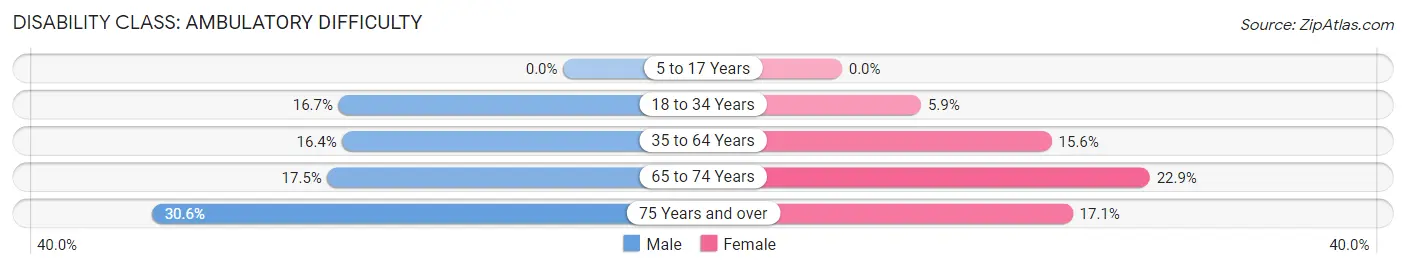
| Age Bracket | Male | Female |
| 5 to 17 Years | 0 (0.0%) | 0 (0.0%) |
| 18 to 34 Years | 9 (16.7%) | 4 (5.9%) |
| 35 to 64 Years | 20 (16.4%) | 24 (15.6%) |
| 65 to 74 Years | 7 (17.5%) | 8 (22.9%) |
| 75 Years and over | 11 (30.6%) | 6 (17.1%) |
Disability Class: Self-Care Difficulty
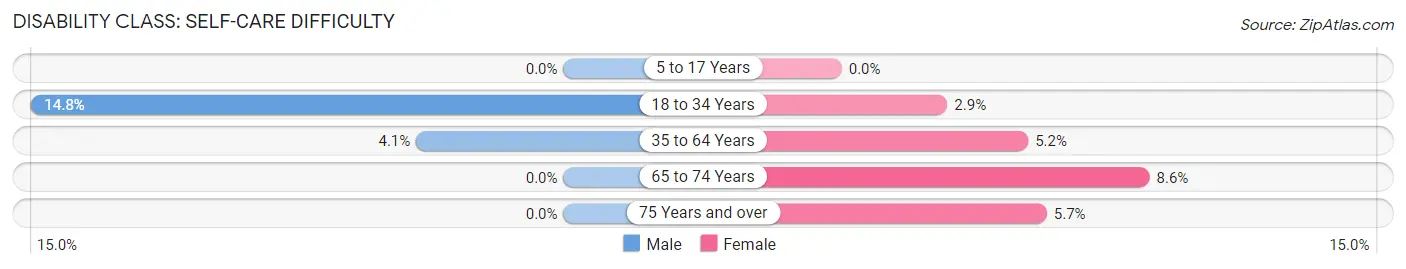
| Age Bracket | Male | Female |
| 5 to 17 Years | 0 (0.0%) | 0 (0.0%) |
| 18 to 34 Years | 8 (14.8%) | 2 (2.9%) |
| 35 to 64 Years | 5 (4.1%) | 8 (5.2%) |
| 65 to 74 Years | 0 (0.0%) | 3 (8.6%) |
| 75 Years and over | 0 (0.0%) | 2 (5.7%) |
Technology Access in Washingtonville
Computing Device Access in Washingtonville
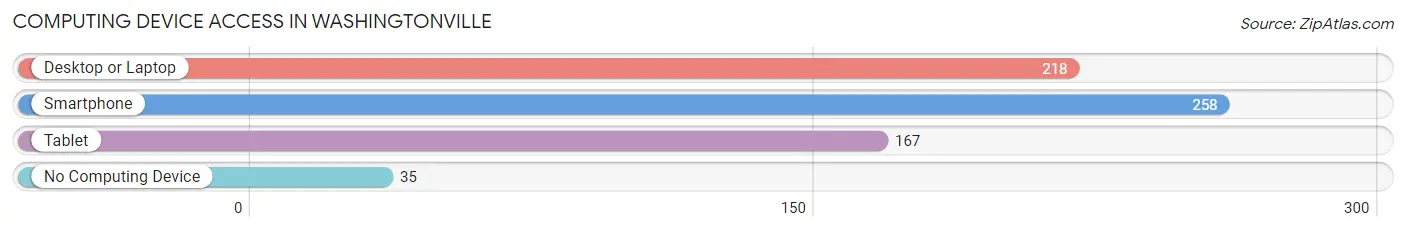
| Device Type | # Households | % Households |
| Desktop or Laptop | 218 | 69.7% |
| Smartphone | 258 | 82.4% |
| Tablet | 167 | 53.3% |
| No Computing Device | 35 | 11.2% |
| Total | 313 | 100.0% |
Internet Access in Washingtonville
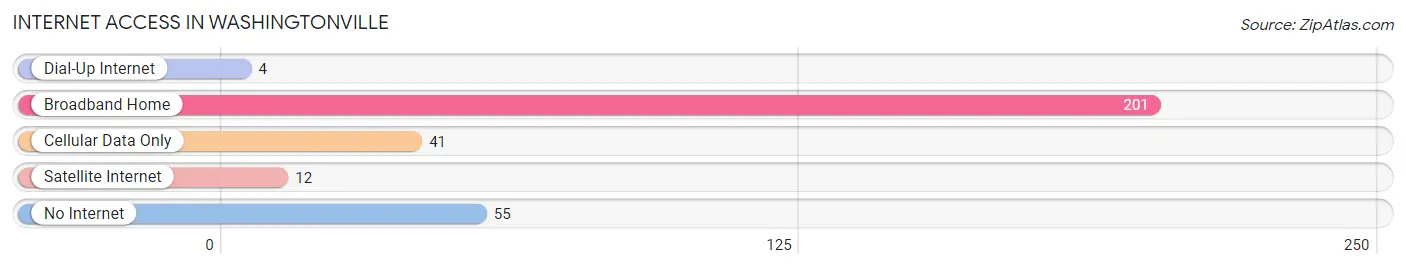
| Internet Type | # Households | % Households |
| Dial-Up Internet | 4 | 1.3% |
| Broadband Home | 201 | 64.2% |
| Cellular Data Only | 41 | 13.1% |
| Satellite Internet | 12 | 3.8% |
| No Internet | 55 | 17.6% |
| Total | 313 | 100.0% |
Washingtonville Summary
History
The village of Washingtonville, Ohio is located in the northeastern part of Columbiana County, Ohio. It is situated on the banks of the Little Beaver Creek, a tributary of the Mahoning River. The village was founded in 1817 by William Washington, a Revolutionary War veteran, who purchased the land from the United States government. The village was originally known as Washington's Mills, but was later changed to Washingtonville.
The village was an important stop on the Underground Railroad, with many of the local residents helping to hide and transport runaway slaves. The village was also home to a number of mills, including a grist mill, saw mill, and woolen mill. These mills provided employment for many of the local residents.
The village was also home to a number of churches, including the Methodist Episcopal Church, the Presbyterian Church, and the United Brethren Church. The village also had a school, a post office, and a number of stores.
Geography
Washingtonville is located at 40°48'N 80°51'W (40.8, -80.85). The village is situated on the banks of the Little Beaver Creek, a tributary of the Mahoning River. The village is located in the Appalachian Plateau region of Ohio, and is surrounded by rolling hills and forests. The village is located approximately 25 miles south of Youngstown, Ohio, and approximately 50 miles northwest of Pittsburgh, Pennsylvania.
Economy
The economy of Washingtonville is largely based on agriculture and manufacturing. The village is home to a number of farms, which produce a variety of crops, including corn, soybeans, wheat, and hay. The village is also home to a number of manufacturing companies, which produce a variety of products, including furniture, automotive parts, and plastic products.
Demographics
According to the 2010 United States Census, the village of Washingtonville had a population of 1,093. The racial makeup of the village was 97.2% White, 0.7% African American, 0.2% Native American, 0.2% Asian, 0.1% from other races, and 1.7% from two or more races. Hispanic or Latino of any race were 0.7% of the population.
The median income for a household in the village was $37,500, and the median income for a family was $41,250. The per capita income for the village was $17,845. About 11.2% of families and 13.2% of the population were below the poverty line, including 17.2% of those under age 18 and 8.3% of those age 65 or over.
Common Questions
What is Per Capita Income in Washingtonville?
Per Capita income in Washingtonville is $28,816.
What is the Median Family Income in Washingtonville?
Median Family Income in Washingtonville is $45,938.
What is the Median Household income in Washingtonville?
Median Household Income in Washingtonville is $44,886.
What is Income or Wage Gap in Washingtonville?
Income or Wage Gap in Washingtonville is 23.3%.
Women in Washingtonville earn 76.7 cents for every dollar earned by a man.
What is Family Income Deficit in Washingtonville?
Family Income Deficit in Washingtonville is $12,515.
Families that are below poverty line in Washingtonville earn $12,515 less on average than the poverty threshold level.
What is Inequality or Gini Index in Washingtonville?
Inequality or Gini Index in Washingtonville is 0.53.
What is the Total Population of Washingtonville?
Total Population of Washingtonville is 746.
What is the Total Male Population of Washingtonville?
Total Male Population of Washingtonville is 356.
What is the Total Female Population of Washingtonville?
Total Female Population of Washingtonville is 390.
What is the Ratio of Males per 100 Females in Washingtonville?
There are 91.28 Males per 100 Females in Washingtonville.
What is the Ratio of Females per 100 Males in Washingtonville?
There are 109.55 Females per 100 Males in Washingtonville.
What is the Median Population Age in Washingtonville?
Median Population Age in Washingtonville is 42.1 Years.
What is the Average Family Size in Washingtonville
Average Family Size in Washingtonville is 2.7 People.
What is the Average Household Size in Washingtonville
Average Household Size in Washingtonville is 2.4 People.
How Large is the Labor Force in Washingtonville?
There are 310 People in the Labor Forcein in Washingtonville.
What is the Percentage of People in the Labor Force in Washingtonville?
55.3% of People are in the Labor Force in Washingtonville.
What is the Unemployment Rate in Washingtonville?
Unemployment Rate in Washingtonville is 8.7%.