Middlefield, OH Map & Demographics
Middlefield Map
Middlefield Overview
$35,930
PER CAPITA INCOME
$90,349
AVG FAMILY INCOME
$62,392
AVG HOUSEHOLD INCOME
54.2%
WAGE / INCOME GAP [ % ]
45.8¢/ $1
WAGE / INCOME GAP [ $ ]
0.42
INEQUALITY / GINI INDEX
2,754
TOTAL POPULATION
1,136
MALE POPULATION
1,618
FEMALE POPULATION
70.21
MALES / 100 FEMALES
142.43
FEMALES / 100 MALES
48.7
MEDIAN AGE
3.0
AVG FAMILY SIZE
2.0
AVG HOUSEHOLD SIZE
1,651
LABOR FORCE [ PEOPLE ]
66.0%
PERCENT IN LABOR FORCE
10.9%
UNEMPLOYMENT RATE
Middlefield Zip Codes
Middlefield Area Codes
Income in Middlefield
Income Overview in Middlefield
Per Capita Income in Middlefield is $35,930, while median incomes of families and households are $90,349 and $62,392 respectively.
| Characteristic | Number | Measure |
| Per Capita Income | 2,754 | $35,930 |
| Median Family Income | 626 | $90,349 |
| Mean Family Income | 626 | $110,586 |
| Median Household Income | 1,318 | $62,392 |
| Mean Household Income | 1,318 | $75,316 |
| Income Deficit | 626 | $0 |
| Wage / Income Gap (%) | 2,754 | 54.21% |
| Wage / Income Gap ($) | 2,754 | 45.79¢ per $1 |
| Gini / Inequality Index | 2,754 | 0.42 |
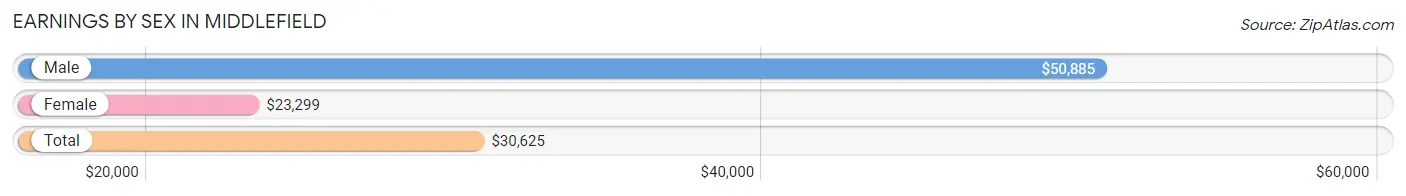
Earnings by Sex in Middlefield
Average Earnings in Middlefield are $30,625, $50,885 for men and $23,299 for women, a difference of 54.2%.
| Sex | Number | Average Earnings |
| Male | 771 (45.8%) | $50,885 |
| Female | 912 (54.2%) | $23,299 |
| Total | 1,683 (100.0%) | $30,625 |
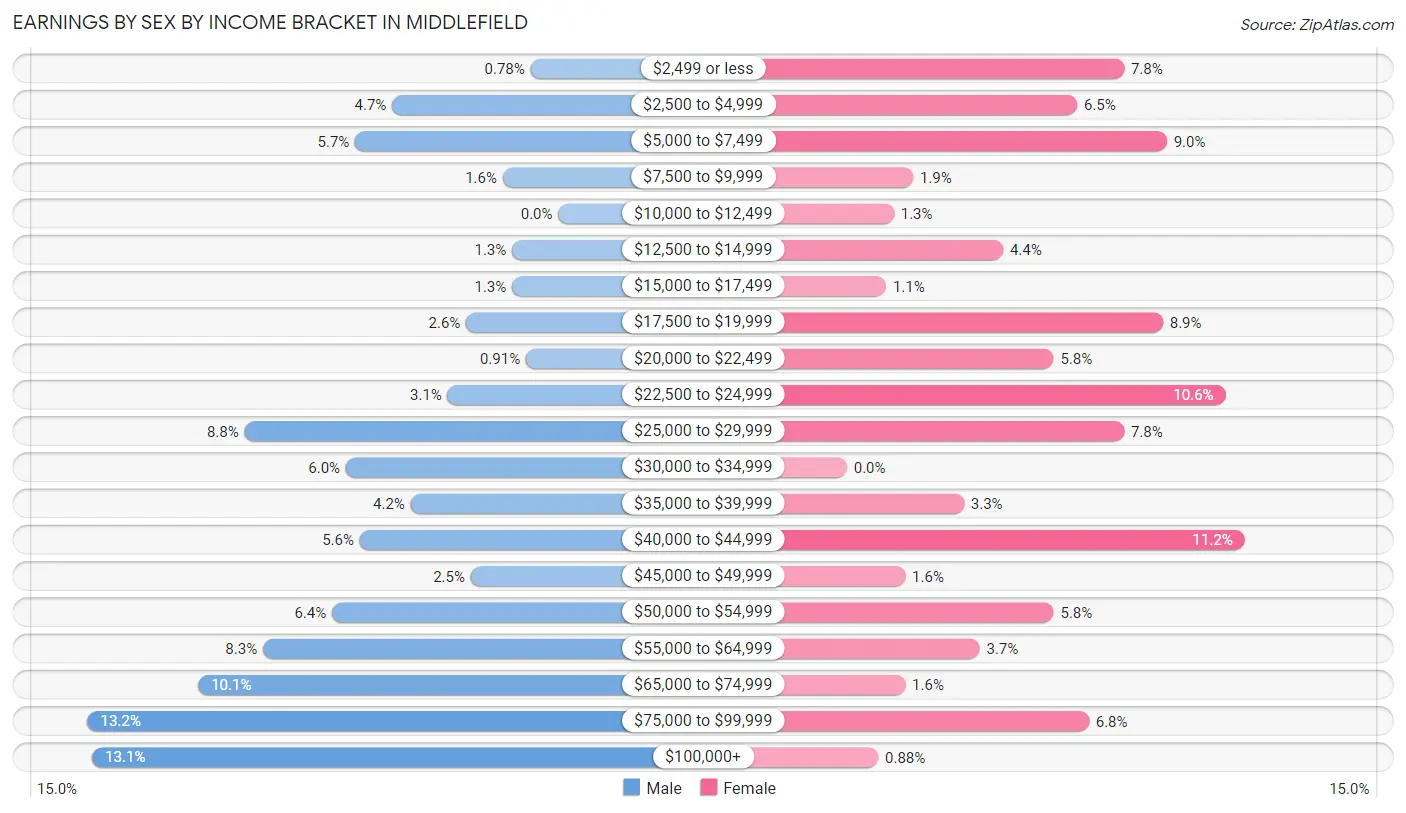
Earnings by Sex by Income Bracket in Middlefield
The most common earnings brackets in Middlefield are $75,000 to $99,999 for men (102 | 13.2%) and $40,000 to $44,999 for women (102 | 11.2%).
| Income | Male | Female |
| $2,499 or less | 6 (0.8%) | 71 (7.8%) |
| $2,500 to $4,999 | 36 (4.7%) | 59 (6.5%) |
| $5,000 to $7,499 | 44 (5.7%) | 82 (9.0%) |
| $7,500 to $9,999 | 12 (1.6%) | 17 (1.9%) |
| $10,000 to $12,499 | 0 (0.0%) | 12 (1.3%) |
| $12,500 to $14,999 | 10 (1.3%) | 40 (4.4%) |
| $15,000 to $17,499 | 10 (1.3%) | 10 (1.1%) |
| $17,500 to $19,999 | 20 (2.6%) | 81 (8.9%) |
| $20,000 to $22,499 | 7 (0.9%) | 53 (5.8%) |
| $22,500 to $24,999 | 24 (3.1%) | 97 (10.6%) |
| $25,000 to $29,999 | 68 (8.8%) | 71 (7.8%) |
| $30,000 to $34,999 | 46 (6.0%) | 0 (0.0%) |
| $35,000 to $39,999 | 32 (4.2%) | 30 (3.3%) |
| $40,000 to $44,999 | 43 (5.6%) | 102 (11.2%) |
| $45,000 to $49,999 | 19 (2.5%) | 15 (1.6%) |
| $50,000 to $54,999 | 49 (6.4%) | 53 (5.8%) |
| $55,000 to $64,999 | 64 (8.3%) | 34 (3.7%) |
| $65,000 to $74,999 | 78 (10.1%) | 15 (1.6%) |
| $75,000 to $99,999 | 102 (13.2%) | 62 (6.8%) |
| $100,000+ | 101 (13.1%) | 8 (0.9%) |
| Total | 771 (100.0%) | 912 (100.0%) |
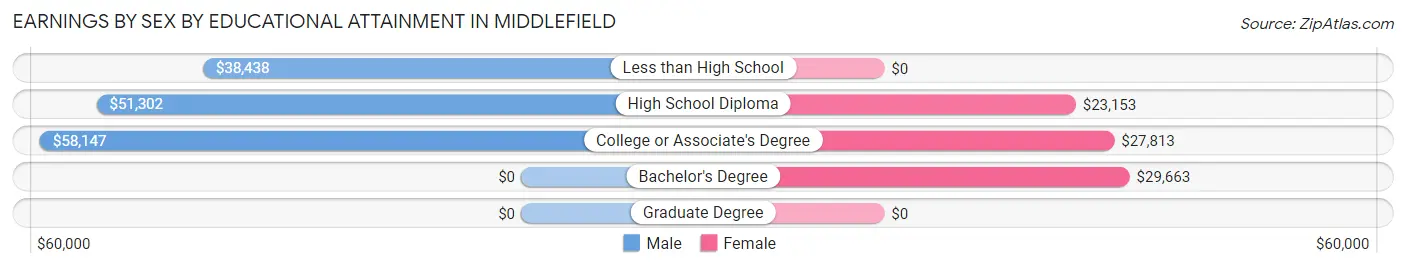
Earnings by Sex by Educational Attainment in Middlefield
Average earnings in Middlefield are $55,066 for men and $24,678 for women, a difference of 55.2%. Men with an educational attainment of college or associate's degree enjoy the highest average annual earnings of $58,147, while those with less than high school education earn the least with $38,438. Women with an educational attainment of bachelor's degree earn the most with the average annual earnings of $29,663, while those with high school diploma education have the smallest earnings of $23,153.
| Educational Attainment | Male Income | Female Income |
| Less than High School | $38,438 | $0 |
| High School Diploma | $51,302 | $23,153 |
| College or Associate's Degree | $58,147 | $27,813 |
| Bachelor's Degree | - | - |
| Graduate Degree | - | - |
| Total | $55,066 | $24,678 |
Family Income in Middlefield
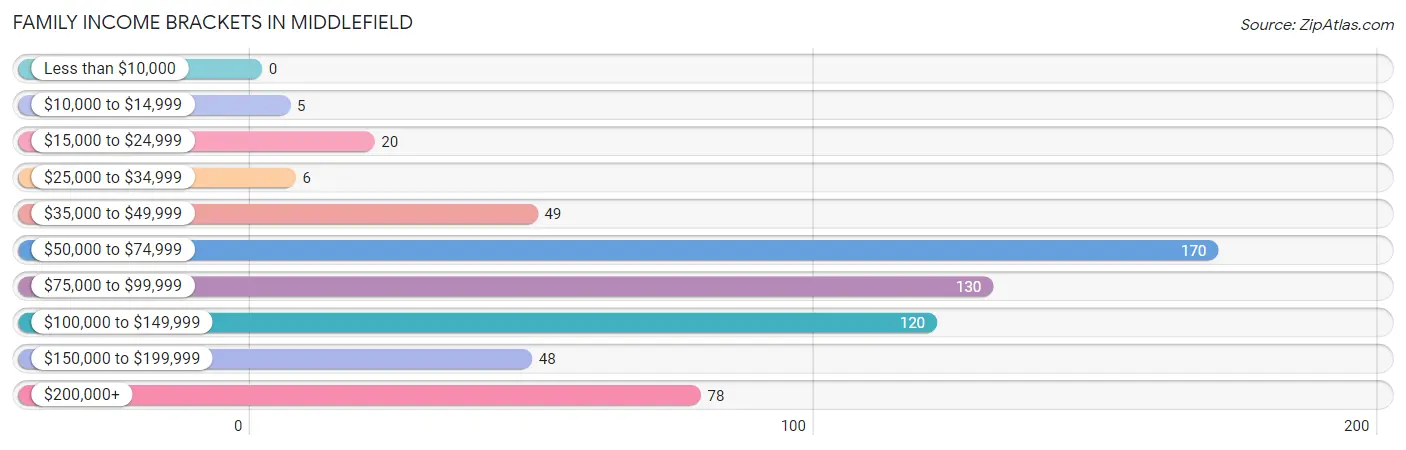
Family Income Brackets in Middlefield
According to the Middlefield family income data, there are 170 families falling into the $50,000 to $74,999 income range, which is the most common income bracket and makes up 27.2% of all families.
| Income Bracket | # Families | % Families |
| Less than $10,000 | 0 | 0.0% |
| $10,000 to $14,999 | 5 | 0.8% |
| $15,000 to $24,999 | 20 | 3.2% |
| $25,000 to $34,999 | 6 | 1.0% |
| $35,000 to $49,999 | 49 | 7.8% |
| $50,000 to $74,999 | 170 | 27.2% |
| $75,000 to $99,999 | 130 | 20.8% |
| $100,000 to $149,999 | 120 | 19.2% |
| $150,000 to $199,999 | 48 | 7.7% |
| $200,000+ | 78 | 12.5% |
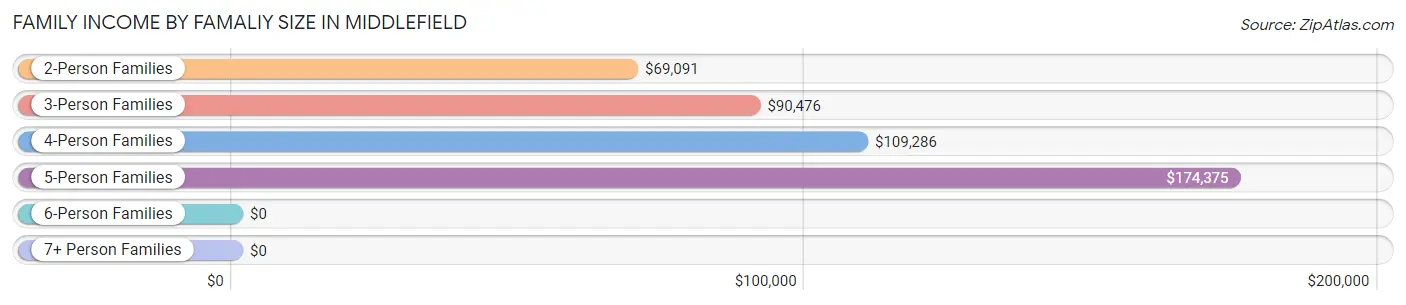
Family Income by Famaliy Size in Middlefield
5-person families (117 | 18.7%) account for the highest median family income in Middlefield with $174,375 per family, while 5-person families (117 | 18.7%) have the highest median income of $34,875 per family member.
| Income Bracket | # Families | Median Income |
| 2-Person Families | 308 (49.2%) | $69,091 |
| 3-Person Families | 112 (17.9%) | $90,476 |
| 4-Person Families | 74 (11.8%) | $109,286 |
| 5-Person Families | 117 (18.7%) | $174,375 |
| 6-Person Families | 15 (2.4%) | $0 |
| 7+ Person Families | 0 (0.0%) | $0 |
| Total | 626 (100.0%) | $90,349 |
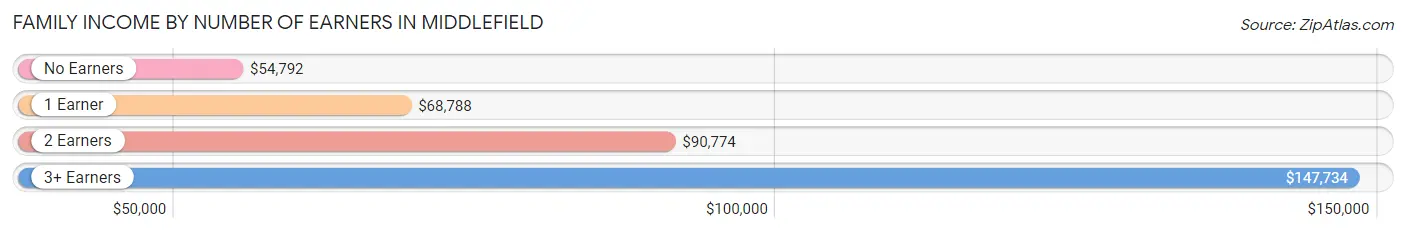
Family Income by Number of Earners in Middlefield
The median family income in Middlefield is $90,349, with families comprising 3+ earners (184) having the highest median family income of $147,734, while families with no earners (51) have the lowest median family income of $54,792, accounting for 29.4% and 8.2% of families, respectively.
| Number of Earners | # Families | Median Income |
| No Earners | 51 (8.2%) | $54,792 |
| 1 Earner | 198 (31.6%) | $68,788 |
| 2 Earners | 193 (30.8%) | $90,774 |
| 3+ Earners | 184 (29.4%) | $147,734 |
| Total | 626 (100.0%) | $90,349 |
Household Income in Middlefield
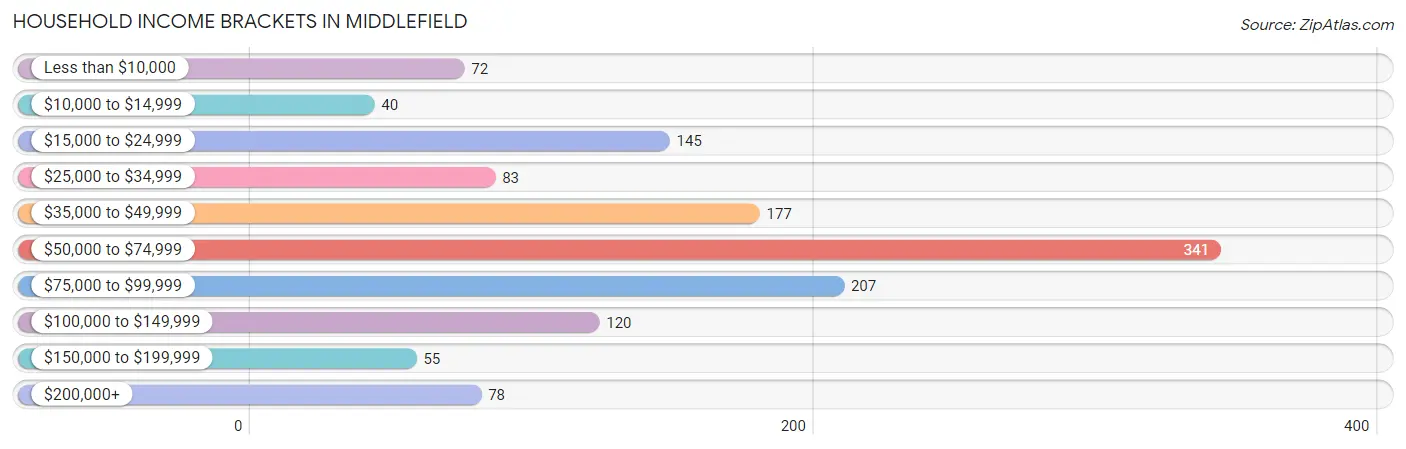
Household Income Brackets in Middlefield
With 341 households falling in the category, the $50,000 to $74,999 income range is the most frequent in Middlefield, accounting for 25.9% of all households. In contrast, only 40 households (3.0%) fall into the $10,000 to $14,999 income bracket, making it the least populous group.
| Income Bracket | # Households | % Households |
| Less than $10,000 | 72 | 5.5% |
| $10,000 to $14,999 | 40 | 3.0% |
| $15,000 to $24,999 | 145 | 11.0% |
| $25,000 to $34,999 | 83 | 6.3% |
| $35,000 to $49,999 | 177 | 13.4% |
| $50,000 to $74,999 | 341 | 25.9% |
| $75,000 to $99,999 | 207 | 15.7% |
| $100,000 to $149,999 | 120 | 9.1% |
| $150,000 to $199,999 | 55 | 4.2% |
| $200,000+ | 78 | 5.9% |
Household Income by Householder Age in Middlefield
The median household income in Middlefield is $62,392, with the highest median household income of $90,122 found in the 25 to 44 years age bracket for the primary householder. A total of 292 households (22.2%) fall into this category. Meanwhile, the 15 to 24 years age bracket for the primary householder has the lowest median household income of $0, with 20 households (1.5%) in this group.
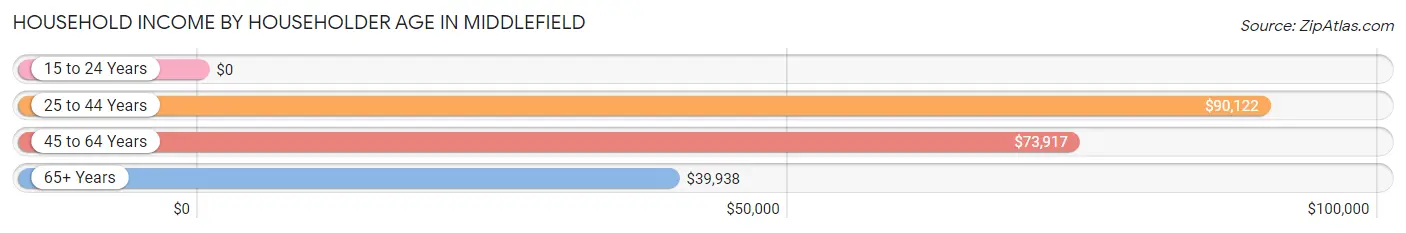
| Income Bracket | # Households | Median Income |
| 15 to 24 Years | 20 (1.5%) | $0 |
| 25 to 44 Years | 292 (22.2%) | $90,122 |
| 45 to 64 Years | 407 (30.9%) | $73,917 |
| 65+ Years | 599 (45.5%) | $39,938 |
| Total | 1,318 (100.0%) | $62,392 |
Poverty in Middlefield
Income Below Poverty by Sex and Age in Middlefield
With 6.9% poverty level for males and 8.0% for females among the residents of Middlefield, 6 to 11 year old males and 35 to 44 year old females are the most vulnerable to poverty, with 7 males (15.6%) and 34 females (19.1%) in their respective age groups living below the poverty level.
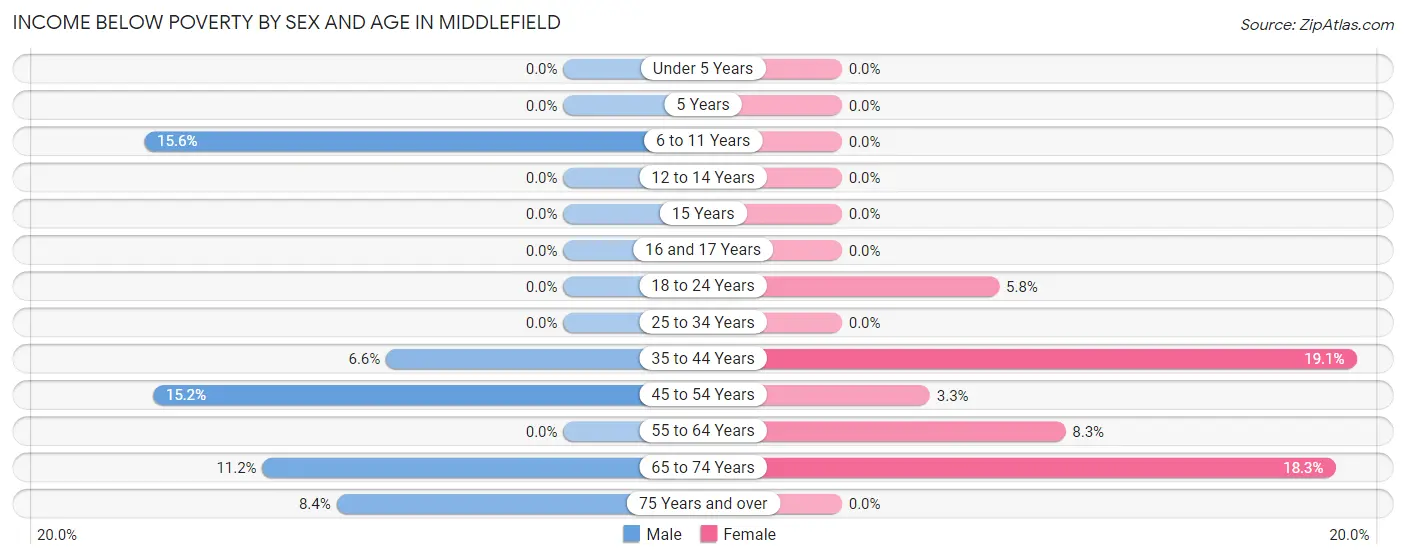
| Age Bracket | Male | Female |
| Under 5 Years | 0 (0.0%) | 0 (0.0%) |
| 5 Years | 0 (0.0%) | 0 (0.0%) |
| 6 to 11 Years | 7 (15.6%) | 0 (0.0%) |
| 12 to 14 Years | 0 (0.0%) | 0 (0.0%) |
| 15 Years | 0 (0.0%) | 0 (0.0%) |
| 16 and 17 Years | 0 (0.0%) | 0 (0.0%) |
| 18 to 24 Years | 0 (0.0%) | 15 (5.8%) |
| 25 to 34 Years | 0 (0.0%) | 0 (0.0%) |
| 35 to 44 Years | 10 (6.6%) | 34 (19.1%) |
| 45 to 54 Years | 32 (15.2%) | 5 (3.3%) |
| 55 to 64 Years | 0 (0.0%) | 19 (8.3%) |
| 65 to 74 Years | 20 (11.2%) | 50 (18.3%) |
| 75 Years and over | 8 (8.4%) | 0 (0.0%) |
| Total | 77 (6.9%) | 123 (8.0%) |
Income Above Poverty by Sex and Age in Middlefield
According to the poverty statistics in Middlefield, males aged under 5 years and females aged under 5 years are the age groups that are most secure financially, with 100.0% of males and 100.0% of females in these age groups living above the poverty line.
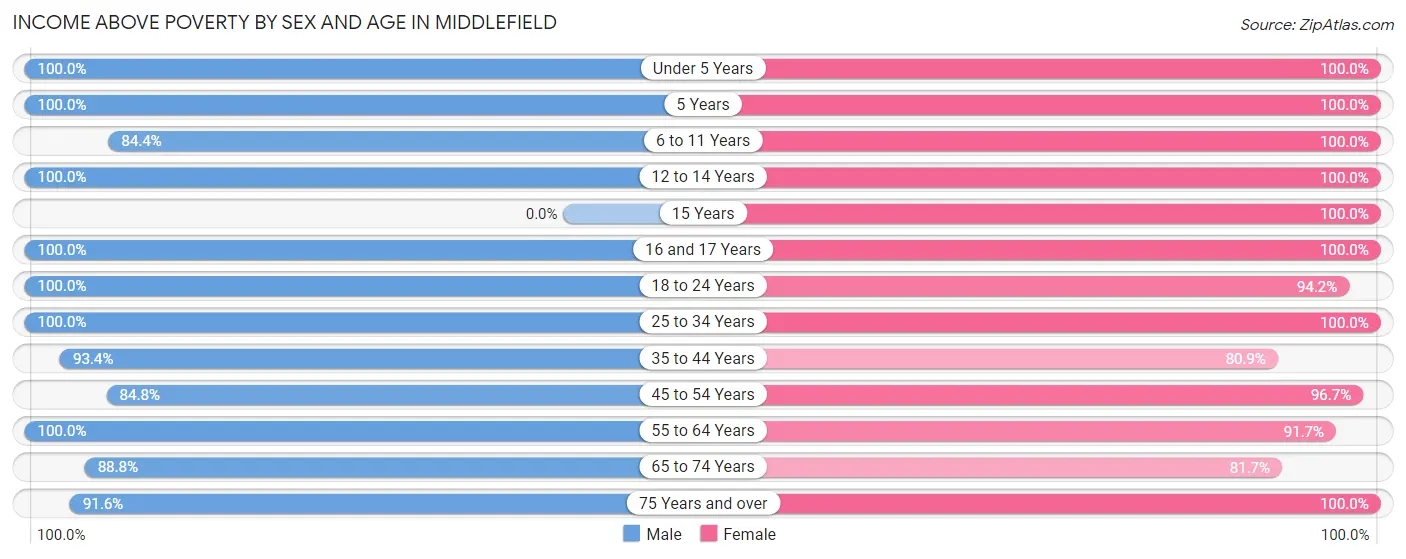
| Age Bracket | Male | Female |
| Under 5 Years | 27 (100.0%) | 32 (100.0%) |
| 5 Years | 5 (100.0%) | 32 (100.0%) |
| 6 to 11 Years | 38 (84.4%) | 49 (100.0%) |
| 12 to 14 Years | 34 (100.0%) | 8 (100.0%) |
| 15 Years | 0 (0.0%) | 20 (100.0%) |
| 16 and 17 Years | 21 (100.0%) | 18 (100.0%) |
| 18 to 24 Years | 76 (100.0%) | 242 (94.2%) |
| 25 to 34 Years | 182 (100.0%) | 75 (100.0%) |
| 35 to 44 Years | 142 (93.4%) | 144 (80.9%) |
| 45 to 54 Years | 178 (84.8%) | 148 (96.7%) |
| 55 to 64 Years | 91 (100.0%) | 210 (91.7%) |
| 65 to 74 Years | 159 (88.8%) | 223 (81.7%) |
| 75 Years and over | 87 (91.6%) | 216 (100.0%) |
| Total | 1,040 (93.1%) | 1,417 (92.0%) |
Income Below Poverty Among Married-Couple Families in Middlefield
The poverty statistics for married-couple families in Middlefield show that 2.1% or 10 of the total 474 families live below the poverty line. Families with no children have the highest poverty rate of 3.0%, comprising of 10 families. On the other hand, families with 1 or 2 children have the lowest poverty rate of 0.0%, which includes 0 families.
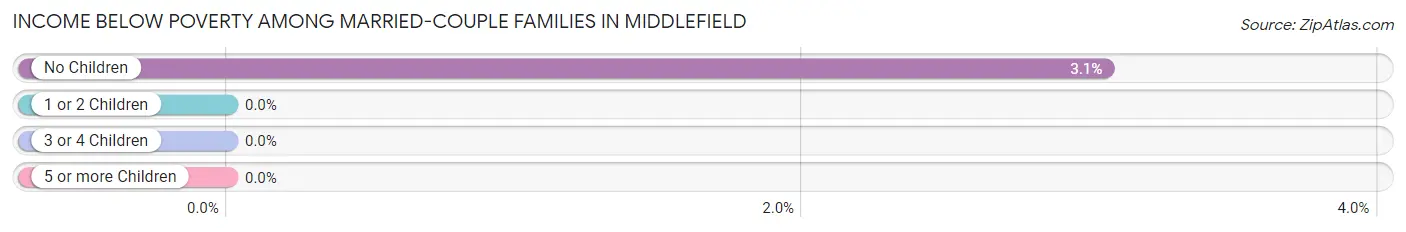
| Children | Above Poverty | Below Poverty |
| No Children | 318 (97.0%) | 10 (3.0%) |
| 1 or 2 Children | 137 (100.0%) | 0 (0.0%) |
| 3 or 4 Children | 9 (100.0%) | 0 (0.0%) |
| 5 or more Children | 0 (0.0%) | 0 (0.0%) |
| Total | 464 (97.9%) | 10 (2.1%) |
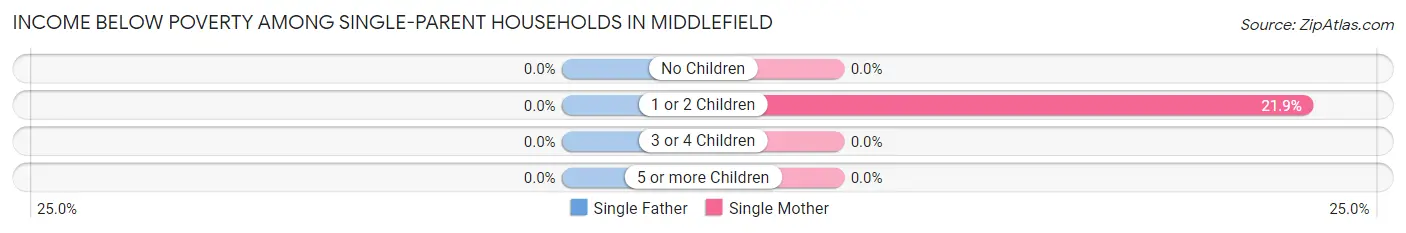
Income Below Poverty Among Single-Parent Households in Middlefield
| Children | Single Father | Single Mother |
| No Children | 0 (0.0%) | 0 (0.0%) |
| 1 or 2 Children | 0 (0.0%) | 7 (21.9%) |
| 3 or 4 Children | 0 (0.0%) | 0 (0.0%) |
| 5 or more Children | 0 (0.0%) | 0 (0.0%) |
| Total | 0 (0.0%) | 7 (5.8%) |
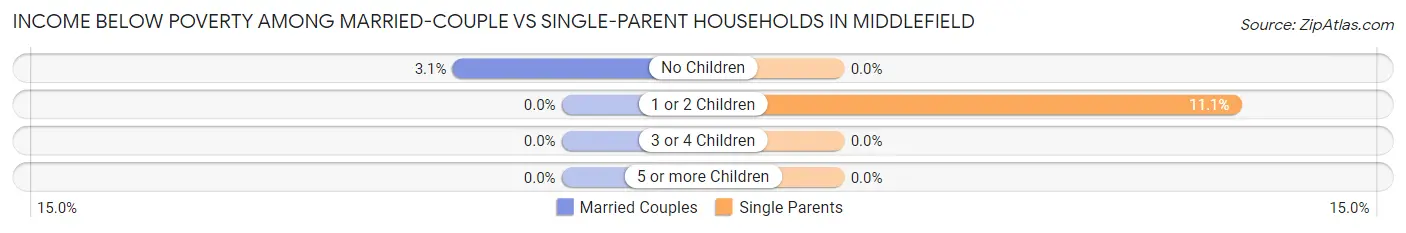
Income Below Poverty Among Married-Couple vs Single-Parent Households in Middlefield
The poverty data for Middlefield shows that 10 of the married-couple family households (2.1%) and 7 of the single-parent households (4.6%) are living below the poverty level. Within the married-couple family households, those with no children have the highest poverty rate, with 10 households (3.0%) falling below the poverty line. Among the single-parent households, those with 1 or 2 children have the highest poverty rate, with 7 household (11.1%) living below poverty.
| Children | Married-Couple Families | Single-Parent Households |
| No Children | 10 (3.0%) | 0 (0.0%) |
| 1 or 2 Children | 0 (0.0%) | 7 (11.1%) |
| 3 or 4 Children | 0 (0.0%) | 0 (0.0%) |
| 5 or more Children | 0 (0.0%) | 0 (0.0%) |
| Total | 10 (2.1%) | 7 (4.6%) |
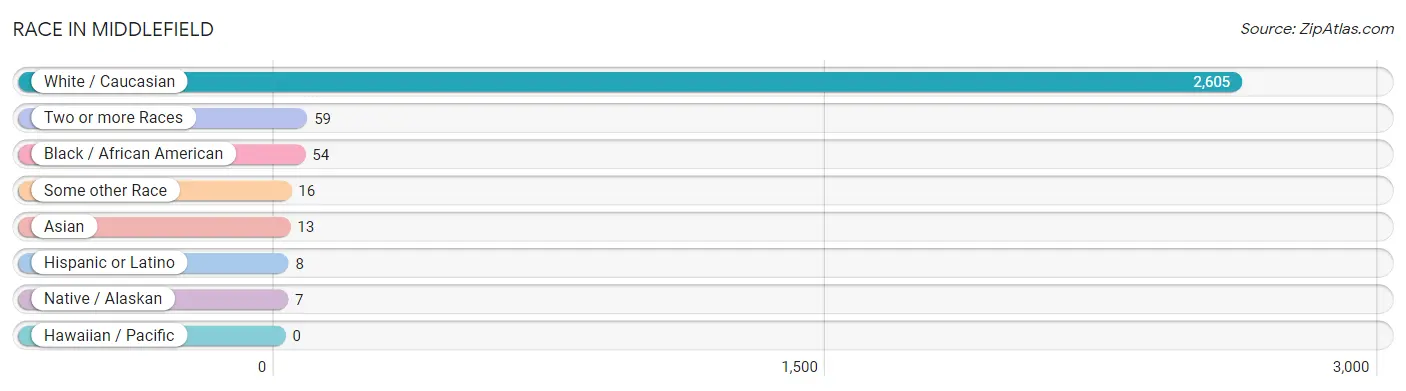
Race in Middlefield
The most populous races in Middlefield are White / Caucasian (2,605 | 94.6%), Two or more Races (59 | 2.1%), and Black / African American (54 | 2.0%).
| Race | # Population | % Population |
| Asian | 13 | 0.5% |
| Black / African American | 54 | 2.0% |
| Hawaiian / Pacific | 0 | 0.0% |
| Hispanic or Latino | 8 | 0.3% |
| Native / Alaskan | 7 | 0.3% |
| White / Caucasian | 2,605 | 94.6% |
| Two or more Races | 59 | 2.1% |
| Some other Race | 16 | 0.6% |
| Total | 2,754 | 100.0% |
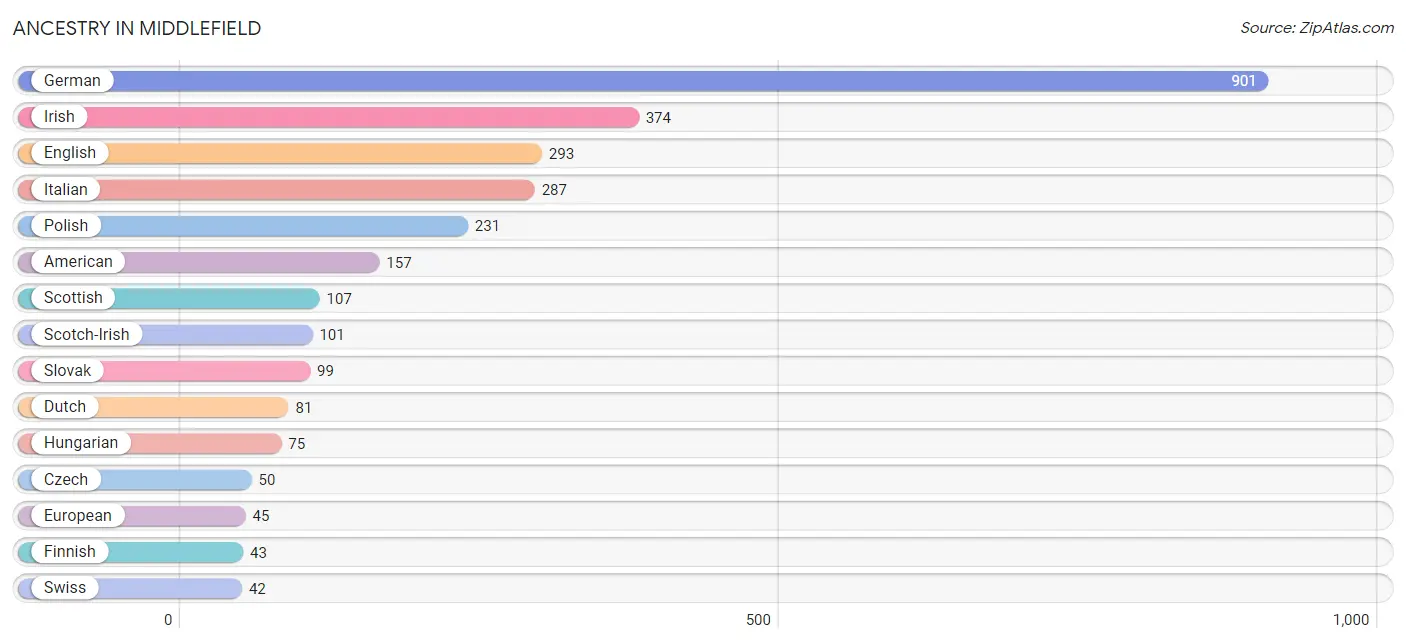
Ancestry in Middlefield
The most populous ancestries reported in Middlefield are German (901 | 32.7%), Irish (374 | 13.6%), English (293 | 10.6%), Italian (287 | 10.4%), and Polish (231 | 8.4%), together accounting for 75.7% of all Middlefield residents.
| Ancestry | # Population | % Population |
| American | 157 | 5.7% |
| Burmese | 1 | 0.0% |
| Central American Indian | 7 | 0.3% |
| Czech | 50 | 1.8% |
| Czechoslovakian | 6 | 0.2% |
| Dutch | 81 | 2.9% |
| Eastern European | 9 | 0.3% |
| Ecuadorian | 1 | 0.0% |
| English | 293 | 10.6% |
| European | 45 | 1.6% |
| Finnish | 43 | 1.6% |
| French | 30 | 1.1% |
| French Canadian | 7 | 0.3% |
| German | 901 | 32.7% |
| Greek | 6 | 0.2% |
| Hungarian | 75 | 2.7% |
| Indian (Asian) | 1 | 0.0% |
| Irish | 374 | 13.6% |
| Italian | 287 | 10.4% |
| Lithuanian | 6 | 0.2% |
| Pennsylvania German | 20 | 0.7% |
| Polish | 231 | 8.4% |
| Puerto Rican | 7 | 0.3% |
| Russian | 18 | 0.6% |
| Scotch-Irish | 101 | 3.7% |
| Scottish | 107 | 3.9% |
| Sioux | 4 | 0.2% |
| Slovak | 99 | 3.6% |
| Slovene | 27 | 1.0% |
| South American | 1 | 0.0% |
| Swedish | 5 | 0.2% |
| Swiss | 42 | 1.5% |
| Thai | 40 | 1.5% |
| Ukrainian | 16 | 0.6% |
| Welsh | 16 | 0.6% | View All 35 Rows |
Immigrants in Middlefield
The most numerous immigrant groups reported in Middlefield came from Europe (34 | 1.2%), Germany (20 | 0.7%), Western Europe (20 | 0.7%), Canada (17 | 0.6%), and Belarus (7 | 0.3%), together accounting for 3.6% of all Middlefield residents.
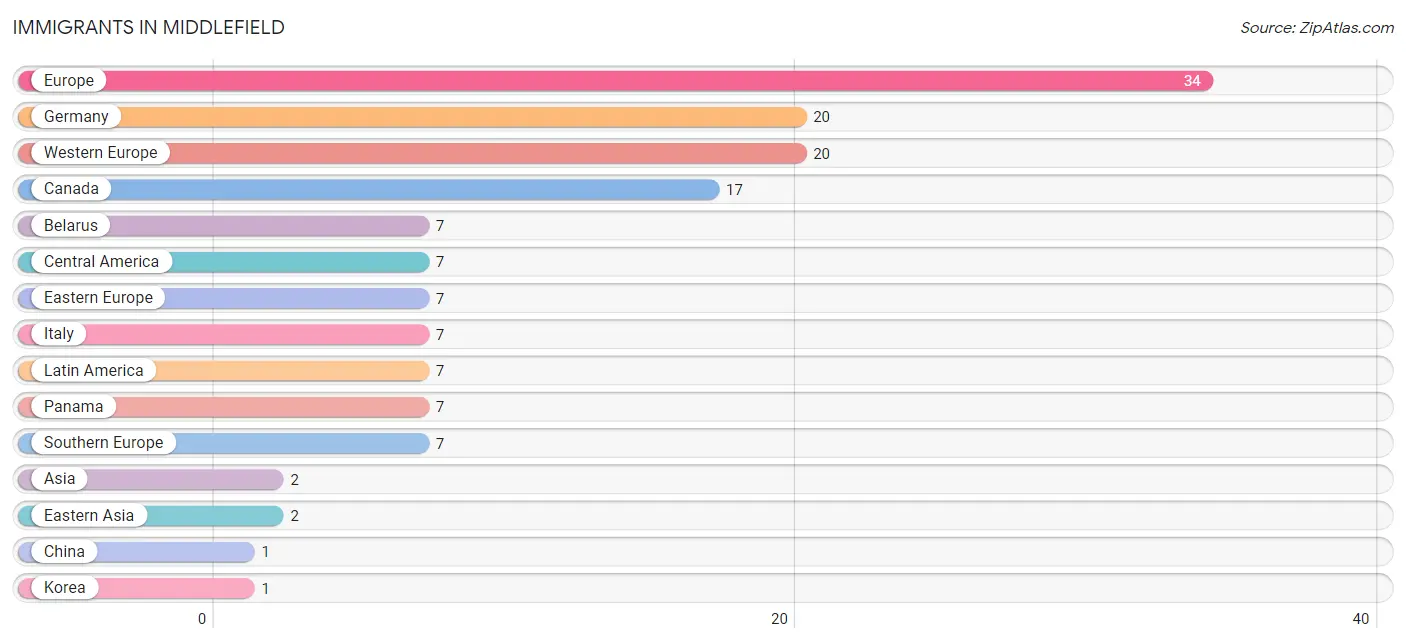
| Immigration Origin | # Population | % Population |
| Asia | 2 | 0.1% |
| Belarus | 7 | 0.3% |
| Canada | 17 | 0.6% |
| Central America | 7 | 0.3% |
| China | 1 | 0.0% |
| Eastern Asia | 2 | 0.1% |
| Eastern Europe | 7 | 0.3% |
| Europe | 34 | 1.2% |
| Germany | 20 | 0.7% |
| Italy | 7 | 0.3% |
| Korea | 1 | 0.0% |
| Latin America | 7 | 0.3% |
| Panama | 7 | 0.3% |
| Southern Europe | 7 | 0.3% |
| Western Europe | 20 | 0.7% | View All 15 Rows |
Sex and Age in Middlefield
Sex and Age in Middlefield
The most populous age groups in Middlefield are 45 to 49 Years (152 | 13.4%) for men and 20 to 24 Years (192 | 11.9%) for women.
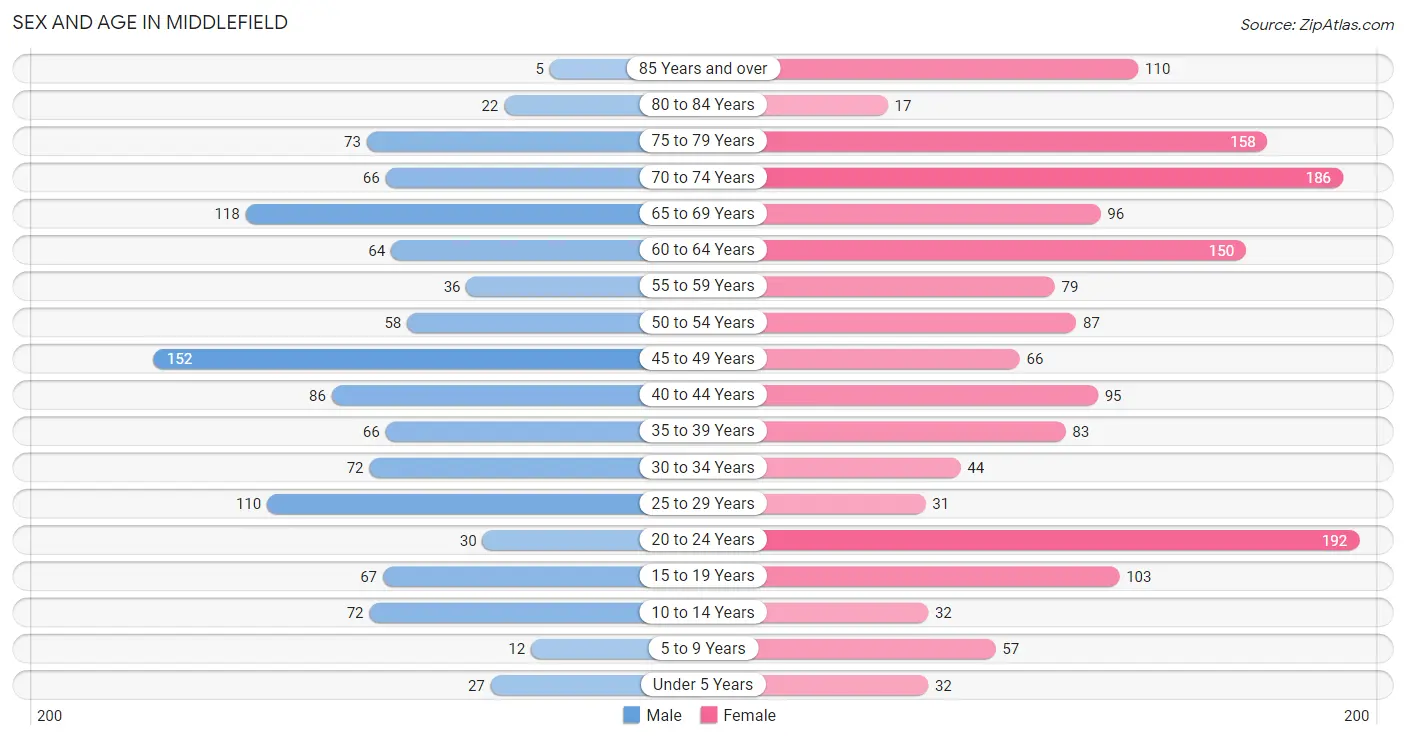
| Age Bracket | Male | Female |
| Under 5 Years | 27 (2.4%) | 32 (2.0%) |
| 5 to 9 Years | 12 (1.1%) | 57 (3.5%) |
| 10 to 14 Years | 72 (6.3%) | 32 (2.0%) |
| 15 to 19 Years | 67 (5.9%) | 103 (6.4%) |
| 20 to 24 Years | 30 (2.6%) | 192 (11.9%) |
| 25 to 29 Years | 110 (9.7%) | 31 (1.9%) |
| 30 to 34 Years | 72 (6.3%) | 44 (2.7%) |
| 35 to 39 Years | 66 (5.8%) | 83 (5.1%) |
| 40 to 44 Years | 86 (7.6%) | 95 (5.9%) |
| 45 to 49 Years | 152 (13.4%) | 66 (4.1%) |
| 50 to 54 Years | 58 (5.1%) | 87 (5.4%) |
| 55 to 59 Years | 36 (3.2%) | 79 (4.9%) |
| 60 to 64 Years | 64 (5.6%) | 150 (9.3%) |
| 65 to 69 Years | 118 (10.4%) | 96 (5.9%) |
| 70 to 74 Years | 66 (5.8%) | 186 (11.5%) |
| 75 to 79 Years | 73 (6.4%) | 158 (9.8%) |
| 80 to 84 Years | 22 (1.9%) | 17 (1.1%) |
| 85 Years and over | 5 (0.4%) | 110 (6.8%) |
| Total | 1,136 (100.0%) | 1,618 (100.0%) |
Families and Households in Middlefield
Median Family Size in Middlefield
The median family size in Middlefield is 2.98 persons per family, with single male/father families (31 | 5.0%) accounting for the largest median family size of 4.71 persons per family. On the other hand, single female/mother families (121 | 19.3%) represent the smallest median family size with 2.34 persons per family.
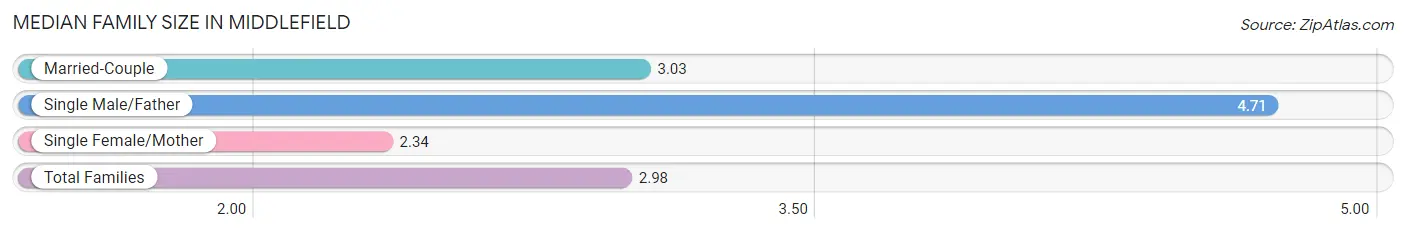
| Family Type | # Families | Family Size |
| Married-Couple | 474 (75.7%) | 3.03 |
| Single Male/Father | 31 (5.0%) | 4.71 |
| Single Female/Mother | 121 (19.3%) | 2.34 |
| Total Families | 626 (100.0%) | 2.98 |
Median Household Size in Middlefield
The median household size in Middlefield is 2.02 persons per household, with single male/father households (31 | 2.4%) accounting for the largest median household size of 5.48 persons per household. non-family households (692 | 52.5%) represent the smallest median household size with 1.11 persons per household.
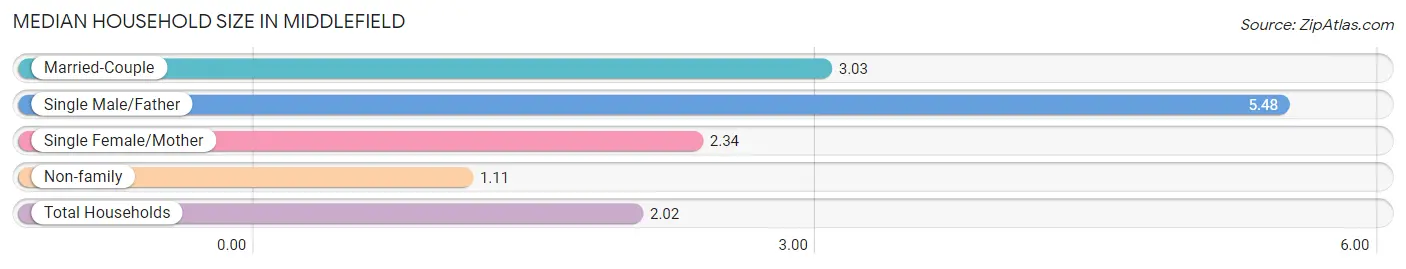
| Household Type | # Households | Household Size |
| Married-Couple | 474 (36.0%) | 3.03 |
| Single Male/Father | 31 (2.4%) | 5.48 |
| Single Female/Mother | 121 (9.2%) | 2.34 |
| Non-family | 692 (52.5%) | 1.11 |
| Total Households | 1,318 (100.0%) | 2.02 |
Household Size by Marriage Status in Middlefield
Out of a total of 1,318 households in Middlefield, 626 (47.5%) are family households, while 692 (52.5%) are nonfamily households. The most numerous type of family households are 2-person households, comprising 308, and the most common type of nonfamily households are 1-person households, comprising 616.
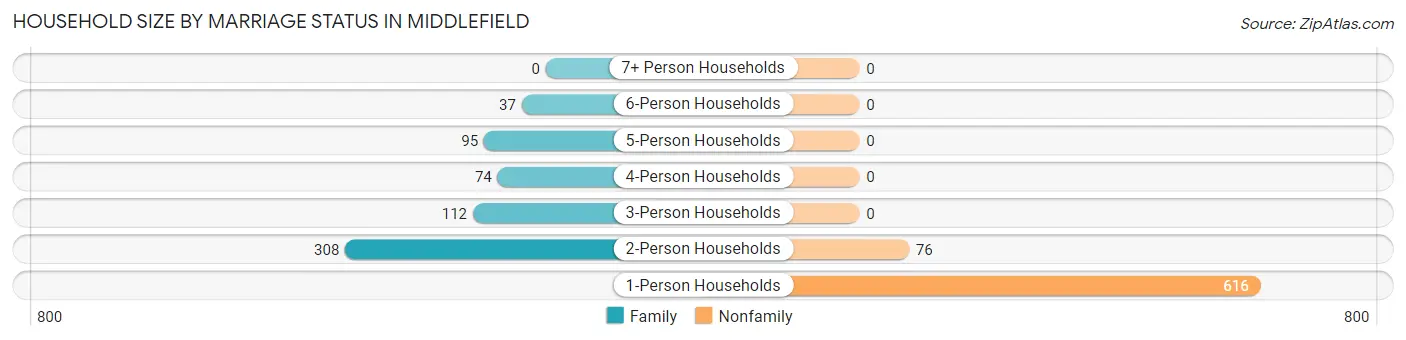
| Household Size | Family Households | Nonfamily Households |
| 1-Person Households | - | 616 (46.7%) |
| 2-Person Households | 308 (23.4%) | 76 (5.8%) |
| 3-Person Households | 112 (8.5%) | 0 (0.0%) |
| 4-Person Households | 74 (5.6%) | 0 (0.0%) |
| 5-Person Households | 95 (7.2%) | 0 (0.0%) |
| 6-Person Households | 37 (2.8%) | 0 (0.0%) |
| 7+ Person Households | 0 (0.0%) | 0 (0.0%) |
| Total | 626 (47.5%) | 692 (52.5%) |
Female Fertility in Middlefield
Fertility by Age in Middlefield
Average fertility rate in Middlefield is 21.0 births per 1,000 women. Women in the age bracket of 20 to 34 years have the highest fertility rate with 49.0 births per 1,000 women. Women in the age bracket of 20 to 34 years acount for 100.0% of all women with births.
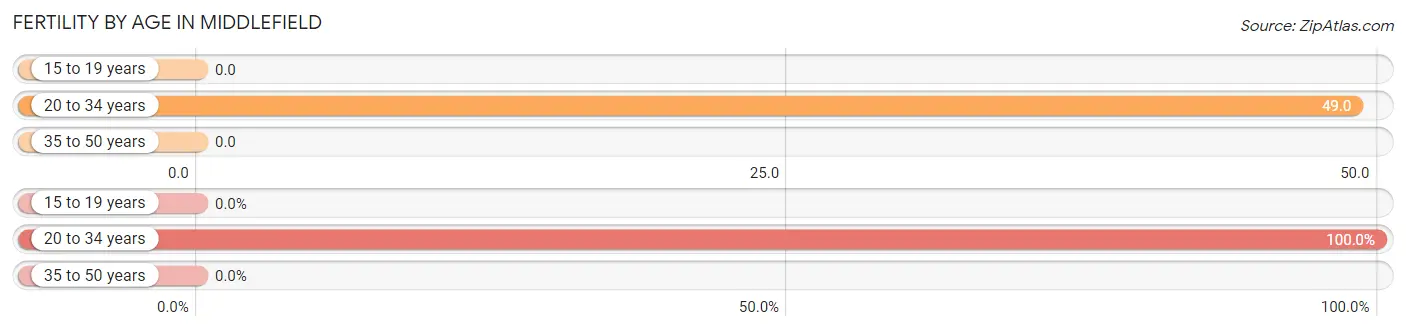
| Age Bracket | Women with Births | Births / 1,000 Women |
| 15 to 19 years | 0 (0.0%) | 0.0 |
| 20 to 34 years | 13 (100.0%) | 49.0 |
| 35 to 50 years | 0 (0.0%) | 0.0 |
| Total | 13 (100.0%) | 21.0 |
Fertility by Age by Marriage Status in Middlefield
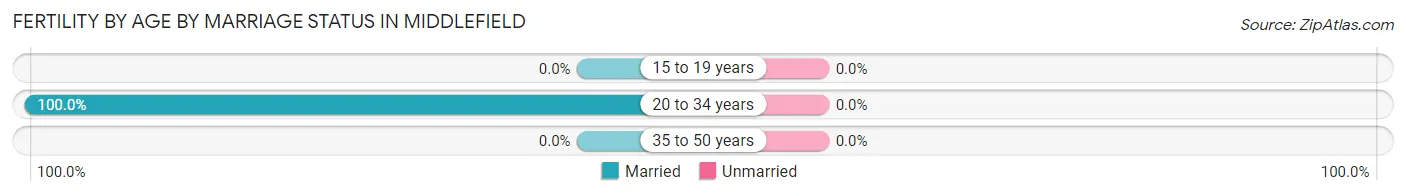
| Age Bracket | Married | Unmarried |
| 15 to 19 years | 0 (0.0%) | 0 (0.0%) |
| 20 to 34 years | 13 (100.0%) | 0 (0.0%) |
| 35 to 50 years | 0 (0.0%) | 0 (0.0%) |
| Total | 13 (100.0%) | 0 (0.0%) |
Fertility by Education in Middlefield
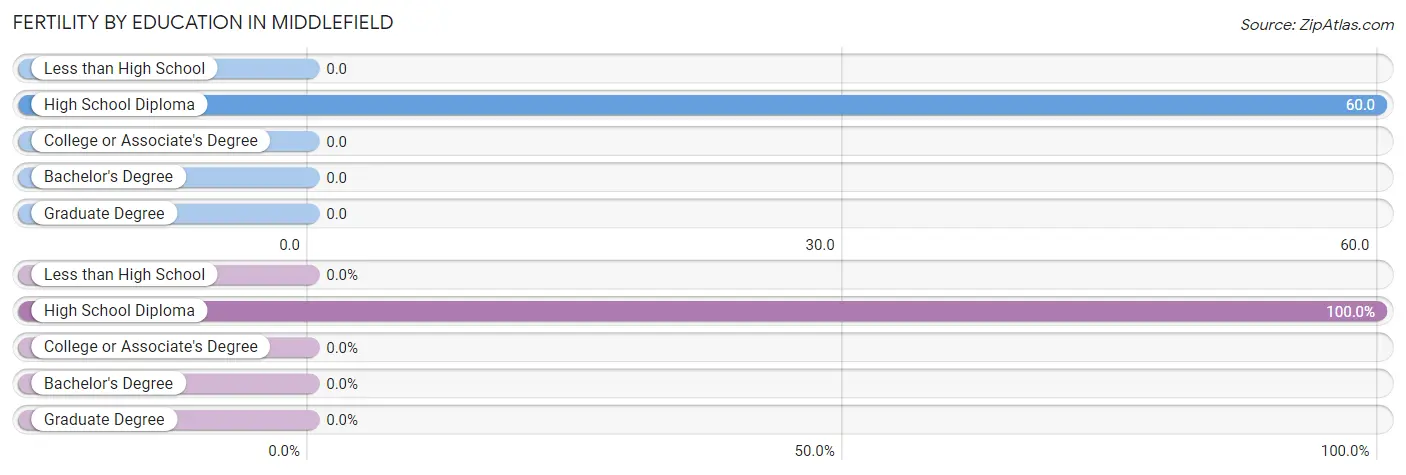
| Educational Attainment | Women with Births | Births / 1,000 Women |
| Less than High School | 0 (0.0%) | 0.0 |
| High School Diploma | 13 (100.0%) | 60.0 |
| College or Associate's Degree | 0 (0.0%) | 0.0 |
| Bachelor's Degree | 0 (0.0%) | 0.0 |
| Graduate Degree | 0 (0.0%) | 0.0 |
| Total | 13 (100.0%) | 21.0 |
Fertility by Education by Marriage Status in Middlefield
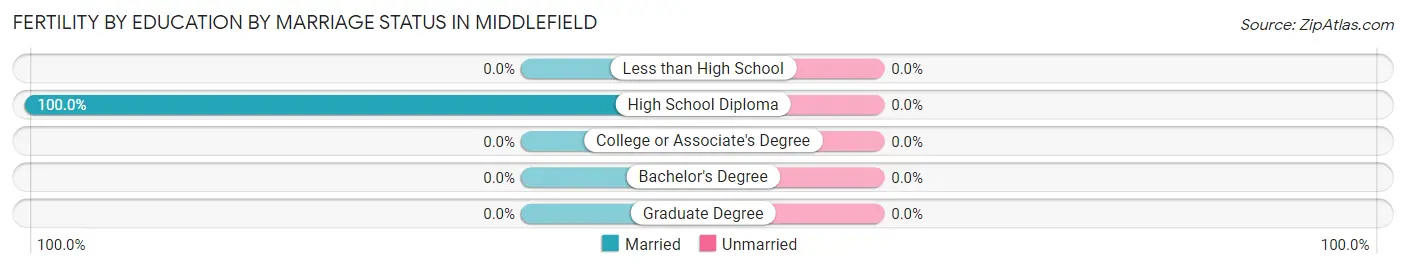
| Educational Attainment | Married | Unmarried |
| Less than High School | 0 (0.0%) | 0 (0.0%) |
| High School Diploma | 13 (100.0%) | 0 (0.0%) |
| College or Associate's Degree | 0 (0.0%) | 0 (0.0%) |
| Bachelor's Degree | 0 (0.0%) | 0 (0.0%) |
| Graduate Degree | 0 (0.0%) | 0 (0.0%) |
| Total | 13 (100.0%) | 0 (0.0%) |
Employment Characteristics in Middlefield
Employment by Class of Employer in Middlefield
Among the 1,456 employed individuals in Middlefield, private company employees (1,103 | 75.8%), not-for-profit organizations (103 | 7.1%), and state government employees (84 | 5.8%) make up the most common classes of employment.
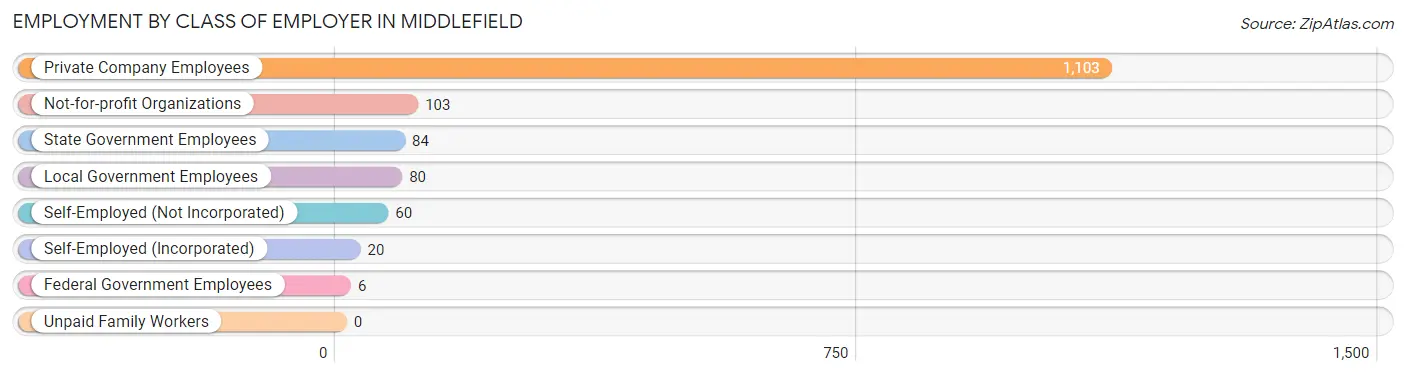
| Employer Class | # Employees | % Employees |
| Private Company Employees | 1,103 | 75.8% |
| Self-Employed (Incorporated) | 20 | 1.4% |
| Self-Employed (Not Incorporated) | 60 | 4.1% |
| Not-for-profit Organizations | 103 | 7.1% |
| Local Government Employees | 80 | 5.5% |
| State Government Employees | 84 | 5.8% |
| Federal Government Employees | 6 | 0.4% |
| Unpaid Family Workers | 0 | 0.0% |
| Total | 1,456 | 100.0% |
Employment Status by Age in Middlefield
According to the labor force statistics for Middlefield, out of the total population over 16 years of age (2,502), 66.0% or 1,651 individuals are in the labor force, with 10.9% or 180 of them unemployed. The age group with the highest labor force participation rate is 30 to 34 years, with 100.0% or 116 individuals in the labor force. Within the labor force, the 20 to 24 years age range has the highest percentage of unemployed individuals, with 42.5% or 82 of them being unemployed.
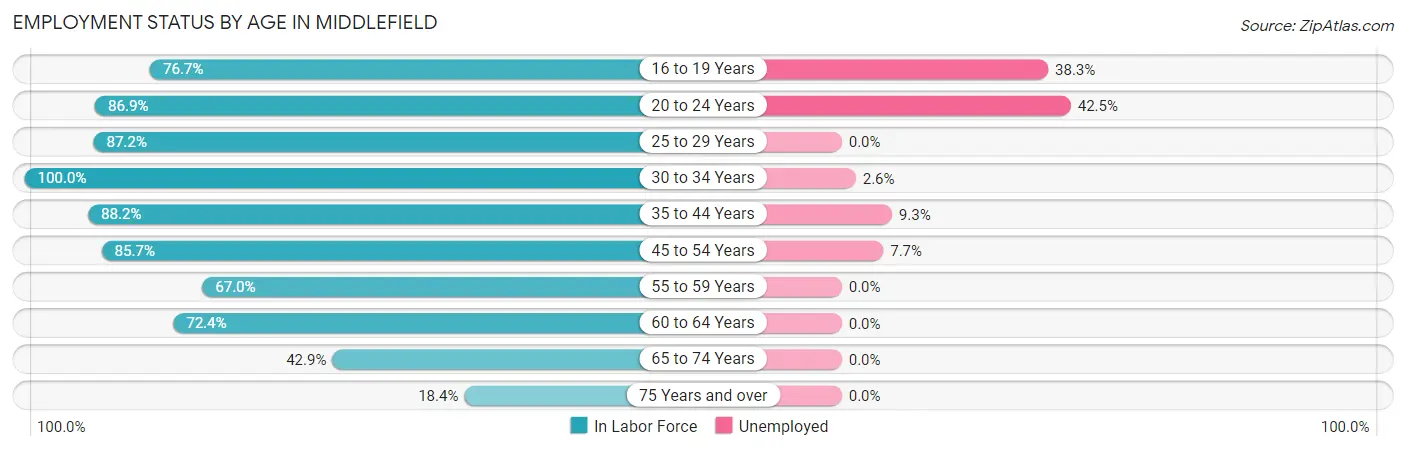
| Age Bracket | In Labor Force | Unemployed |
| 16 to 19 Years | 115 (76.7%) | 44 (38.3%) |
| 20 to 24 Years | 193 (86.9%) | 82 (42.5%) |
| 25 to 29 Years | 123 (87.2%) | 0 (0.0%) |
| 30 to 34 Years | 116 (100.0%) | 3 (2.6%) |
| 35 to 44 Years | 291 (88.2%) | 27 (9.3%) |
| 45 to 54 Years | 311 (85.7%) | 24 (7.7%) |
| 55 to 59 Years | 77 (67.0%) | 0 (0.0%) |
| 60 to 64 Years | 155 (72.4%) | 0 (0.0%) |
| 65 to 74 Years | 200 (42.9%) | 0 (0.0%) |
| 75 Years and over | 71 (18.4%) | 0 (0.0%) |
| Total | 1,651 (66.0%) | 180 (10.9%) |
Employment Status by Educational Attainment in Middlefield
According to labor force statistics for Middlefield, 83.9% of individuals (1,073) out of the total population between 25 and 64 years of age (1,279) are in the labor force, with 5.0% or 54 of them being unemployed. The group with the highest labor force participation rate are those with the educational attainment of high school diploma, with 94.6% or 335 individuals in the labor force. Within the labor force, individuals with less than high school education have the highest percentage of unemployment, with 13.2% or 10 of them being unemployed.
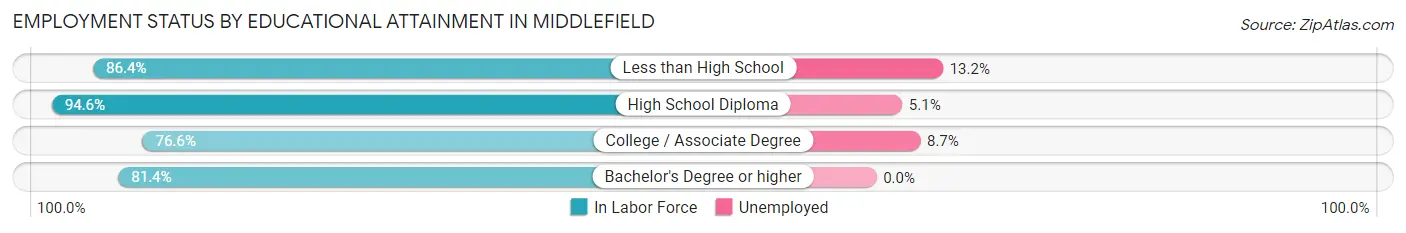
| Educational Attainment | In Labor Force | Unemployed |
| Less than High School | 76 (86.4%) | 12 (13.2%) |
| High School Diploma | 335 (94.6%) | 18 (5.1%) |
| College / Associate Degree | 311 (76.6%) | 35 (8.7%) |
| Bachelor's Degree or higher | 351 (81.4%) | 0 (0.0%) |
| Total | 1,073 (83.9%) | 64 (5.0%) |
Employment Occupations by Sex in Middlefield
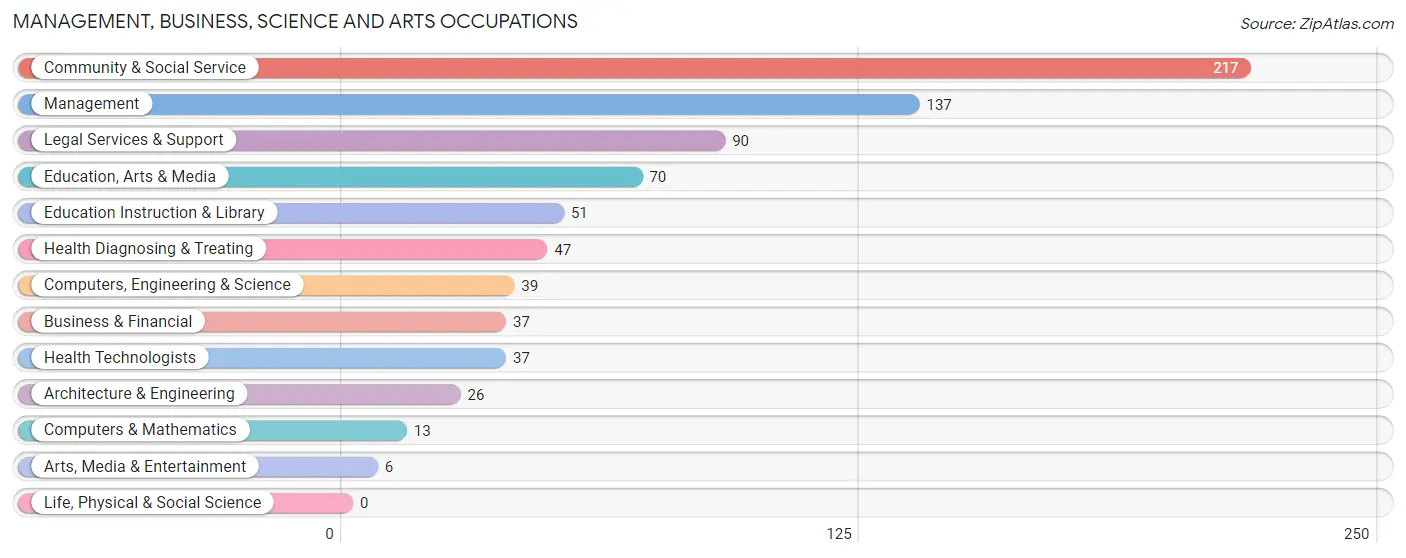
Management, Business, Science and Arts Occupations
The most common Management, Business, Science and Arts occupations in Middlefield are Community & Social Service (217 | 14.7%), Management (137 | 9.3%), Legal Services & Support (90 | 6.1%), Education, Arts & Media (70 | 4.8%), and Education Instruction & Library (51 | 3.5%).
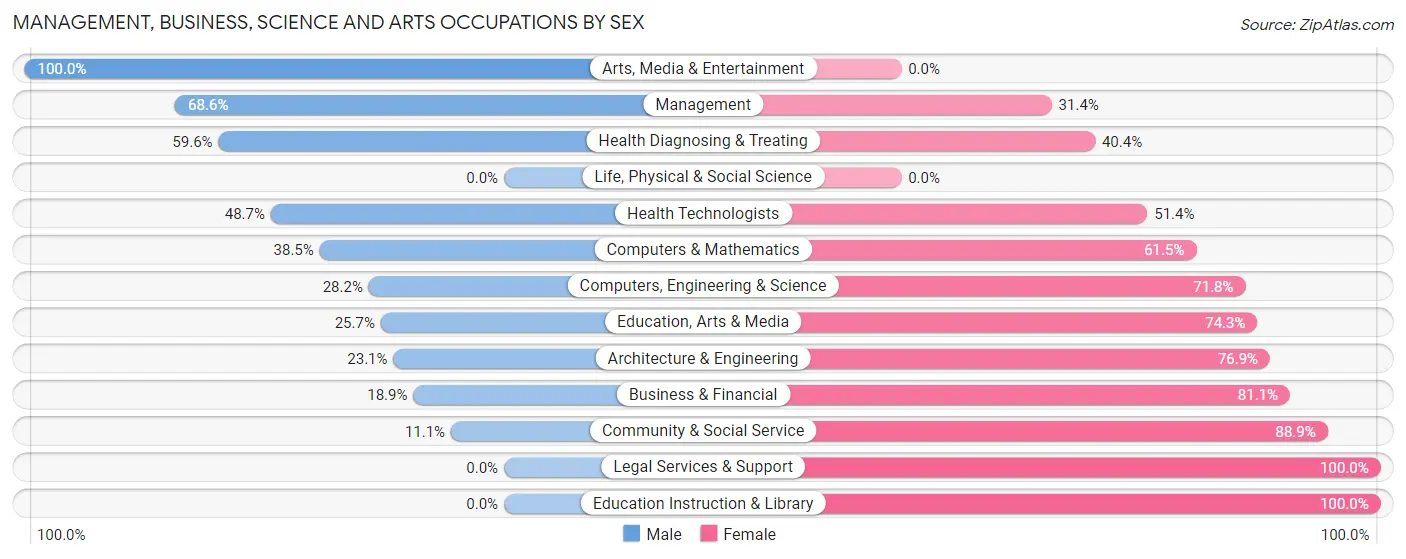
Management, Business, Science and Arts Occupations by Sex
Within the Management, Business, Science and Arts occupations in Middlefield, the most male-oriented occupations are Arts, Media & Entertainment (100.0%), Management (68.6%), and Health Diagnosing & Treating (59.6%), while the most female-oriented occupations are Legal Services & Support (100.0%), Education Instruction & Library (100.0%), and Community & Social Service (88.9%).
| Occupation | Male | Female |
| Management | 94 (68.6%) | 43 (31.4%) |
| Business & Financial | 7 (18.9%) | 30 (81.1%) |
| Computers, Engineering & Science | 11 (28.2%) | 28 (71.8%) |
| Computers & Mathematics | 5 (38.5%) | 8 (61.5%) |
| Architecture & Engineering | 6 (23.1%) | 20 (76.9%) |
| Life, Physical & Social Science | 0 (0.0%) | 0 (0.0%) |
| Community & Social Service | 24 (11.1%) | 193 (88.9%) |
| Education, Arts & Media | 18 (25.7%) | 52 (74.3%) |
| Legal Services & Support | 0 (0.0%) | 90 (100.0%) |
| Education Instruction & Library | 0 (0.0%) | 51 (100.0%) |
| Arts, Media & Entertainment | 6 (100.0%) | 0 (0.0%) |
| Health Diagnosing & Treating | 28 (59.6%) | 19 (40.4%) |
| Health Technologists | 18 (48.6%) | 19 (51.3%) |
| Total (Category) | 164 (34.4%) | 313 (65.6%) |
| Total (Overall) | 720 (48.9%) | 752 (51.1%) |
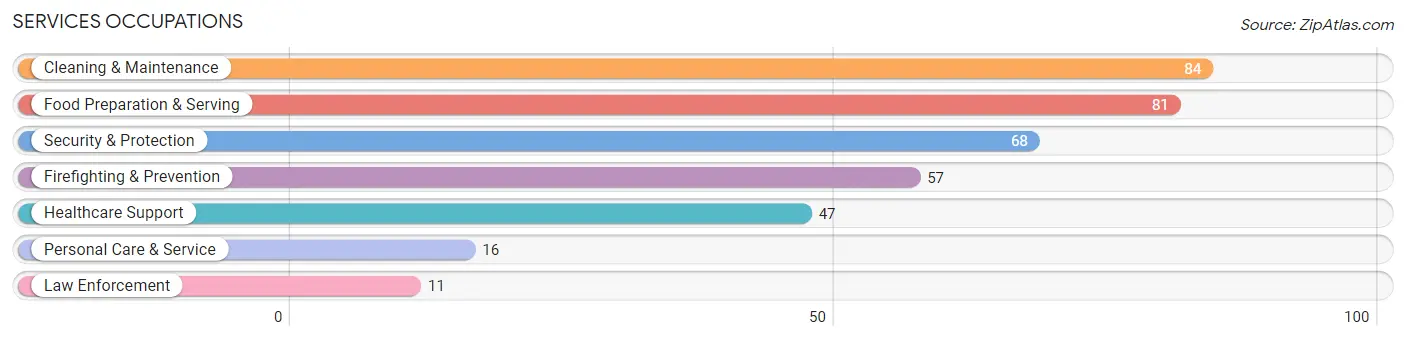
Services Occupations
The most common Services occupations in Middlefield are Cleaning & Maintenance (84 | 5.7%), Food Preparation & Serving (81 | 5.5%), Security & Protection (68 | 4.6%), Firefighting & Prevention (57 | 3.9%), and Healthcare Support (47 | 3.2%).
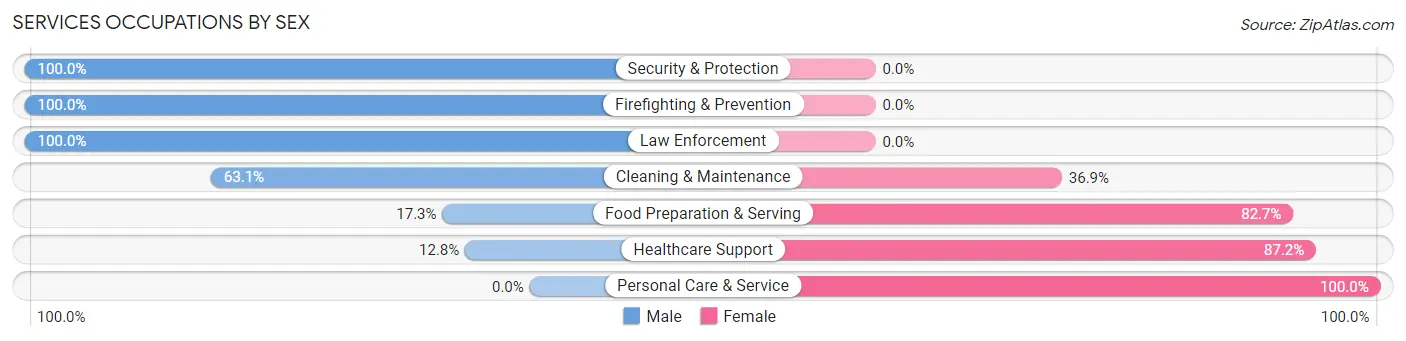
Services Occupations by Sex
Within the Services occupations in Middlefield, the most male-oriented occupations are Security & Protection (100.0%), Firefighting & Prevention (100.0%), and Law Enforcement (100.0%), while the most female-oriented occupations are Personal Care & Service (100.0%), Healthcare Support (87.2%), and Food Preparation & Serving (82.7%).
| Occupation | Male | Female |
| Healthcare Support | 6 (12.8%) | 41 (87.2%) |
| Security & Protection | 68 (100.0%) | 0 (0.0%) |
| Firefighting & Prevention | 57 (100.0%) | 0 (0.0%) |
| Law Enforcement | 11 (100.0%) | 0 (0.0%) |
| Food Preparation & Serving | 14 (17.3%) | 67 (82.7%) |
| Cleaning & Maintenance | 53 (63.1%) | 31 (36.9%) |
| Personal Care & Service | 0 (0.0%) | 16 (100.0%) |
| Total (Category) | 141 (47.6%) | 155 (52.4%) |
| Total (Overall) | 720 (48.9%) | 752 (51.1%) |
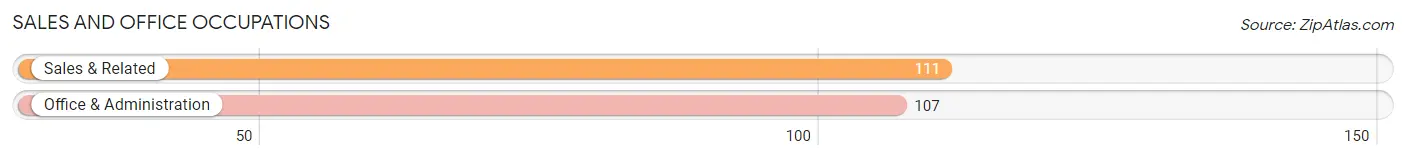
Sales and Office Occupations
The most common Sales and Office occupations in Middlefield are Sales & Related (111 | 7.5%), and Office & Administration (107 | 7.3%).
Sales and Office Occupations by Sex
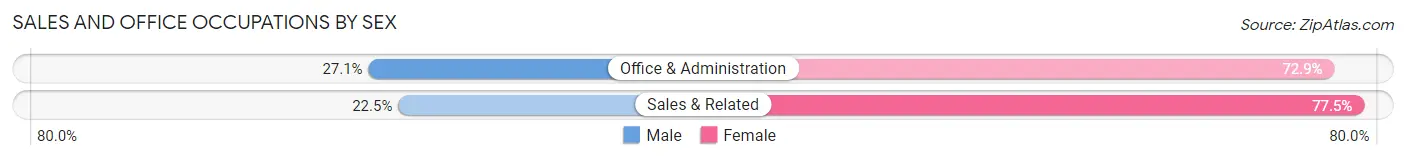
| Occupation | Male | Female |
| Sales & Related | 25 (22.5%) | 86 (77.5%) |
| Office & Administration | 29 (27.1%) | 78 (72.9%) |
| Total (Category) | 54 (24.8%) | 164 (75.2%) |
| Total (Overall) | 720 (48.9%) | 752 (51.1%) |
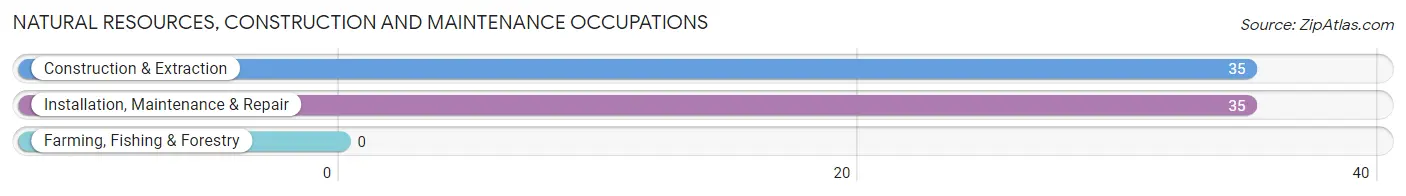
Natural Resources, Construction and Maintenance Occupations
The most common Natural Resources, Construction and Maintenance occupations in Middlefield are Construction & Extraction (35 | 2.4%), and Installation, Maintenance & Repair (35 | 2.4%).
Natural Resources, Construction and Maintenance Occupations by Sex
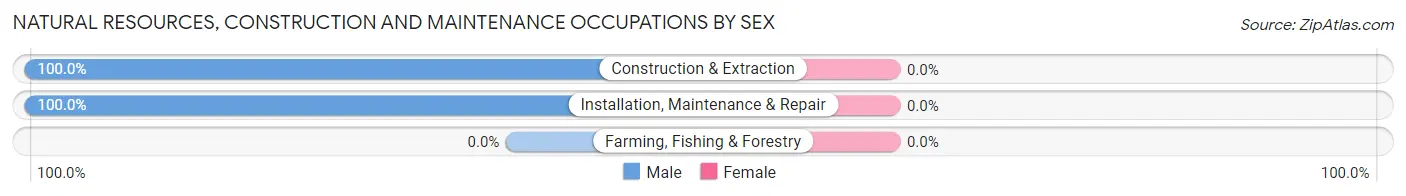
| Occupation | Male | Female |
| Farming, Fishing & Forestry | 0 (0.0%) | 0 (0.0%) |
| Construction & Extraction | 35 (100.0%) | 0 (0.0%) |
| Installation, Maintenance & Repair | 35 (100.0%) | 0 (0.0%) |
| Total (Category) | 70 (100.0%) | 0 (0.0%) |
| Total (Overall) | 720 (48.9%) | 752 (51.1%) |
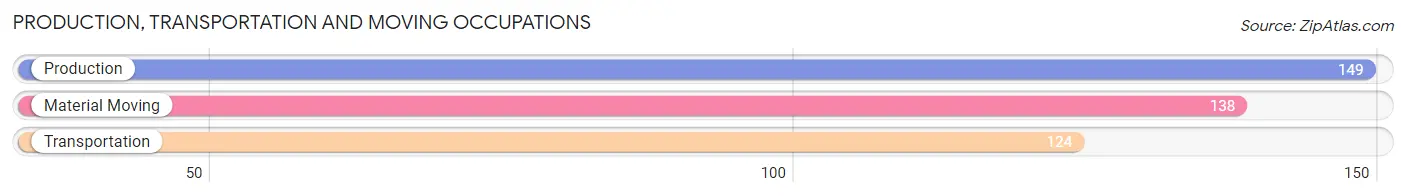
Production, Transportation and Moving Occupations
The most common Production, Transportation and Moving occupations in Middlefield are Production (149 | 10.1%), Material Moving (138 | 9.4%), and Transportation (124 | 8.4%).
Production, Transportation and Moving Occupations by Sex
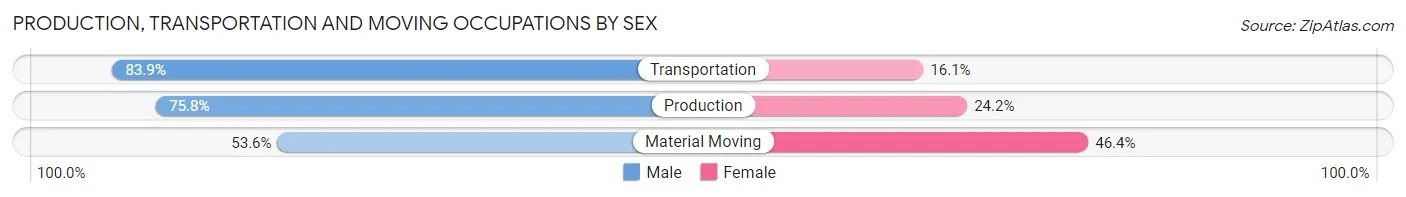
| Occupation | Male | Female |
| Production | 113 (75.8%) | 36 (24.2%) |
| Transportation | 104 (83.9%) | 20 (16.1%) |
| Material Moving | 74 (53.6%) | 64 (46.4%) |
| Total (Category) | 291 (70.8%) | 120 (29.2%) |
| Total (Overall) | 720 (48.9%) | 752 (51.1%) |
Employment Industries by Sex in Middlefield
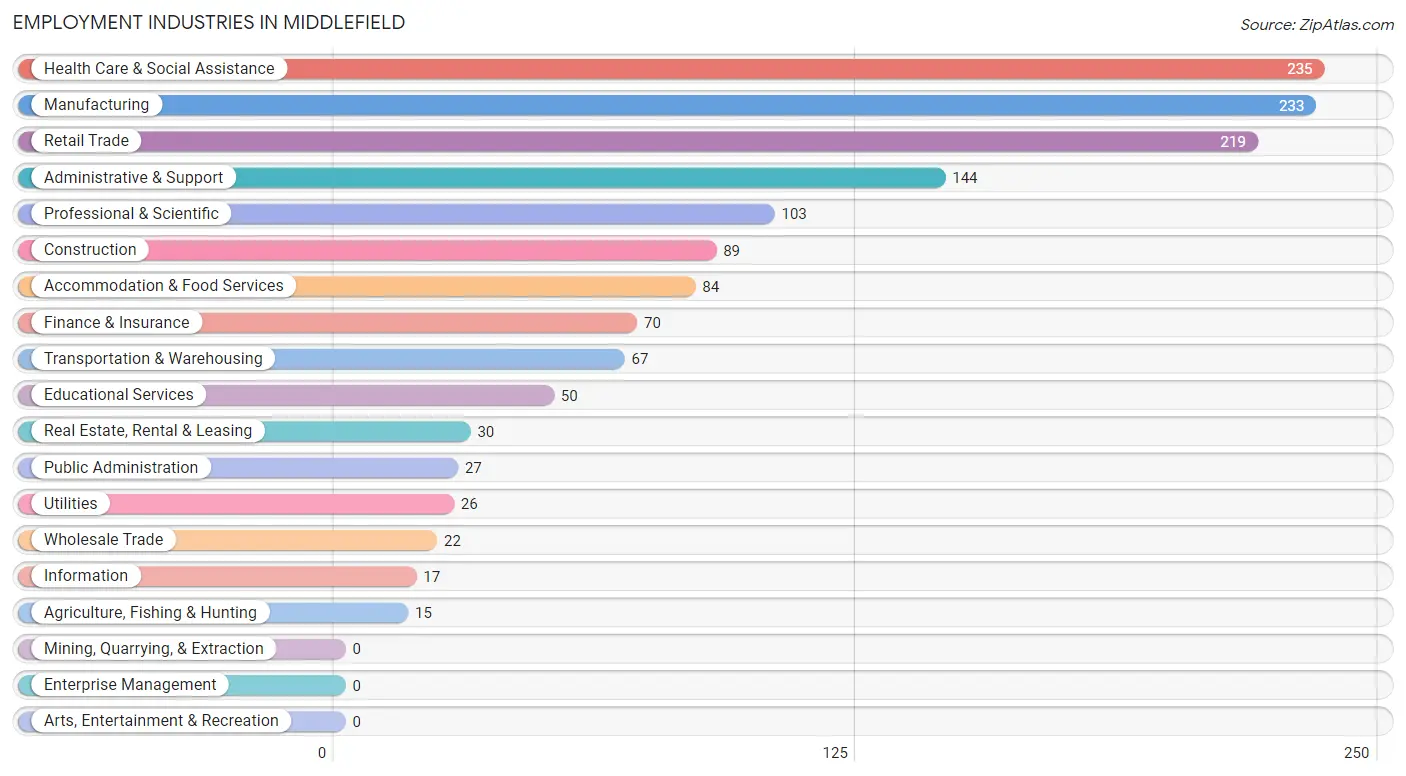
Employment Industries in Middlefield
The major employment industries in Middlefield include Health Care & Social Assistance (235 | 16.0%), Manufacturing (233 | 15.8%), Retail Trade (219 | 14.9%), Administrative & Support (144 | 9.8%), and Professional & Scientific (103 | 7.0%).
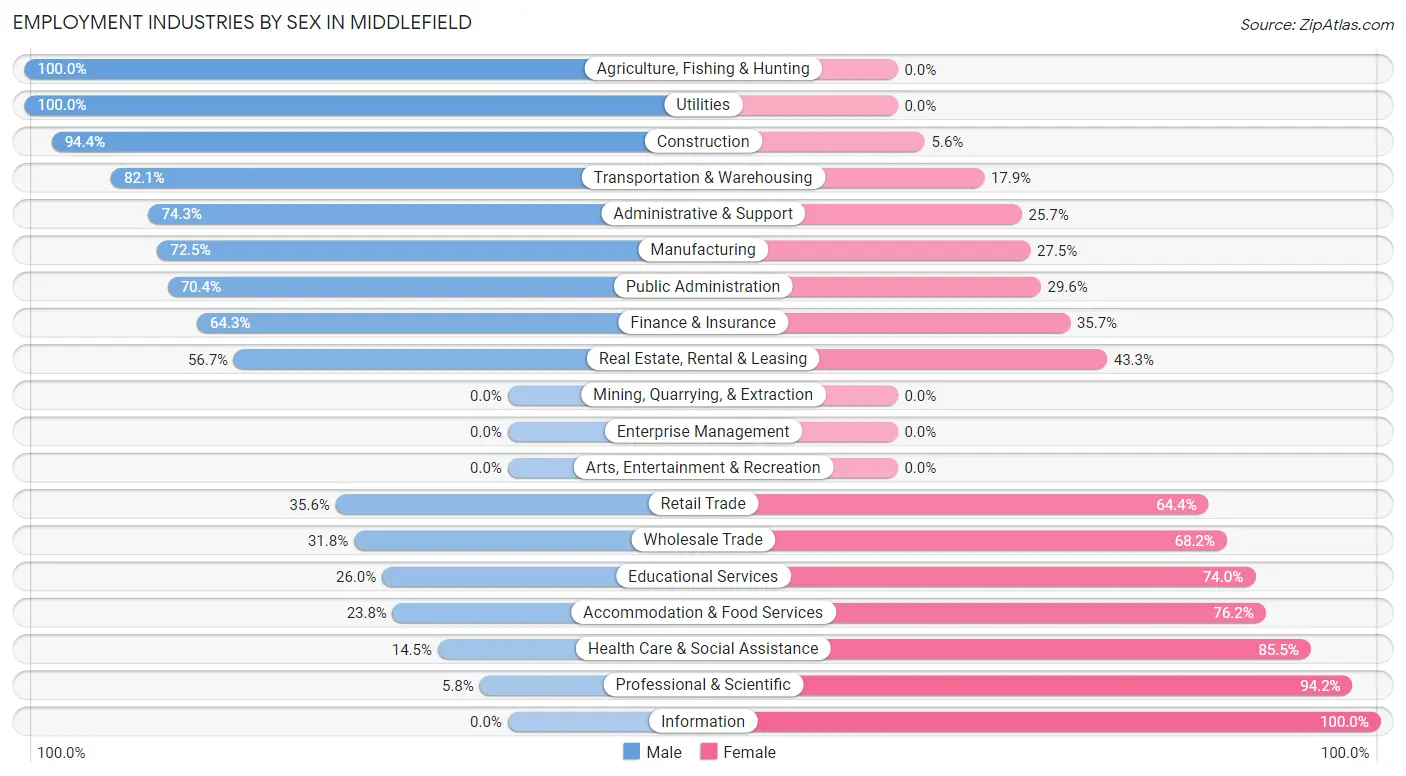
Employment Industries by Sex in Middlefield
The Middlefield industries that see more men than women are Agriculture, Fishing & Hunting (100.0%), Utilities (100.0%), and Construction (94.4%), whereas the industries that tend to have a higher number of women are Information (100.0%), Professional & Scientific (94.2%), and Health Care & Social Assistance (85.5%).
| Industry | Male | Female |
| Agriculture, Fishing & Hunting | 15 (100.0%) | 0 (0.0%) |
| Mining, Quarrying, & Extraction | 0 (0.0%) | 0 (0.0%) |
| Construction | 84 (94.4%) | 5 (5.6%) |
| Manufacturing | 169 (72.5%) | 64 (27.5%) |
| Wholesale Trade | 7 (31.8%) | 15 (68.2%) |
| Retail Trade | 78 (35.6%) | 141 (64.4%) |
| Transportation & Warehousing | 55 (82.1%) | 12 (17.9%) |
| Utilities | 26 (100.0%) | 0 (0.0%) |
| Information | 0 (0.0%) | 17 (100.0%) |
| Finance & Insurance | 45 (64.3%) | 25 (35.7%) |
| Real Estate, Rental & Leasing | 17 (56.7%) | 13 (43.3%) |
| Professional & Scientific | 6 (5.8%) | 97 (94.2%) |
| Enterprise Management | 0 (0.0%) | 0 (0.0%) |
| Administrative & Support | 107 (74.3%) | 37 (25.7%) |
| Educational Services | 13 (26.0%) | 37 (74.0%) |
| Health Care & Social Assistance | 34 (14.5%) | 201 (85.5%) |
| Arts, Entertainment & Recreation | 0 (0.0%) | 0 (0.0%) |
| Accommodation & Food Services | 20 (23.8%) | 64 (76.2%) |
| Public Administration | 19 (70.4%) | 8 (29.6%) |
| Total | 720 (48.9%) | 752 (51.1%) |
Education in Middlefield
School Enrollment in Middlefield
The most common levels of schooling among the 380 students in Middlefield are college / undergraduate (106 | 27.9%), high school (98 | 25.8%), and middle school (89 | 23.4%).
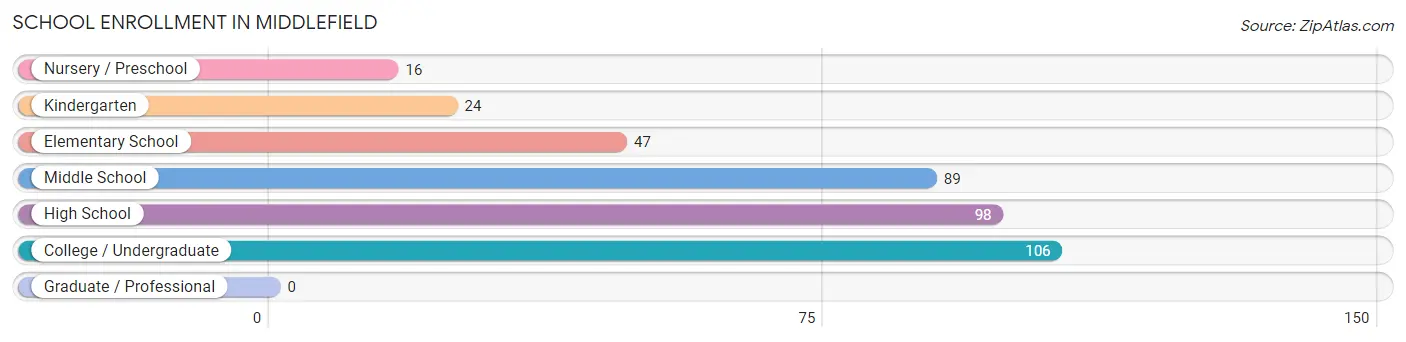
| School Level | # Students | % Students |
| Nursery / Preschool | 16 | 4.2% |
| Kindergarten | 24 | 6.3% |
| Elementary School | 47 | 12.4% |
| Middle School | 89 | 23.4% |
| High School | 98 | 25.8% |
| College / Undergraduate | 106 | 27.9% |
| Graduate / Professional | 0 | 0.0% |
| Total | 380 | 100.0% |
School Enrollment by Age by Funding Source in Middlefield
Out of a total of 380 students who are enrolled in schools in Middlefield, 58 (15.3%) attend a private institution, while the remaining 322 (84.7%) are enrolled in public schools. The age group of 3 to 4 year olds has the highest likelihood of being enrolled in private schools, with 8 (100.0% in the age bracket) enrolled. Conversely, the age group of 20 to 24 year olds has the lowest likelihood of being enrolled in a private school, with 72 (100.0% in the age bracket) attending a public institution.
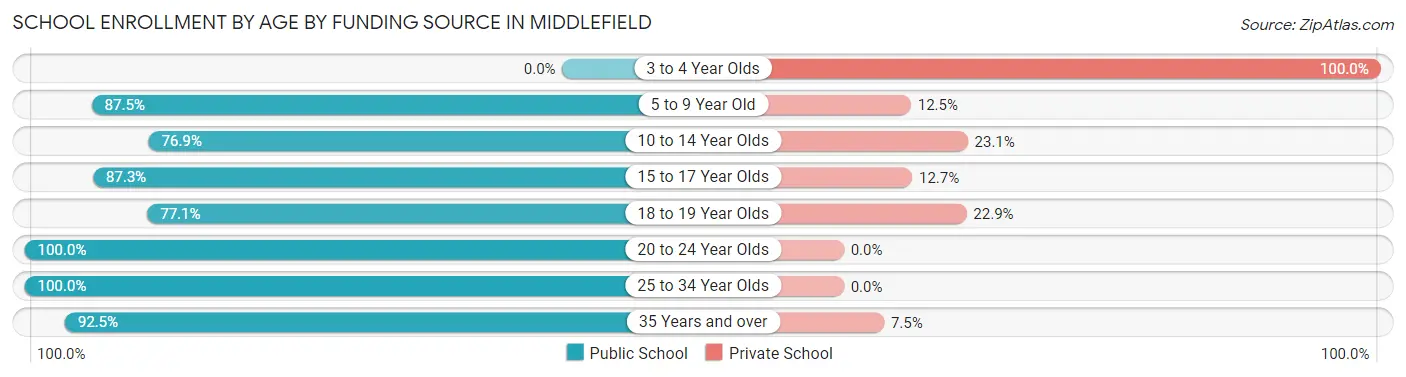
| Age Bracket | Public School | Private School |
| 3 to 4 Year Olds | 0 (0.0%) | 8 (100.0%) |
| 5 to 9 Year Old | 56 (87.5%) | 8 (12.5%) |
| 10 to 14 Year Olds | 80 (76.9%) | 24 (23.1%) |
| 15 to 17 Year Olds | 48 (87.3%) | 7 (12.7%) |
| 18 to 19 Year Olds | 27 (77.1%) | 8 (22.9%) |
| 20 to 24 Year Olds | 72 (100.0%) | 0 (0.0%) |
| 25 to 34 Year Olds | 2 (100.0%) | 0 (0.0%) |
| 35 Years and over | 37 (92.5%) | 3 (7.5%) |
| Total | 322 (84.7%) | 58 (15.3%) |
Educational Attainment by Field of Study in Middlefield
Social sciences (124 | 19.5%), visual & performing arts (92 | 14.5%), psychology (76 | 11.9%), education (74 | 11.6%), and business (47 | 7.4%) are the most common fields of study among 636 individuals in Middlefield who have obtained a bachelor's degree or higher.
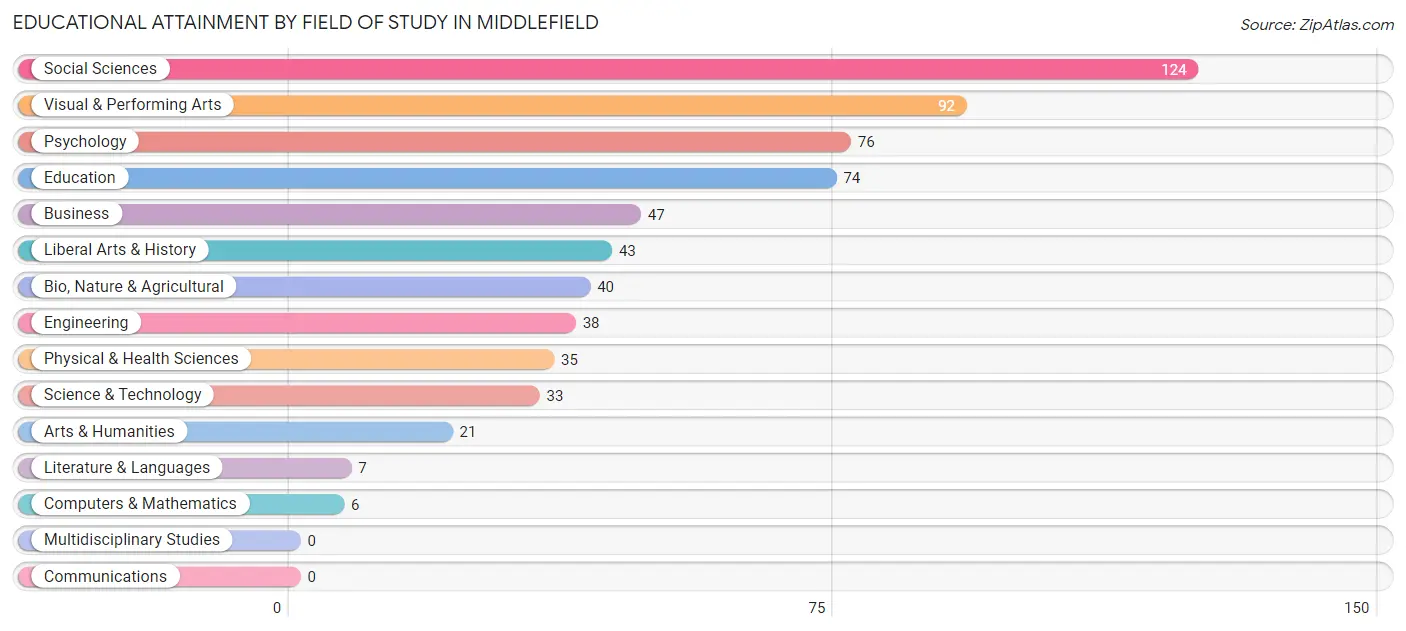
| Field of Study | # Graduates | % Graduates |
| Computers & Mathematics | 6 | 0.9% |
| Bio, Nature & Agricultural | 40 | 6.3% |
| Physical & Health Sciences | 35 | 5.5% |
| Psychology | 76 | 11.9% |
| Social Sciences | 124 | 19.5% |
| Engineering | 38 | 6.0% |
| Multidisciplinary Studies | 0 | 0.0% |
| Science & Technology | 33 | 5.2% |
| Business | 47 | 7.4% |
| Education | 74 | 11.6% |
| Literature & Languages | 7 | 1.1% |
| Liberal Arts & History | 43 | 6.8% |
| Visual & Performing Arts | 92 | 14.5% |
| Communications | 0 | 0.0% |
| Arts & Humanities | 21 | 3.3% |
| Total | 636 | 100.0% |
Transportation & Commute in Middlefield
Vehicle Availability by Sex in Middlefield
The most prevalent vehicle ownership categories in Middlefield are males with 2 vehicles (266, accounting for 37.3%) and females with 2 vehicles (192, making up 35.8%).
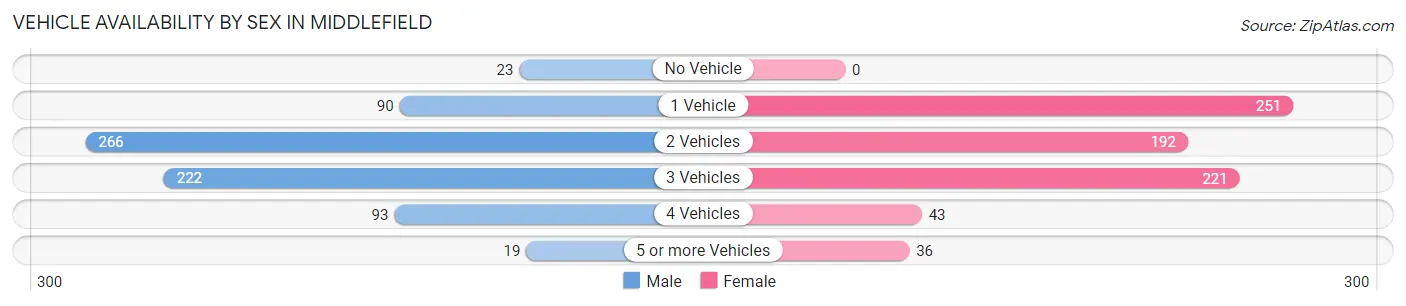
| Vehicles Available | Male | Female |
| No Vehicle | 23 (3.2%) | 0 (0.0%) |
| 1 Vehicle | 90 (12.6%) | 251 (33.8%) |
| 2 Vehicles | 266 (37.3%) | 192 (25.8%) |
| 3 Vehicles | 222 (31.1%) | 221 (29.7%) |
| 4 Vehicles | 93 (13.0%) | 43 (5.8%) |
| 5 or more Vehicles | 19 (2.7%) | 36 (4.9%) |
| Total | 713 (100.0%) | 743 (100.0%) |
Commute Time in Middlefield
The most frequently occuring commute durations in Middlefield are 5 to 9 minutes (316 commuters, 22.1%), less than 5 minutes (247 commuters, 17.3%), and 45 to 59 minutes (190 commuters, 13.3%).
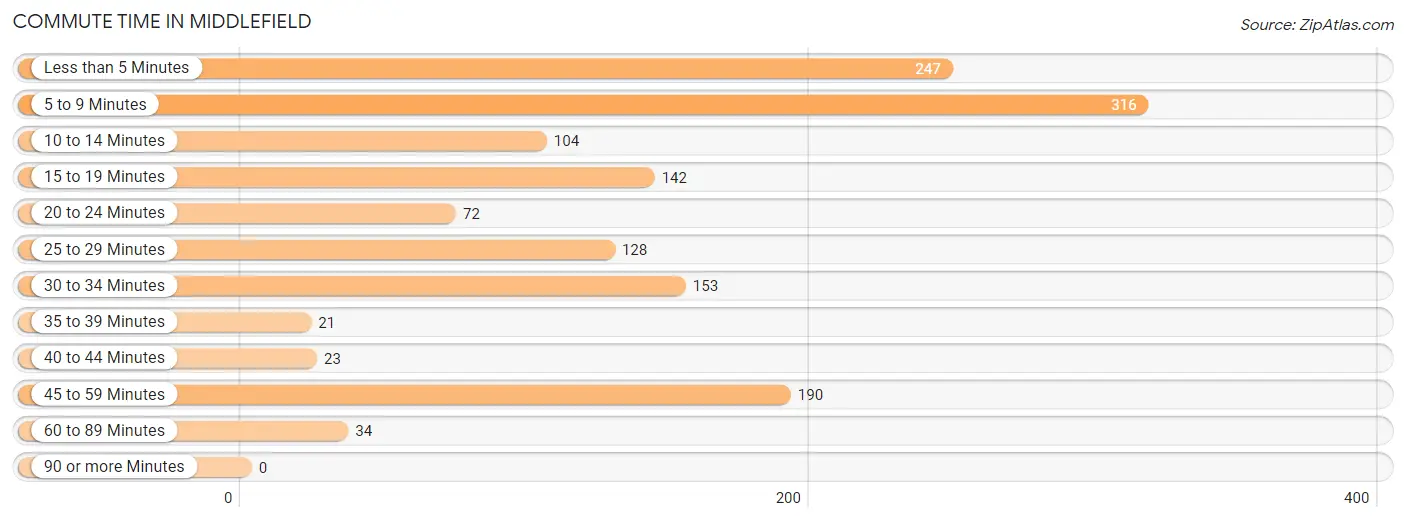
| Commute Time | # Commuters | % Commuters |
| Less than 5 Minutes | 247 | 17.3% |
| 5 to 9 Minutes | 316 | 22.1% |
| 10 to 14 Minutes | 104 | 7.3% |
| 15 to 19 Minutes | 142 | 9.9% |
| 20 to 24 Minutes | 72 | 5.0% |
| 25 to 29 Minutes | 128 | 8.9% |
| 30 to 34 Minutes | 153 | 10.7% |
| 35 to 39 Minutes | 21 | 1.5% |
| 40 to 44 Minutes | 23 | 1.6% |
| 45 to 59 Minutes | 190 | 13.3% |
| 60 to 89 Minutes | 34 | 2.4% |
| 90 or more Minutes | 0 | 0.0% |
Commute Time by Sex in Middlefield
The most common commute times in Middlefield are 5 to 9 minutes (141 commuters, 20.1%) for males and less than 5 minutes (176 commuters, 24.2%) for females.
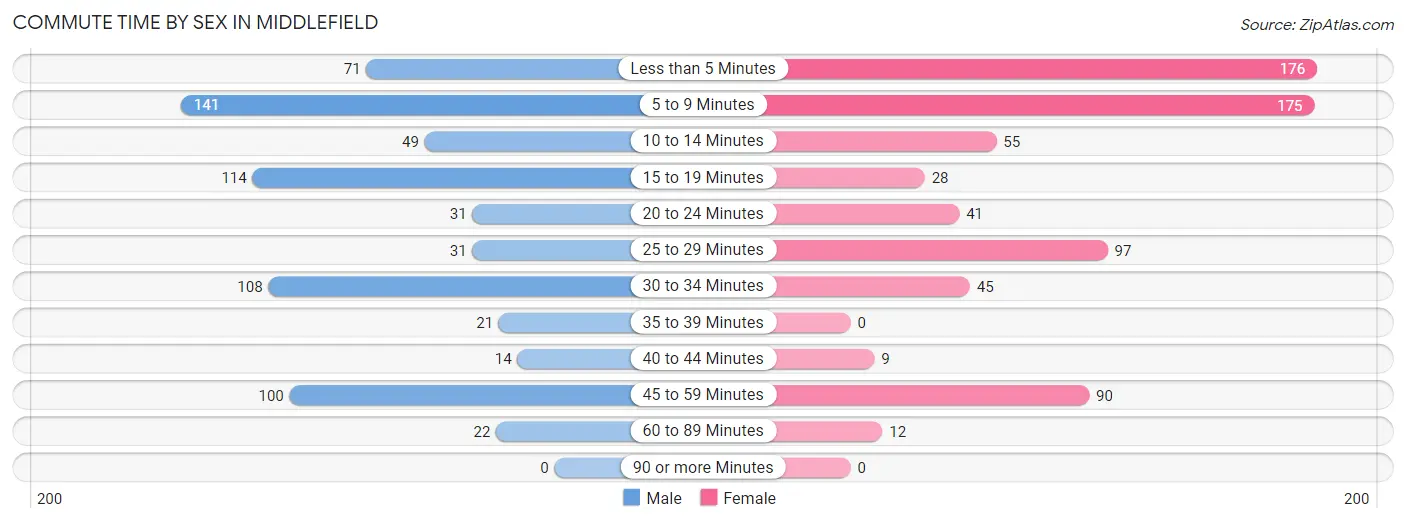
| Commute Time | Male | Female |
| Less than 5 Minutes | 71 (10.1%) | 176 (24.2%) |
| 5 to 9 Minutes | 141 (20.1%) | 175 (24.0%) |
| 10 to 14 Minutes | 49 (7.0%) | 55 (7.5%) |
| 15 to 19 Minutes | 114 (16.2%) | 28 (3.8%) |
| 20 to 24 Minutes | 31 (4.4%) | 41 (5.6%) |
| 25 to 29 Minutes | 31 (4.4%) | 97 (13.3%) |
| 30 to 34 Minutes | 108 (15.4%) | 45 (6.2%) |
| 35 to 39 Minutes | 21 (3.0%) | 0 (0.0%) |
| 40 to 44 Minutes | 14 (2.0%) | 9 (1.2%) |
| 45 to 59 Minutes | 100 (14.2%) | 90 (12.4%) |
| 60 to 89 Minutes | 22 (3.1%) | 12 (1.7%) |
| 90 or more Minutes | 0 (0.0%) | 0 (0.0%) |
Time of Departure to Work by Sex in Middlefield
The most frequent times of departure to work in Middlefield are 6:00 AM to 6:29 AM (105, 15.0%) for males and 4:00 PM to 11:59 PM (148, 20.3%) for females.
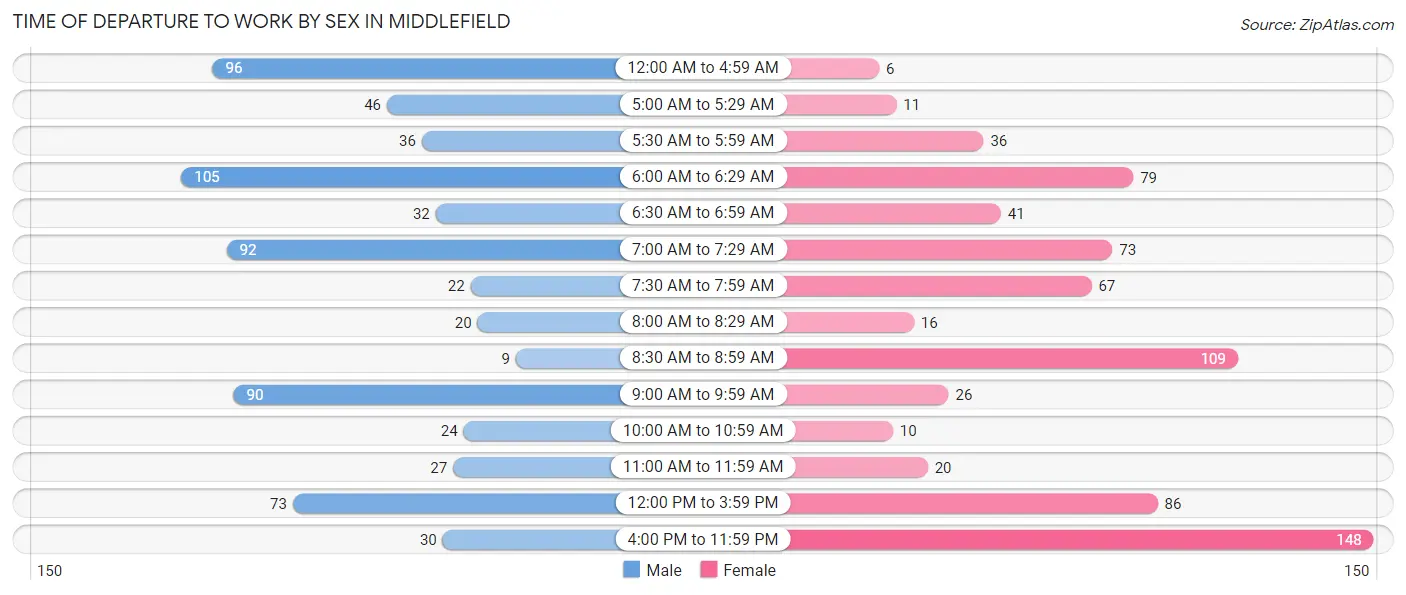
| Time of Departure | Male | Female |
| 12:00 AM to 4:59 AM | 96 (13.7%) | 6 (0.8%) |
| 5:00 AM to 5:29 AM | 46 (6.6%) | 11 (1.5%) |
| 5:30 AM to 5:59 AM | 36 (5.1%) | 36 (5.0%) |
| 6:00 AM to 6:29 AM | 105 (15.0%) | 79 (10.8%) |
| 6:30 AM to 6:59 AM | 32 (4.6%) | 41 (5.6%) |
| 7:00 AM to 7:29 AM | 92 (13.1%) | 73 (10.0%) |
| 7:30 AM to 7:59 AM | 22 (3.1%) | 67 (9.2%) |
| 8:00 AM to 8:29 AM | 20 (2.9%) | 16 (2.2%) |
| 8:30 AM to 8:59 AM | 9 (1.3%) | 109 (15.0%) |
| 9:00 AM to 9:59 AM | 90 (12.8%) | 26 (3.6%) |
| 10:00 AM to 10:59 AM | 24 (3.4%) | 10 (1.4%) |
| 11:00 AM to 11:59 AM | 27 (3.8%) | 20 (2.8%) |
| 12:00 PM to 3:59 PM | 73 (10.4%) | 86 (11.8%) |
| 4:00 PM to 11:59 PM | 30 (4.3%) | 148 (20.3%) |
| Total | 702 (100.0%) | 728 (100.0%) |
Housing Occupancy in Middlefield
Occupancy by Ownership in Middlefield
Of the total 1,318 dwellings in Middlefield, owner-occupied units account for 812 (61.6%), while renter-occupied units make up 506 (38.4%).
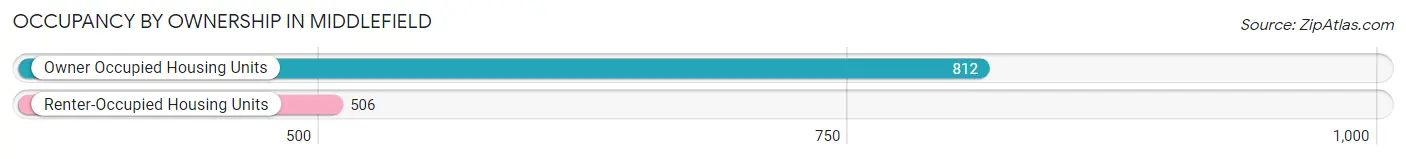
| Occupancy | # Housing Units | % Housing Units |
| Owner Occupied Housing Units | 812 | 61.6% |
| Renter-Occupied Housing Units | 506 | 38.4% |
| Total Occupied Housing Units | 1,318 | 100.0% |
Occupancy by Household Size in Middlefield

| Household Size | # Housing Units | % Housing Units |
| 1-Person Household | 616 | 46.7% |
| 2-Person Household | 384 | 29.1% |
| 3-Person Household | 112 | 8.5% |
| 4+ Person Household | 206 | 15.6% |
| Total Housing Units | 1,318 | 100.0% |
Occupancy by Ownership by Household Size in Middlefield
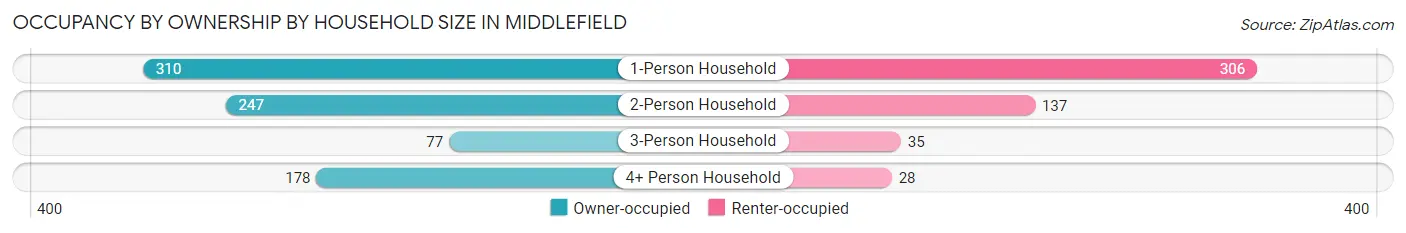
| Household Size | Owner-occupied | Renter-occupied |
| 1-Person Household | 310 (50.3%) | 306 (49.7%) |
| 2-Person Household | 247 (64.3%) | 137 (35.7%) |
| 3-Person Household | 77 (68.8%) | 35 (31.2%) |
| 4+ Person Household | 178 (86.4%) | 28 (13.6%) |
| Total Housing Units | 812 (61.6%) | 506 (38.4%) |
Occupancy by Educational Attainment in Middlefield
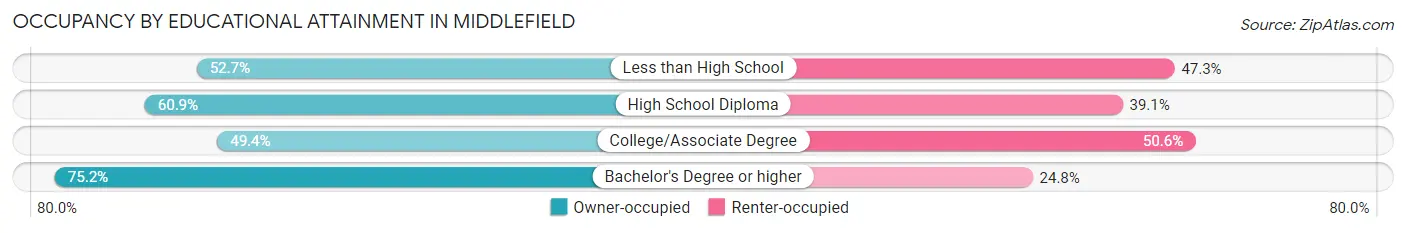
| Household Size | Owner-occupied | Renter-occupied |
| Less than High School | 49 (52.7%) | 44 (47.3%) |
| High School Diploma | 290 (60.9%) | 186 (39.1%) |
| College/Associate Degree | 173 (49.4%) | 177 (50.6%) |
| Bachelor's Degree or higher | 300 (75.2%) | 99 (24.8%) |
Occupancy by Age of Householder in Middlefield
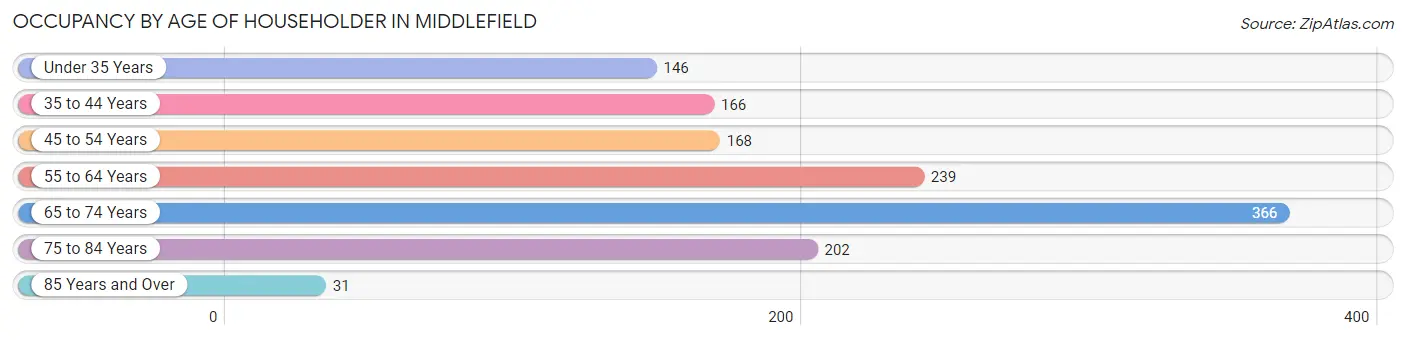
| Age Bracket | # Households | % Households |
| Under 35 Years | 146 | 11.1% |
| 35 to 44 Years | 166 | 12.6% |
| 45 to 54 Years | 168 | 12.8% |
| 55 to 64 Years | 239 | 18.1% |
| 65 to 74 Years | 366 | 27.8% |
| 75 to 84 Years | 202 | 15.3% |
| 85 Years and Over | 31 | 2.4% |
| Total | 1,318 | 100.0% |
Housing Finances in Middlefield
Median Income by Occupancy in Middlefield
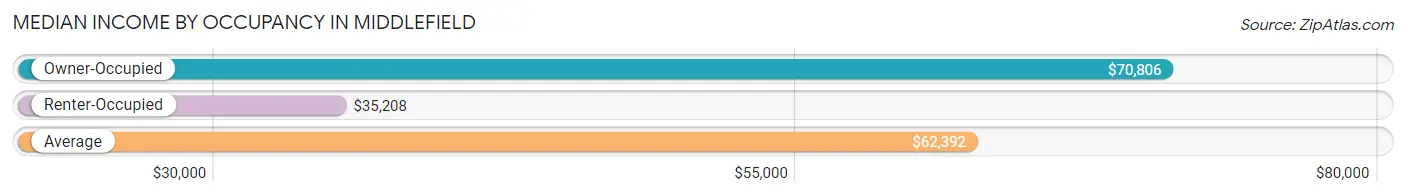
| Occupancy Type | # Households | Median Income |
| Owner-Occupied | 812 (61.6%) | $70,806 |
| Renter-Occupied | 506 (38.4%) | $35,208 |
| Average | 1,318 (100.0%) | $62,392 |
Occupancy by Householder Income Bracket in Middlefield
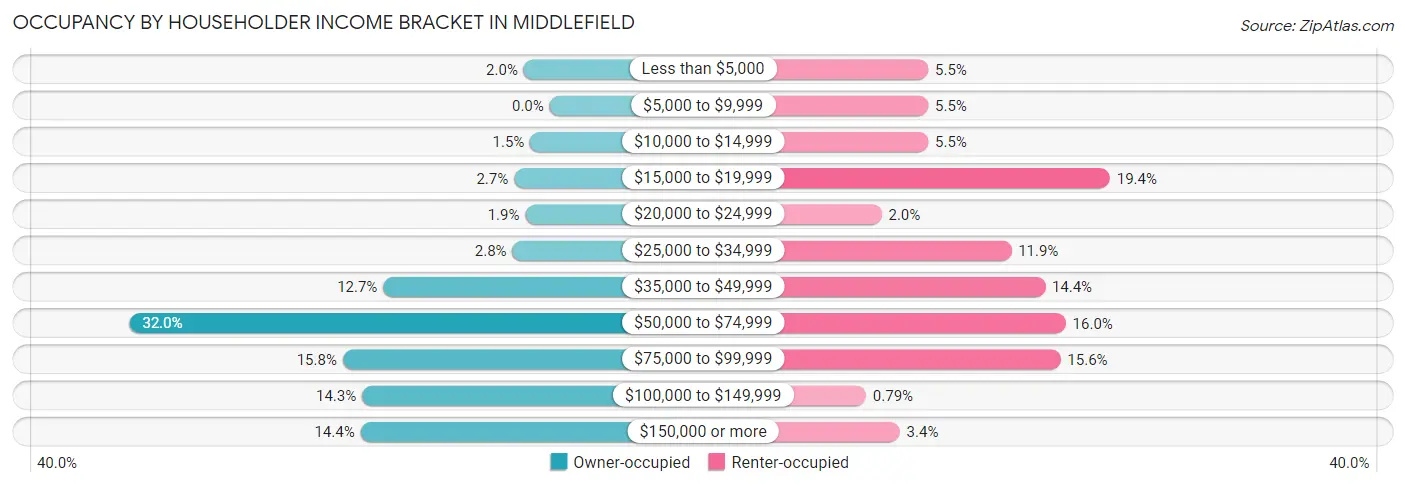
| Income Bracket | Owner-occupied | Renter-occupied |
| Less than $5,000 | 16 (2.0%) | 28 (5.5%) |
| $5,000 to $9,999 | 0 (0.0%) | 28 (5.5%) |
| $10,000 to $14,999 | 12 (1.5%) | 28 (5.5%) |
| $15,000 to $19,999 | 22 (2.7%) | 98 (19.4%) |
| $20,000 to $24,999 | 15 (1.8%) | 10 (2.0%) |
| $25,000 to $34,999 | 23 (2.8%) | 60 (11.9%) |
| $35,000 to $49,999 | 103 (12.7%) | 73 (14.4%) |
| $50,000 to $74,999 | 260 (32.0%) | 81 (16.0%) |
| $75,000 to $99,999 | 128 (15.8%) | 79 (15.6%) |
| $100,000 to $149,999 | 116 (14.3%) | 4 (0.8%) |
| $150,000 or more | 117 (14.4%) | 17 (3.4%) |
| Total | 812 (100.0%) | 506 (100.0%) |
Monthly Housing Cost Tiers in Middlefield
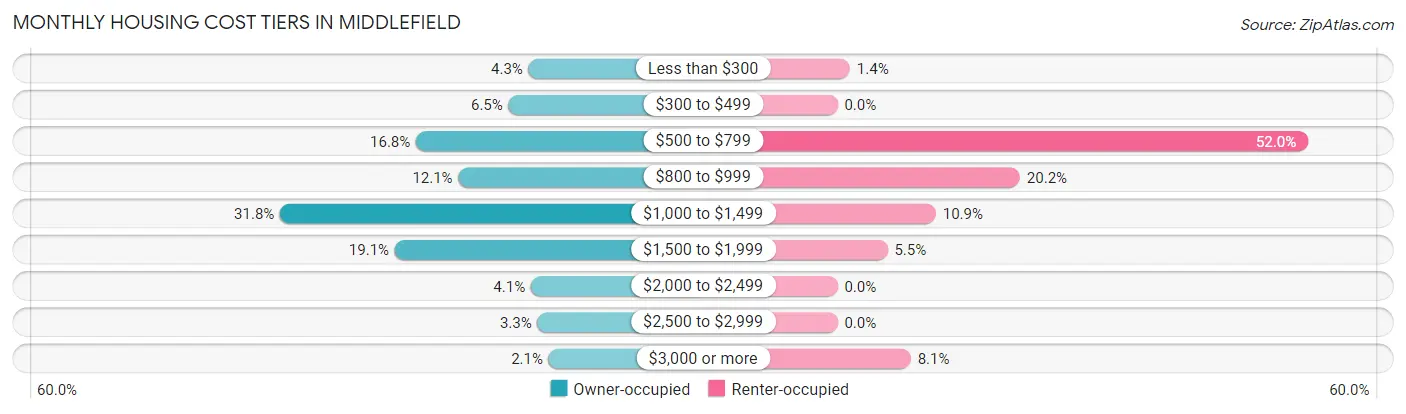
| Monthly Cost | Owner-occupied | Renter-occupied |
| Less than $300 | 35 (4.3%) | 7 (1.4%) |
| $300 to $499 | 53 (6.5%) | 0 (0.0%) |
| $500 to $799 | 136 (16.8%) | 263 (52.0%) |
| $800 to $999 | 98 (12.1%) | 102 (20.2%) |
| $1,000 to $1,499 | 258 (31.8%) | 55 (10.9%) |
| $1,500 to $1,999 | 155 (19.1%) | 28 (5.5%) |
| $2,000 to $2,499 | 33 (4.1%) | 0 (0.0%) |
| $2,500 to $2,999 | 27 (3.3%) | 0 (0.0%) |
| $3,000 or more | 17 (2.1%) | 41 (8.1%) |
| Total | 812 (100.0%) | 506 (100.0%) |
Physical Housing Characteristics in Middlefield
Housing Structures in Middlefield
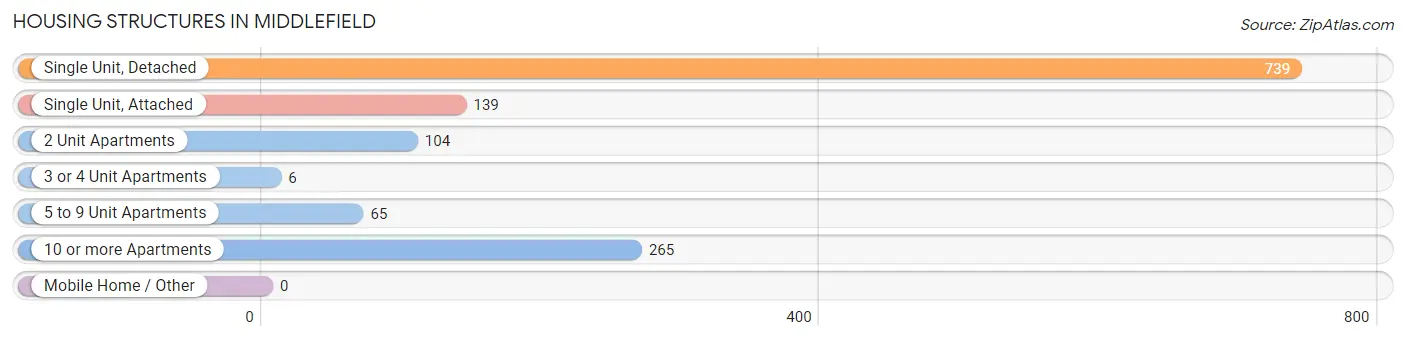
| Structure Type | # Housing Units | % Housing Units |
| Single Unit, Detached | 739 | 56.1% |
| Single Unit, Attached | 139 | 10.5% |
| 2 Unit Apartments | 104 | 7.9% |
| 3 or 4 Unit Apartments | 6 | 0.5% |
| 5 to 9 Unit Apartments | 65 | 4.9% |
| 10 or more Apartments | 265 | 20.1% |
| Mobile Home / Other | 0 | 0.0% |
| Total | 1,318 | 100.0% |
Housing Structures by Occupancy in Middlefield
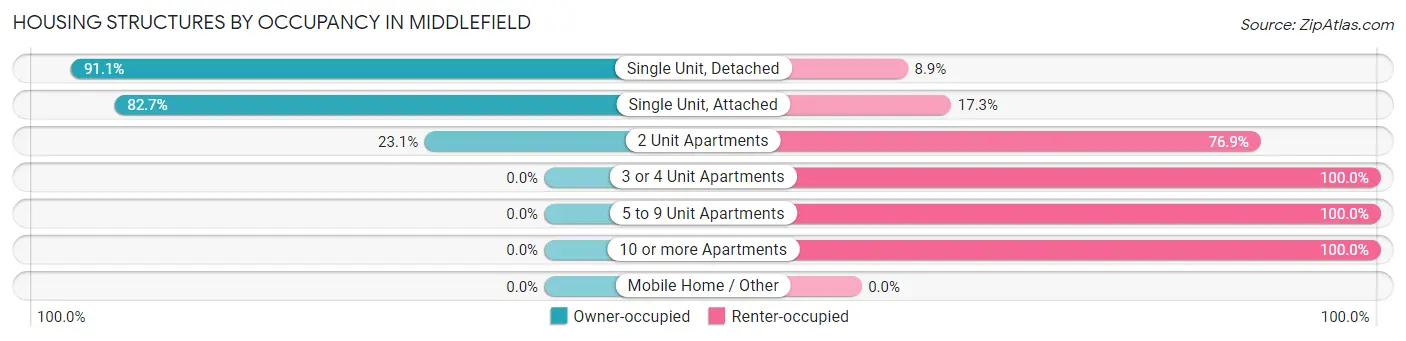
| Structure Type | Owner-occupied | Renter-occupied |
| Single Unit, Detached | 673 (91.1%) | 66 (8.9%) |
| Single Unit, Attached | 115 (82.7%) | 24 (17.3%) |
| 2 Unit Apartments | 24 (23.1%) | 80 (76.9%) |
| 3 or 4 Unit Apartments | 0 (0.0%) | 6 (100.0%) |
| 5 to 9 Unit Apartments | 0 (0.0%) | 65 (100.0%) |
| 10 or more Apartments | 0 (0.0%) | 265 (100.0%) |
| Mobile Home / Other | 0 (0.0%) | 0 (0.0%) |
| Total | 812 (61.6%) | 506 (38.4%) |
Housing Structures by Number of Rooms in Middlefield
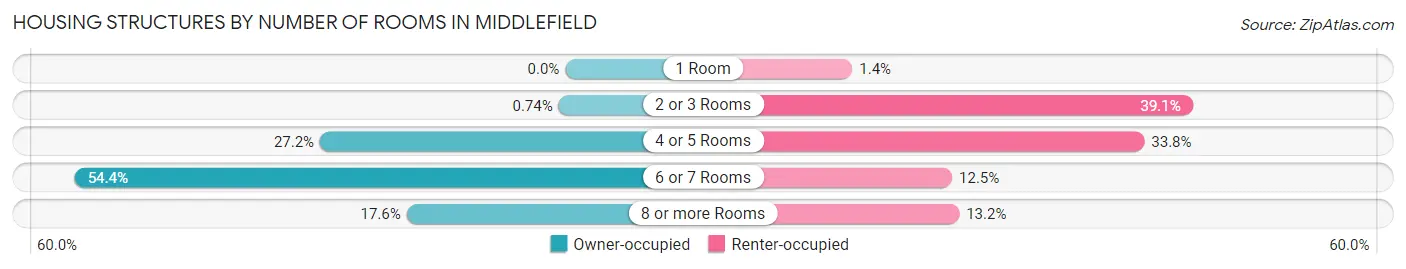
| Number of Rooms | Owner-occupied | Renter-occupied |
| 1 Room | 0 (0.0%) | 7 (1.4%) |
| 2 or 3 Rooms | 6 (0.7%) | 198 (39.1%) |
| 4 or 5 Rooms | 221 (27.2%) | 171 (33.8%) |
| 6 or 7 Rooms | 442 (54.4%) | 63 (12.4%) |
| 8 or more Rooms | 143 (17.6%) | 67 (13.2%) |
| Total | 812 (100.0%) | 506 (100.0%) |
Housing Structure by Heating Type in Middlefield
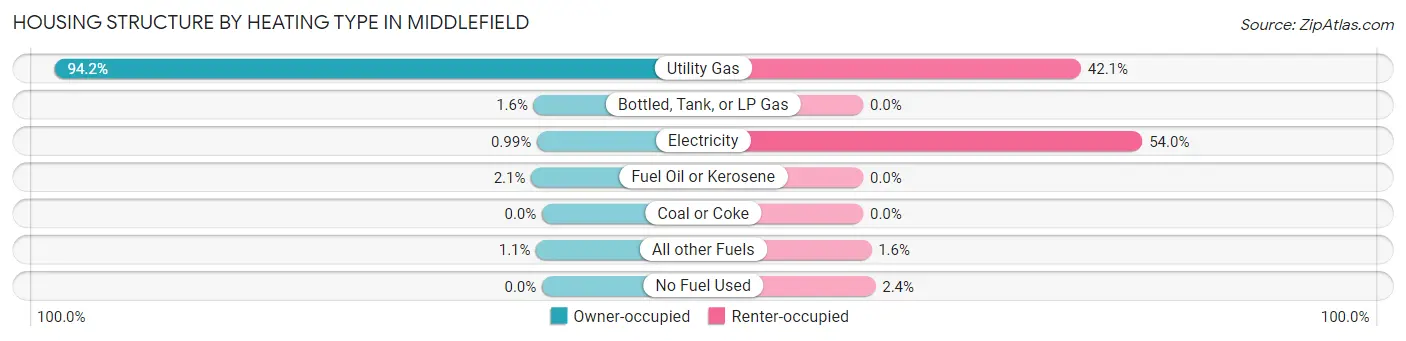
| Heating Type | Owner-occupied | Renter-occupied |
| Utility Gas | 765 (94.2%) | 213 (42.1%) |
| Bottled, Tank, or LP Gas | 13 (1.6%) | 0 (0.0%) |
| Electricity | 8 (1.0%) | 273 (53.9%) |
| Fuel Oil or Kerosene | 17 (2.1%) | 0 (0.0%) |
| Coal or Coke | 0 (0.0%) | 0 (0.0%) |
| All other Fuels | 9 (1.1%) | 8 (1.6%) |
| No Fuel Used | 0 (0.0%) | 12 (2.4%) |
| Total | 812 (100.0%) | 506 (100.0%) |
Household Vehicle Usage in Middlefield
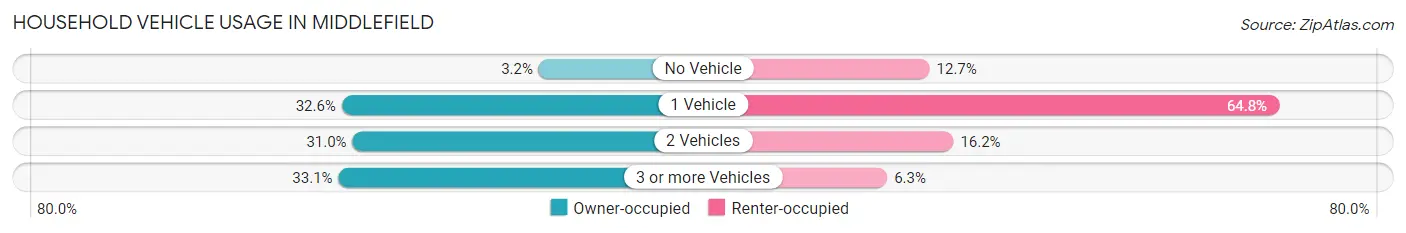
| Vehicles per Household | Owner-occupied | Renter-occupied |
| No Vehicle | 26 (3.2%) | 64 (12.7%) |
| 1 Vehicle | 265 (32.6%) | 328 (64.8%) |
| 2 Vehicles | 252 (31.0%) | 82 (16.2%) |
| 3 or more Vehicles | 269 (33.1%) | 32 (6.3%) |
| Total | 812 (100.0%) | 506 (100.0%) |
Real Estate & Mortgages in Middlefield
Real Estate and Mortgage Overview in Middlefield
| Characteristic | Without Mortgage | With Mortgage |
| Housing Units | 255 | 557 |
| Median Property Value | $199,800 | $182,200 |
| Median Household Income | $55,893 | $77 |
| Monthly Housing Costs | $560 | $17 |
| Real Estate Taxes | $2,559 | $0 |
Property Value by Mortgage Status in Middlefield
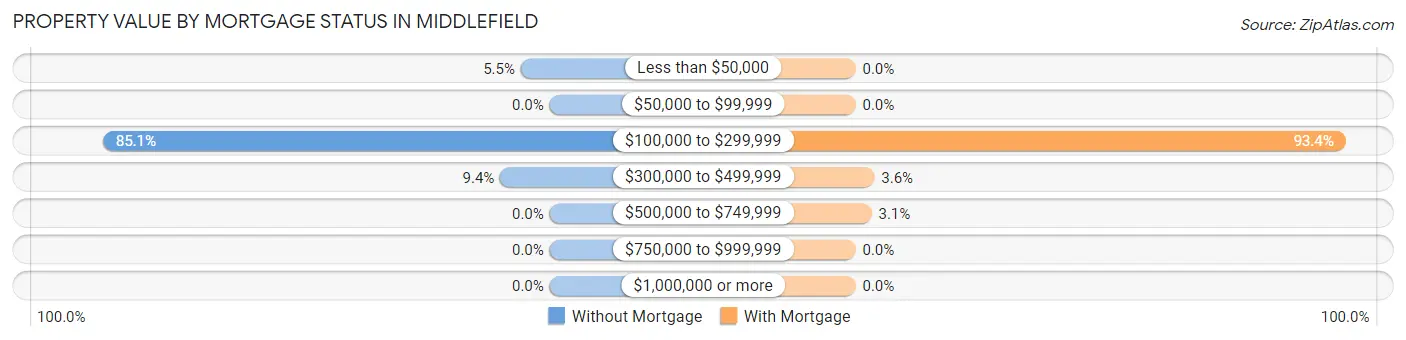
| Property Value | Without Mortgage | With Mortgage |
| Less than $50,000 | 14 (5.5%) | 0 (0.0%) |
| $50,000 to $99,999 | 0 (0.0%) | 0 (0.0%) |
| $100,000 to $299,999 | 217 (85.1%) | 520 (93.4%) |
| $300,000 to $499,999 | 24 (9.4%) | 20 (3.6%) |
| $500,000 to $749,999 | 0 (0.0%) | 17 (3.0%) |
| $750,000 to $999,999 | 0 (0.0%) | 0 (0.0%) |
| $1,000,000 or more | 0 (0.0%) | 0 (0.0%) |
| Total | 255 (100.0%) | 557 (100.0%) |
Household Income by Mortgage Status in Middlefield
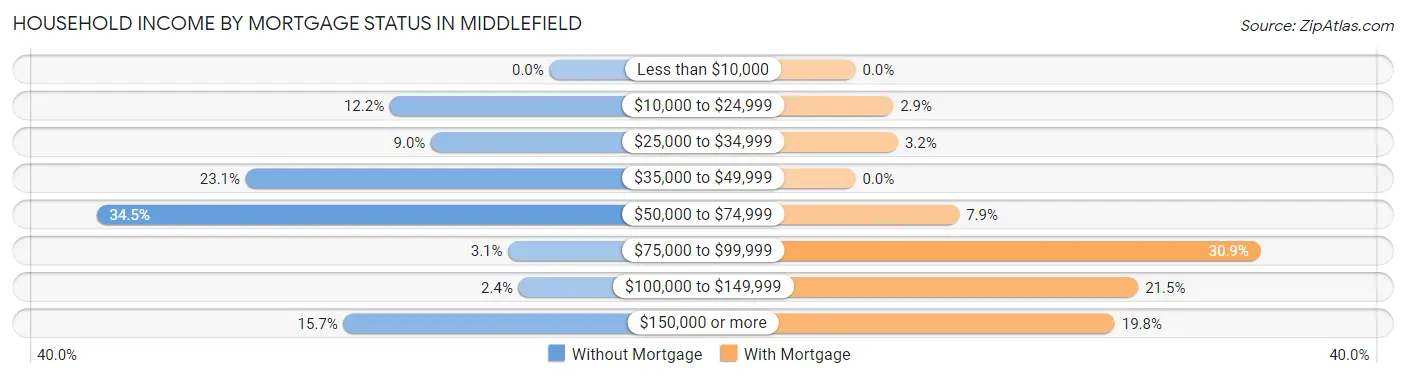
| Household Income | Without Mortgage | With Mortgage |
| Less than $10,000 | 0 (0.0%) | 0 (0.0%) |
| $10,000 to $24,999 | 31 (12.2%) | 16 (2.9%) |
| $25,000 to $34,999 | 23 (9.0%) | 18 (3.2%) |
| $35,000 to $49,999 | 59 (23.1%) | 0 (0.0%) |
| $50,000 to $74,999 | 88 (34.5%) | 44 (7.9%) |
| $75,000 to $99,999 | 8 (3.1%) | 172 (30.9%) |
| $100,000 to $149,999 | 6 (2.4%) | 120 (21.5%) |
| $150,000 or more | 40 (15.7%) | 110 (19.8%) |
| Total | 255 (100.0%) | 557 (100.0%) |
Property Value to Household Income Ratio in Middlefield
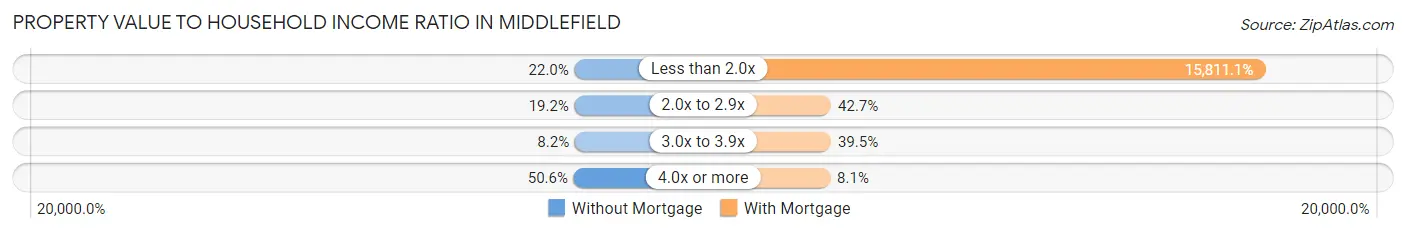
| Value-to-Income Ratio | Without Mortgage | With Mortgage |
| Less than 2.0x | 56 (22.0%) | 88,068 (15,811.1%) |
| 2.0x to 2.9x | 49 (19.2%) | 238 (42.7%) |
| 3.0x to 3.9x | 21 (8.2%) | 220 (39.5%) |
| 4.0x or more | 129 (50.6%) | 45 (8.1%) |
| Total | 255 (100.0%) | 557 (100.0%) |
Real Estate Taxes by Mortgage Status in Middlefield
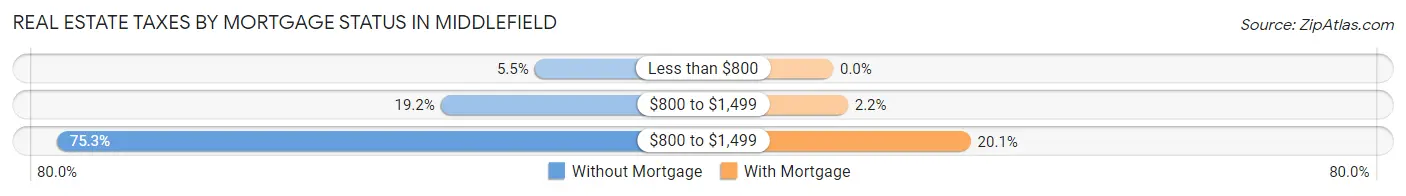
| Property Taxes | Without Mortgage | With Mortgage |
| Less than $800 | 14 (5.5%) | 0 (0.0%) |
| $800 to $1,499 | 49 (19.2%) | 12 (2.1%) |
| $800 to $1,499 | 192 (75.3%) | 112 (20.1%) |
| Total | 255 (100.0%) | 557 (100.0%) |
Health & Disability in Middlefield
Health Insurance Coverage by Age in Middlefield
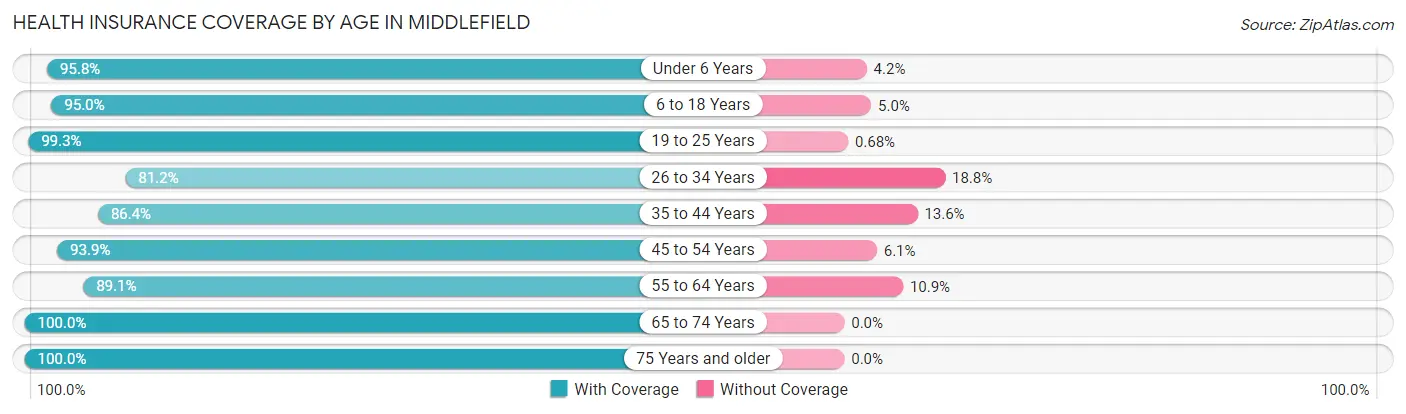
| Age Bracket | With Coverage | Without Coverage |
| Under 6 Years | 92 (95.8%) | 4 (4.2%) |
| 6 to 18 Years | 247 (95.0%) | 13 (5.0%) |
| 19 to 25 Years | 294 (99.3%) | 2 (0.7%) |
| 26 to 34 Years | 186 (81.2%) | 43 (18.8%) |
| 35 to 44 Years | 285 (86.4%) | 45 (13.6%) |
| 45 to 54 Years | 341 (93.9%) | 22 (6.1%) |
| 55 to 64 Years | 285 (89.1%) | 35 (10.9%) |
| 65 to 74 Years | 452 (100.0%) | 0 (0.0%) |
| 75 Years and older | 311 (100.0%) | 0 (0.0%) |
| Total | 2,493 (93.8%) | 164 (6.2%) |
Health Insurance Coverage by Citizenship Status in Middlefield
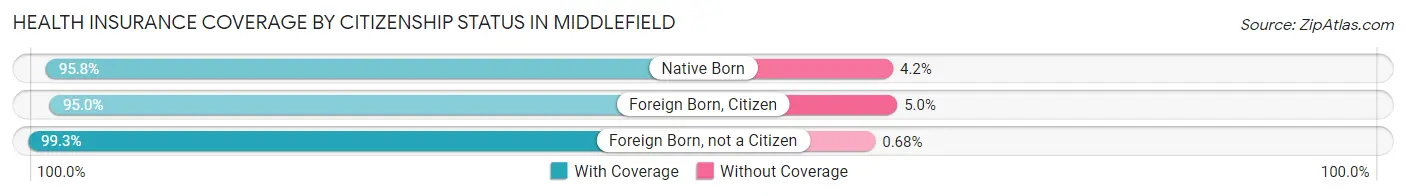
| Citizenship Status | With Coverage | Without Coverage |
| Native Born | 92 (95.8%) | 4 (4.2%) |
| Foreign Born, Citizen | 247 (95.0%) | 13 (5.0%) |
| Foreign Born, not a Citizen | 294 (99.3%) | 2 (0.7%) |
Health Insurance Coverage by Household Income in Middlefield
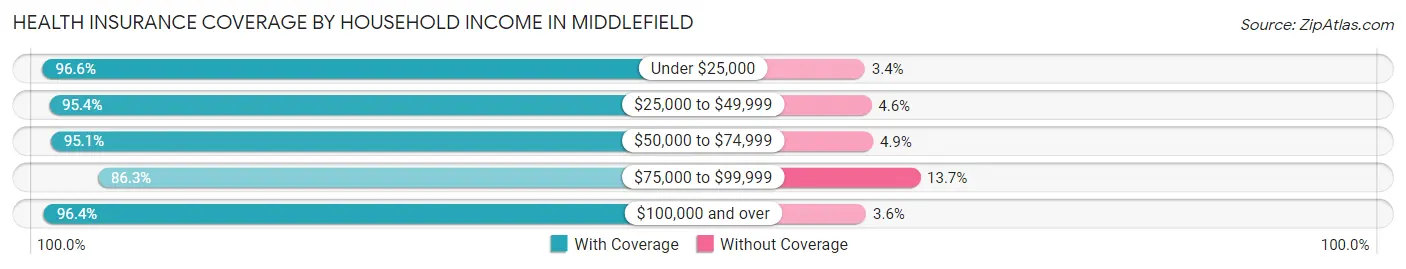
| Household Income | With Coverage | Without Coverage |
| Under $25,000 | 286 (96.6%) | 10 (3.4%) |
| $25,000 to $49,999 | 311 (95.4%) | 15 (4.6%) |
| $50,000 to $74,999 | 522 (95.1%) | 27 (4.9%) |
| $75,000 to $99,999 | 496 (86.3%) | 79 (13.7%) |
| $100,000 and over | 878 (96.4%) | 33 (3.6%) |
Public vs Private Health Insurance Coverage by Age in Middlefield
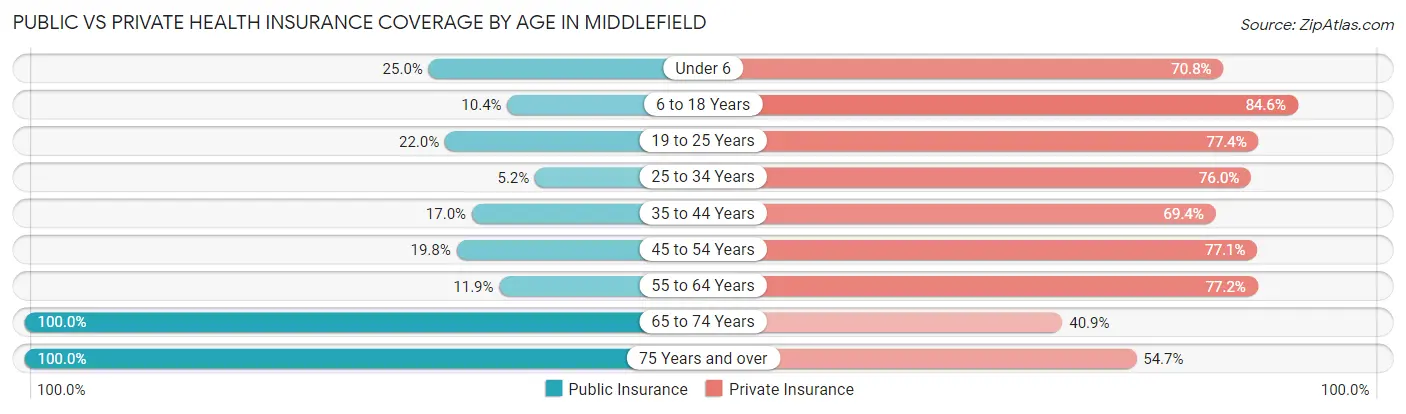
| Age Bracket | Public Insurance | Private Insurance |
| Under 6 | 24 (25.0%) | 68 (70.8%) |
| 6 to 18 Years | 27 (10.4%) | 220 (84.6%) |
| 19 to 25 Years | 65 (22.0%) | 229 (77.4%) |
| 25 to 34 Years | 12 (5.2%) | 174 (76.0%) |
| 35 to 44 Years | 56 (17.0%) | 229 (69.4%) |
| 45 to 54 Years | 72 (19.8%) | 280 (77.1%) |
| 55 to 64 Years | 38 (11.9%) | 247 (77.2%) |
| 65 to 74 Years | 452 (100.0%) | 185 (40.9%) |
| 75 Years and over | 311 (100.0%) | 170 (54.7%) |
| Total | 1,057 (39.8%) | 1,802 (67.8%) |
Disability Status by Sex by Age in Middlefield
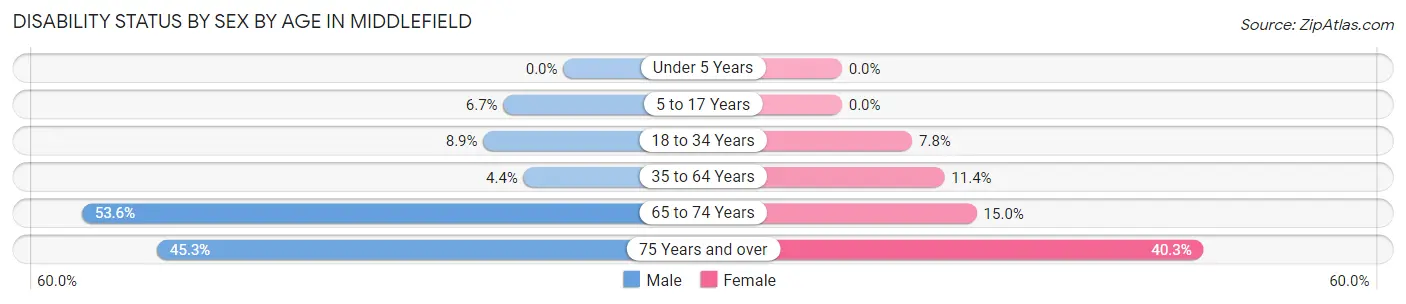
| Age Bracket | Male | Female |
| Under 5 Years | 0 (0.0%) | 0 (0.0%) |
| 5 to 17 Years | 7 (6.7%) | 0 (0.0%) |
| 18 to 34 Years | 23 (8.9%) | 26 (7.8%) |
| 35 to 64 Years | 20 (4.4%) | 64 (11.4%) |
| 65 to 74 Years | 96 (53.6%) | 41 (15.0%) |
| 75 Years and over | 43 (45.3%) | 87 (40.3%) |
Disability Class by Sex by Age in Middlefield
Disability Class: Hearing Difficulty
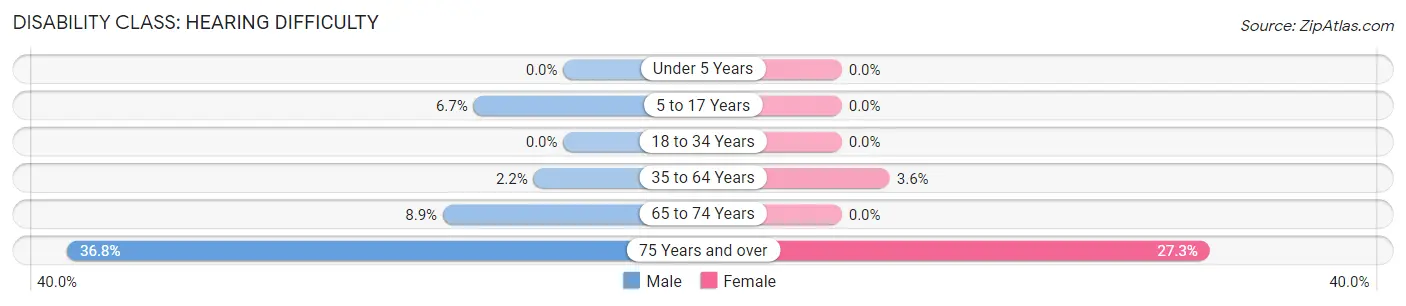
| Age Bracket | Male | Female |
| Under 5 Years | 0 (0.0%) | 0 (0.0%) |
| 5 to 17 Years | 7 (6.7%) | 0 (0.0%) |
| 18 to 34 Years | 0 (0.0%) | 0 (0.0%) |
| 35 to 64 Years | 10 (2.2%) | 20 (3.6%) |
| 65 to 74 Years | 16 (8.9%) | 0 (0.0%) |
| 75 Years and over | 35 (36.8%) | 59 (27.3%) |
Disability Class: Vision Difficulty
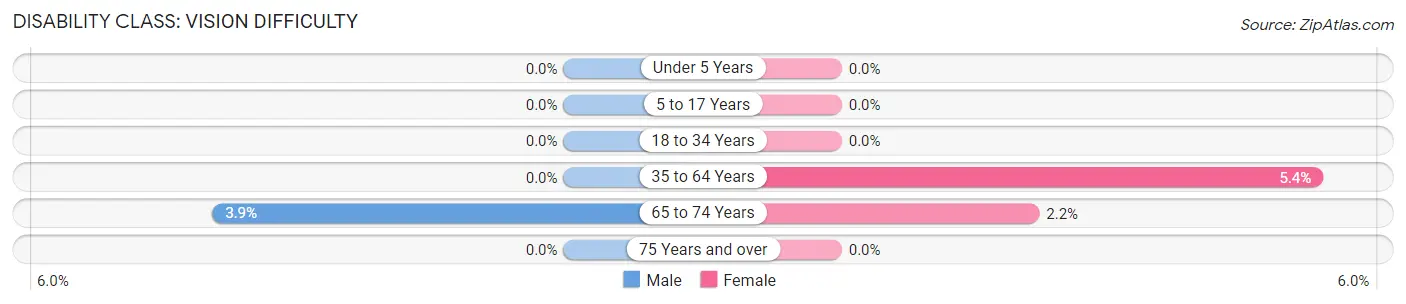
| Age Bracket | Male | Female |
| Under 5 Years | 0 (0.0%) | 0 (0.0%) |
| 5 to 17 Years | 0 (0.0%) | 0 (0.0%) |
| 18 to 34 Years | 0 (0.0%) | 0 (0.0%) |
| 35 to 64 Years | 0 (0.0%) | 30 (5.4%) |
| 65 to 74 Years | 7 (3.9%) | 6 (2.2%) |
| 75 Years and over | 0 (0.0%) | 0 (0.0%) |
Disability Class: Cognitive Difficulty
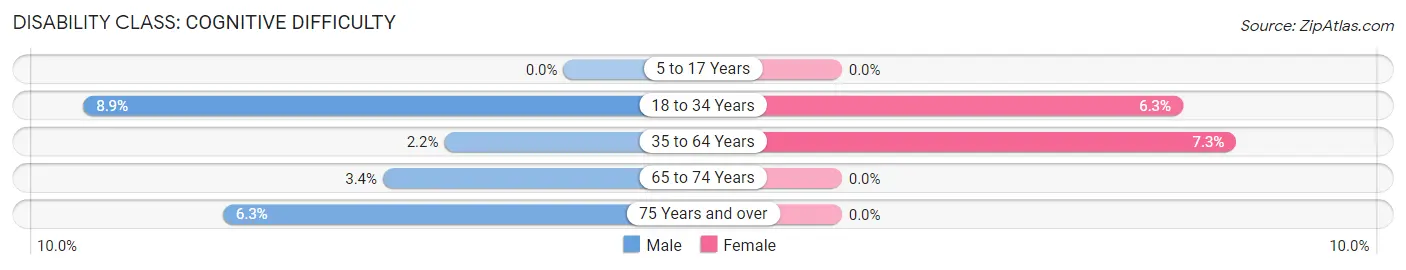
| Age Bracket | Male | Female |
| 5 to 17 Years | 0 (0.0%) | 0 (0.0%) |
| 18 to 34 Years | 23 (8.9%) | 21 (6.3%) |
| 35 to 64 Years | 10 (2.2%) | 41 (7.3%) |
| 65 to 74 Years | 6 (3.4%) | 0 (0.0%) |
| 75 Years and over | 6 (6.3%) | 0 (0.0%) |
Disability Class: Ambulatory Difficulty
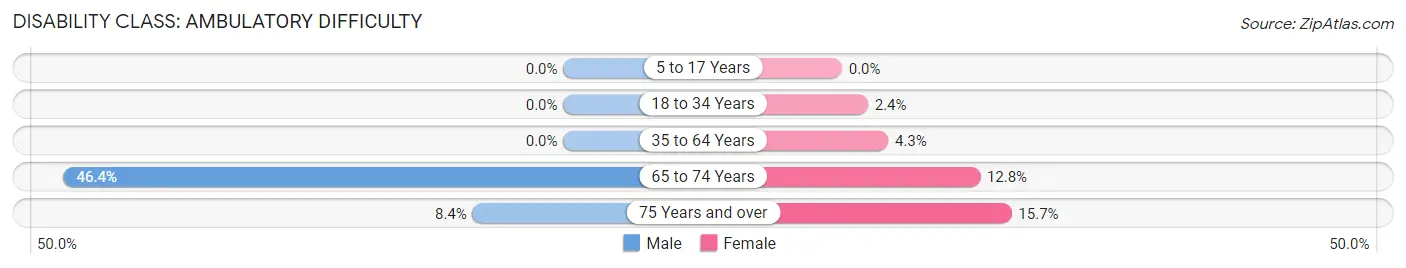
| Age Bracket | Male | Female |
| 5 to 17 Years | 0 (0.0%) | 0 (0.0%) |
| 18 to 34 Years | 0 (0.0%) | 8 (2.4%) |
| 35 to 64 Years | 0 (0.0%) | 24 (4.3%) |
| 65 to 74 Years | 83 (46.4%) | 35 (12.8%) |
| 75 Years and over | 8 (8.4%) | 34 (15.7%) |
Disability Class: Self-Care Difficulty
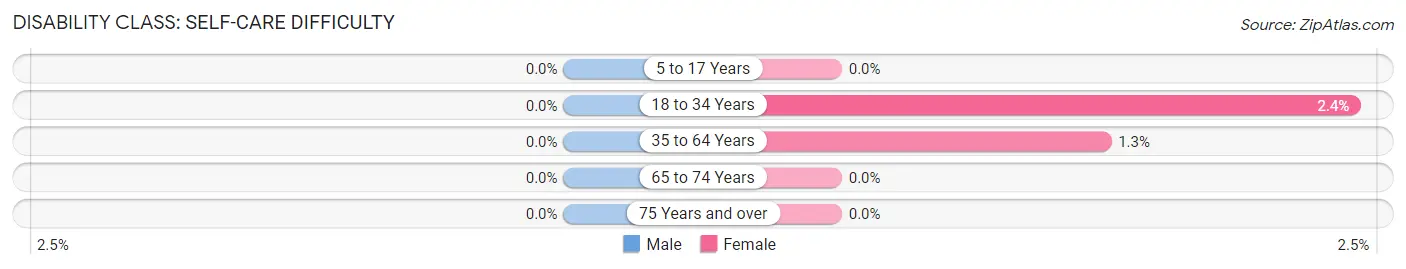
| Age Bracket | Male | Female |
| 5 to 17 Years | 0 (0.0%) | 0 (0.0%) |
| 18 to 34 Years | 0 (0.0%) | 8 (2.4%) |
| 35 to 64 Years | 0 (0.0%) | 7 (1.3%) |
| 65 to 74 Years | 0 (0.0%) | 0 (0.0%) |
| 75 Years and over | 0 (0.0%) | 0 (0.0%) |
Technology Access in Middlefield
Computing Device Access in Middlefield
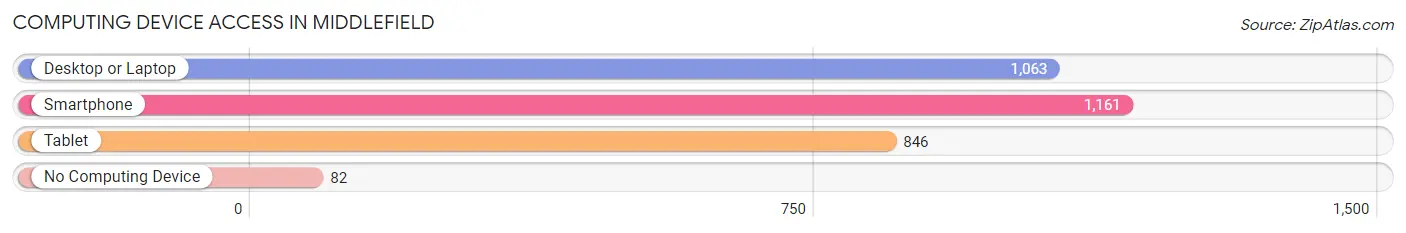
| Device Type | # Households | % Households |
| Desktop or Laptop | 1,063 | 80.6% |
| Smartphone | 1,161 | 88.1% |
| Tablet | 846 | 64.2% |
| No Computing Device | 82 | 6.2% |
| Total | 1,318 | 100.0% |
Internet Access in Middlefield
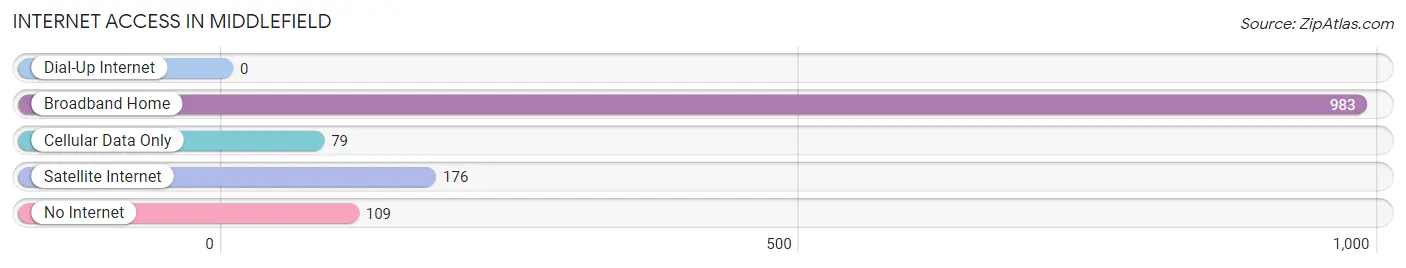
| Internet Type | # Households | % Households |
| Dial-Up Internet | 0 | 0.0% |
| Broadband Home | 983 | 74.6% |
| Cellular Data Only | 79 | 6.0% |
| Satellite Internet | 176 | 13.4% |
| No Internet | 109 | 8.3% |
| Total | 1,318 | 100.0% |
Middlefield Summary
Middlefield, Ohio is a small village located in Geauga County, Ohio. It is situated in the northeast corner of the state, approximately 30 miles east of Cleveland. The village has a population of approximately 2,500 people and covers an area of 1.3 square miles.
History
Middlefield was founded in 1814 by a group of settlers from Connecticut. The village was originally known as “Middlefield Center” and was named after the town of Middlefield, Connecticut. The settlers were attracted to the area due to its fertile soil and abundant natural resources. The village was officially incorporated in 1837.
In the late 19th century, Middlefield was a thriving agricultural community. The village was home to several large farms, as well as a number of small businesses. The village also had a railroad station, which allowed for the transportation of goods and people.
In the early 20th century, Middlefield began to experience a decline in population. This was due to the fact that many of the young people in the village were leaving to find work in larger cities. The village also experienced a decline in its agricultural industry, as many of the farms were unable to compete with larger, more efficient farms in other parts of the state.
Geography
Middlefield is located in the northeast corner of Ohio, approximately 30 miles east of Cleveland. The village is situated in the Chagrin River Valley, which is part of the larger Western Reserve region of Ohio. The village is surrounded by rolling hills and is home to several small lakes and streams.
The village is located in a temperate climate zone, with hot summers and cold winters. The average temperature in the summer is around 75 degrees Fahrenheit, while the average temperature in the winter is around 25 degrees Fahrenheit.
Economy
Middlefield’s economy is largely based on agriculture and tourism. The village is home to several large farms, which produce a variety of crops, including corn, soybeans, wheat, and hay. The village also has a number of small businesses, including restaurants, shops, and other services.
The village is also home to several tourist attractions, including the Geauga County Historical Society Museum, the Middlefield Historical Society Museum, and the Middlefield Cheese House. These attractions draw visitors from all over the state and beyond.
Demographics
As of the 2010 census, the population of Middlefield was 2,521. The village is predominantly white, with 95.3% of the population identifying as such. The remaining 4.7% of the population is made up of African Americans, Asians, and other races.
The median household income in Middlefield is $50,945, which is slightly higher than the national average. The village also has a low unemployment rate, with only 4.2% of the population being unemployed.
Middlefield is a small village with a rich history and a vibrant economy. The village is home to a diverse population and is a popular tourist destination. The village is also home to a number of small businesses and farms, which provide employment opportunities for the local population.
Common Questions
What is Per Capita Income in Middlefield?
Per Capita income in Middlefield is $35,930.
What is the Median Family Income in Middlefield?
Median Family Income in Middlefield is $90,349.
What is the Median Household income in Middlefield?
Median Household Income in Middlefield is $62,392.
What is Income or Wage Gap in Middlefield?
Income or Wage Gap in Middlefield is 54.2%.
Women in Middlefield earn 45.8 cents for every dollar earned by a man.
What is Inequality or Gini Index in Middlefield?
Inequality or Gini Index in Middlefield is 0.42.
What is the Total Population of Middlefield?
Total Population of Middlefield is 2,754.
What is the Total Male Population of Middlefield?
Total Male Population of Middlefield is 1,136.
What is the Total Female Population of Middlefield?
Total Female Population of Middlefield is 1,618.
What is the Ratio of Males per 100 Females in Middlefield?
There are 70.21 Males per 100 Females in Middlefield.
What is the Ratio of Females per 100 Males in Middlefield?
There are 142.43 Females per 100 Males in Middlefield.
What is the Median Population Age in Middlefield?
Median Population Age in Middlefield is 48.7 Years.
What is the Average Family Size in Middlefield
Average Family Size in Middlefield is 3.0 People.
What is the Average Household Size in Middlefield
Average Household Size in Middlefield is 2.0 People.
How Large is the Labor Force in Middlefield?
There are 1,651 People in the Labor Forcein in Middlefield.
What is the Percentage of People in the Labor Force in Middlefield?
66.0% of People are in the Labor Force in Middlefield.
What is the Unemployment Rate in Middlefield?
Unemployment Rate in Middlefield is 10.9%.