Zip Codes with the Highest Percentage of Population with a Degree in Visual and Performing Arts in Hamilton, OH
RELATED REPORTS & OPTIONS
Visual and Performing Arts
Hamilton
Compare Zip Codes
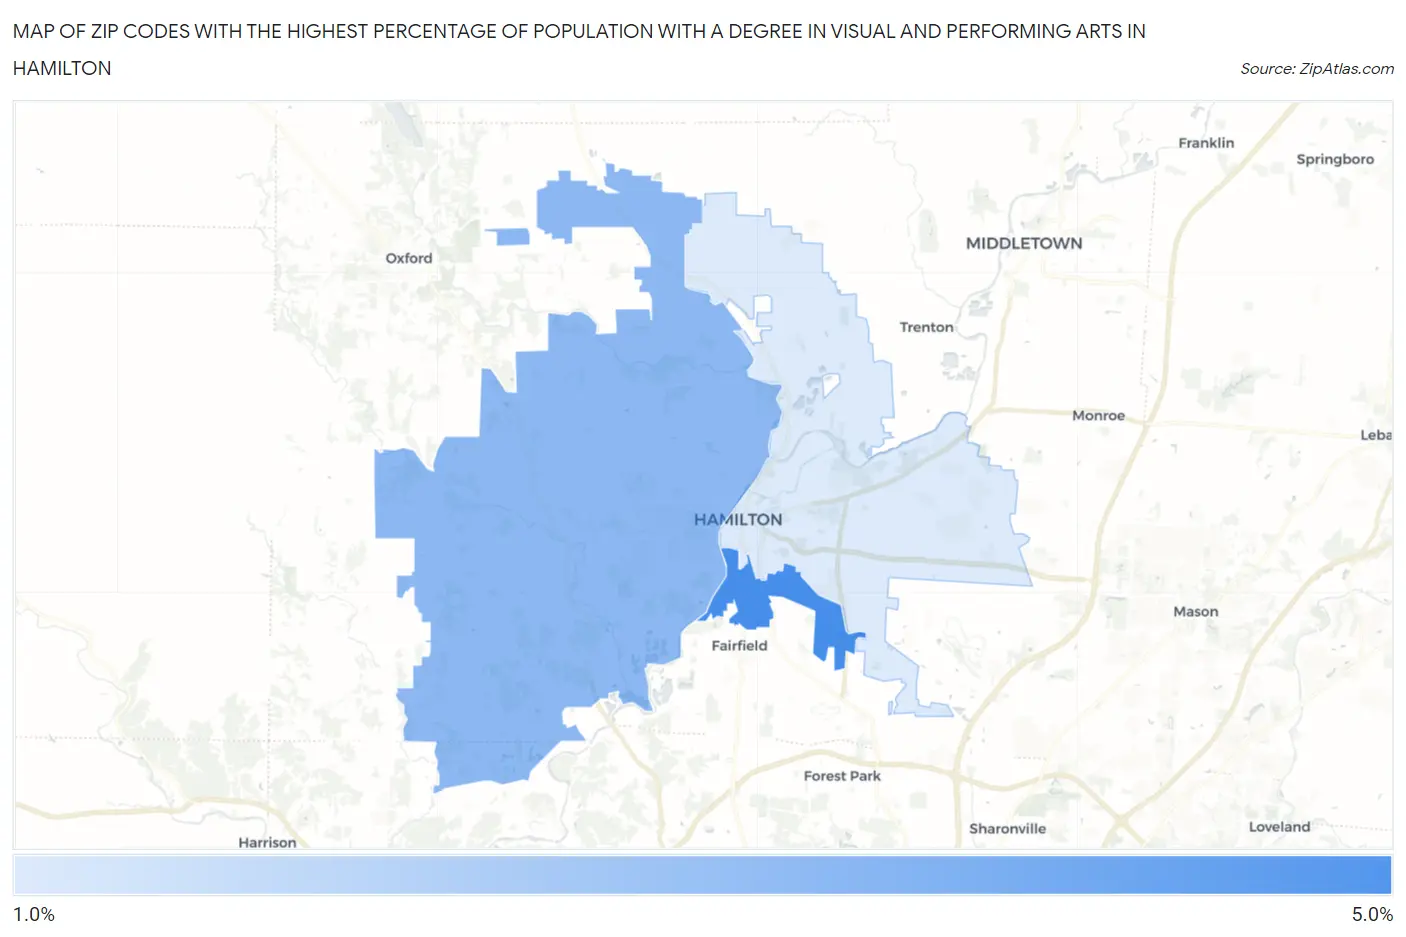
Map of Zip Codes with the Highest Percentage of Population with a Degree in Visual and Performing Arts in Hamilton
1.7%
4.9%
Zip Codes with the Highest Percentage of Population with a Degree in Visual and Performing Arts in Hamilton, OH
| Zip Code | % Graduates | vs State | vs National | |
| 1. | 45015 | 4.9% | 3.7%(+1.15)#247 | 4.3%(+0.607)#6,951 |
| 2. | 45013 | 3.4% | 3.7%(-0.336)#412 | 4.3%(-0.877)#11,327 |
| 3. | 45011 | 1.7% | 3.7%(-1.99)#642 | 4.3%(-2.53)#17,412 |
1
Common Questions
What are the Top Zip Codes with the Highest Percentage of Population with a Degree in Visual and Performing Arts in Hamilton, OH?
Top Zip Codes with the Highest Percentage of Population with a Degree in Visual and Performing Arts in Hamilton, OH are:
What zip code has the Highest Percentage of Population with a Degree in Visual and Performing Arts in Hamilton, OH?
45015 has the Highest Percentage of Population with a Degree in Visual and Performing Arts in Hamilton, OH with 4.9%.
What is the Percentage of Population with a Degree in Visual and Performing Arts in Hamilton, OH?
Percentage of Population with a Degree in Visual and Performing Arts in Hamilton is 4.1%.
What is the Percentage of Population with a Degree in Visual and Performing Arts in Ohio?
Percentage of Population with a Degree in Visual and Performing Arts in Ohio is 3.7%.
What is the Percentage of Population with a Degree in Visual and Performing Arts in the United States?
Percentage of Population with a Degree in Visual and Performing Arts in the United States is 4.3%.