Montezuma, OH Map & Demographics
Montezuma Map
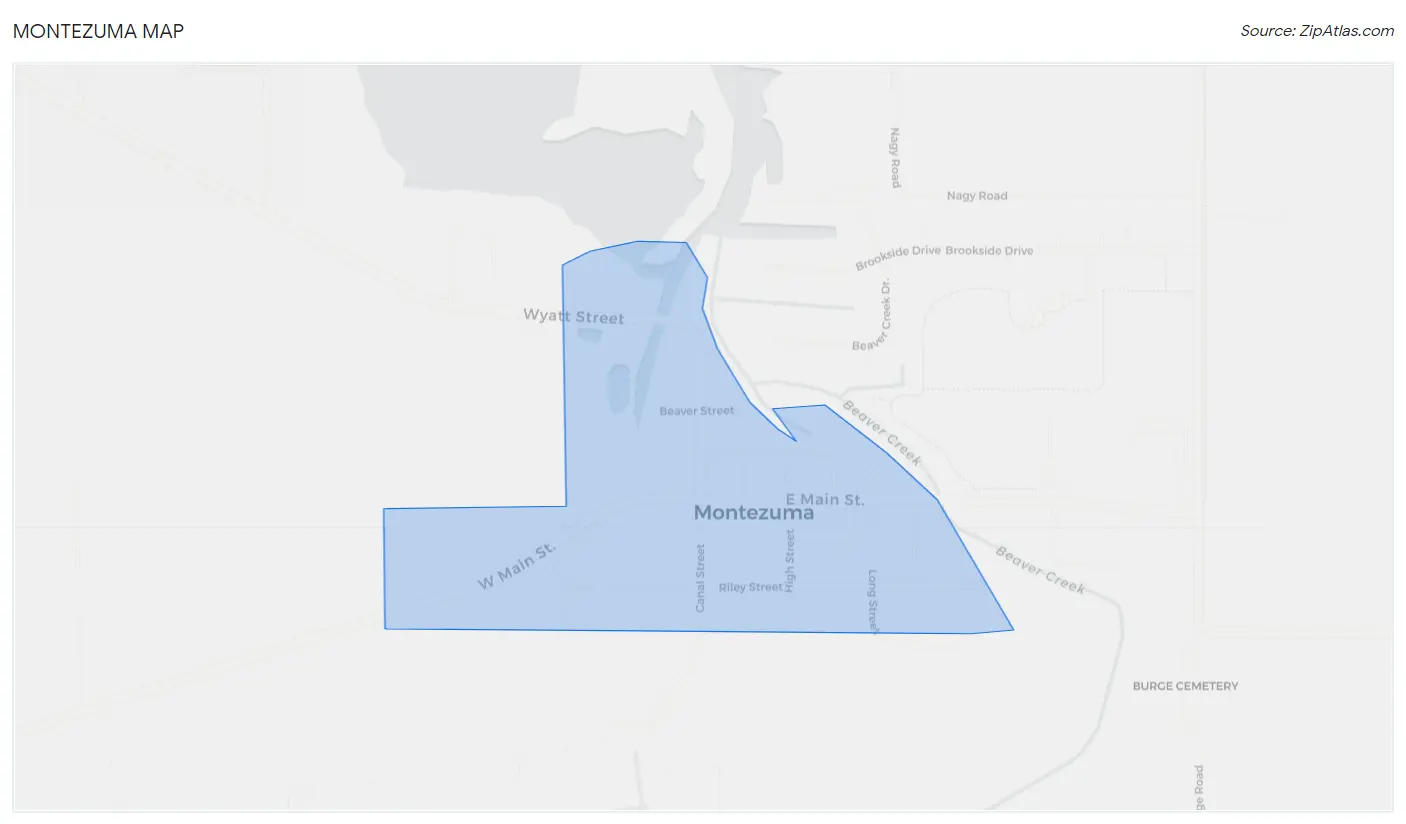
Montezuma Overview
$38,470
PER CAPITA INCOME
$87,656
AVG FAMILY INCOME
$73,125
AVG HOUSEHOLD INCOME
38.9%
WAGE / INCOME GAP [ % ]
61.1¢/ $1
WAGE / INCOME GAP [ $ ]
0.28
INEQUALITY / GINI INDEX
104
TOTAL POPULATION
56
MALE POPULATION
48
FEMALE POPULATION
116.67
MALES / 100 FEMALES
85.71
FEMALES / 100 MALES
59.3
MEDIAN AGE
2.2
AVG FAMILY SIZE
1.9
AVG HOUSEHOLD SIZE
46
LABOR FORCE [ PEOPLE ]
46.0%
PERCENT IN LABOR FORCE
4.3%
UNEMPLOYMENT RATE
Montezuma Zip Codes
Montezuma Area Codes
Income in Montezuma
Income Overview in Montezuma
Per Capita Income in Montezuma is $38,470, while median incomes of families and households are $87,656 and $73,125 respectively.
| Characteristic | Number | Measure |
| Per Capita Income | 104 | $38,470 |
| Median Family Income | 37 | $87,656 |
| Mean Family Income | 37 | $78,822 |
| Median Household Income | 55 | $73,125 |
| Mean Household Income | 55 | $67,044 |
| Income Deficit | 37 | $0 |
| Wage / Income Gap (%) | 104 | 38.89% |
| Wage / Income Gap ($) | 104 | 61.11¢ per $1 |
| Gini / Inequality Index | 104 | 0.28 |
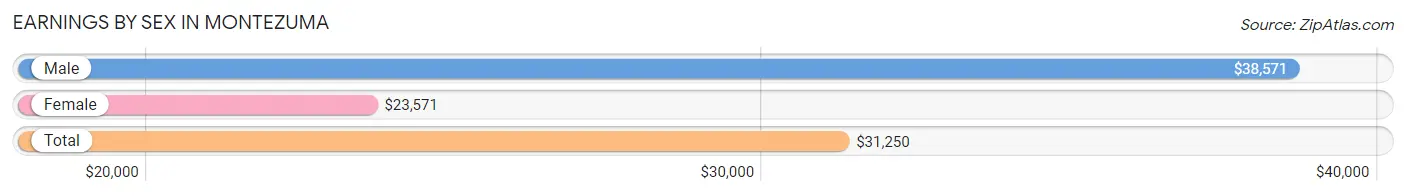
Earnings by Sex in Montezuma
Average Earnings in Montezuma are $31,250, $38,571 for men and $23,571 for women, a difference of 38.9%.
| Sex | Number | Average Earnings |
| Male | 34 (58.6%) | $38,571 |
| Female | 24 (41.4%) | $23,571 |
| Total | 58 (100.0%) | $31,250 |
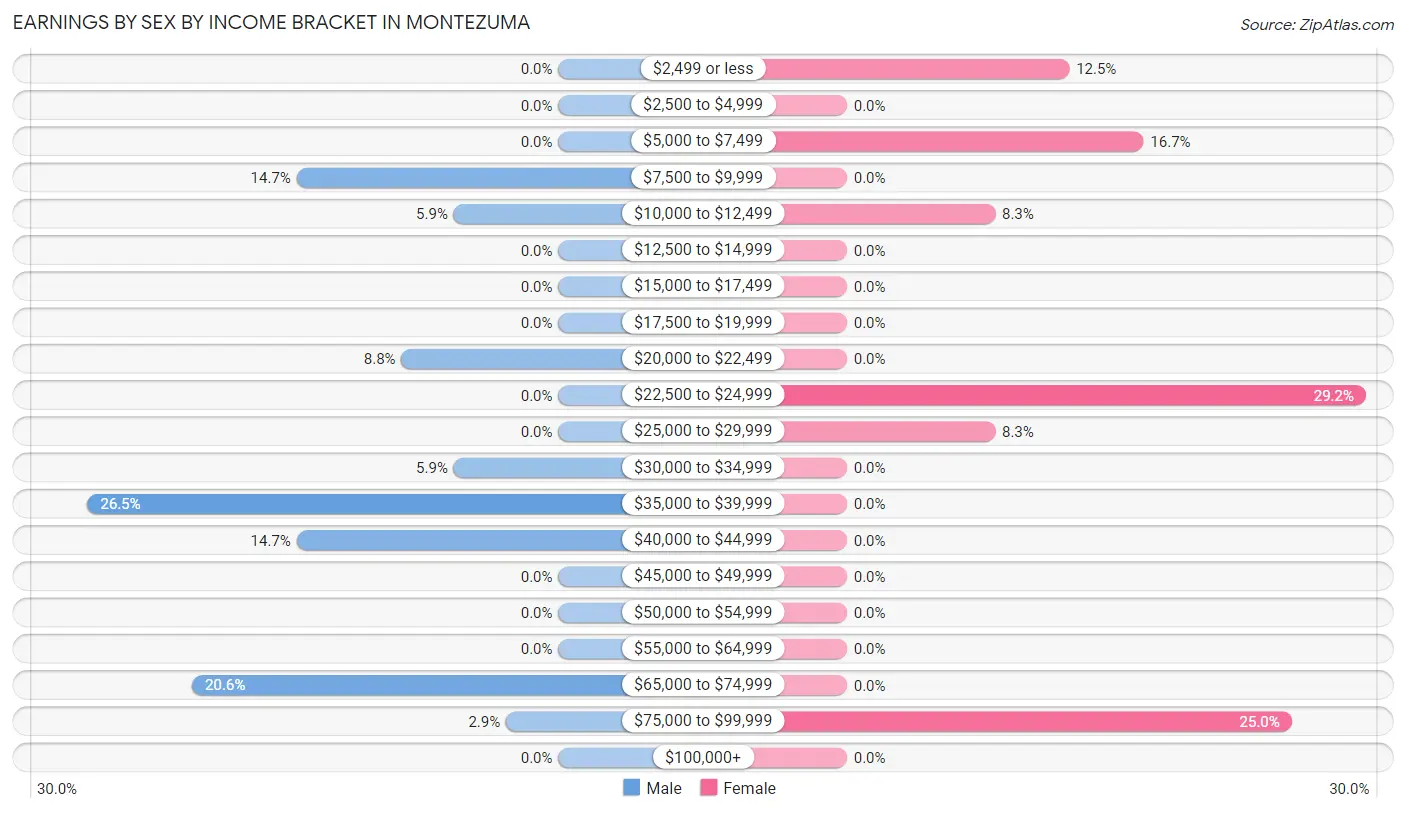
Earnings by Sex by Income Bracket in Montezuma
The most common earnings brackets in Montezuma are $35,000 to $39,999 for men (9 | 26.5%) and $22,500 to $24,999 for women (7 | 29.2%).
| Income | Male | Female |
| $2,499 or less | 0 (0.0%) | 3 (12.5%) |
| $2,500 to $4,999 | 0 (0.0%) | 0 (0.0%) |
| $5,000 to $7,499 | 0 (0.0%) | 4 (16.7%) |
| $7,500 to $9,999 | 5 (14.7%) | 0 (0.0%) |
| $10,000 to $12,499 | 2 (5.9%) | 2 (8.3%) |
| $12,500 to $14,999 | 0 (0.0%) | 0 (0.0%) |
| $15,000 to $17,499 | 0 (0.0%) | 0 (0.0%) |
| $17,500 to $19,999 | 0 (0.0%) | 0 (0.0%) |
| $20,000 to $22,499 | 3 (8.8%) | 0 (0.0%) |
| $22,500 to $24,999 | 0 (0.0%) | 7 (29.2%) |
| $25,000 to $29,999 | 0 (0.0%) | 2 (8.3%) |
| $30,000 to $34,999 | 2 (5.9%) | 0 (0.0%) |
| $35,000 to $39,999 | 9 (26.5%) | 0 (0.0%) |
| $40,000 to $44,999 | 5 (14.7%) | 0 (0.0%) |
| $45,000 to $49,999 | 0 (0.0%) | 0 (0.0%) |
| $50,000 to $54,999 | 0 (0.0%) | 0 (0.0%) |
| $55,000 to $64,999 | 0 (0.0%) | 0 (0.0%) |
| $65,000 to $74,999 | 7 (20.6%) | 0 (0.0%) |
| $75,000 to $99,999 | 1 (2.9%) | 6 (25.0%) |
| $100,000+ | 0 (0.0%) | 0 (0.0%) |
| Total | 34 (100.0%) | 24 (100.0%) |
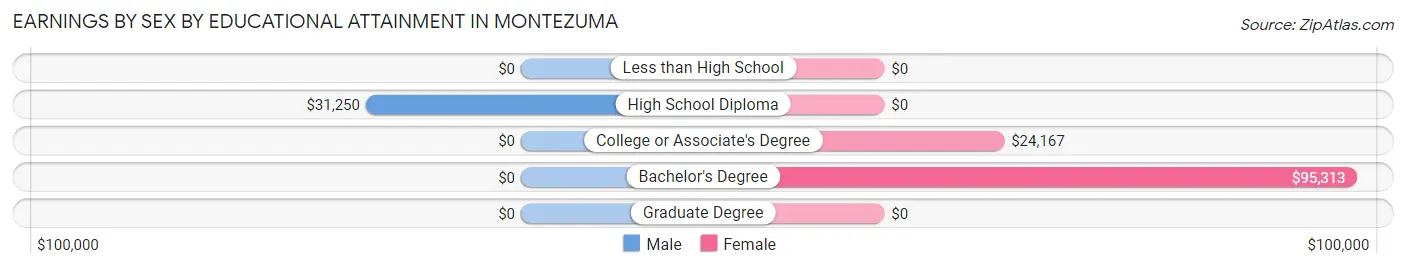
Earnings by Sex by Educational Attainment in Montezuma
Average earnings in Montezuma are $38,438 for men and $23,571 for women, a difference of 38.7%. Men with an educational attainment of high school diploma enjoy the highest average annual earnings of $31,250, while those with high school diploma education earn the least with $31,250. Women with an educational attainment of bachelor's degree earn the most with the average annual earnings of $95,313, while those with college or associate's degree education have the smallest earnings of $24,167.
| Educational Attainment | Male Income | Female Income |
| Less than High School | - | - |
| High School Diploma | $31,250 | $0 |
| College or Associate's Degree | - | - |
| Bachelor's Degree | - | - |
| Graduate Degree | - | - |
| Total | $38,438 | $23,571 |
Family Income in Montezuma
Family Income Brackets in Montezuma
According to the Montezuma family income data, there are 23 families falling into the $75,000 to $99,999 income range, which is the most common income bracket and makes up 62.2% of all families.
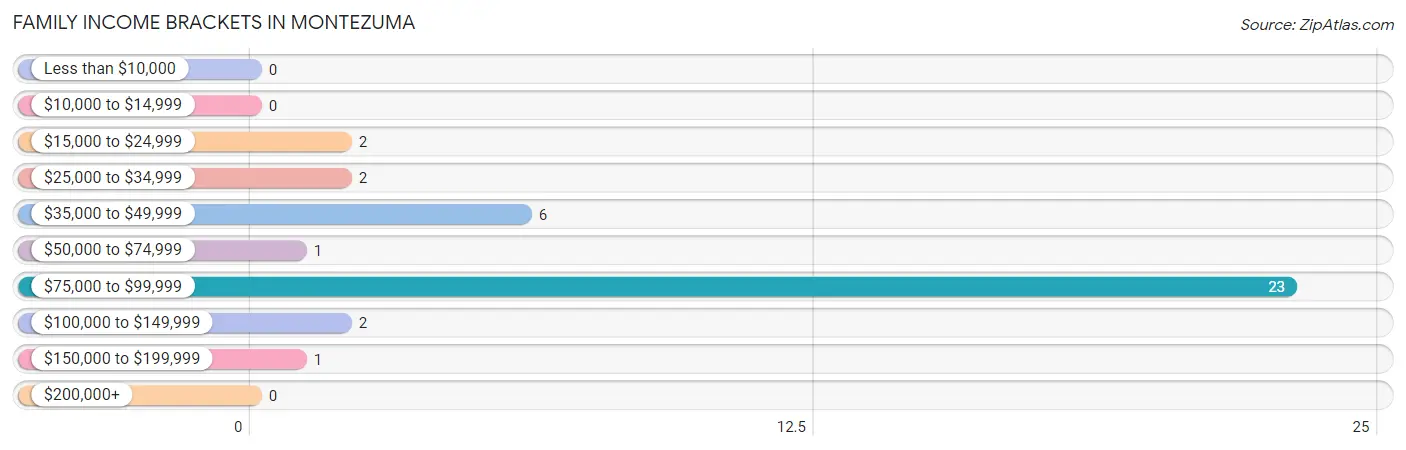
| Income Bracket | # Families | % Families |
| Less than $10,000 | 0 | 0.0% |
| $10,000 to $14,999 | 0 | 0.0% |
| $15,000 to $24,999 | 2 | 5.4% |
| $25,000 to $34,999 | 2 | 5.4% |
| $35,000 to $49,999 | 6 | 16.2% |
| $50,000 to $74,999 | 1 | 2.7% |
| $75,000 to $99,999 | 23 | 62.2% |
| $100,000 to $149,999 | 2 | 5.4% |
| $150,000 to $199,999 | 1 | 2.7% |
| $200,000+ | 0 | 0.0% |
Family Income by Famaliy Size in Montezuma
2-person families (32 | 86.5%) account for the highest median family income in Montezuma with $87,813 per family, while 2-person families (32 | 86.5%) have the highest median income of $43,906 per family member.
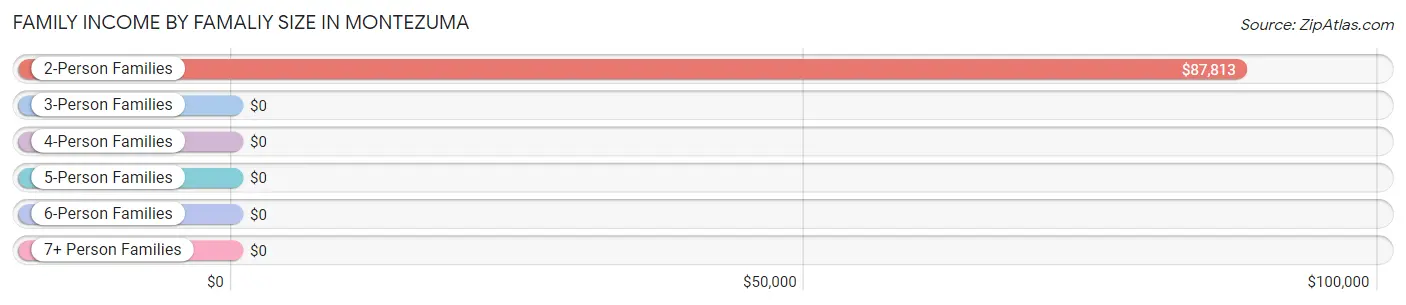
| Income Bracket | # Families | Median Income |
| 2-Person Families | 32 (86.5%) | $87,813 |
| 3-Person Families | 3 (8.1%) | $0 |
| 4-Person Families | 2 (5.4%) | $0 |
| 5-Person Families | 0 (0.0%) | $0 |
| 6-Person Families | 0 (0.0%) | $0 |
| 7+ Person Families | 0 (0.0%) | $0 |
| Total | 37 (100.0%) | $87,656 |
Family Income by Number of Earners in Montezuma
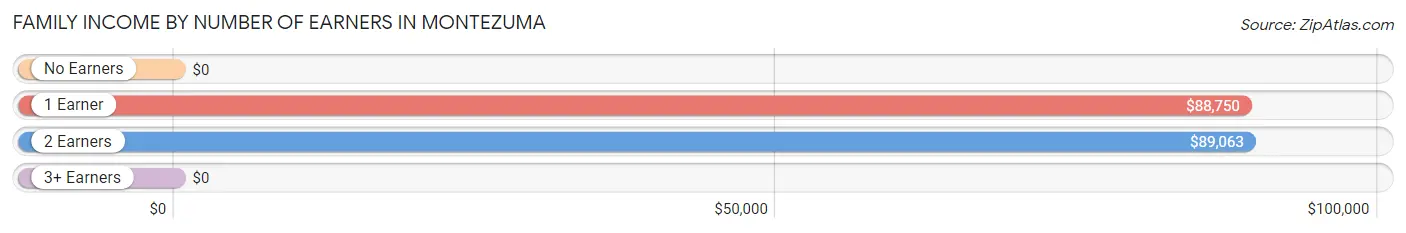
| Number of Earners | # Families | Median Income |
| No Earners | 8 (21.6%) | $0 |
| 1 Earner | 20 (54.0%) | $88,750 |
| 2 Earners | 9 (24.3%) | $89,063 |
| 3+ Earners | 0 (0.0%) | $0 |
| Total | 37 (100.0%) | $87,656 |
Household Income in Montezuma
Household Income Brackets in Montezuma
With 23 households falling in the category, the $75,000 to $99,999 income range is the most frequent in Montezuma, accounting for 41.8% of all households.
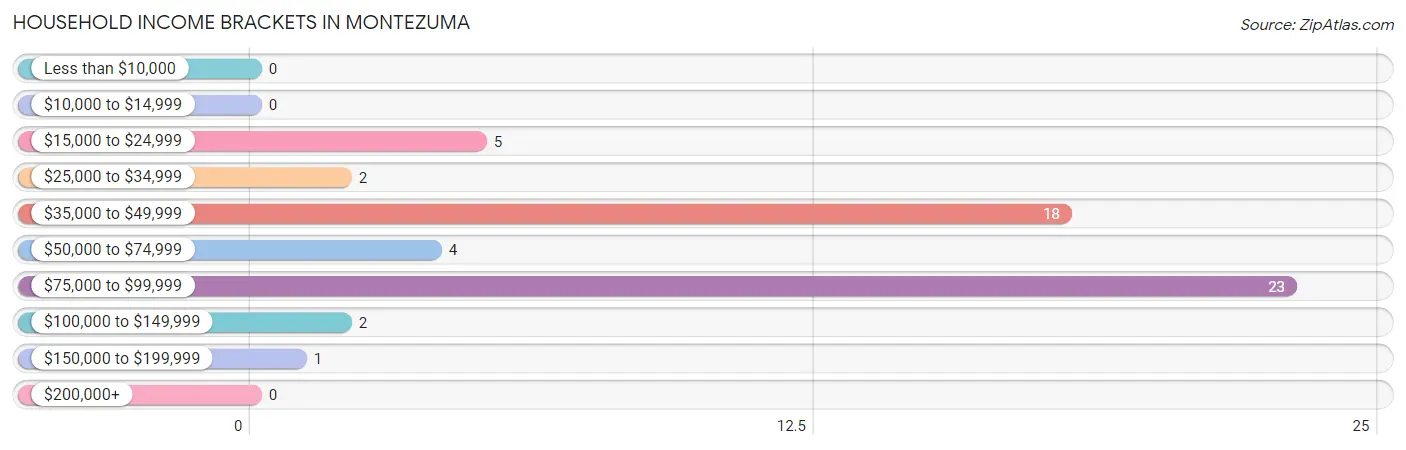
| Income Bracket | # Households | % Households |
| Less than $10,000 | 0 | 0.0% |
| $10,000 to $14,999 | 0 | 0.0% |
| $15,000 to $24,999 | 5 | 9.1% |
| $25,000 to $34,999 | 2 | 3.6% |
| $35,000 to $49,999 | 18 | 32.7% |
| $50,000 to $74,999 | 4 | 7.3% |
| $75,000 to $99,999 | 23 | 41.8% |
| $100,000 to $149,999 | 2 | 3.6% |
| $150,000 to $199,999 | 1 | 1.8% |
| $200,000+ | 0 | 0.0% |
Household Income by Householder Age in Montezuma
The median household income in Montezuma is $73,125, with the highest median household income of $76,667 found in the 45 to 64 years age bracket for the primary householder. A total of 22 households (40.0%) fall into this category. Meanwhile, the 15 to 24 years age bracket for the primary householder has the lowest median household income of $0, with 3 households (5.4%) in this group.
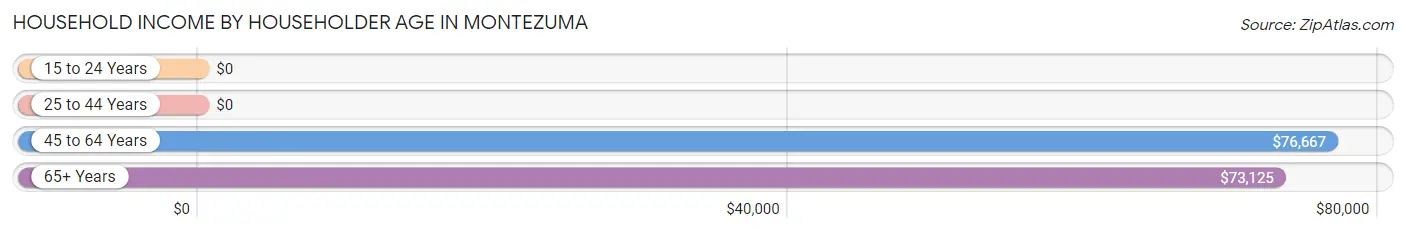
| Income Bracket | # Households | Median Income |
| 15 to 24 Years | 3 (5.4%) | $0 |
| 25 to 44 Years | 9 (16.4%) | $0 |
| 45 to 64 Years | 22 (40.0%) | $76,667 |
| 65+ Years | 21 (38.2%) | $73,125 |
| Total | 55 (100.0%) | $73,125 |
Poverty in Montezuma
Income Below Poverty by Sex and Age in Montezuma
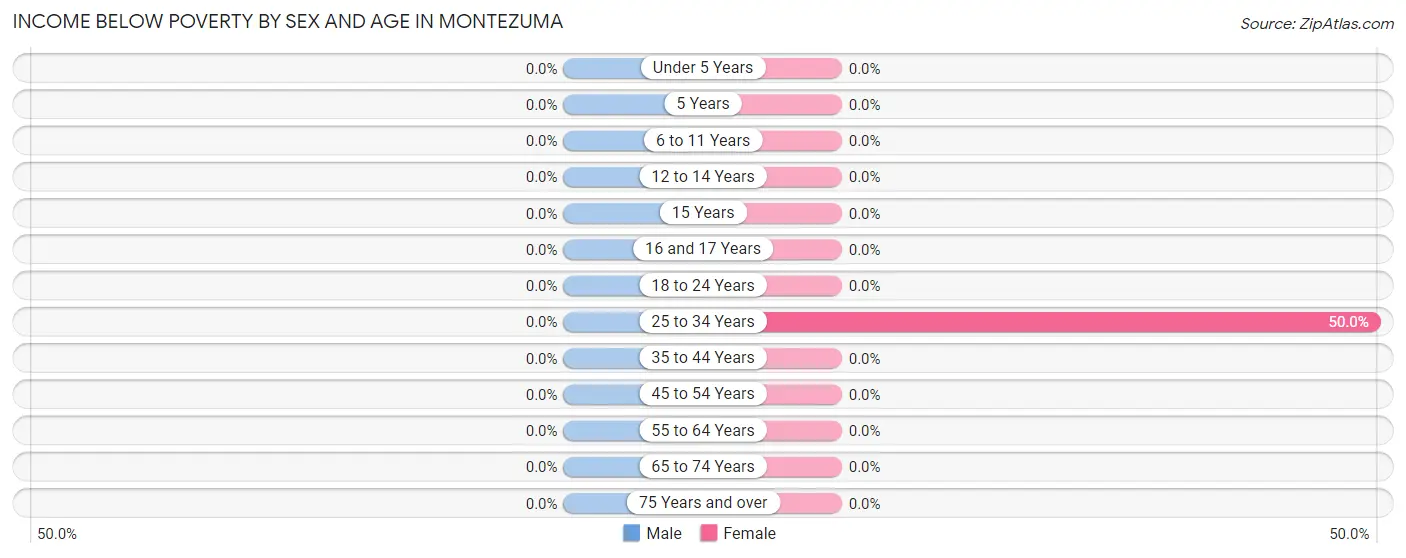
| Age Bracket | Male | Female |
| Under 5 Years | 0 (0.0%) | 0 (0.0%) |
| 5 Years | 0 (0.0%) | 0 (0.0%) |
| 6 to 11 Years | 0 (0.0%) | 0 (0.0%) |
| 12 to 14 Years | 0 (0.0%) | 0 (0.0%) |
| 15 Years | 0 (0.0%) | 0 (0.0%) |
| 16 and 17 Years | 0 (0.0%) | 0 (0.0%) |
| 18 to 24 Years | 0 (0.0%) | 0 (0.0%) |
| 25 to 34 Years | 0 (0.0%) | 2 (50.0%) |
| 35 to 44 Years | 0 (0.0%) | 0 (0.0%) |
| 45 to 54 Years | 0 (0.0%) | 0 (0.0%) |
| 55 to 64 Years | 0 (0.0%) | 0 (0.0%) |
| 65 to 74 Years | 0 (0.0%) | 0 (0.0%) |
| 75 Years and over | 0 (0.0%) | 0 (0.0%) |
| Total | 0 (0.0%) | 2 (4.2%) |
Income Above Poverty by Sex and Age in Montezuma
According to the poverty statistics in Montezuma, males aged under 5 years and females aged under 5 years are the age groups that are most secure financially, with 100.0% of males and 100.0% of females in these age groups living above the poverty line.
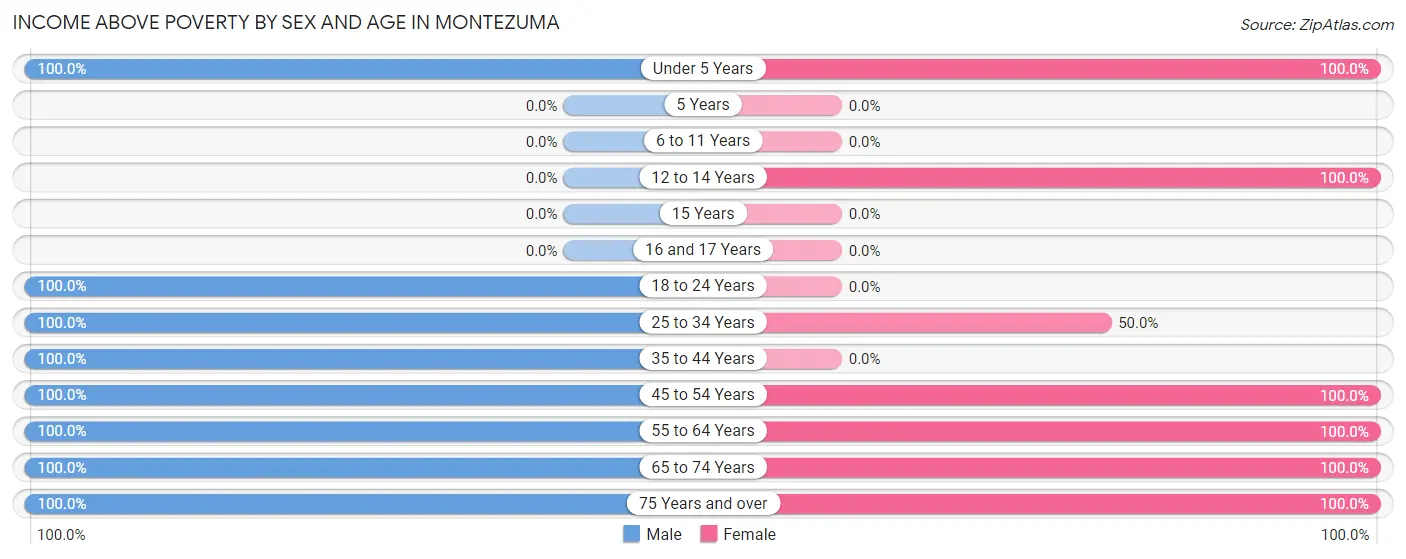
| Age Bracket | Male | Female |
| Under 5 Years | 1 (100.0%) | 2 (100.0%) |
| 5 Years | 0 (0.0%) | 0 (0.0%) |
| 6 to 11 Years | 0 (0.0%) | 0 (0.0%) |
| 12 to 14 Years | 0 (0.0%) | 1 (100.0%) |
| 15 Years | 0 (0.0%) | 0 (0.0%) |
| 16 and 17 Years | 0 (0.0%) | 0 (0.0%) |
| 18 to 24 Years | 3 (100.0%) | 0 (0.0%) |
| 25 to 34 Years | 8 (100.0%) | 2 (50.0%) |
| 35 to 44 Years | 4 (100.0%) | 0 (0.0%) |
| 45 to 54 Years | 4 (100.0%) | 6 (100.0%) |
| 55 to 64 Years | 21 (100.0%) | 17 (100.0%) |
| 65 to 74 Years | 12 (100.0%) | 15 (100.0%) |
| 75 Years and over | 3 (100.0%) | 3 (100.0%) |
| Total | 56 (100.0%) | 46 (95.8%) |
Income Below Poverty Among Married-Couple Families in Montezuma
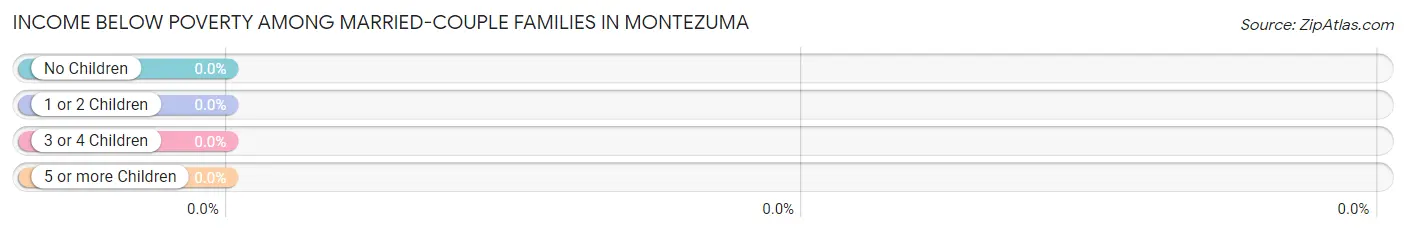
| Children | Above Poverty | Below Poverty |
| No Children | 28 (100.0%) | 0 (0.0%) |
| 1 or 2 Children | 4 (100.0%) | 0 (0.0%) |
| 3 or 4 Children | 0 (0.0%) | 0 (0.0%) |
| 5 or more Children | 0 (0.0%) | 0 (0.0%) |
| Total | 32 (100.0%) | 0 (0.0%) |
Income Below Poverty Among Single-Parent Households in Montezuma
| Children | Single Father | Single Mother |
| No Children | 0 (0.0%) | 0 (0.0%) |
| 1 or 2 Children | 0 (0.0%) | 0 (0.0%) |
| 3 or 4 Children | 0 (0.0%) | 0 (0.0%) |
| 5 or more Children | 0 (0.0%) | 0 (0.0%) |
| Total | 0 (0.0%) | 0 (0.0%) |
Income Below Poverty Among Married-Couple vs Single-Parent Households in Montezuma
| Children | Married-Couple Families | Single-Parent Households |
| No Children | 0 (0.0%) | 0 (0.0%) |
| 1 or 2 Children | 0 (0.0%) | 0 (0.0%) |
| 3 or 4 Children | 0 (0.0%) | 0 (0.0%) |
| 5 or more Children | 0 (0.0%) | 0 (0.0%) |
| Total | 0 (0.0%) | 0 (0.0%) |
Race in Montezuma
The most populous races in Montezuma are , and White / Caucasian (104 | 100.0%).
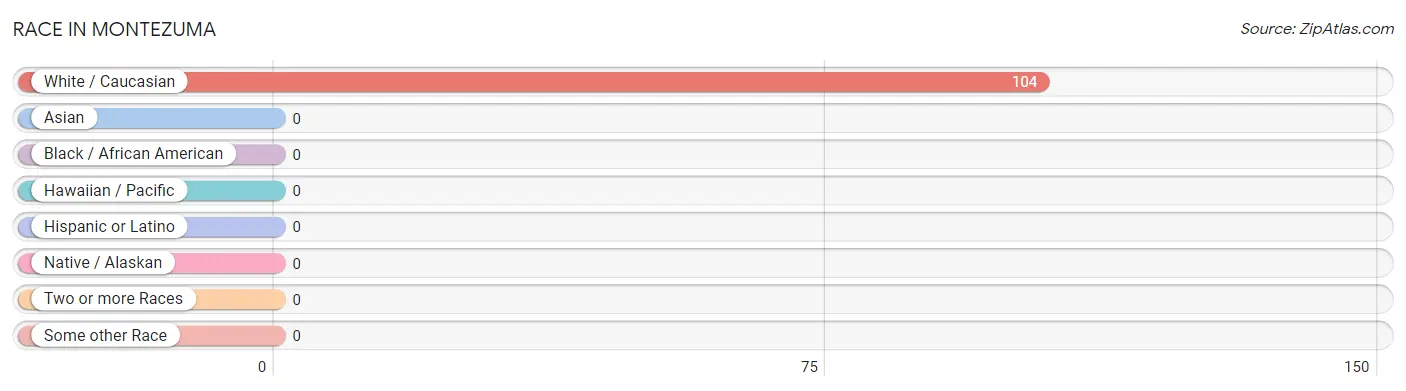
| Race | # Population | % Population |
| Asian | 0 | 0.0% |
| Black / African American | 0 | 0.0% |
| Hawaiian / Pacific | 0 | 0.0% |
| Hispanic or Latino | 0 | 0.0% |
| Native / Alaskan | 0 | 0.0% |
| White / Caucasian | 104 | 100.0% |
| Two or more Races | 0 | 0.0% |
| Some other Race | 0 | 0.0% |
| Total | 104 | 100.0% |
Ancestry in Montezuma
The most populous ancestries reported in Montezuma are German (58 | 55.8%), Irish (13 | 12.5%), English (11 | 10.6%), Polish (6 | 5.8%), and Welsh (4 | 3.8%), together accounting for 88.5% of all Montezuma residents.
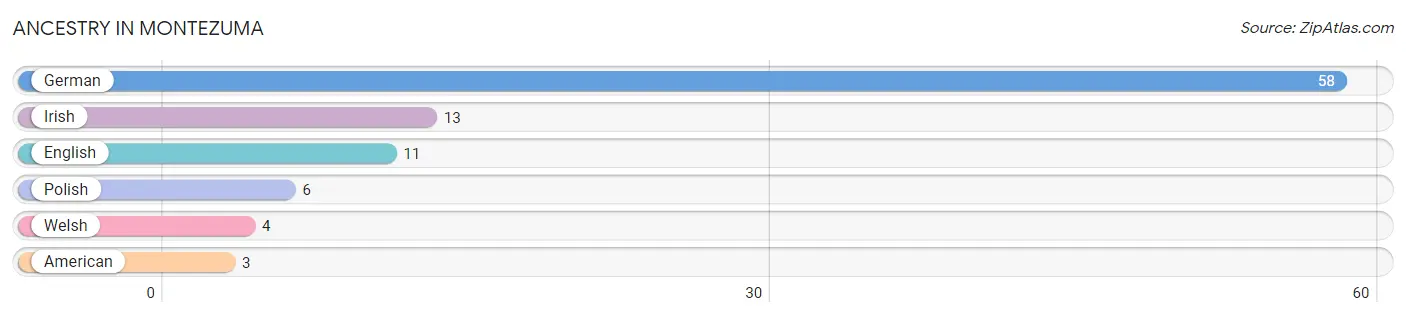
| Ancestry | # Population | % Population |
| American | 3 | 2.9% |
| English | 11 | 10.6% |
| German | 58 | 55.8% |
| Irish | 13 | 12.5% |
| Polish | 6 | 5.8% |
| Welsh | 4 | 3.8% | View All 6 Rows |
Immigrants in Montezuma

| Immigration Origin | # Population | % Population | View All 0 Rows |
Sex and Age in Montezuma
Sex and Age in Montezuma
The most populous age groups in Montezuma are 55 to 59 Years (11 | 19.6%) for men and 55 to 59 Years (17 | 35.4%) for women.
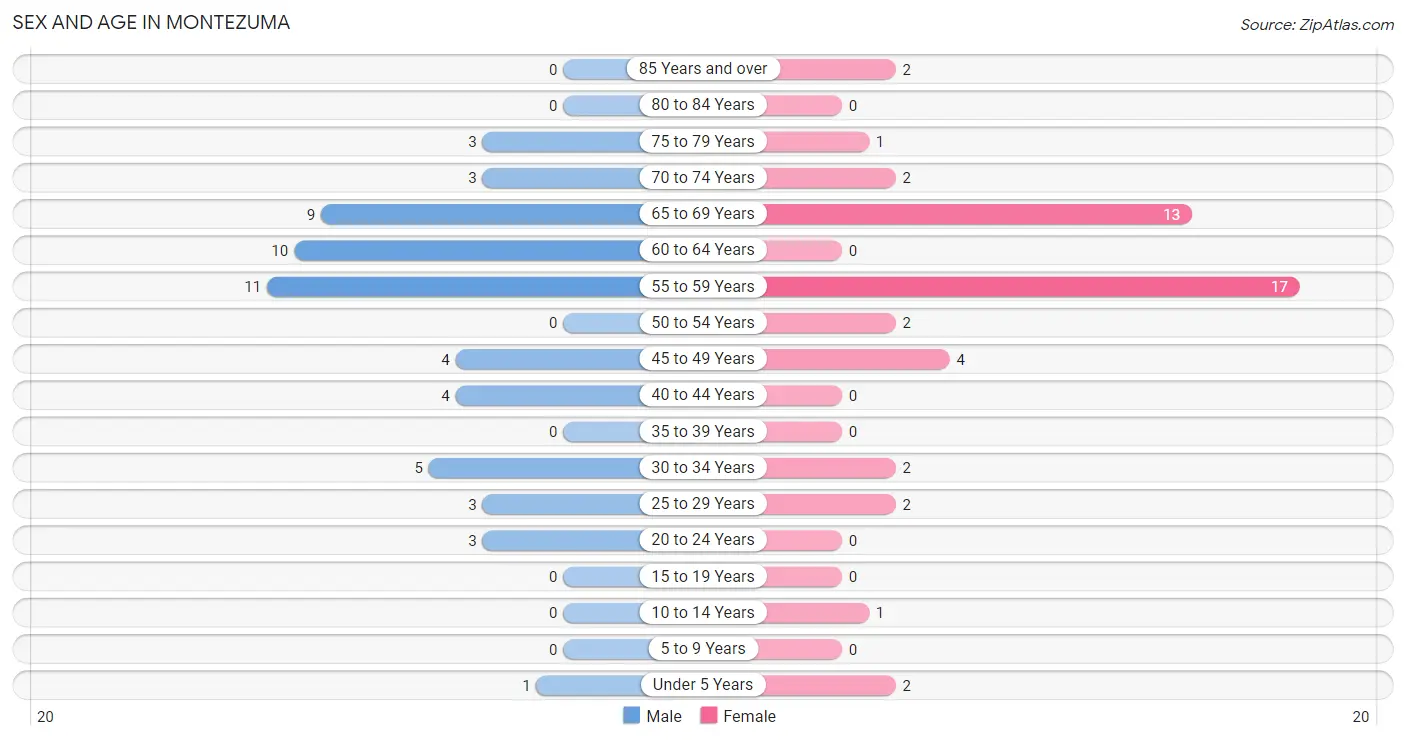
| Age Bracket | Male | Female |
| Under 5 Years | 1 (1.8%) | 2 (4.2%) |
| 5 to 9 Years | 0 (0.0%) | 0 (0.0%) |
| 10 to 14 Years | 0 (0.0%) | 1 (2.1%) |
| 15 to 19 Years | 0 (0.0%) | 0 (0.0%) |
| 20 to 24 Years | 3 (5.4%) | 0 (0.0%) |
| 25 to 29 Years | 3 (5.4%) | 2 (4.2%) |
| 30 to 34 Years | 5 (8.9%) | 2 (4.2%) |
| 35 to 39 Years | 0 (0.0%) | 0 (0.0%) |
| 40 to 44 Years | 4 (7.1%) | 0 (0.0%) |
| 45 to 49 Years | 4 (7.1%) | 4 (8.3%) |
| 50 to 54 Years | 0 (0.0%) | 2 (4.2%) |
| 55 to 59 Years | 11 (19.6%) | 17 (35.4%) |
| 60 to 64 Years | 10 (17.9%) | 0 (0.0%) |
| 65 to 69 Years | 9 (16.1%) | 13 (27.1%) |
| 70 to 74 Years | 3 (5.4%) | 2 (4.2%) |
| 75 to 79 Years | 3 (5.4%) | 1 (2.1%) |
| 80 to 84 Years | 0 (0.0%) | 0 (0.0%) |
| 85 Years and over | 0 (0.0%) | 2 (4.2%) |
| Total | 56 (100.0%) | 48 (100.0%) |
Families and Households in Montezuma
Median Family Size in Montezuma
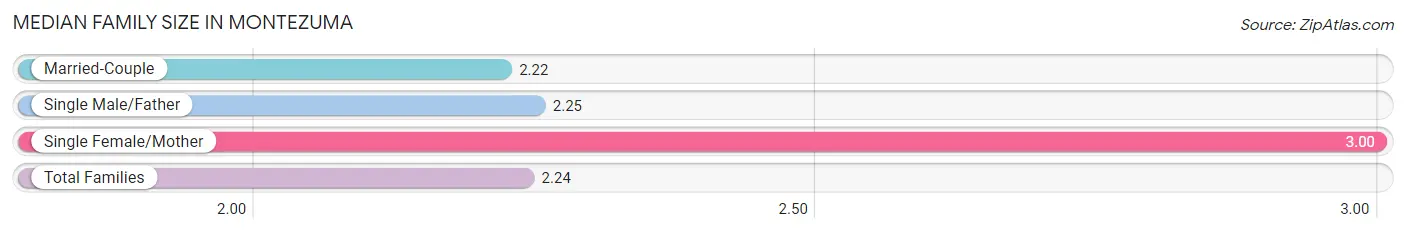
The median family size in Montezuma is 2.24 persons per family, with single female/mother families (1 | 2.7%) accounting for the largest median family size of 3 persons per family. On the other hand, married-couple families (32 | 86.5%) represent the smallest median family size with 2.22 persons per family.
| Family Type | # Families | Family Size |
| Married-Couple | 32 (86.5%) | 2.22 |
| Single Male/Father | 4 (10.8%) | 2.25 |
| Single Female/Mother | 1 (2.7%) | 3.00 |
| Total Families | 37 (100.0%) | 2.24 |
Median Household Size in Montezuma
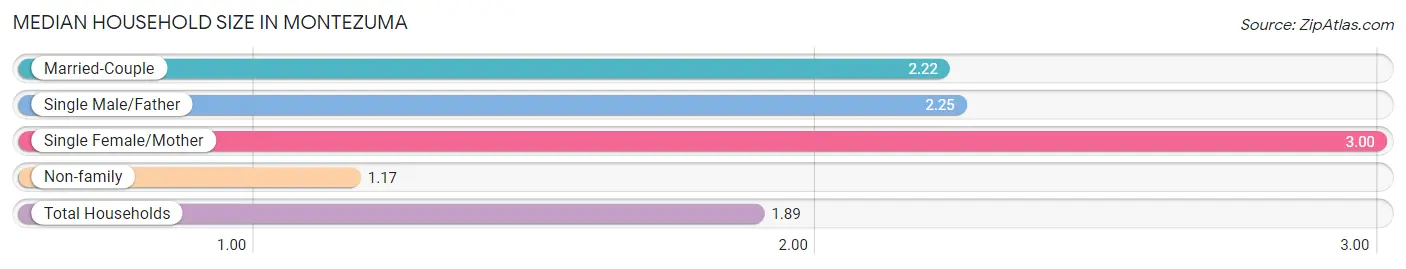
The median household size in Montezuma is 1.89 persons per household, with single female/mother households (1 | 1.8%) accounting for the largest median household size of 3 persons per household. non-family households (18 | 32.7%) represent the smallest median household size with 1.17 persons per household.
| Household Type | # Households | Household Size |
| Married-Couple | 32 (58.2%) | 2.22 |
| Single Male/Father | 4 (7.3%) | 2.25 |
| Single Female/Mother | 1 (1.8%) | 3.00 |
| Non-family | 18 (32.7%) | 1.17 |
| Total Households | 55 (100.0%) | 1.89 |
Household Size by Marriage Status in Montezuma
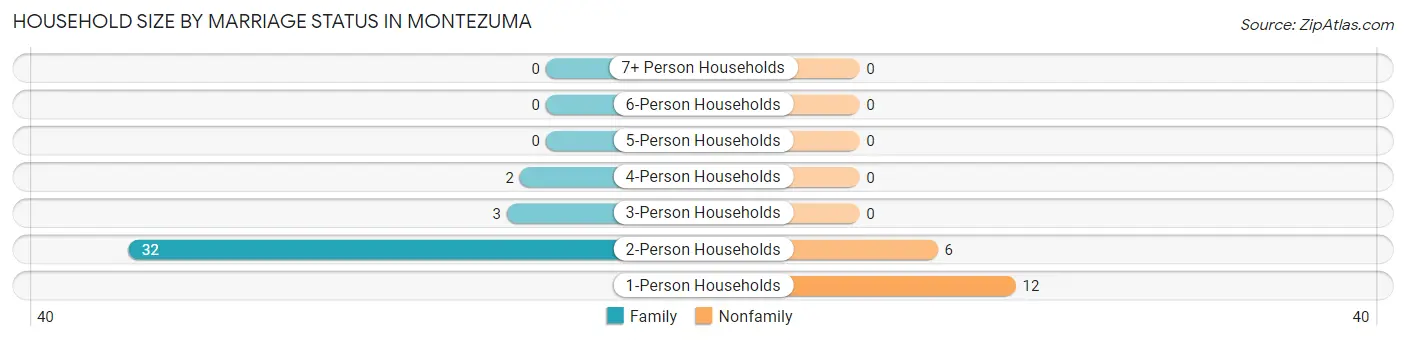
Out of a total of 55 households in Montezuma, 37 (67.3%) are family households, while 18 (32.7%) are nonfamily households. The most numerous type of family households are 2-person households, comprising 32, and the most common type of nonfamily households are 1-person households, comprising 12.
| Household Size | Family Households | Nonfamily Households |
| 1-Person Households | - | 12 (21.8%) |
| 2-Person Households | 32 (58.2%) | 6 (10.9%) |
| 3-Person Households | 3 (5.4%) | 0 (0.0%) |
| 4-Person Households | 2 (3.6%) | 0 (0.0%) |
| 5-Person Households | 0 (0.0%) | 0 (0.0%) |
| 6-Person Households | 0 (0.0%) | 0 (0.0%) |
| 7+ Person Households | 0 (0.0%) | 0 (0.0%) |
| Total | 37 (67.3%) | 18 (32.7%) |
Female Fertility in Montezuma
Fertility by Age in Montezuma
| Age Bracket | Women with Births | Births / 1,000 Women |
| 15 to 19 years | 0 (0.0%) | 0.0 |
| 20 to 34 years | 0 (0.0%) | 0.0 |
| 35 to 50 years | 0 (0.0%) | 0.0 |
| Total | 0 (0.0%) | 0.0 |
Fertility by Age by Marriage Status in Montezuma
| Age Bracket | Married | Unmarried |
| 15 to 19 years | 0 (0.0%) | 0 (0.0%) |
| 20 to 34 years | 0 (0.0%) | 0 (0.0%) |
| 35 to 50 years | 0 (0.0%) | 0 (0.0%) |
| Total | 0 (0.0%) | 0 (0.0%) |
Fertility by Education in Montezuma
| Educational Attainment | Women with Births | Births / 1,000 Women |
| Less than High School | 0 (0.0%) | 0.0 |
| High School Diploma | 0 (0.0%) | 0.0 |
| College or Associate's Degree | 0 (0.0%) | 0.0 |
| Bachelor's Degree | 0 (0.0%) | 0.0 |
| Graduate Degree | 0 (0.0%) | 0.0 |
| Total | 0 (0.0%) | 0.0 |
Fertility by Education by Marriage Status in Montezuma
| Educational Attainment | Married | Unmarried |
| Less than High School | 0 (0.0%) | 0 (0.0%) |
| High School Diploma | 0 (0.0%) | 0 (0.0%) |
| College or Associate's Degree | 0 (0.0%) | 0 (0.0%) |
| Bachelor's Degree | 0 (0.0%) | 0 (0.0%) |
| Graduate Degree | 0 (0.0%) | 0 (0.0%) |
| Total | 0 (0.0%) | 0 (0.0%) |
Employment Characteristics in Montezuma
Employment by Class of Employer in Montezuma
Among the 44 employed individuals in Montezuma, private company employees (40 | 90.9%), self-employed (not incorporated) (2 | 4.5%), and local government employees (2 | 4.5%) make up the most common classes of employment.
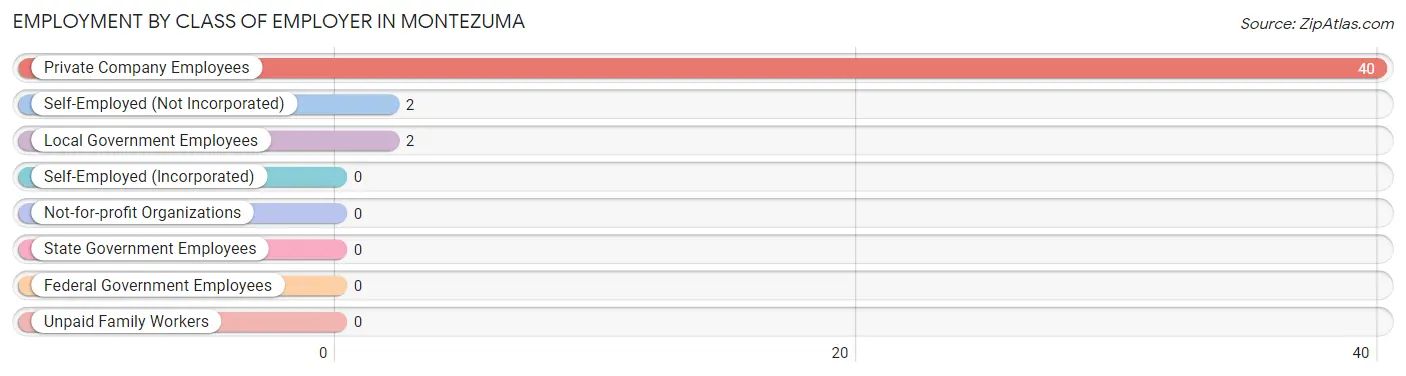
| Employer Class | # Employees | % Employees |
| Private Company Employees | 40 | 90.9% |
| Self-Employed (Incorporated) | 0 | 0.0% |
| Self-Employed (Not Incorporated) | 2 | 4.5% |
| Not-for-profit Organizations | 0 | 0.0% |
| Local Government Employees | 2 | 4.5% |
| State Government Employees | 0 | 0.0% |
| Federal Government Employees | 0 | 0.0% |
| Unpaid Family Workers | 0 | 0.0% |
| Total | 44 | 100.0% |
Employment Status by Age in Montezuma
According to the labor force statistics for Montezuma, out of the total population over 16 years of age (100), 46.0% or 46 individuals are in the labor force, with 4.3% or 2 of them unemployed. The age group with the highest labor force participation rate is 20 to 24 years, with 100.0% or 3 individuals in the labor force. Within the labor force, the 25 to 29 years age range has the highest percentage of unemployed individuals, with 40.0% or 2 of them being unemployed.
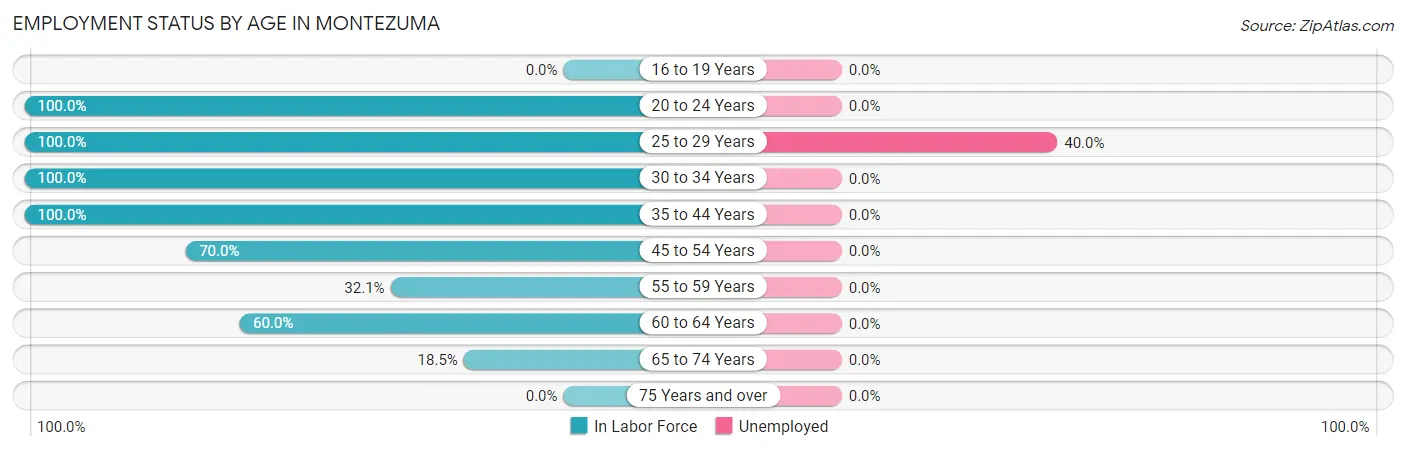
| Age Bracket | In Labor Force | Unemployed |
| 16 to 19 Years | 0 (0.0%) | 0 (0.0%) |
| 20 to 24 Years | 3 (100.0%) | 0 (0.0%) |
| 25 to 29 Years | 5 (100.0%) | 2 (40.0%) |
| 30 to 34 Years | 7 (100.0%) | 0 (0.0%) |
| 35 to 44 Years | 4 (100.0%) | 0 (0.0%) |
| 45 to 54 Years | 7 (70.0%) | 0 (0.0%) |
| 55 to 59 Years | 9 (32.1%) | 0 (0.0%) |
| 60 to 64 Years | 6 (60.0%) | 0 (0.0%) |
| 65 to 74 Years | 5 (18.5%) | 0 (0.0%) |
| 75 Years and over | 0 (0.0%) | 0 (0.0%) |
| Total | 46 (46.0%) | 2 (4.3%) |
Employment Status by Educational Attainment in Montezuma
According to labor force statistics for Montezuma, 59.4% of individuals (38) out of the total population between 25 and 64 years of age (64) are in the labor force, with 5.3% or 2 of them being unemployed. The group with the highest labor force participation rate are those with the educational attainment of high school diploma, with 74.2% or 23 individuals in the labor force. Within the labor force, individuals with high school diploma education have the highest percentage of unemployment, with 8.7% or 2 of them being unemployed.
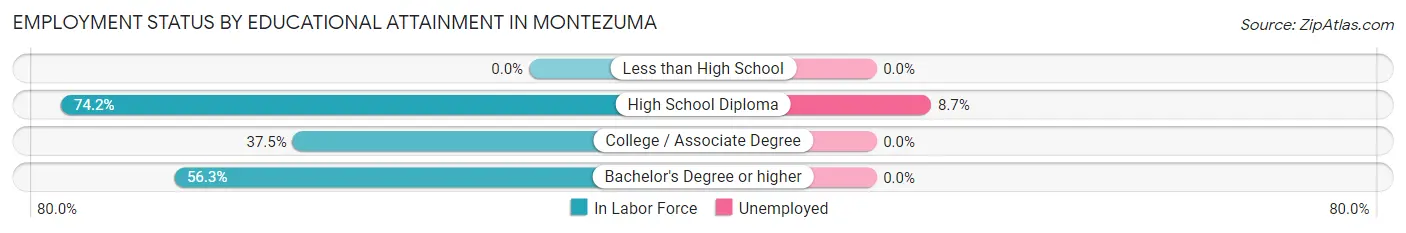
| Educational Attainment | In Labor Force | Unemployed |
| Less than High School | 0 (0.0%) | 0 (0.0%) |
| High School Diploma | 23 (74.2%) | 3 (8.7%) |
| College / Associate Degree | 6 (37.5%) | 0 (0.0%) |
| Bachelor's Degree or higher | 9 (56.3%) | 0 (0.0%) |
| Total | 38 (59.4%) | 3 (5.3%) |
Employment Occupations by Sex in Montezuma
Management, Business, Science and Arts Occupations
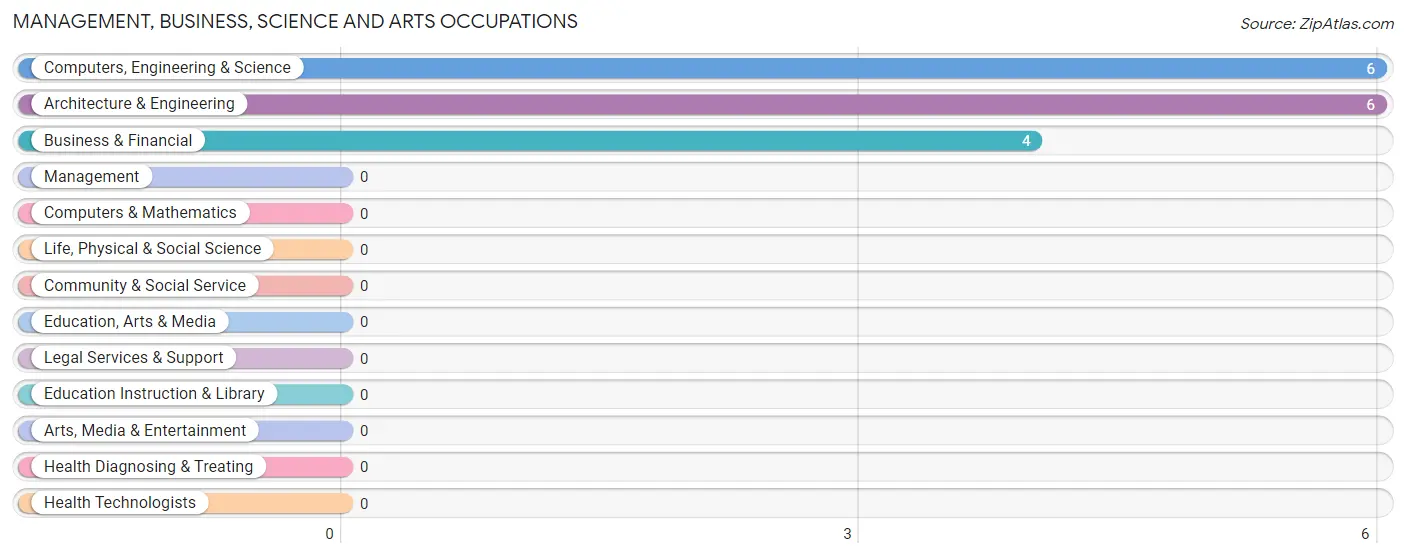
The most common Management, Business, Science and Arts occupations in Montezuma are Computers, Engineering & Science (6 | 13.6%), Architecture & Engineering (6 | 13.6%), and Business & Financial (4 | 9.1%).
Management, Business, Science and Arts Occupations by Sex
Within the Management, Business, Science and Arts occupations in Montezuma, the most male-oriented occupations are Computers, Engineering & Science (66.7%), and Architecture & Engineering (66.7%), while the most female-oriented occupations are Business & Financial (100.0%), Computers, Engineering & Science (33.3%), and Architecture & Engineering (33.3%).
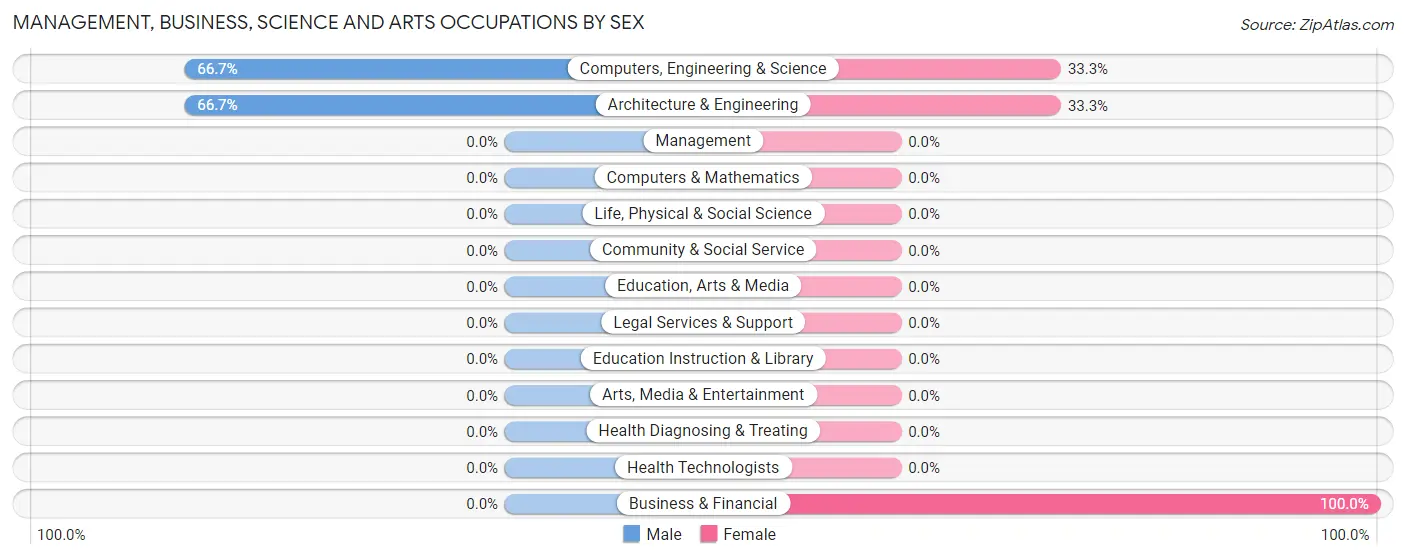
| Occupation | Male | Female |
| Management | 0 (0.0%) | 0 (0.0%) |
| Business & Financial | 0 (0.0%) | 4 (100.0%) |
| Computers, Engineering & Science | 4 (66.7%) | 2 (33.3%) |
| Computers & Mathematics | 0 (0.0%) | 0 (0.0%) |
| Architecture & Engineering | 4 (66.7%) | 2 (33.3%) |
| Life, Physical & Social Science | 0 (0.0%) | 0 (0.0%) |
| Community & Social Service | 0 (0.0%) | 0 (0.0%) |
| Education, Arts & Media | 0 (0.0%) | 0 (0.0%) |
| Legal Services & Support | 0 (0.0%) | 0 (0.0%) |
| Education Instruction & Library | 0 (0.0%) | 0 (0.0%) |
| Arts, Media & Entertainment | 0 (0.0%) | 0 (0.0%) |
| Health Diagnosing & Treating | 0 (0.0%) | 0 (0.0%) |
| Health Technologists | 0 (0.0%) | 0 (0.0%) |
| Total (Category) | 4 (40.0%) | 6 (60.0%) |
| Total (Overall) | 23 (52.3%) | 21 (47.7%) |
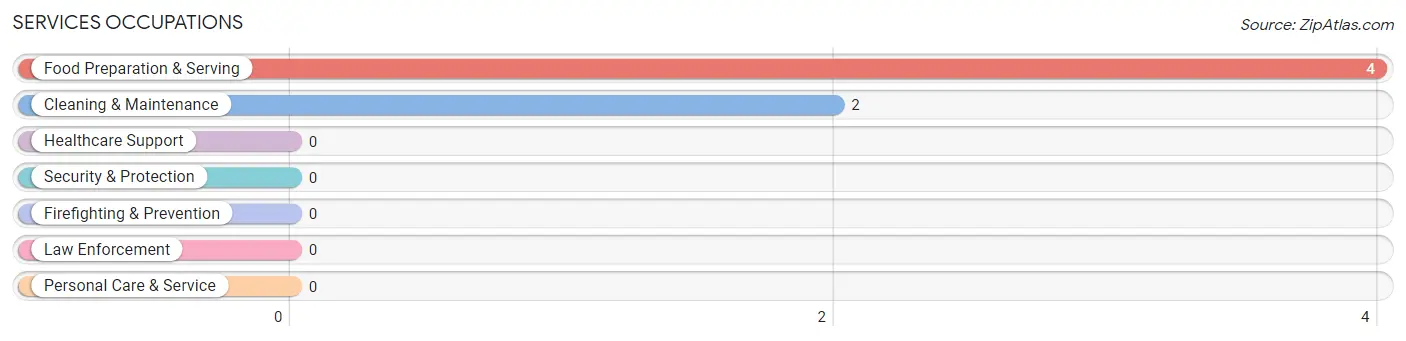
Services Occupations
The most common Services occupations in Montezuma are Food Preparation & Serving (4 | 9.1%), and Cleaning & Maintenance (2 | 4.5%).
Services Occupations by Sex
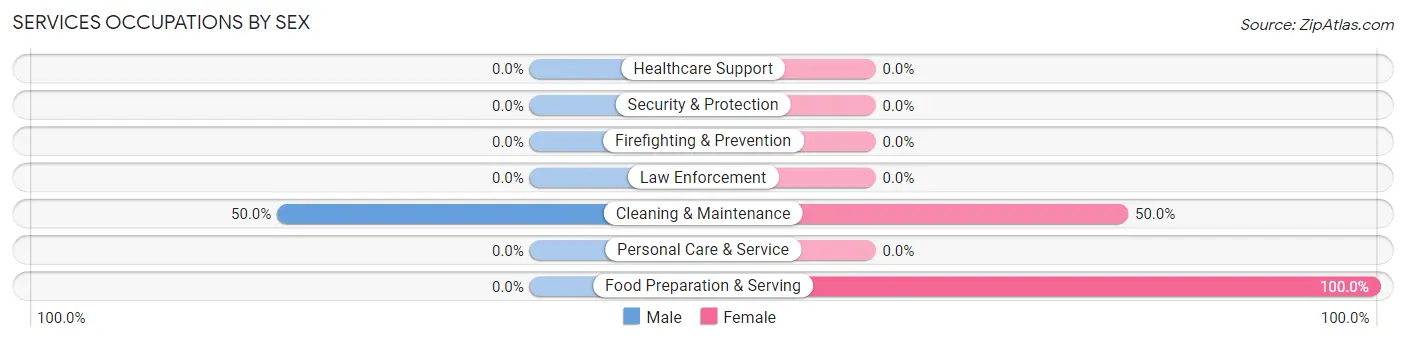
| Occupation | Male | Female |
| Healthcare Support | 0 (0.0%) | 0 (0.0%) |
| Security & Protection | 0 (0.0%) | 0 (0.0%) |
| Firefighting & Prevention | 0 (0.0%) | 0 (0.0%) |
| Law Enforcement | 0 (0.0%) | 0 (0.0%) |
| Food Preparation & Serving | 0 (0.0%) | 4 (100.0%) |
| Cleaning & Maintenance | 1 (50.0%) | 1 (50.0%) |
| Personal Care & Service | 0 (0.0%) | 0 (0.0%) |
| Total (Category) | 1 (16.7%) | 5 (83.3%) |
| Total (Overall) | 23 (52.3%) | 21 (47.7%) |
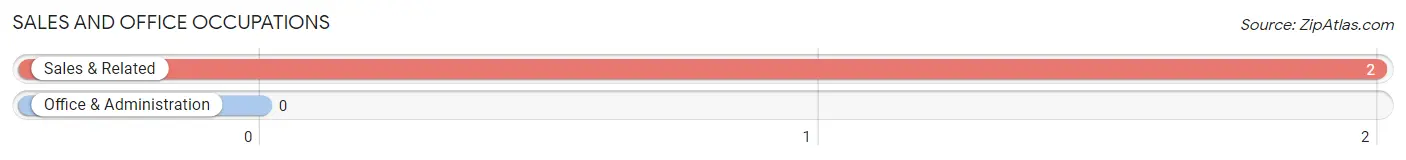
Sales and Office Occupations
The most common Sales and Office occupations in Montezuma are , and Sales & Related (2 | 4.5%).
Sales and Office Occupations by Sex
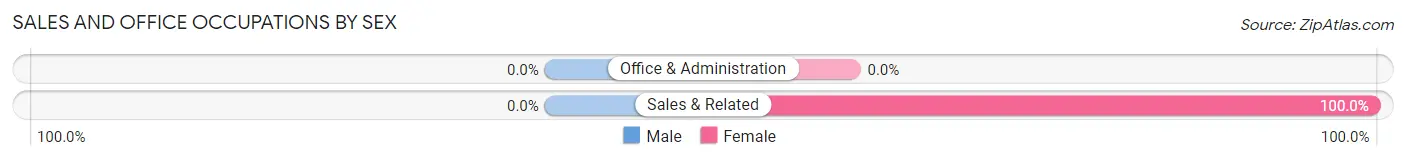
| Occupation | Male | Female |
| Sales & Related | 0 (0.0%) | 2 (100.0%) |
| Office & Administration | 0 (0.0%) | 0 (0.0%) |
| Total (Category) | 0 (0.0%) | 2 (100.0%) |
| Total (Overall) | 23 (52.3%) | 21 (47.7%) |
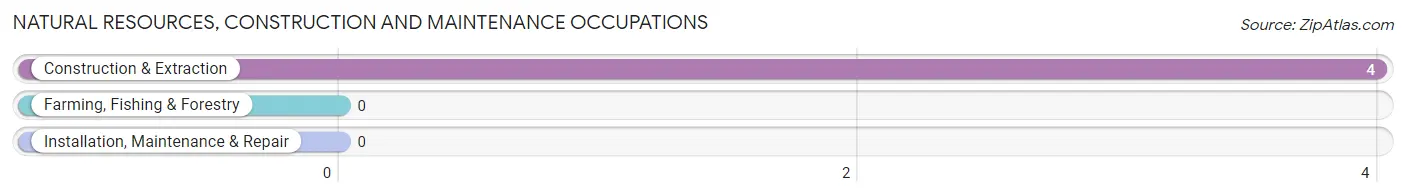
Natural Resources, Construction and Maintenance Occupations
The most common Natural Resources, Construction and Maintenance occupations in Montezuma are , and Construction & Extraction (4 | 9.1%).
Natural Resources, Construction and Maintenance Occupations by Sex
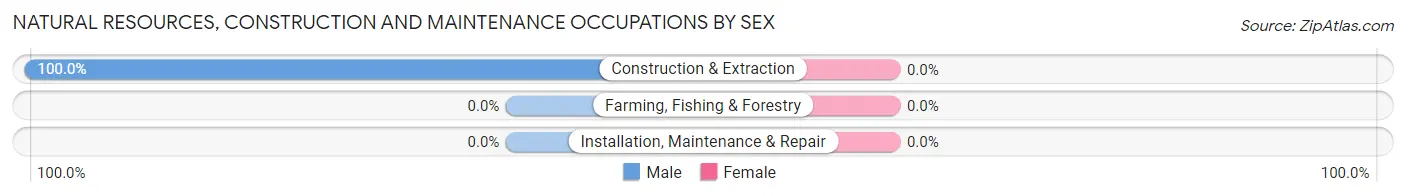
| Occupation | Male | Female |
| Farming, Fishing & Forestry | 0 (0.0%) | 0 (0.0%) |
| Construction & Extraction | 4 (100.0%) | 0 (0.0%) |
| Installation, Maintenance & Repair | 0 (0.0%) | 0 (0.0%) |
| Total (Category) | 4 (100.0%) | 0 (0.0%) |
| Total (Overall) | 23 (52.3%) | 21 (47.7%) |
Production, Transportation and Moving Occupations
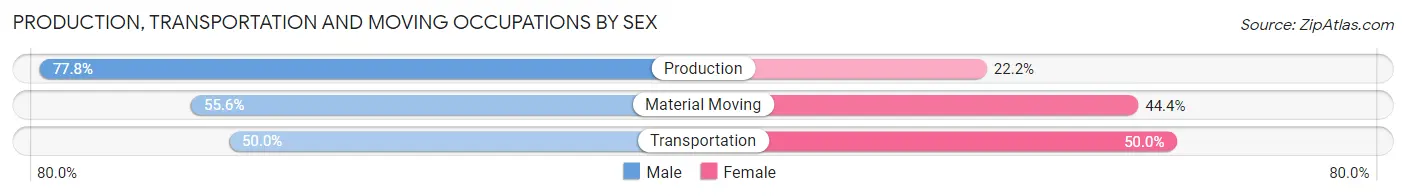
The most common Production, Transportation and Moving occupations in Montezuma are Production (9 | 20.4%), Material Moving (9 | 20.4%), and Transportation (4 | 9.1%).
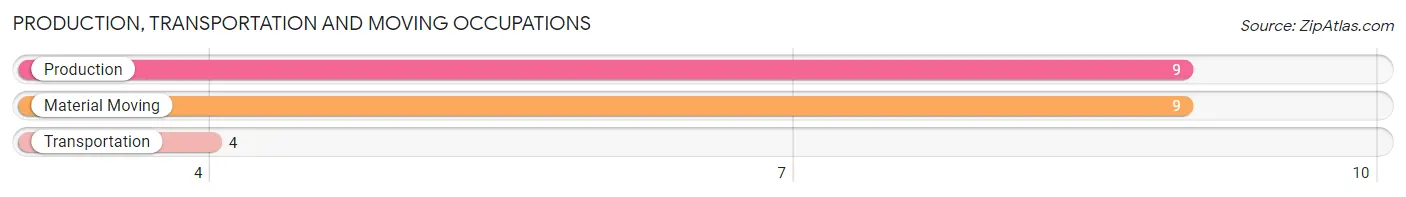
Production, Transportation and Moving Occupations by Sex
| Occupation | Male | Female |
| Production | 7 (77.8%) | 2 (22.2%) |
| Transportation | 2 (50.0%) | 2 (50.0%) |
| Material Moving | 5 (55.6%) | 4 (44.4%) |
| Total (Category) | 14 (63.6%) | 8 (36.4%) |
| Total (Overall) | 23 (52.3%) | 21 (47.7%) |
Employment Industries by Sex in Montezuma
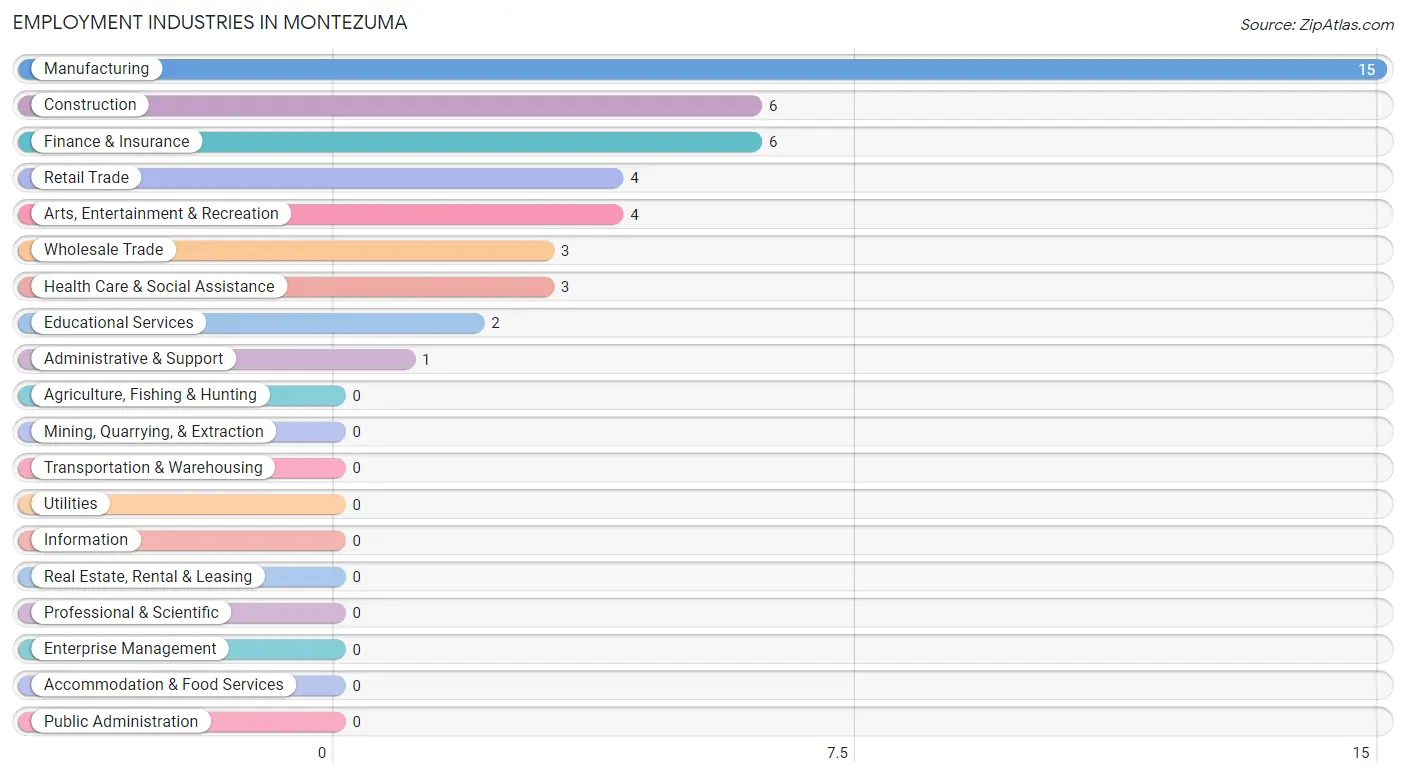
Employment Industries in Montezuma
The major employment industries in Montezuma include Manufacturing (15 | 34.1%), Construction (6 | 13.6%), Finance & Insurance (6 | 13.6%), Retail Trade (4 | 9.1%), and Arts, Entertainment & Recreation (4 | 9.1%).
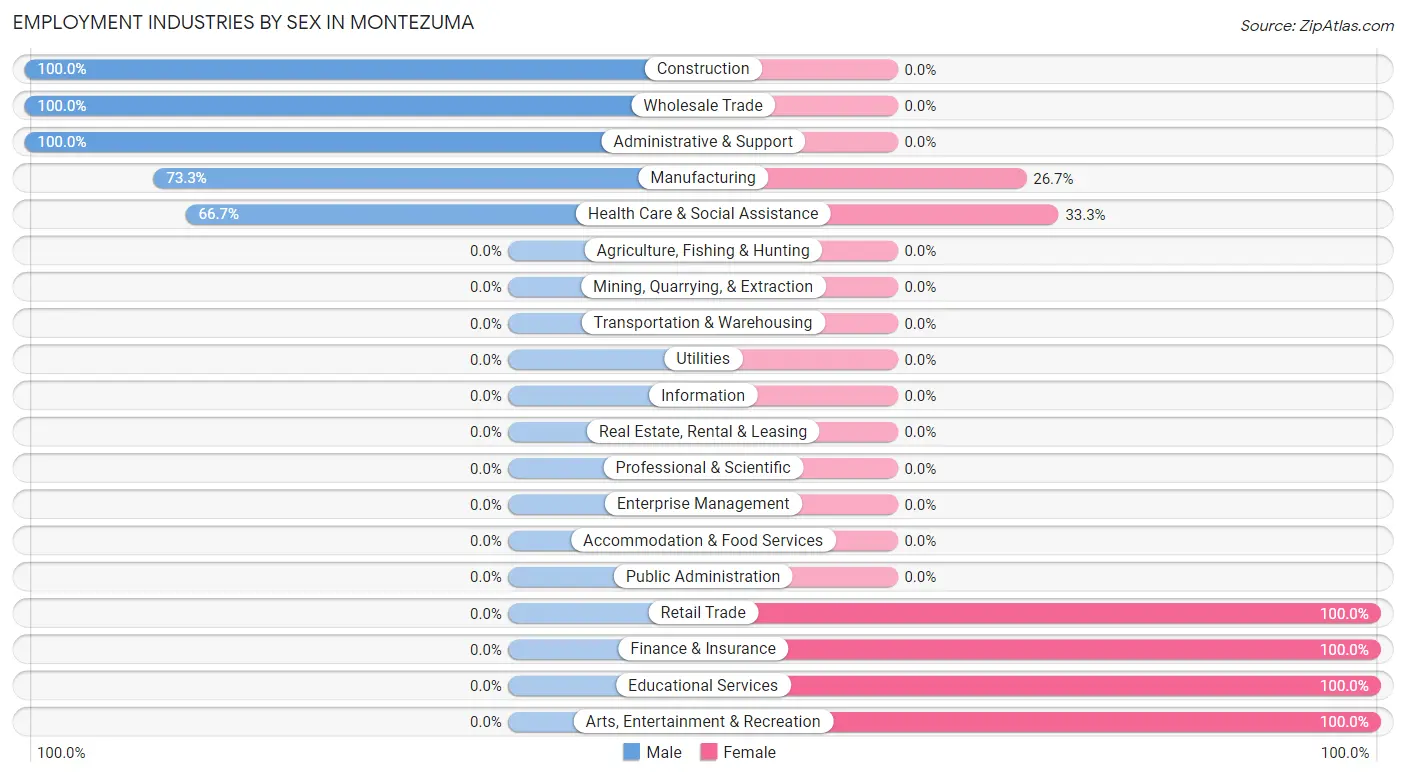
Employment Industries by Sex in Montezuma
The Montezuma industries that see more men than women are Construction (100.0%), Wholesale Trade (100.0%), and Administrative & Support (100.0%), whereas the industries that tend to have a higher number of women are Retail Trade (100.0%), Finance & Insurance (100.0%), and Educational Services (100.0%).
| Industry | Male | Female |
| Agriculture, Fishing & Hunting | 0 (0.0%) | 0 (0.0%) |
| Mining, Quarrying, & Extraction | 0 (0.0%) | 0 (0.0%) |
| Construction | 6 (100.0%) | 0 (0.0%) |
| Manufacturing | 11 (73.3%) | 4 (26.7%) |
| Wholesale Trade | 3 (100.0%) | 0 (0.0%) |
| Retail Trade | 0 (0.0%) | 4 (100.0%) |
| Transportation & Warehousing | 0 (0.0%) | 0 (0.0%) |
| Utilities | 0 (0.0%) | 0 (0.0%) |
| Information | 0 (0.0%) | 0 (0.0%) |
| Finance & Insurance | 0 (0.0%) | 6 (100.0%) |
| Real Estate, Rental & Leasing | 0 (0.0%) | 0 (0.0%) |
| Professional & Scientific | 0 (0.0%) | 0 (0.0%) |
| Enterprise Management | 0 (0.0%) | 0 (0.0%) |
| Administrative & Support | 1 (100.0%) | 0 (0.0%) |
| Educational Services | 0 (0.0%) | 2 (100.0%) |
| Health Care & Social Assistance | 2 (66.7%) | 1 (33.3%) |
| Arts, Entertainment & Recreation | 0 (0.0%) | 4 (100.0%) |
| Accommodation & Food Services | 0 (0.0%) | 0 (0.0%) |
| Public Administration | 0 (0.0%) | 0 (0.0%) |
| Total | 23 (52.3%) | 21 (47.7%) |
Education in Montezuma
School Enrollment in Montezuma
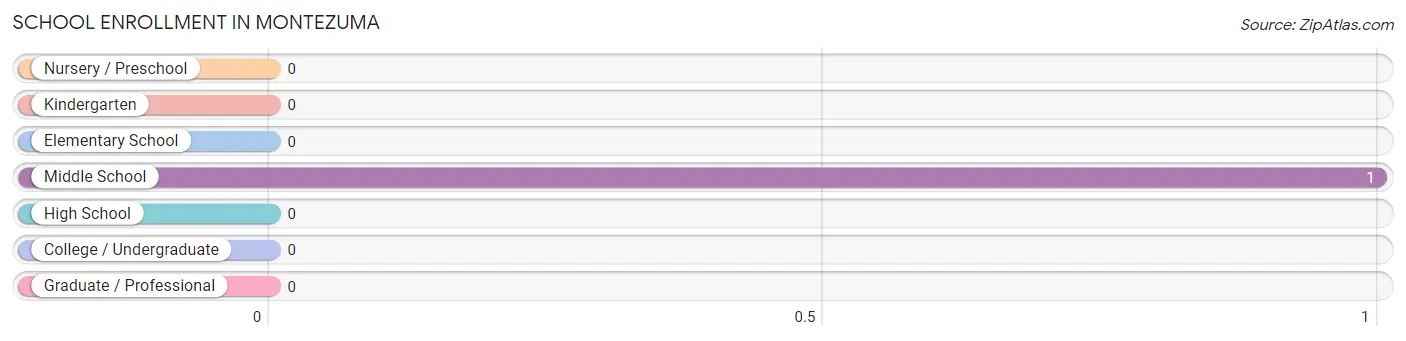
| School Level | # Students | % Students |
| Nursery / Preschool | 0 | 0.0% |
| Kindergarten | 0 | 0.0% |
| Elementary School | 0 | 0.0% |
| Middle School | 1 | 100.0% |
| High School | 0 | 0.0% |
| College / Undergraduate | 0 | 0.0% |
| Graduate / Professional | 0 | 0.0% |
| Total | 1 | 100.0% |
School Enrollment by Age by Funding Source in Montezuma
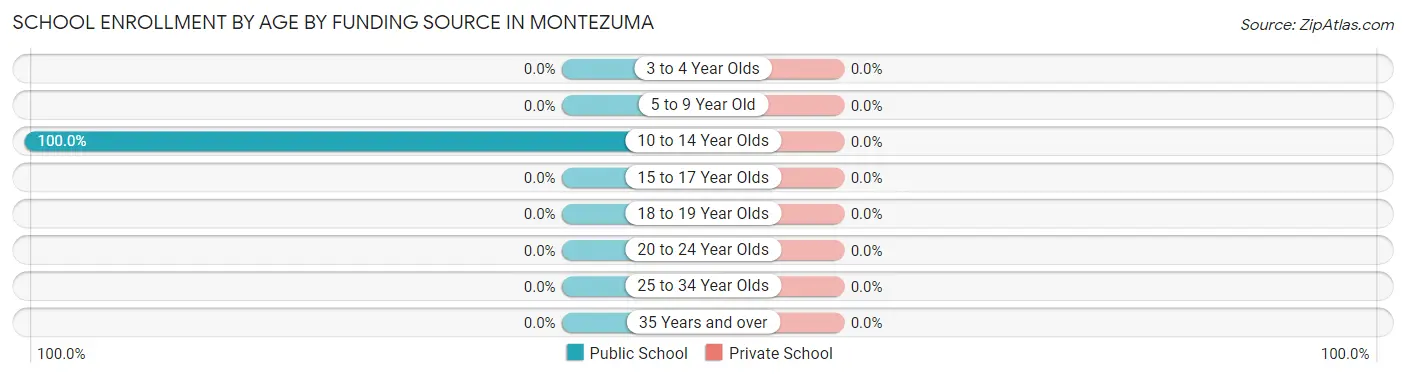
| Age Bracket | Public School | Private School |
| 3 to 4 Year Olds | 0 (0.0%) | 0 (0.0%) |
| 5 to 9 Year Old | 0 (0.0%) | 0 (0.0%) |
| 10 to 14 Year Olds | 1 (100.0%) | 0 (0.0%) |
| 15 to 17 Year Olds | 0 (0.0%) | 0 (0.0%) |
| 18 to 19 Year Olds | 0 (0.0%) | 0 (0.0%) |
| 20 to 24 Year Olds | 0 (0.0%) | 0 (0.0%) |
| 25 to 34 Year Olds | 0 (0.0%) | 0 (0.0%) |
| 35 Years and over | 0 (0.0%) | 0 (0.0%) |
| Total | 1 (100.0%) | 0 (0.0%) |
Educational Attainment by Field of Study in Montezuma
Science & technology (7 | 38.9%), business (4 | 22.2%), bio, nature & agricultural (2 | 11.1%), engineering (2 | 11.1%), and visual & performing arts (2 | 11.1%) are the most common fields of study among 18 individuals in Montezuma who have obtained a bachelor's degree or higher.
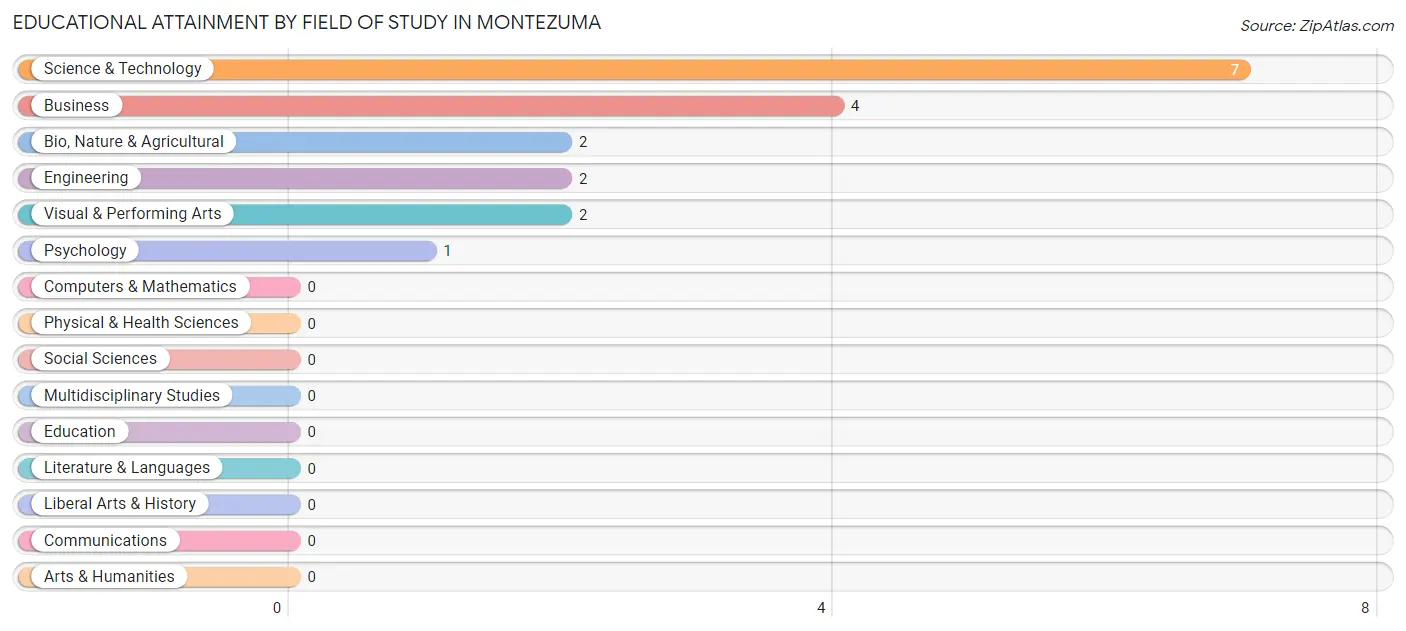
| Field of Study | # Graduates | % Graduates |
| Computers & Mathematics | 0 | 0.0% |
| Bio, Nature & Agricultural | 2 | 11.1% |
| Physical & Health Sciences | 0 | 0.0% |
| Psychology | 1 | 5.6% |
| Social Sciences | 0 | 0.0% |
| Engineering | 2 | 11.1% |
| Multidisciplinary Studies | 0 | 0.0% |
| Science & Technology | 7 | 38.9% |
| Business | 4 | 22.2% |
| Education | 0 | 0.0% |
| Literature & Languages | 0 | 0.0% |
| Liberal Arts & History | 0 | 0.0% |
| Visual & Performing Arts | 2 | 11.1% |
| Communications | 0 | 0.0% |
| Arts & Humanities | 0 | 0.0% |
| Total | 18 | 100.0% |
Transportation & Commute in Montezuma
Vehicle Availability by Sex in Montezuma
The most prevalent vehicle ownership categories in Montezuma are males with 2 vehicles (16, accounting for 69.6%) and females with 2 vehicles (10, making up 76.2%).
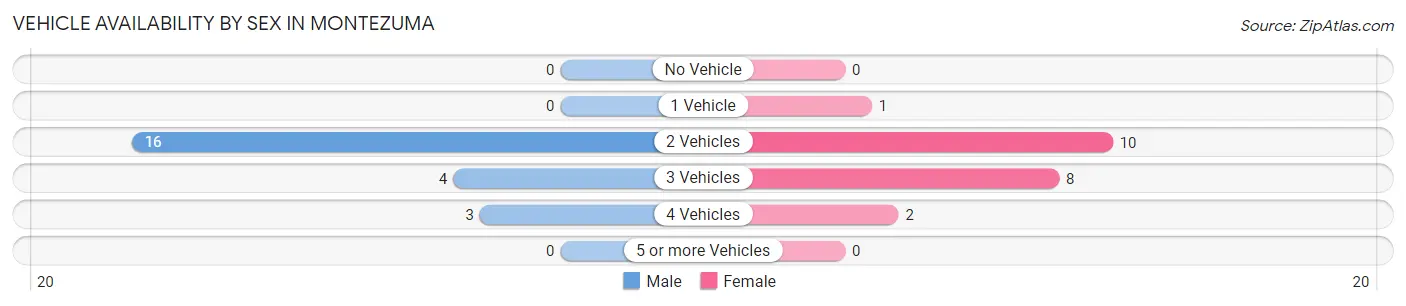
| Vehicles Available | Male | Female |
| No Vehicle | 0 (0.0%) | 0 (0.0%) |
| 1 Vehicle | 0 (0.0%) | 1 (4.8%) |
| 2 Vehicles | 16 (69.6%) | 10 (47.6%) |
| 3 Vehicles | 4 (17.4%) | 8 (38.1%) |
| 4 Vehicles | 3 (13.0%) | 2 (9.5%) |
| 5 or more Vehicles | 0 (0.0%) | 0 (0.0%) |
| Total | 23 (100.0%) | 21 (100.0%) |
Commute Time in Montezuma
The most frequently occuring commute durations in Montezuma are 15 to 19 minutes (13 commuters, 32.5%), 20 to 24 minutes (13 commuters, 32.5%), and 10 to 14 minutes (6 commuters, 15.0%).

| Commute Time | # Commuters | % Commuters |
| Less than 5 Minutes | 0 | 0.0% |
| 5 to 9 Minutes | 4 | 10.0% |
| 10 to 14 Minutes | 6 | 15.0% |
| 15 to 19 Minutes | 13 | 32.5% |
| 20 to 24 Minutes | 13 | 32.5% |
| 25 to 29 Minutes | 1 | 2.5% |
| 30 to 34 Minutes | 1 | 2.5% |
| 35 to 39 Minutes | 0 | 0.0% |
| 40 to 44 Minutes | 0 | 0.0% |
| 45 to 59 Minutes | 2 | 5.0% |
| 60 to 89 Minutes | 0 | 0.0% |
| 90 or more Minutes | 0 | 0.0% |
Commute Time by Sex in Montezuma
The most common commute times in Montezuma are 20 to 24 minutes (9 commuters, 39.1%) for males and 10 to 14 minutes (6 commuters, 35.3%) for females.
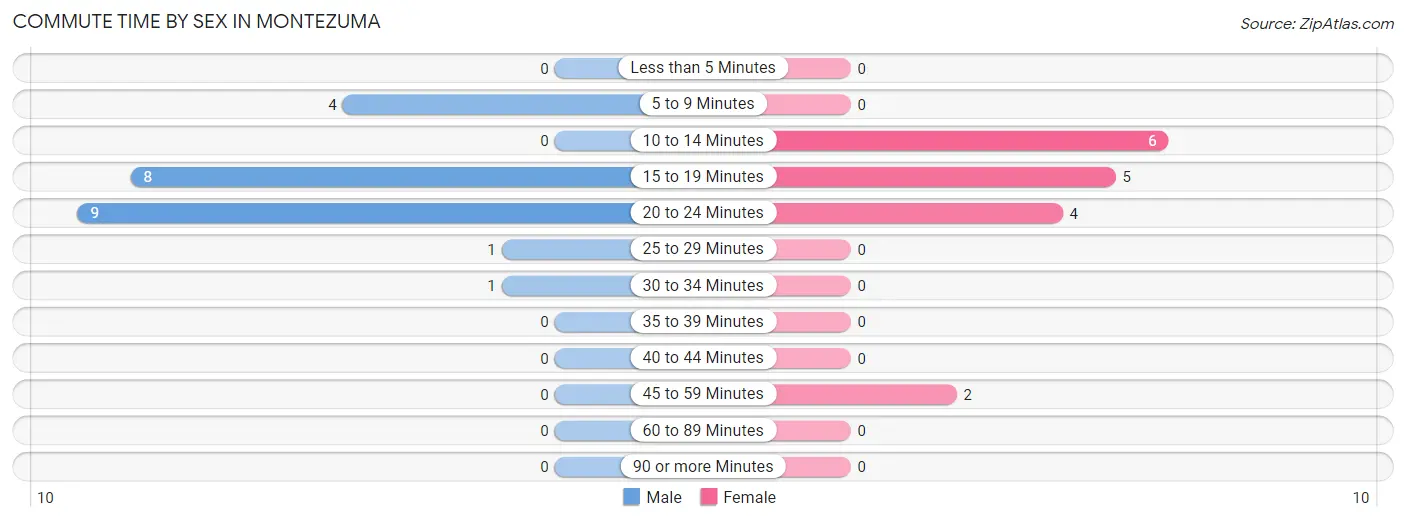
| Commute Time | Male | Female |
| Less than 5 Minutes | 0 (0.0%) | 0 (0.0%) |
| 5 to 9 Minutes | 4 (17.4%) | 0 (0.0%) |
| 10 to 14 Minutes | 0 (0.0%) | 6 (35.3%) |
| 15 to 19 Minutes | 8 (34.8%) | 5 (29.4%) |
| 20 to 24 Minutes | 9 (39.1%) | 4 (23.5%) |
| 25 to 29 Minutes | 1 (4.3%) | 0 (0.0%) |
| 30 to 34 Minutes | 1 (4.3%) | 0 (0.0%) |
| 35 to 39 Minutes | 0 (0.0%) | 0 (0.0%) |
| 40 to 44 Minutes | 0 (0.0%) | 0 (0.0%) |
| 45 to 59 Minutes | 0 (0.0%) | 2 (11.8%) |
| 60 to 89 Minutes | 0 (0.0%) | 0 (0.0%) |
| 90 or more Minutes | 0 (0.0%) | 0 (0.0%) |
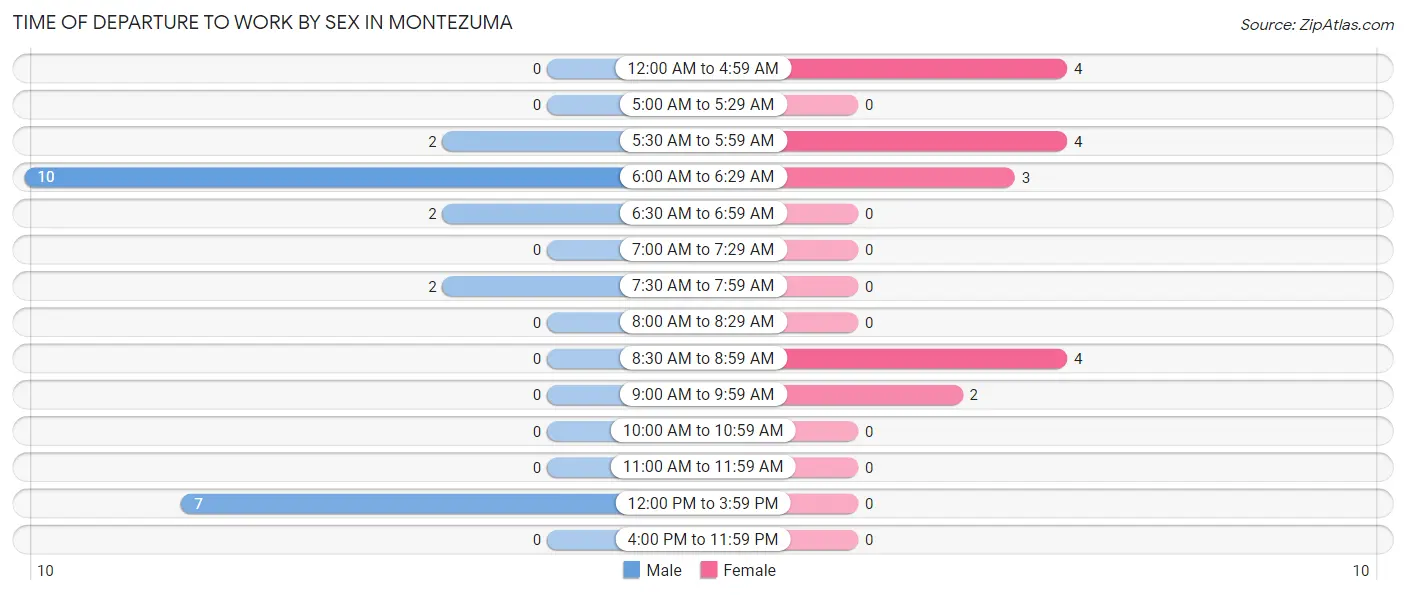
Time of Departure to Work by Sex in Montezuma
The most frequent times of departure to work in Montezuma are 6:00 AM to 6:29 AM (10, 43.5%) for males and 12:00 AM to 4:59 AM (4, 23.5%) for females.
| Time of Departure | Male | Female |
| 12:00 AM to 4:59 AM | 0 (0.0%) | 4 (23.5%) |
| 5:00 AM to 5:29 AM | 0 (0.0%) | 0 (0.0%) |
| 5:30 AM to 5:59 AM | 2 (8.7%) | 4 (23.5%) |
| 6:00 AM to 6:29 AM | 10 (43.5%) | 3 (17.6%) |
| 6:30 AM to 6:59 AM | 2 (8.7%) | 0 (0.0%) |
| 7:00 AM to 7:29 AM | 0 (0.0%) | 0 (0.0%) |
| 7:30 AM to 7:59 AM | 2 (8.7%) | 0 (0.0%) |
| 8:00 AM to 8:29 AM | 0 (0.0%) | 0 (0.0%) |
| 8:30 AM to 8:59 AM | 0 (0.0%) | 4 (23.5%) |
| 9:00 AM to 9:59 AM | 0 (0.0%) | 2 (11.8%) |
| 10:00 AM to 10:59 AM | 0 (0.0%) | 0 (0.0%) |
| 11:00 AM to 11:59 AM | 0 (0.0%) | 0 (0.0%) |
| 12:00 PM to 3:59 PM | 7 (30.4%) | 0 (0.0%) |
| 4:00 PM to 11:59 PM | 0 (0.0%) | 0 (0.0%) |
| Total | 23 (100.0%) | 17 (100.0%) |
Housing Occupancy in Montezuma
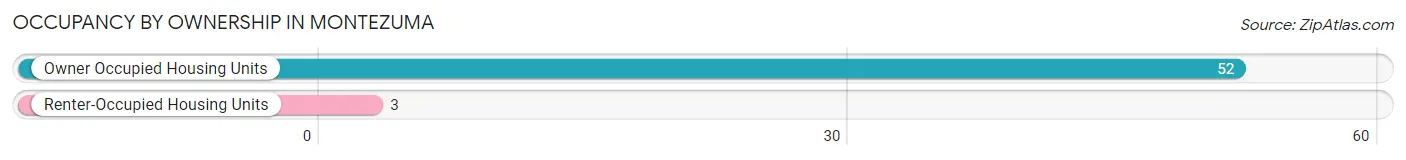
Occupancy by Ownership in Montezuma
Of the total 55 dwellings in Montezuma, owner-occupied units account for 52 (94.6%), while renter-occupied units make up 3 (5.4%).
| Occupancy | # Housing Units | % Housing Units |
| Owner Occupied Housing Units | 52 | 94.6% |
| Renter-Occupied Housing Units | 3 | 5.4% |
| Total Occupied Housing Units | 55 | 100.0% |
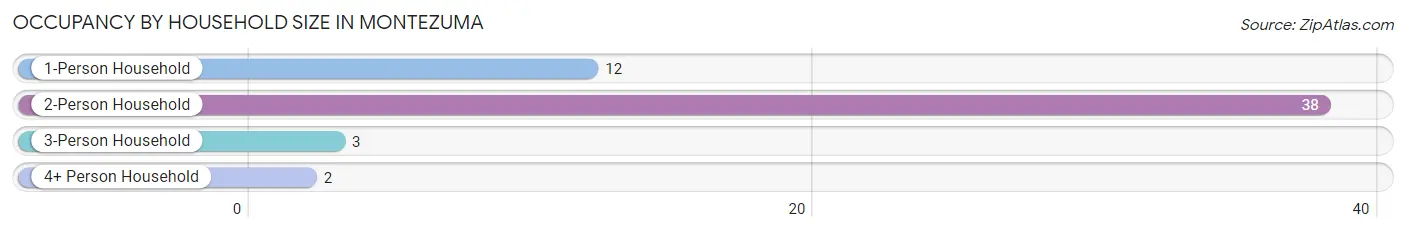
Occupancy by Household Size in Montezuma
| Household Size | # Housing Units | % Housing Units |
| 1-Person Household | 12 | 21.8% |
| 2-Person Household | 38 | 69.1% |
| 3-Person Household | 3 | 5.4% |
| 4+ Person Household | 2 | 3.6% |
| Total Housing Units | 55 | 100.0% |
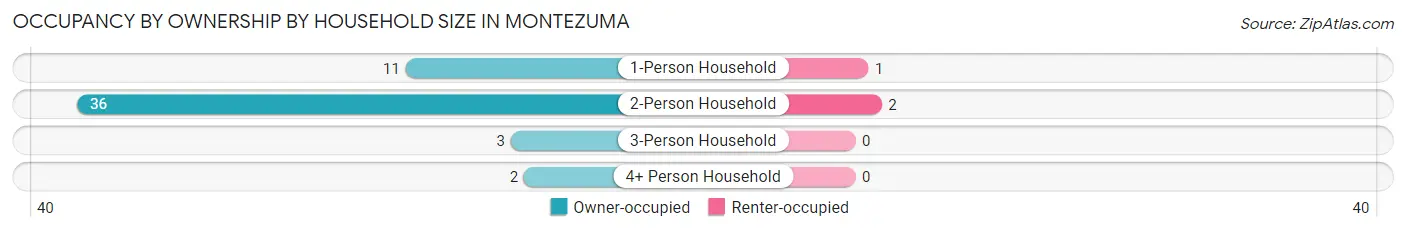
Occupancy by Ownership by Household Size in Montezuma
| Household Size | Owner-occupied | Renter-occupied |
| 1-Person Household | 11 (91.7%) | 1 (8.3%) |
| 2-Person Household | 36 (94.7%) | 2 (5.3%) |
| 3-Person Household | 3 (100.0%) | 0 (0.0%) |
| 4+ Person Household | 2 (100.0%) | 0 (0.0%) |
| Total Housing Units | 52 (94.6%) | 3 (5.4%) |
Occupancy by Educational Attainment in Montezuma
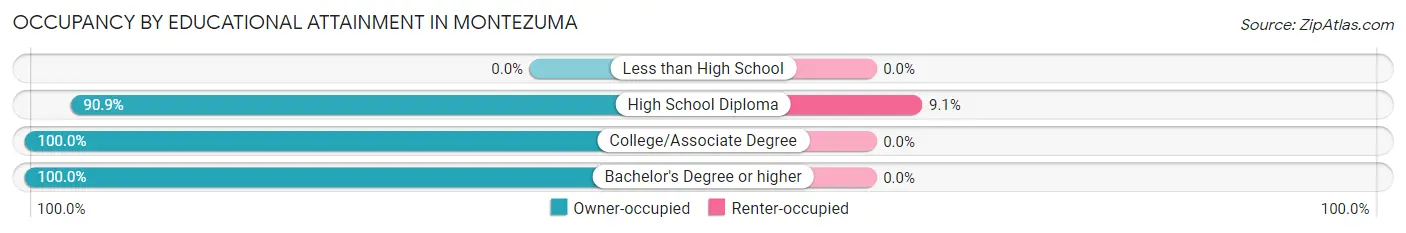
| Household Size | Owner-occupied | Renter-occupied |
| Less than High School | 0 (0.0%) | 0 (0.0%) |
| High School Diploma | 30 (90.9%) | 3 (9.1%) |
| College/Associate Degree | 12 (100.0%) | 0 (0.0%) |
| Bachelor's Degree or higher | 10 (100.0%) | 0 (0.0%) |
Occupancy by Age of Householder in Montezuma
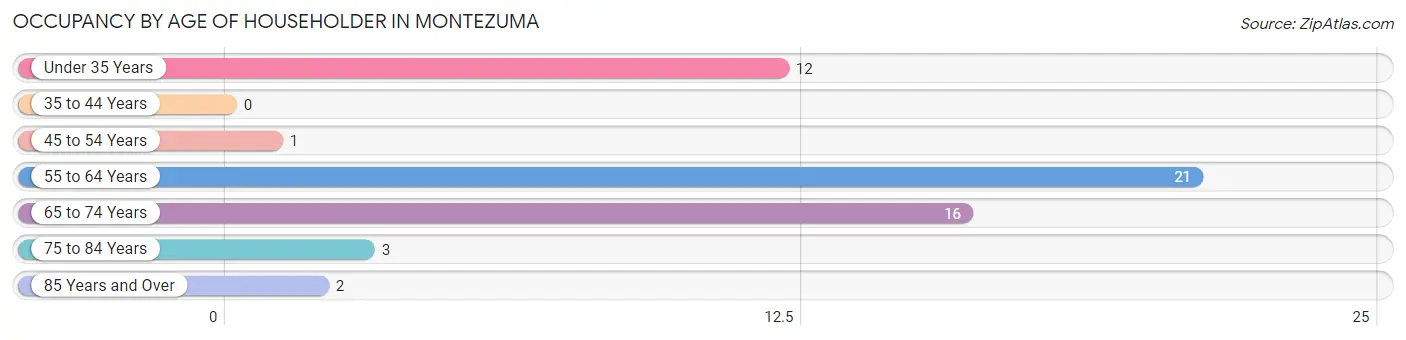
| Age Bracket | # Households | % Households |
| Under 35 Years | 12 | 21.8% |
| 35 to 44 Years | 0 | 0.0% |
| 45 to 54 Years | 1 | 1.8% |
| 55 to 64 Years | 21 | 38.2% |
| 65 to 74 Years | 16 | 29.1% |
| 75 to 84 Years | 3 | 5.4% |
| 85 Years and Over | 2 | 3.6% |
| Total | 55 | 100.0% |
Housing Finances in Montezuma
Median Income by Occupancy in Montezuma
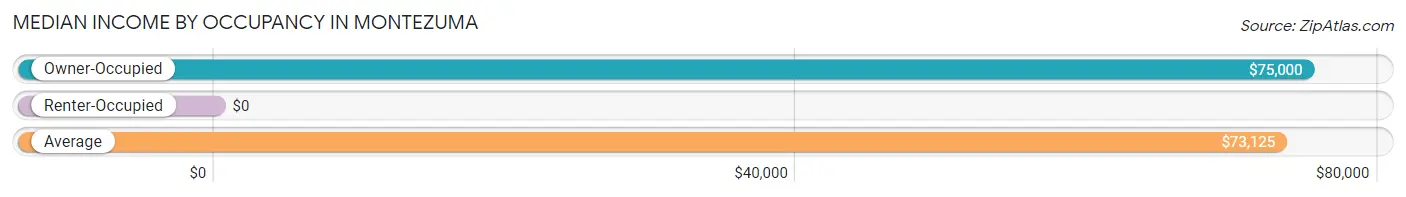
| Occupancy Type | # Households | Median Income |
| Owner-Occupied | 52 (94.6%) | $75,000 |
| Renter-Occupied | 3 (5.4%) | $0 |
| Average | 55 (100.0%) | $73,125 |
Occupancy by Householder Income Bracket in Montezuma
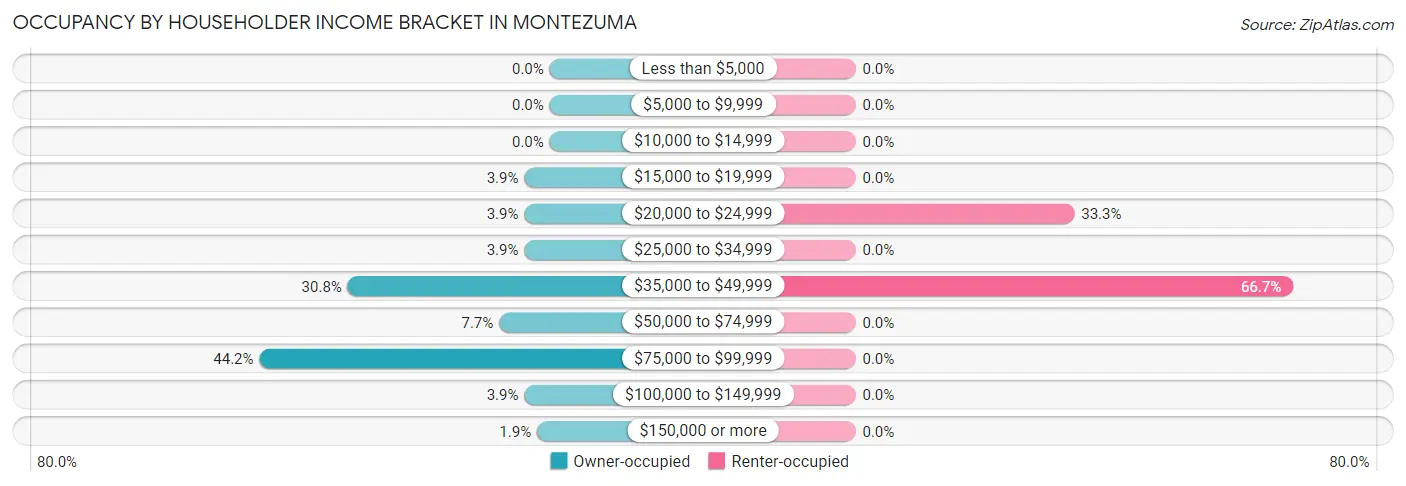
| Income Bracket | Owner-occupied | Renter-occupied |
| Less than $5,000 | 0 (0.0%) | 0 (0.0%) |
| $5,000 to $9,999 | 0 (0.0%) | 0 (0.0%) |
| $10,000 to $14,999 | 0 (0.0%) | 0 (0.0%) |
| $15,000 to $19,999 | 2 (3.8%) | 0 (0.0%) |
| $20,000 to $24,999 | 2 (3.8%) | 1 (33.3%) |
| $25,000 to $34,999 | 2 (3.8%) | 0 (0.0%) |
| $35,000 to $49,999 | 16 (30.8%) | 2 (66.7%) |
| $50,000 to $74,999 | 4 (7.7%) | 0 (0.0%) |
| $75,000 to $99,999 | 23 (44.2%) | 0 (0.0%) |
| $100,000 to $149,999 | 2 (3.8%) | 0 (0.0%) |
| $150,000 or more | 1 (1.9%) | 0 (0.0%) |
| Total | 52 (100.0%) | 3 (100.0%) |
Monthly Housing Cost Tiers in Montezuma
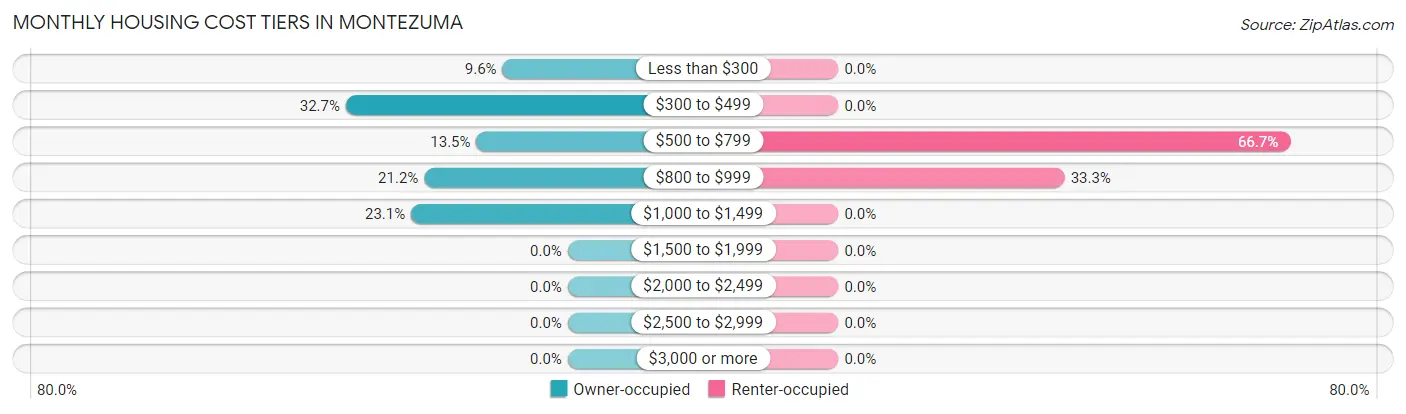
| Monthly Cost | Owner-occupied | Renter-occupied |
| Less than $300 | 5 (9.6%) | 0 (0.0%) |
| $300 to $499 | 17 (32.7%) | 0 (0.0%) |
| $500 to $799 | 7 (13.5%) | 2 (66.7%) |
| $800 to $999 | 11 (21.1%) | 1 (33.3%) |
| $1,000 to $1,499 | 12 (23.1%) | 0 (0.0%) |
| $1,500 to $1,999 | 0 (0.0%) | 0 (0.0%) |
| $2,000 to $2,499 | 0 (0.0%) | 0 (0.0%) |
| $2,500 to $2,999 | 0 (0.0%) | 0 (0.0%) |
| $3,000 or more | 0 (0.0%) | 0 (0.0%) |
| Total | 52 (100.0%) | 3 (100.0%) |
Physical Housing Characteristics in Montezuma
Housing Structures in Montezuma
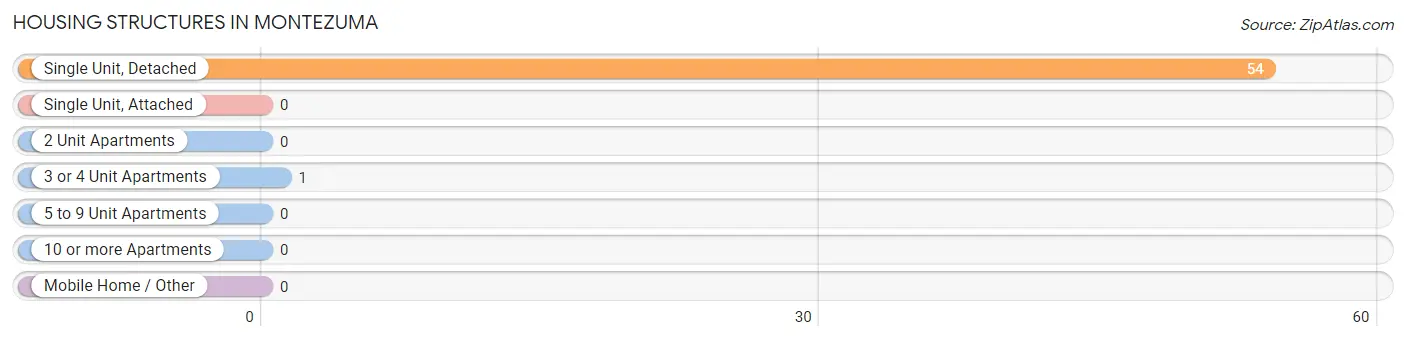
| Structure Type | # Housing Units | % Housing Units |
| Single Unit, Detached | 54 | 98.2% |
| Single Unit, Attached | 0 | 0.0% |
| 2 Unit Apartments | 0 | 0.0% |
| 3 or 4 Unit Apartments | 1 | 1.8% |
| 5 to 9 Unit Apartments | 0 | 0.0% |
| 10 or more Apartments | 0 | 0.0% |
| Mobile Home / Other | 0 | 0.0% |
| Total | 55 | 100.0% |
Housing Structures by Occupancy in Montezuma
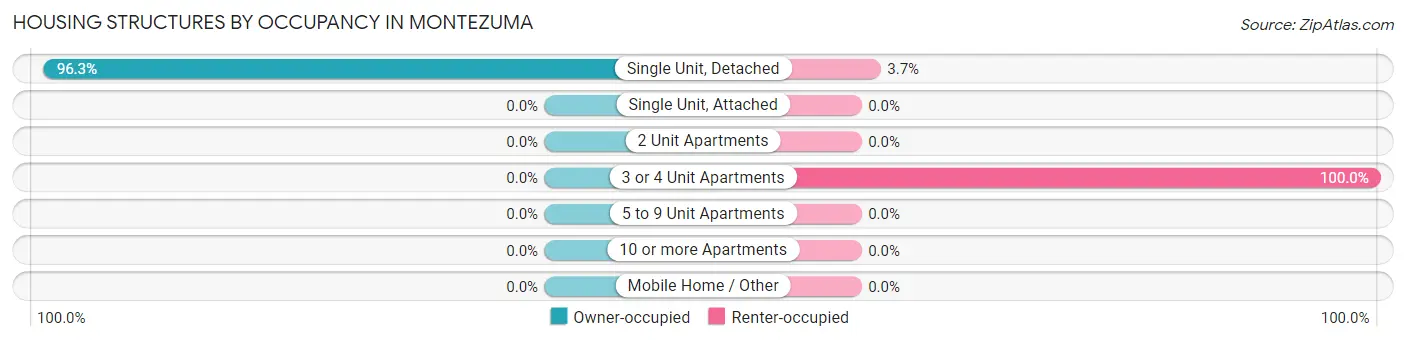
| Structure Type | Owner-occupied | Renter-occupied |
| Single Unit, Detached | 52 (96.3%) | 2 (3.7%) |
| Single Unit, Attached | 0 (0.0%) | 0 (0.0%) |
| 2 Unit Apartments | 0 (0.0%) | 0 (0.0%) |
| 3 or 4 Unit Apartments | 0 (0.0%) | 1 (100.0%) |
| 5 to 9 Unit Apartments | 0 (0.0%) | 0 (0.0%) |
| 10 or more Apartments | 0 (0.0%) | 0 (0.0%) |
| Mobile Home / Other | 0 (0.0%) | 0 (0.0%) |
| Total | 52 (94.6%) | 3 (5.4%) |
Housing Structures by Number of Rooms in Montezuma
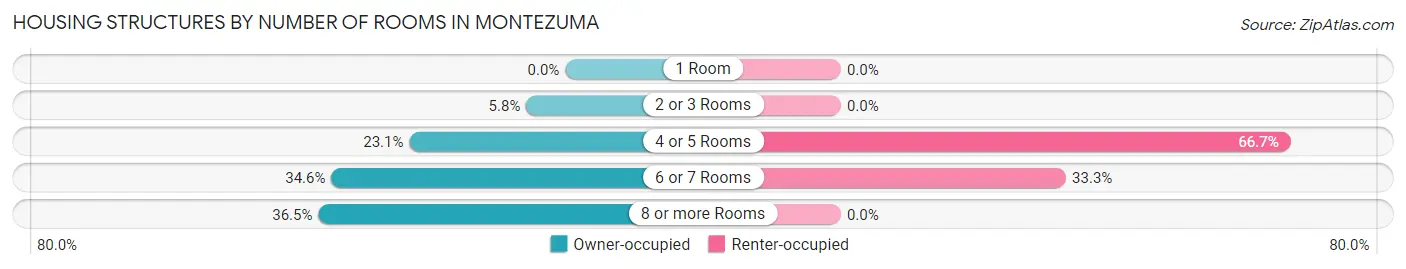
| Number of Rooms | Owner-occupied | Renter-occupied |
| 1 Room | 0 (0.0%) | 0 (0.0%) |
| 2 or 3 Rooms | 3 (5.8%) | 0 (0.0%) |
| 4 or 5 Rooms | 12 (23.1%) | 2 (66.7%) |
| 6 or 7 Rooms | 18 (34.6%) | 1 (33.3%) |
| 8 or more Rooms | 19 (36.5%) | 0 (0.0%) |
| Total | 52 (100.0%) | 3 (100.0%) |
Housing Structure by Heating Type in Montezuma
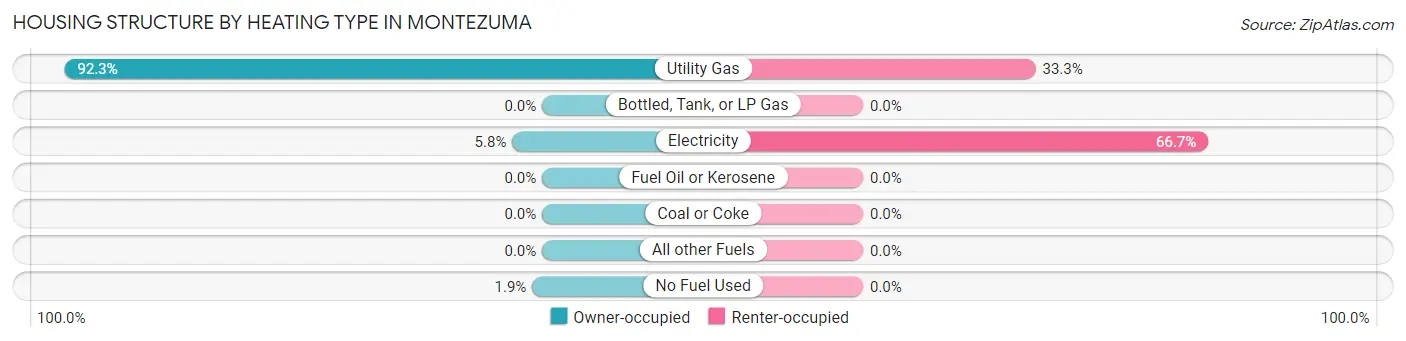
| Heating Type | Owner-occupied | Renter-occupied |
| Utility Gas | 48 (92.3%) | 1 (33.3%) |
| Bottled, Tank, or LP Gas | 0 (0.0%) | 0 (0.0%) |
| Electricity | 3 (5.8%) | 2 (66.7%) |
| Fuel Oil or Kerosene | 0 (0.0%) | 0 (0.0%) |
| Coal or Coke | 0 (0.0%) | 0 (0.0%) |
| All other Fuels | 0 (0.0%) | 0 (0.0%) |
| No Fuel Used | 1 (1.9%) | 0 (0.0%) |
| Total | 52 (100.0%) | 3 (100.0%) |
Household Vehicle Usage in Montezuma
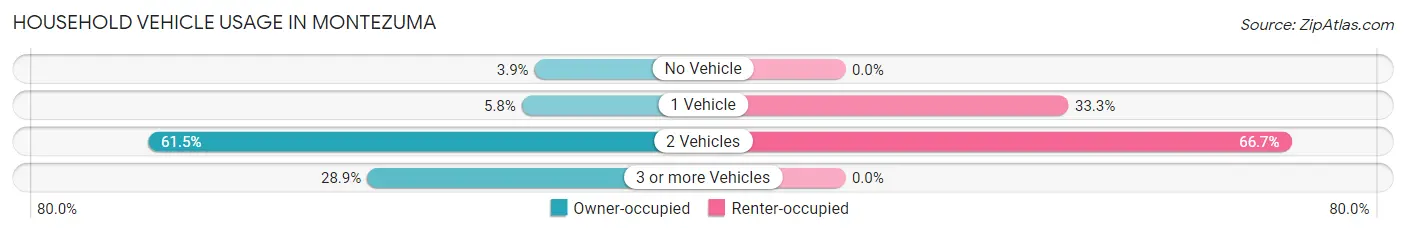
| Vehicles per Household | Owner-occupied | Renter-occupied |
| No Vehicle | 2 (3.8%) | 0 (0.0%) |
| 1 Vehicle | 3 (5.8%) | 1 (33.3%) |
| 2 Vehicles | 32 (61.5%) | 2 (66.7%) |
| 3 or more Vehicles | 15 (28.8%) | 0 (0.0%) |
| Total | 52 (100.0%) | 3 (100.0%) |
Real Estate & Mortgages in Montezuma
Real Estate and Mortgage Overview in Montezuma
| Characteristic | Without Mortgage | With Mortgage |
| Housing Units | 18 | 34 |
| Median Property Value | - | - |
| Median Household Income | $75,417 | $0 |
| Monthly Housing Costs | $430 | $0 |
| Real Estate Taxes | - | - |
Property Value by Mortgage Status in Montezuma
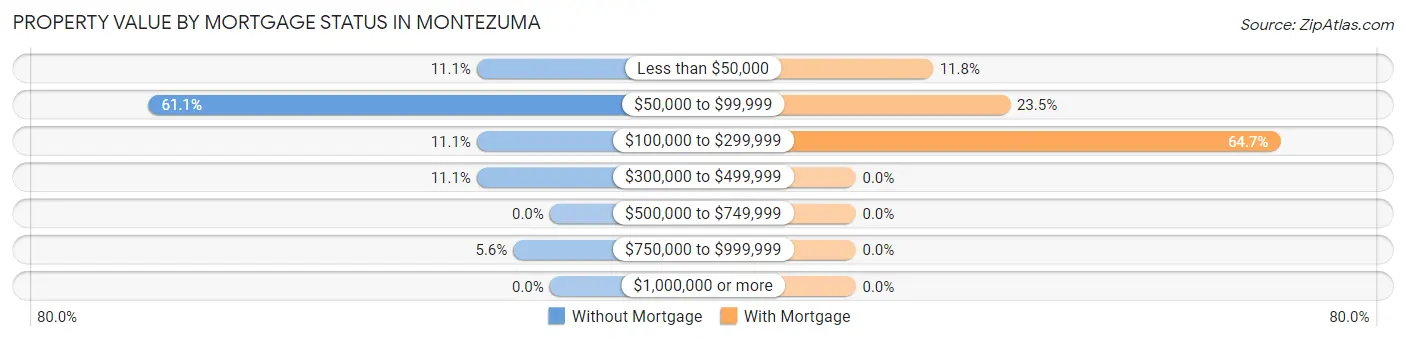
| Property Value | Without Mortgage | With Mortgage |
| Less than $50,000 | 2 (11.1%) | 4 (11.8%) |
| $50,000 to $99,999 | 11 (61.1%) | 8 (23.5%) |
| $100,000 to $299,999 | 2 (11.1%) | 22 (64.7%) |
| $300,000 to $499,999 | 2 (11.1%) | 0 (0.0%) |
| $500,000 to $749,999 | 0 (0.0%) | 0 (0.0%) |
| $750,000 to $999,999 | 1 (5.6%) | 0 (0.0%) |
| $1,000,000 or more | 0 (0.0%) | 0 (0.0%) |
| Total | 18 (100.0%) | 34 (100.0%) |
Household Income by Mortgage Status in Montezuma
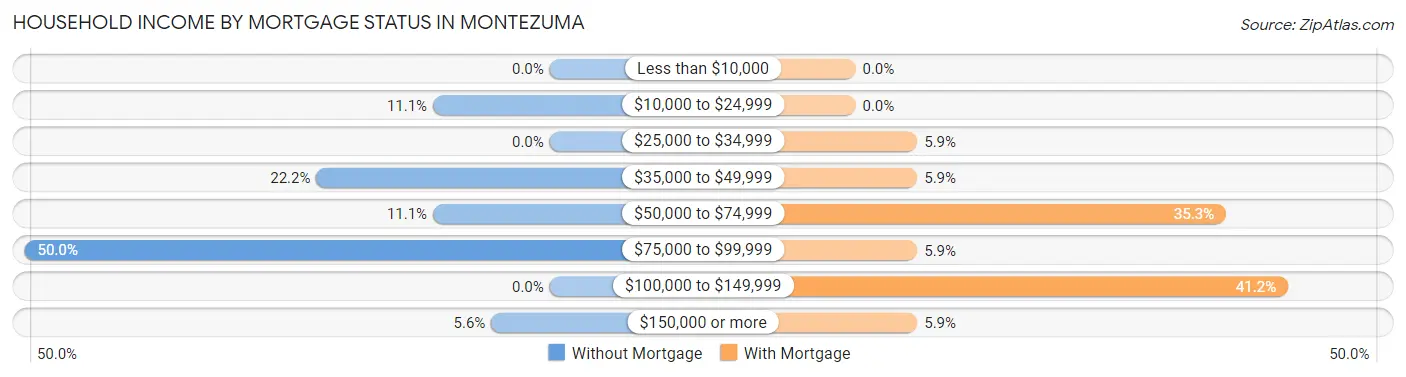
| Household Income | Without Mortgage | With Mortgage |
| Less than $10,000 | 0 (0.0%) | 0 (0.0%) |
| $10,000 to $24,999 | 2 (11.1%) | 0 (0.0%) |
| $25,000 to $34,999 | 0 (0.0%) | 2 (5.9%) |
| $35,000 to $49,999 | 4 (22.2%) | 2 (5.9%) |
| $50,000 to $74,999 | 2 (11.1%) | 12 (35.3%) |
| $75,000 to $99,999 | 9 (50.0%) | 2 (5.9%) |
| $100,000 to $149,999 | 0 (0.0%) | 14 (41.2%) |
| $150,000 or more | 1 (5.6%) | 2 (5.9%) |
| Total | 18 (100.0%) | 34 (100.0%) |
Property Value to Household Income Ratio in Montezuma
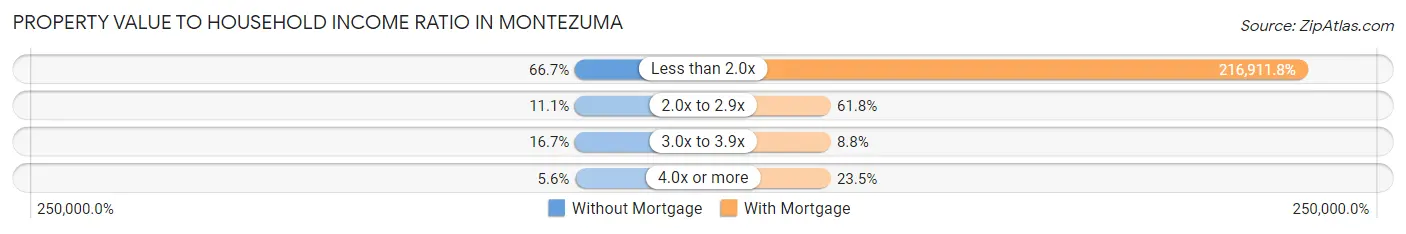
| Value-to-Income Ratio | Without Mortgage | With Mortgage |
| Less than 2.0x | 12 (66.7%) | 73,750 (216,911.8%) |
| 2.0x to 2.9x | 2 (11.1%) | 21 (61.8%) |
| 3.0x to 3.9x | 3 (16.7%) | 3 (8.8%) |
| 4.0x or more | 1 (5.6%) | 8 (23.5%) |
| Total | 18 (100.0%) | 34 (100.0%) |
Real Estate Taxes by Mortgage Status in Montezuma
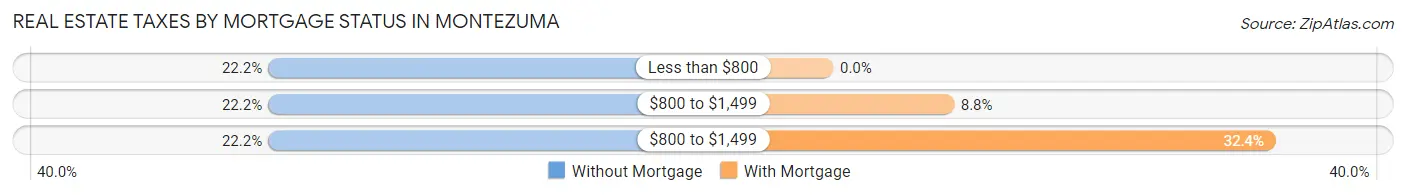
| Property Taxes | Without Mortgage | With Mortgage |
| Less than $800 | 4 (22.2%) | 0 (0.0%) |
| $800 to $1,499 | 4 (22.2%) | 3 (8.8%) |
| $800 to $1,499 | 4 (22.2%) | 11 (32.4%) |
| Total | 18 (100.0%) | 34 (100.0%) |
Health & Disability in Montezuma
Health Insurance Coverage by Age in Montezuma
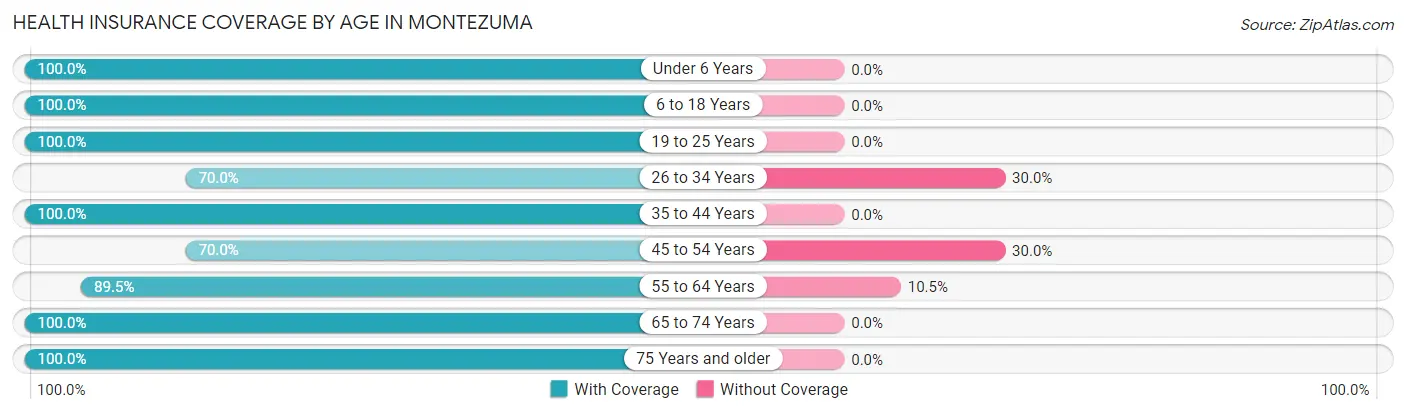
| Age Bracket | With Coverage | Without Coverage |
| Under 6 Years | 3 (100.0%) | 0 (0.0%) |
| 6 to 18 Years | 1 (100.0%) | 0 (0.0%) |
| 19 to 25 Years | 5 (100.0%) | 0 (0.0%) |
| 26 to 34 Years | 7 (70.0%) | 3 (30.0%) |
| 35 to 44 Years | 4 (100.0%) | 0 (0.0%) |
| 45 to 54 Years | 7 (70.0%) | 3 (30.0%) |
| 55 to 64 Years | 34 (89.5%) | 4 (10.5%) |
| 65 to 74 Years | 27 (100.0%) | 0 (0.0%) |
| 75 Years and older | 6 (100.0%) | 0 (0.0%) |
| Total | 94 (90.4%) | 10 (9.6%) |
Health Insurance Coverage by Citizenship Status in Montezuma
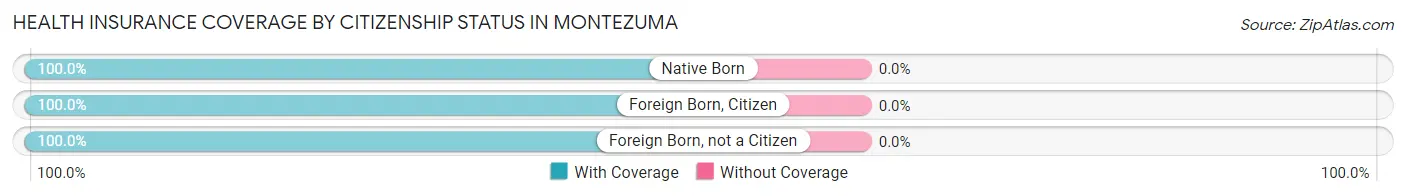
| Citizenship Status | With Coverage | Without Coverage |
| Native Born | 3 (100.0%) | 0 (0.0%) |
| Foreign Born, Citizen | 1 (100.0%) | 0 (0.0%) |
| Foreign Born, not a Citizen | 5 (100.0%) | 0 (0.0%) |
Health Insurance Coverage by Household Income in Montezuma
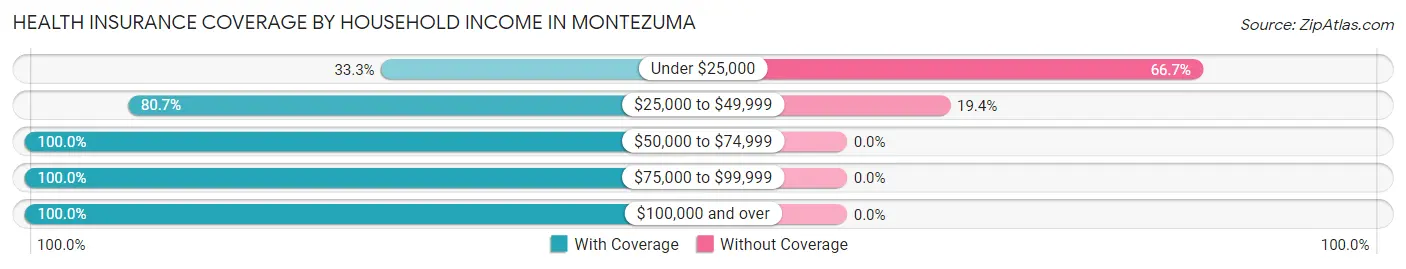
| Household Income | With Coverage | Without Coverage |
| Under $25,000 | 2 (33.3%) | 4 (66.7%) |
| $25,000 to $49,999 | 25 (80.6%) | 6 (19.4%) |
| $50,000 to $74,999 | 7 (100.0%) | 0 (0.0%) |
| $75,000 to $99,999 | 49 (100.0%) | 0 (0.0%) |
| $100,000 and over | 11 (100.0%) | 0 (0.0%) |
Public vs Private Health Insurance Coverage by Age in Montezuma
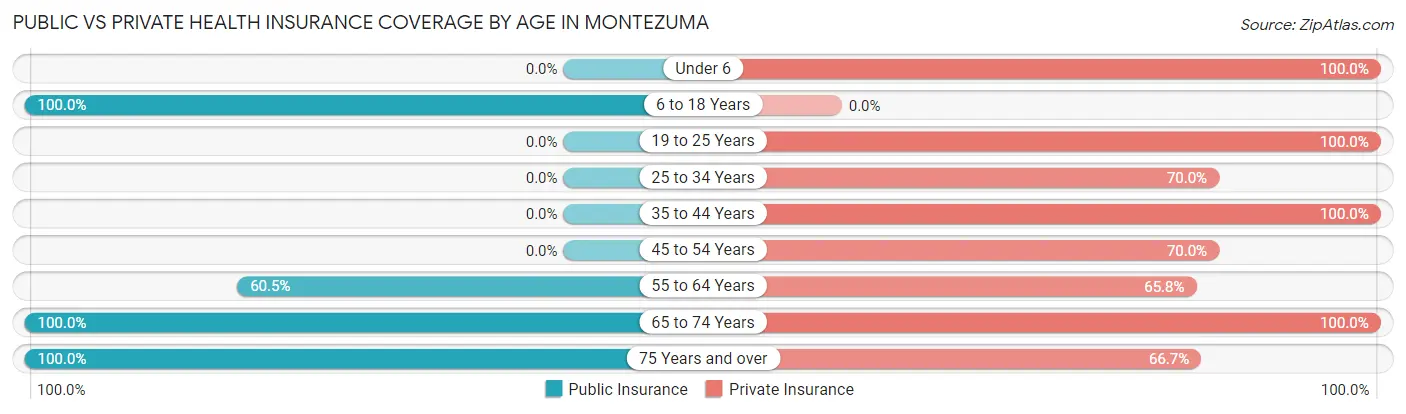
| Age Bracket | Public Insurance | Private Insurance |
| Under 6 | 0 (0.0%) | 3 (100.0%) |
| 6 to 18 Years | 1 (100.0%) | 0 (0.0%) |
| 19 to 25 Years | 0 (0.0%) | 5 (100.0%) |
| 25 to 34 Years | 0 (0.0%) | 7 (70.0%) |
| 35 to 44 Years | 0 (0.0%) | 4 (100.0%) |
| 45 to 54 Years | 0 (0.0%) | 7 (70.0%) |
| 55 to 64 Years | 23 (60.5%) | 25 (65.8%) |
| 65 to 74 Years | 27 (100.0%) | 27 (100.0%) |
| 75 Years and over | 6 (100.0%) | 4 (66.7%) |
| Total | 57 (54.8%) | 82 (78.8%) |
Disability Status by Sex by Age in Montezuma
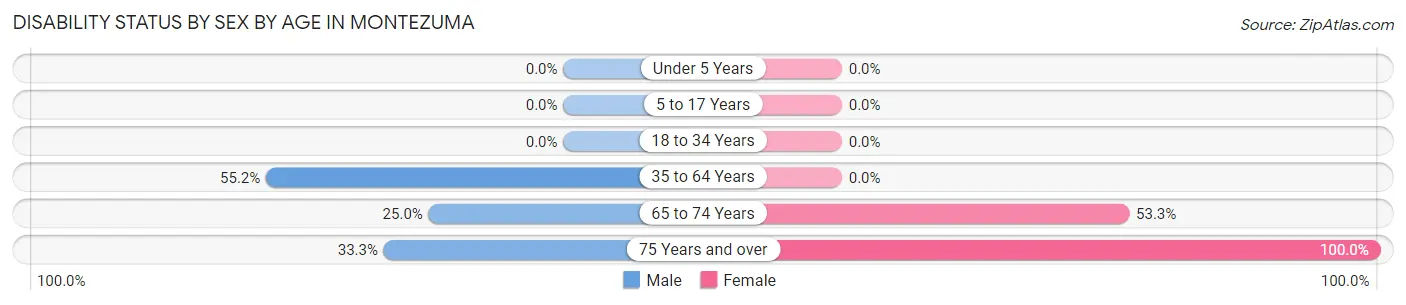
| Age Bracket | Male | Female |
| Under 5 Years | 0 (0.0%) | 0 (0.0%) |
| 5 to 17 Years | 0 (0.0%) | 0 (0.0%) |
| 18 to 34 Years | 0 (0.0%) | 0 (0.0%) |
| 35 to 64 Years | 16 (55.2%) | 0 (0.0%) |
| 65 to 74 Years | 3 (25.0%) | 8 (53.3%) |
| 75 Years and over | 1 (33.3%) | 3 (100.0%) |
Disability Class by Sex by Age in Montezuma
Disability Class: Hearing Difficulty
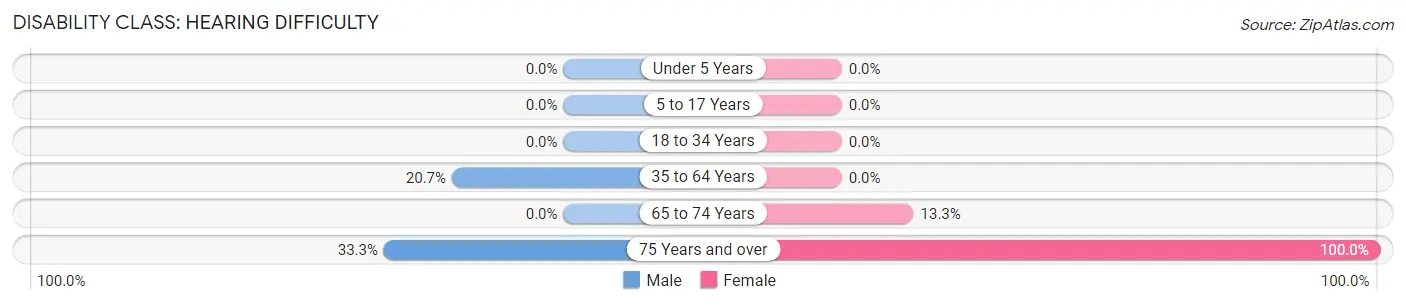
| Age Bracket | Male | Female |
| Under 5 Years | 0 (0.0%) | 0 (0.0%) |
| 5 to 17 Years | 0 (0.0%) | 0 (0.0%) |
| 18 to 34 Years | 0 (0.0%) | 0 (0.0%) |
| 35 to 64 Years | 6 (20.7%) | 0 (0.0%) |
| 65 to 74 Years | 0 (0.0%) | 2 (13.3%) |
| 75 Years and over | 1 (33.3%) | 3 (100.0%) |
Disability Class: Vision Difficulty
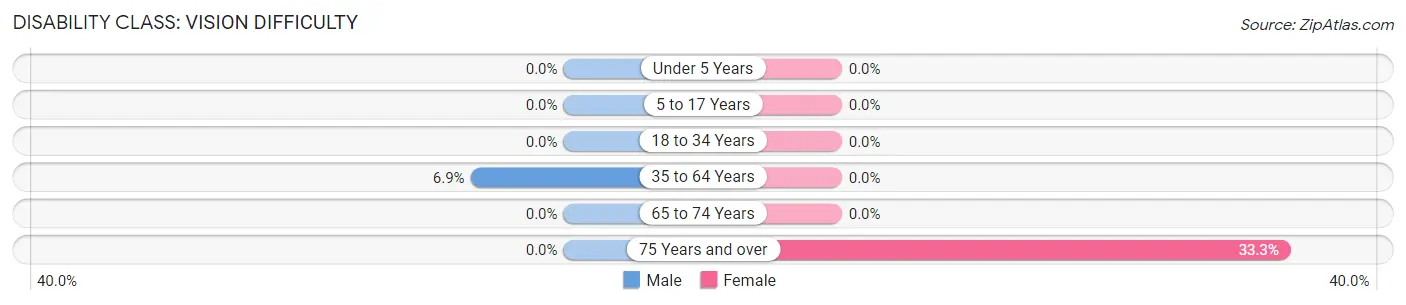
| Age Bracket | Male | Female |
| Under 5 Years | 0 (0.0%) | 0 (0.0%) |
| 5 to 17 Years | 0 (0.0%) | 0 (0.0%) |
| 18 to 34 Years | 0 (0.0%) | 0 (0.0%) |
| 35 to 64 Years | 2 (6.9%) | 0 (0.0%) |
| 65 to 74 Years | 0 (0.0%) | 0 (0.0%) |
| 75 Years and over | 0 (0.0%) | 1 (33.3%) |
Disability Class: Cognitive Difficulty
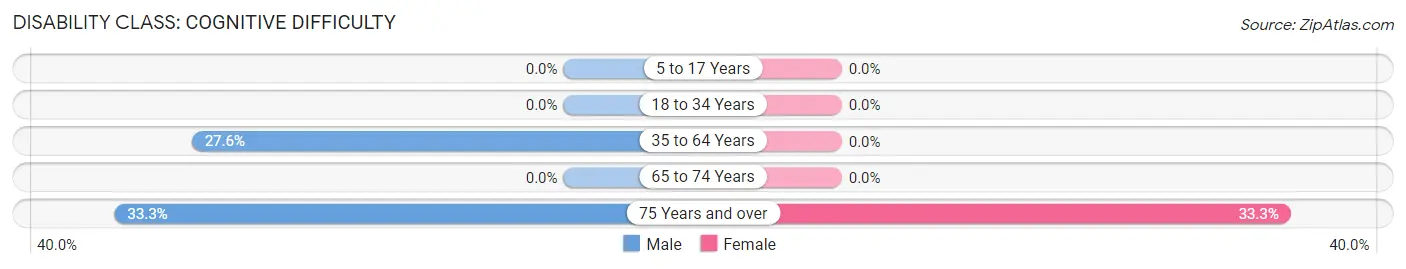
| Age Bracket | Male | Female |
| 5 to 17 Years | 0 (0.0%) | 0 (0.0%) |
| 18 to 34 Years | 0 (0.0%) | 0 (0.0%) |
| 35 to 64 Years | 8 (27.6%) | 0 (0.0%) |
| 65 to 74 Years | 0 (0.0%) | 0 (0.0%) |
| 75 Years and over | 1 (33.3%) | 1 (33.3%) |
Disability Class: Ambulatory Difficulty
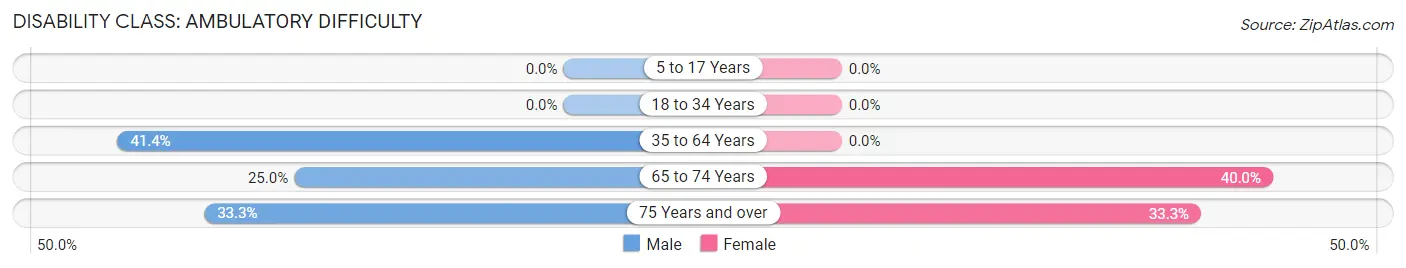
| Age Bracket | Male | Female |
| 5 to 17 Years | 0 (0.0%) | 0 (0.0%) |
| 18 to 34 Years | 0 (0.0%) | 0 (0.0%) |
| 35 to 64 Years | 12 (41.4%) | 0 (0.0%) |
| 65 to 74 Years | 3 (25.0%) | 6 (40.0%) |
| 75 Years and over | 1 (33.3%) | 1 (33.3%) |
Disability Class: Self-Care Difficulty
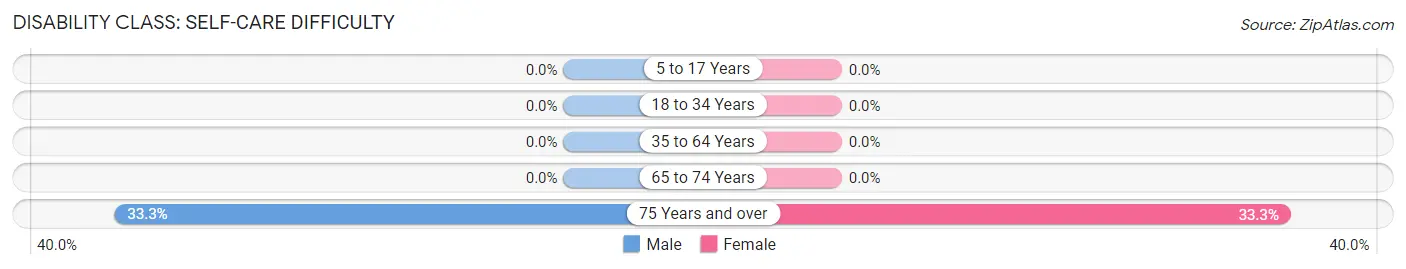
| Age Bracket | Male | Female |
| 5 to 17 Years | 0 (0.0%) | 0 (0.0%) |
| 18 to 34 Years | 0 (0.0%) | 0 (0.0%) |
| 35 to 64 Years | 0 (0.0%) | 0 (0.0%) |
| 65 to 74 Years | 0 (0.0%) | 0 (0.0%) |
| 75 Years and over | 1 (33.3%) | 1 (33.3%) |
Technology Access in Montezuma
Computing Device Access in Montezuma
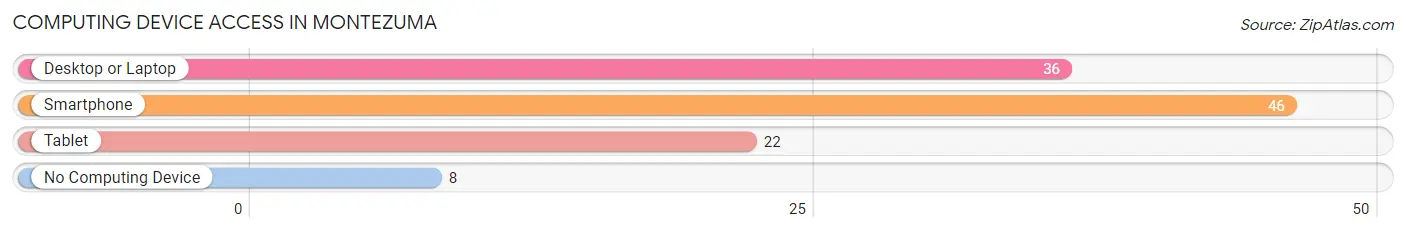
| Device Type | # Households | % Households |
| Desktop or Laptop | 36 | 65.4% |
| Smartphone | 46 | 83.6% |
| Tablet | 22 | 40.0% |
| No Computing Device | 8 | 14.5% |
| Total | 55 | 100.0% |
Internet Access in Montezuma
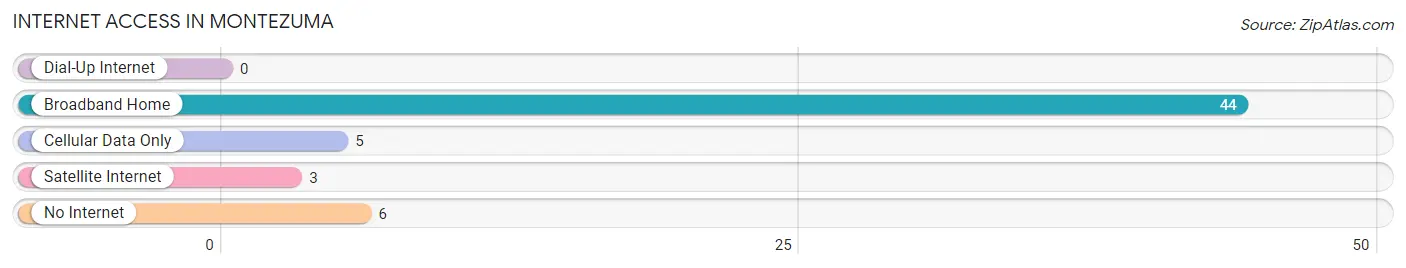
| Internet Type | # Households | % Households |
| Dial-Up Internet | 0 | 0.0% |
| Broadband Home | 44 | 80.0% |
| Cellular Data Only | 5 | 9.1% |
| Satellite Internet | 3 | 5.4% |
| No Internet | 6 | 10.9% |
| Total | 55 | 100.0% |
Montezuma Summary
Montezuma, Ohio is a small village located in Mercer County, Ohio. It is situated on the western edge of the state, near the Indiana border. The village has a population of approximately 1,000 people and is part of the Celina Micropolitan Statistical Area.
History
Montezuma was founded in 1837 by a group of settlers from Pennsylvania. The village was named after the Aztec emperor Montezuma II. The first settlers were primarily of German descent and were attracted to the area by the abundance of fertile land. The village was incorporated in 1845 and was home to a variety of businesses, including a sawmill, a gristmill, a blacksmith shop, and a general store.
In the late 19th century, the village experienced a period of growth and development. The railroad arrived in 1881, bringing with it increased economic opportunities. The village also became a popular tourist destination, with several hotels and resorts being built in the area.
Geography
Montezuma is located in western Ohio, near the Indiana border. It is situated in Mercer County, approximately 30 miles east of Fort Wayne, Indiana. The village is situated on the banks of the Wabash River, which forms the border between Ohio and Indiana. The village is surrounded by rolling hills and farmland.
The climate in Montezuma is humid continental, with hot summers and cold winters. The average annual temperature is around 50 degrees Fahrenheit. The average annual precipitation is around 40 inches.
Economy
The economy of Montezuma is largely based on agriculture. The village is home to several farms, which produce a variety of crops, including corn, soybeans, and wheat. The village also has several small businesses, including a grocery store, a hardware store, and a restaurant.
Demographics
As of the 2010 census, the population of Montezuma was 1,000. The racial makeup of the village was 97.2% White, 0.7% African American, 0.2% Native American, 0.2% Asian, and 1.7% from other races. The median household income was $41,250, and the median family income was $48,750.
Montezuma is a small, rural village with a close-knit community. The village is home to several churches, a library, and a community center. The village also has several parks and recreational areas, including a public swimming pool. The village is served by the Celina City School District.
Common Questions
What is Per Capita Income in Montezuma?
Per Capita income in Montezuma is $38,470.
What is the Median Family Income in Montezuma?
Median Family Income in Montezuma is $87,656.
What is the Median Household income in Montezuma?
Median Household Income in Montezuma is $73,125.
What is Income or Wage Gap in Montezuma?
Income or Wage Gap in Montezuma is 38.9%.
Women in Montezuma earn 61.1 cents for every dollar earned by a man.
What is Inequality or Gini Index in Montezuma?
Inequality or Gini Index in Montezuma is 0.28.
What is the Total Population of Montezuma?
Total Population of Montezuma is 104.
What is the Total Male Population of Montezuma?
Total Male Population of Montezuma is 56.
What is the Total Female Population of Montezuma?
Total Female Population of Montezuma is 48.
What is the Ratio of Males per 100 Females in Montezuma?
There are 116.67 Males per 100 Females in Montezuma.
What is the Ratio of Females per 100 Males in Montezuma?
There are 85.71 Females per 100 Males in Montezuma.
What is the Median Population Age in Montezuma?
Median Population Age in Montezuma is 59.3 Years.
What is the Average Family Size in Montezuma
Average Family Size in Montezuma is 2.2 People.
What is the Average Household Size in Montezuma
Average Household Size in Montezuma is 1.9 People.
How Large is the Labor Force in Montezuma?
There are 46 People in the Labor Forcein in Montezuma.
What is the Percentage of People in the Labor Force in Montezuma?
46.0% of People are in the Labor Force in Montezuma.
What is the Unemployment Rate in Montezuma?
Unemployment Rate in Montezuma is 4.3%.