Zip Codes with the Highest Percentage of Population with a Degree in Visual and Performing Arts in Lorain, OH
RELATED REPORTS & OPTIONS
Visual and Performing Arts
Lorain
Compare Zip Codes
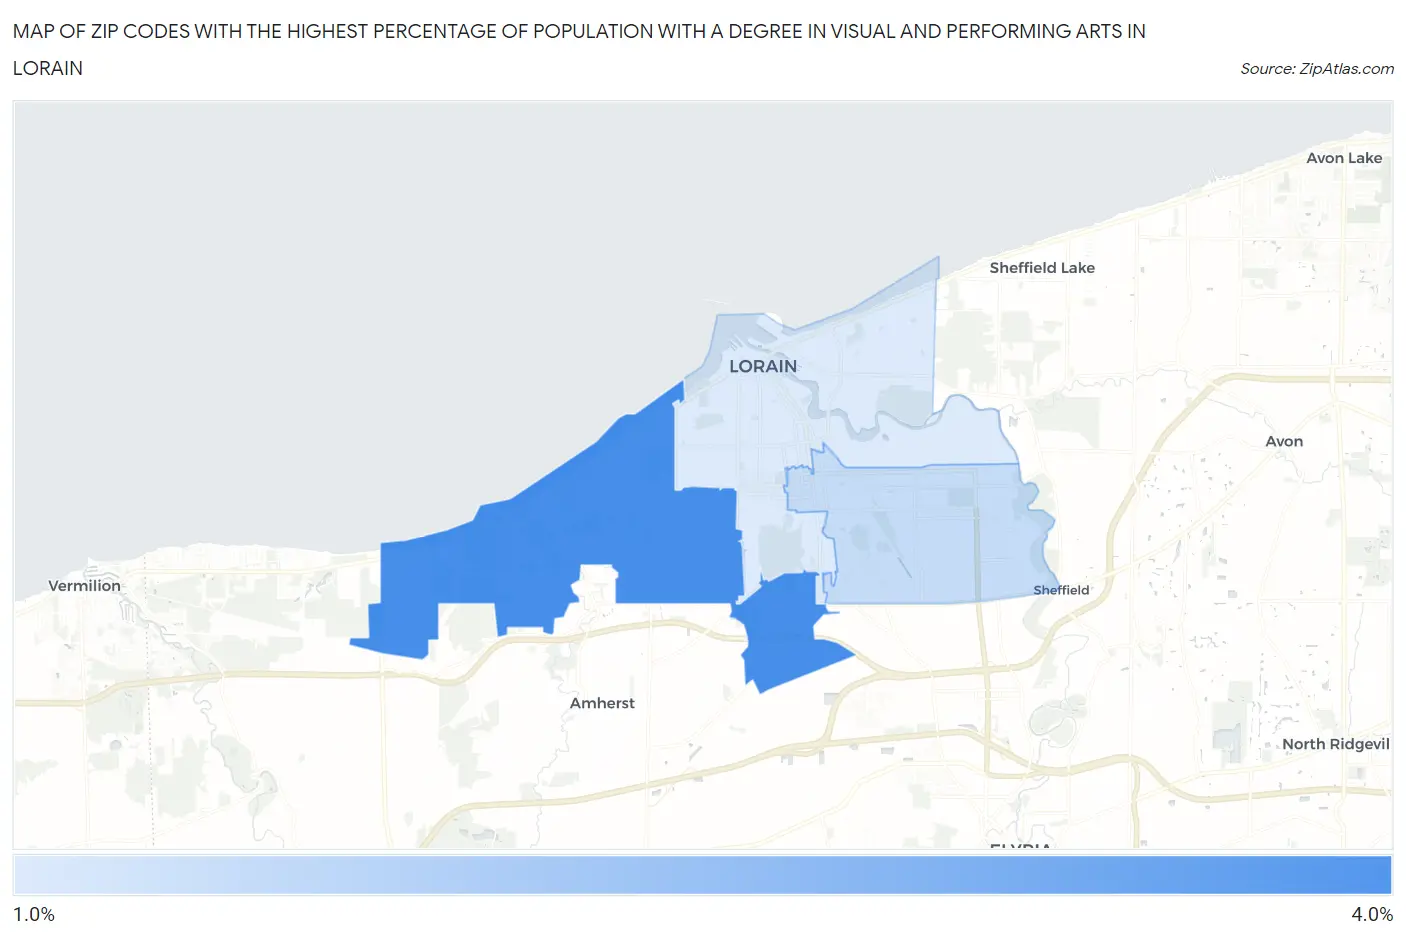
Map of Zip Codes with the Highest Percentage of Population with a Degree in Visual and Performing Arts in Lorain
1.9%
3.8%
Zip Codes with the Highest Percentage of Population with a Degree in Visual and Performing Arts in Lorain, OH
| Zip Code | % Graduates | vs State | vs National | |
| 1. | 44053 | 3.8% | 3.7%(+0.060)#355 | 4.3%(-0.482)#9,943 |
| 2. | 44055 | 2.2% | 3.7%(-1.48)#564 | 4.3%(-2.02)#15,601 |
| 3. | 44052 | 1.9% | 3.7%(-1.77)#606 | 4.3%(-2.31)#16,640 |
1
Common Questions
What are the Top Zip Codes with the Highest Percentage of Population with a Degree in Visual and Performing Arts in Lorain, OH?
Top Zip Codes with the Highest Percentage of Population with a Degree in Visual and Performing Arts in Lorain, OH are:
What zip code has the Highest Percentage of Population with a Degree in Visual and Performing Arts in Lorain, OH?
44053 has the Highest Percentage of Population with a Degree in Visual and Performing Arts in Lorain, OH with 3.8%.
What is the Percentage of Population with a Degree in Visual and Performing Arts in Lorain, OH?
Percentage of Population with a Degree in Visual and Performing Arts in Lorain is 3.0%.
What is the Percentage of Population with a Degree in Visual and Performing Arts in Ohio?
Percentage of Population with a Degree in Visual and Performing Arts in Ohio is 3.7%.
What is the Percentage of Population with a Degree in Visual and Performing Arts in the United States?
Percentage of Population with a Degree in Visual and Performing Arts in the United States is 4.3%.