New Bavaria, OH Map & Demographics
New Bavaria Map
New Bavaria Overview
$39,616
PER CAPITA INCOME
$91,429
AVG FAMILY INCOME
$85,938
AVG HOUSEHOLD INCOME
39.5%
WAGE / INCOME GAP [ % ]
60.5¢/ $1
WAGE / INCOME GAP [ $ ]
0.36
INEQUALITY / GINI INDEX
94
TOTAL POPULATION
48
MALE POPULATION
46
FEMALE POPULATION
104.35
MALES / 100 FEMALES
95.83
FEMALES / 100 MALES
46.8
MEDIAN AGE
2.6
AVG FAMILY SIZE
2.0
AVG HOUSEHOLD SIZE
64
LABOR FORCE [ PEOPLE ]
72.7%
PERCENT IN LABOR FORCE
New Bavaria Zip Codes
New Bavaria Area Codes
Income in New Bavaria
Income Overview in New Bavaria
Per Capita Income in New Bavaria is $39,616, while median incomes of families and households are $91,429 and $85,938 respectively.
| Characteristic | Number | Measure |
| Per Capita Income | 94 | $39,616 |
| Median Family Income | 28 | $91,429 |
| Mean Family Income | 28 | $101,814 |
| Median Household Income | 47 | $85,938 |
| Mean Household Income | 47 | $77,621 |
| Income Deficit | 28 | $0 |
| Wage / Income Gap (%) | 94 | 39.47% |
| Wage / Income Gap ($) | 94 | 60.53¢ per $1 |
| Gini / Inequality Index | 94 | 0.36 |
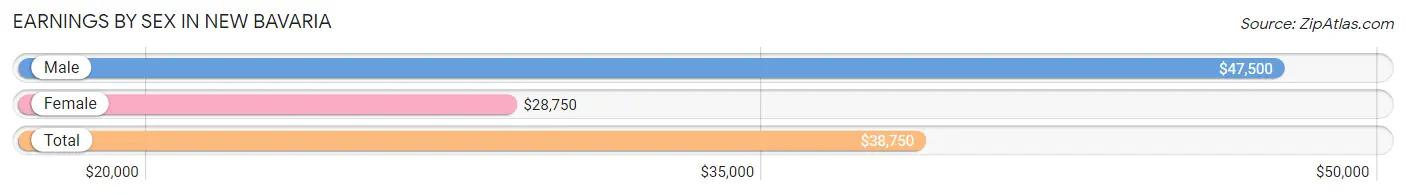
Earnings by Sex in New Bavaria
Average Earnings in New Bavaria are $38,750, $47,500 for men and $28,750 for women, a difference of 39.5%.
| Sex | Number | Average Earnings |
| Male | 34 (48.6%) | $47,500 |
| Female | 36 (51.4%) | $28,750 |
| Total | 70 (100.0%) | $38,750 |
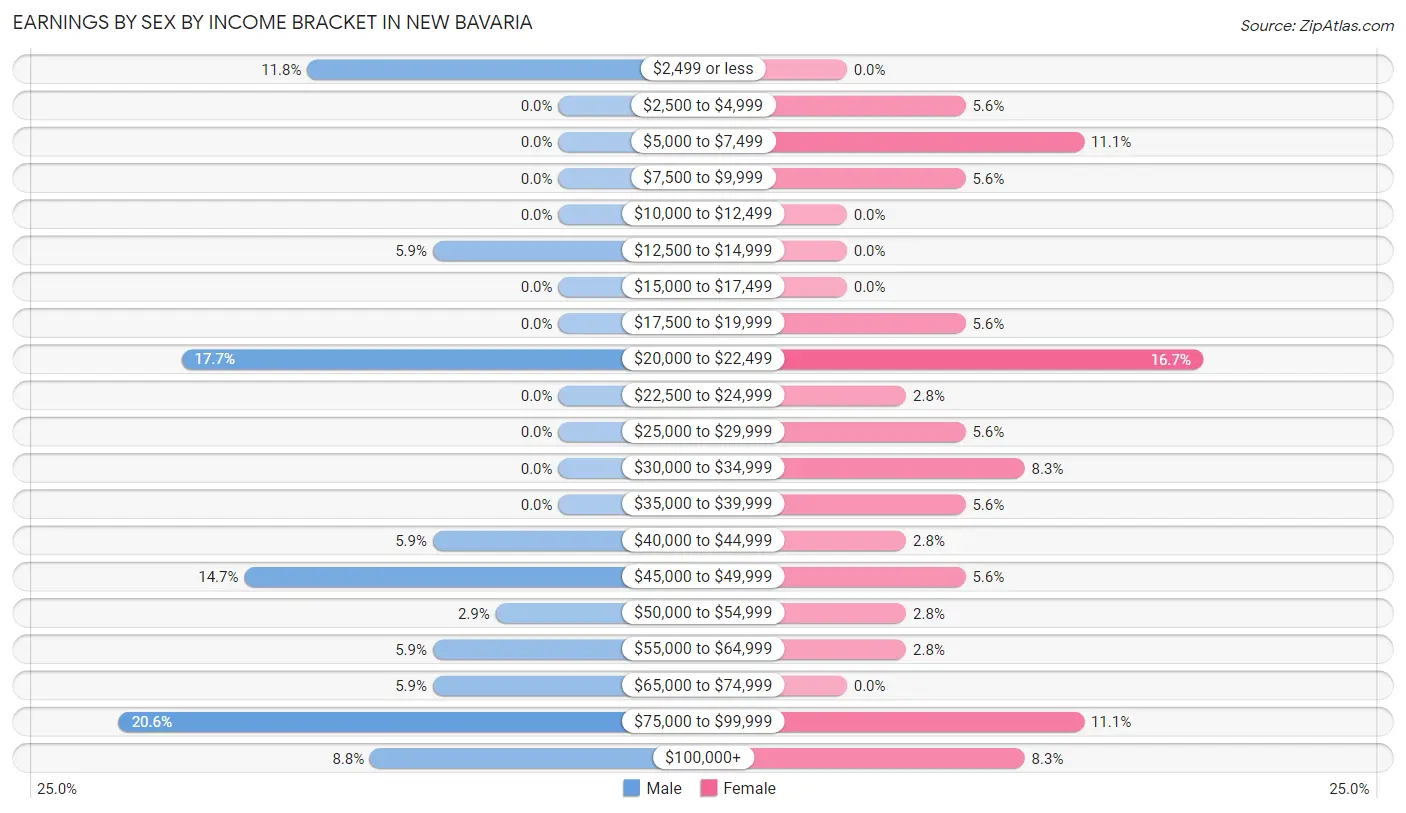
Earnings by Sex by Income Bracket in New Bavaria
The most common earnings brackets in New Bavaria are $75,000 to $99,999 for men (7 | 20.6%) and $20,000 to $22,499 for women (6 | 16.7%).
| Income | Male | Female |
| $2,499 or less | 4 (11.8%) | 0 (0.0%) |
| $2,500 to $4,999 | 0 (0.0%) | 2 (5.6%) |
| $5,000 to $7,499 | 0 (0.0%) | 4 (11.1%) |
| $7,500 to $9,999 | 0 (0.0%) | 2 (5.6%) |
| $10,000 to $12,499 | 0 (0.0%) | 0 (0.0%) |
| $12,500 to $14,999 | 2 (5.9%) | 0 (0.0%) |
| $15,000 to $17,499 | 0 (0.0%) | 0 (0.0%) |
| $17,500 to $19,999 | 0 (0.0%) | 2 (5.6%) |
| $20,000 to $22,499 | 6 (17.6%) | 6 (16.7%) |
| $22,500 to $24,999 | 0 (0.0%) | 1 (2.8%) |
| $25,000 to $29,999 | 0 (0.0%) | 2 (5.6%) |
| $30,000 to $34,999 | 0 (0.0%) | 3 (8.3%) |
| $35,000 to $39,999 | 0 (0.0%) | 2 (5.6%) |
| $40,000 to $44,999 | 2 (5.9%) | 1 (2.8%) |
| $45,000 to $49,999 | 5 (14.7%) | 2 (5.6%) |
| $50,000 to $54,999 | 1 (2.9%) | 1 (2.8%) |
| $55,000 to $64,999 | 2 (5.9%) | 1 (2.8%) |
| $65,000 to $74,999 | 2 (5.9%) | 0 (0.0%) |
| $75,000 to $99,999 | 7 (20.6%) | 4 (11.1%) |
| $100,000+ | 3 (8.8%) | 3 (8.3%) |
| Total | 34 (100.0%) | 36 (100.0%) |
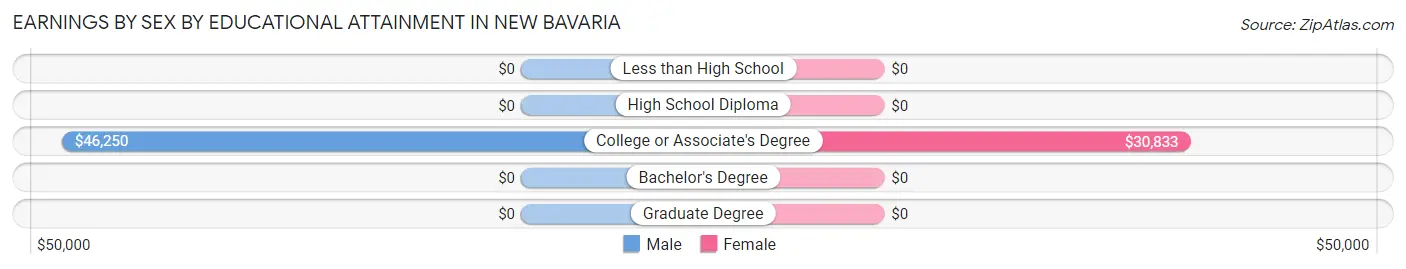
Earnings by Sex by Educational Attainment in New Bavaria
Average earnings in New Bavaria are $48,750 for men and $35,000 for women, a difference of 28.2%. Men with an educational attainment of college or associate's degree enjoy the highest average annual earnings of $46,250, while those with college or associate's degree education earn the least with $46,250. Women with an educational attainment of college or associate's degree earn the most with the average annual earnings of $30,833, while those with college or associate's degree education have the smallest earnings of $30,833.
| Educational Attainment | Male Income | Female Income |
| Less than High School | - | - |
| High School Diploma | - | - |
| College or Associate's Degree | $46,250 | $30,833 |
| Bachelor's Degree | - | - |
| Graduate Degree | - | - |
| Total | $48,750 | $35,000 |
Family Income in New Bavaria
Family Income Brackets in New Bavaria
According to the New Bavaria family income data, there are 13 families falling into the $75,000 to $99,999 income range, which is the most common income bracket and makes up 46.4% of all families.
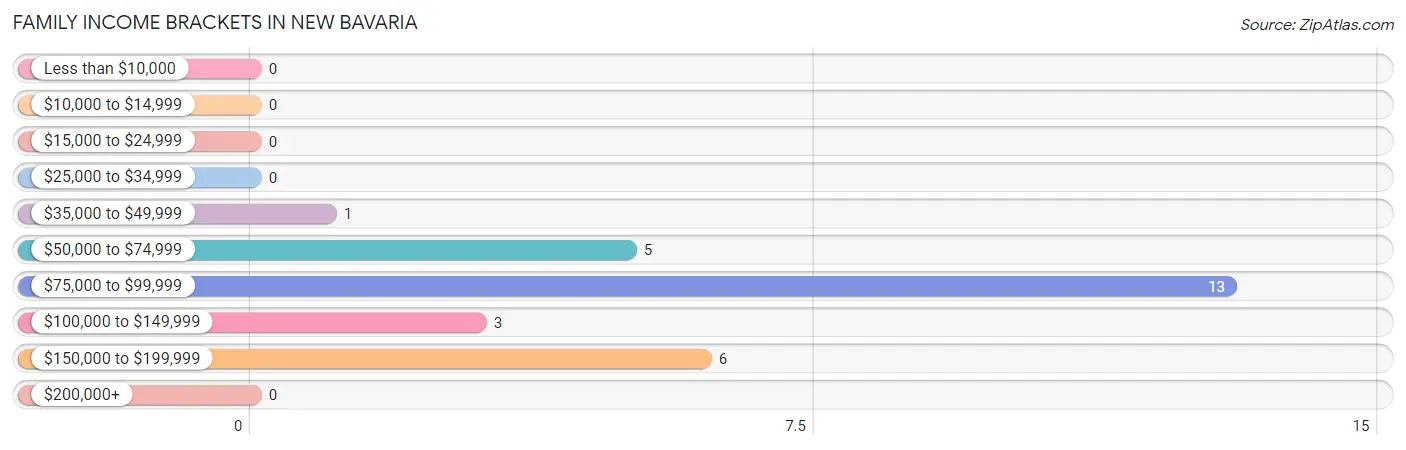
| Income Bracket | # Families | % Families |
| Less than $10,000 | 0 | 0.0% |
| $10,000 to $14,999 | 0 | 0.0% |
| $15,000 to $24,999 | 0 | 0.0% |
| $25,000 to $34,999 | 0 | 0.0% |
| $35,000 to $49,999 | 1 | 3.6% |
| $50,000 to $74,999 | 5 | 17.9% |
| $75,000 to $99,999 | 13 | 46.4% |
| $100,000 to $149,999 | 3 | 10.7% |
| $150,000 to $199,999 | 6 | 21.4% |
| $200,000+ | 0 | 0.0% |
Family Income by Famaliy Size in New Bavaria
2-person families (19 | 67.9%) account for the highest median family income in New Bavaria with $90,893 per family, while 2-person families (19 | 67.9%) have the highest median income of $45,446 per family member.
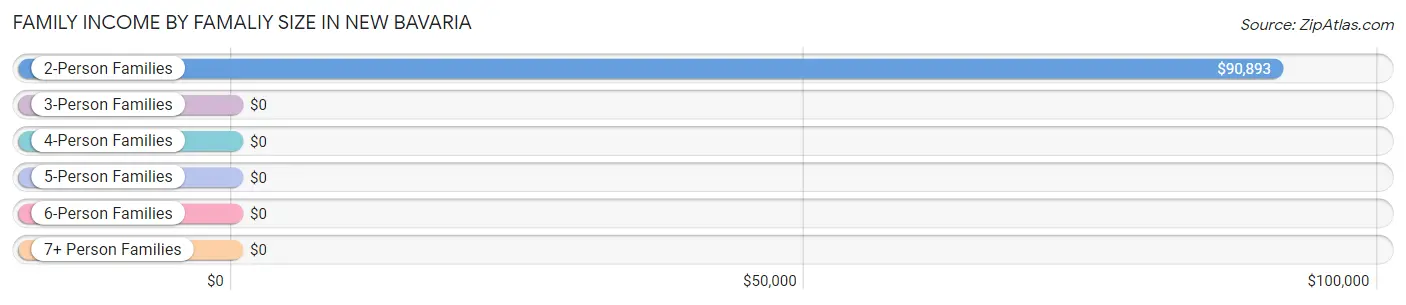
| Income Bracket | # Families | Median Income |
| 2-Person Families | 19 (67.9%) | $90,893 |
| 3-Person Families | 5 (17.9%) | $0 |
| 4-Person Families | 3 (10.7%) | $0 |
| 5-Person Families | 1 (3.6%) | $0 |
| 6-Person Families | 0 (0.0%) | $0 |
| 7+ Person Families | 0 (0.0%) | $0 |
| Total | 28 (100.0%) | $91,429 |
Family Income by Number of Earners in New Bavaria
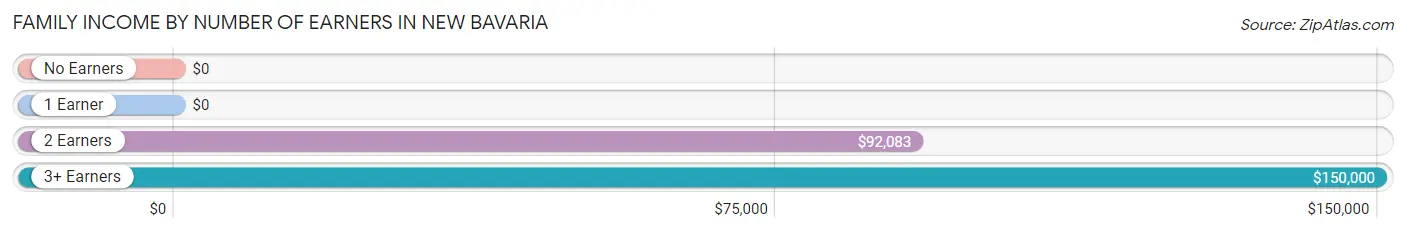
| Number of Earners | # Families | Median Income |
| No Earners | 5 (17.9%) | $0 |
| 1 Earner | 3 (10.7%) | $0 |
| 2 Earners | 14 (50.0%) | $92,083 |
| 3+ Earners | 6 (21.4%) | $150,000 |
| Total | 28 (100.0%) | $91,429 |
Household Income in New Bavaria
Household Income Brackets in New Bavaria
With 15 households falling in the category, the $75,000 to $99,999 income range is the most frequent in New Bavaria, accounting for 31.9% of all households.
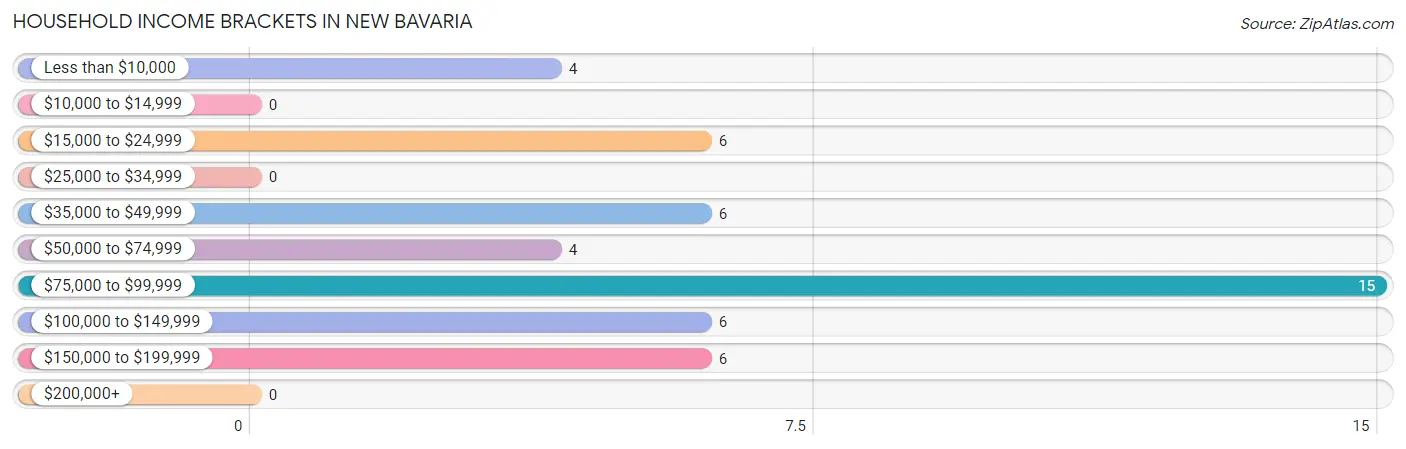
| Income Bracket | # Households | % Households |
| Less than $10,000 | 4 | 8.5% |
| $10,000 to $14,999 | 0 | 0.0% |
| $15,000 to $24,999 | 6 | 12.8% |
| $25,000 to $34,999 | 0 | 0.0% |
| $35,000 to $49,999 | 6 | 12.8% |
| $50,000 to $74,999 | 4 | 8.5% |
| $75,000 to $99,999 | 15 | 31.9% |
| $100,000 to $149,999 | 6 | 12.8% |
| $150,000 to $199,999 | 6 | 12.8% |
| $200,000+ | 0 | 0.0% |
Household Income by Householder Age in New Bavaria
The median household income in New Bavaria is $85,938, with the highest median household income of $90,313 found in the 45 to 64 years age bracket for the primary householder. A total of 29 households (61.7%) fall into this category. Meanwhile, the 15 to 24 years age bracket for the primary householder has the lowest median household income of $0, with 2 households (4.3%) in this group.
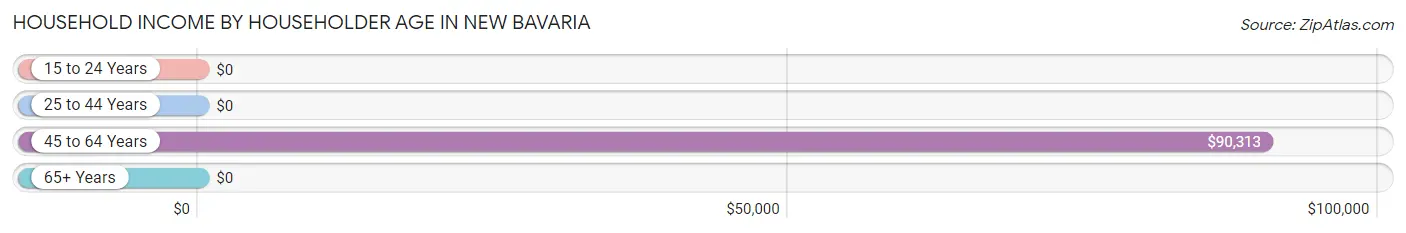
| Income Bracket | # Households | Median Income |
| 15 to 24 Years | 2 (4.3%) | $0 |
| 25 to 44 Years | 9 (19.2%) | $0 |
| 45 to 64 Years | 29 (61.7%) | $90,313 |
| 65+ Years | 7 (14.9%) | $0 |
| Total | 47 (100.0%) | $85,938 |
Poverty in New Bavaria
Income Below Poverty by Sex and Age in New Bavaria
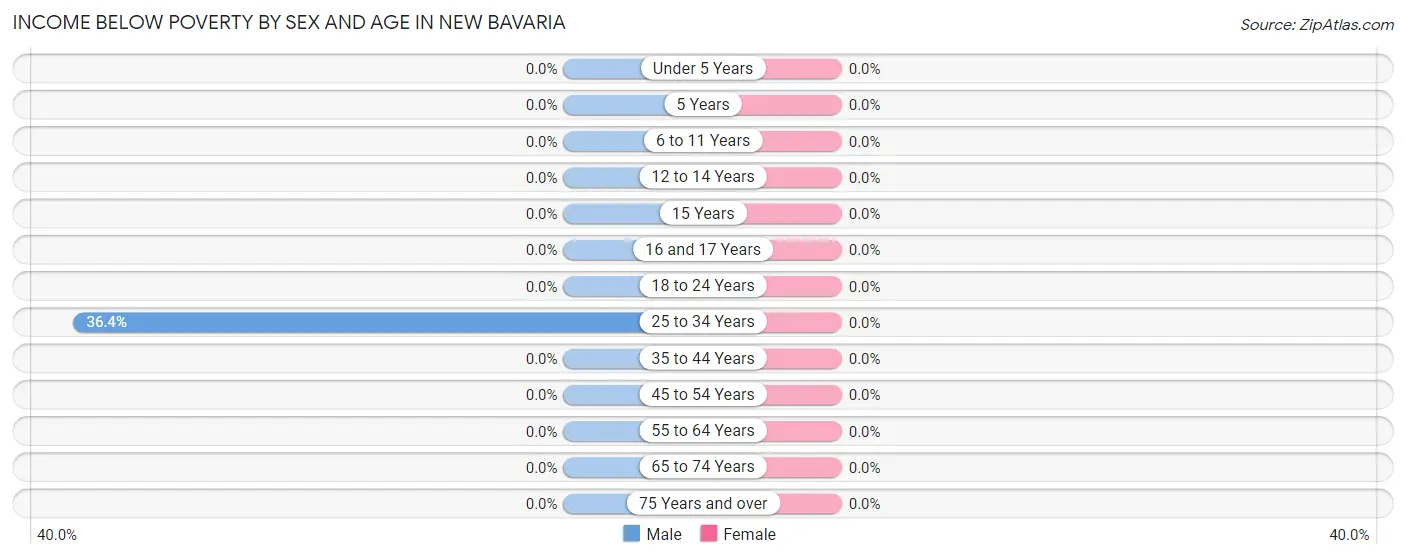
| Age Bracket | Male | Female |
| Under 5 Years | 0 (0.0%) | 0 (0.0%) |
| 5 Years | 0 (0.0%) | 0 (0.0%) |
| 6 to 11 Years | 0 (0.0%) | 0 (0.0%) |
| 12 to 14 Years | 0 (0.0%) | 0 (0.0%) |
| 15 Years | 0 (0.0%) | 0 (0.0%) |
| 16 and 17 Years | 0 (0.0%) | 0 (0.0%) |
| 18 to 24 Years | 0 (0.0%) | 0 (0.0%) |
| 25 to 34 Years | 4 (36.4%) | 0 (0.0%) |
| 35 to 44 Years | 0 (0.0%) | 0 (0.0%) |
| 45 to 54 Years | 0 (0.0%) | 0 (0.0%) |
| 55 to 64 Years | 0 (0.0%) | 0 (0.0%) |
| 65 to 74 Years | 0 (0.0%) | 0 (0.0%) |
| 75 Years and over | 0 (0.0%) | 0 (0.0%) |
| Total | 4 (8.3%) | 0 (0.0%) |
Income Above Poverty by Sex and Age in New Bavaria
According to the poverty statistics in New Bavaria, males aged 6 to 11 years and females aged 6 to 11 years are the age groups that are most secure financially, with 100.0% of males and 100.0% of females in these age groups living above the poverty line.
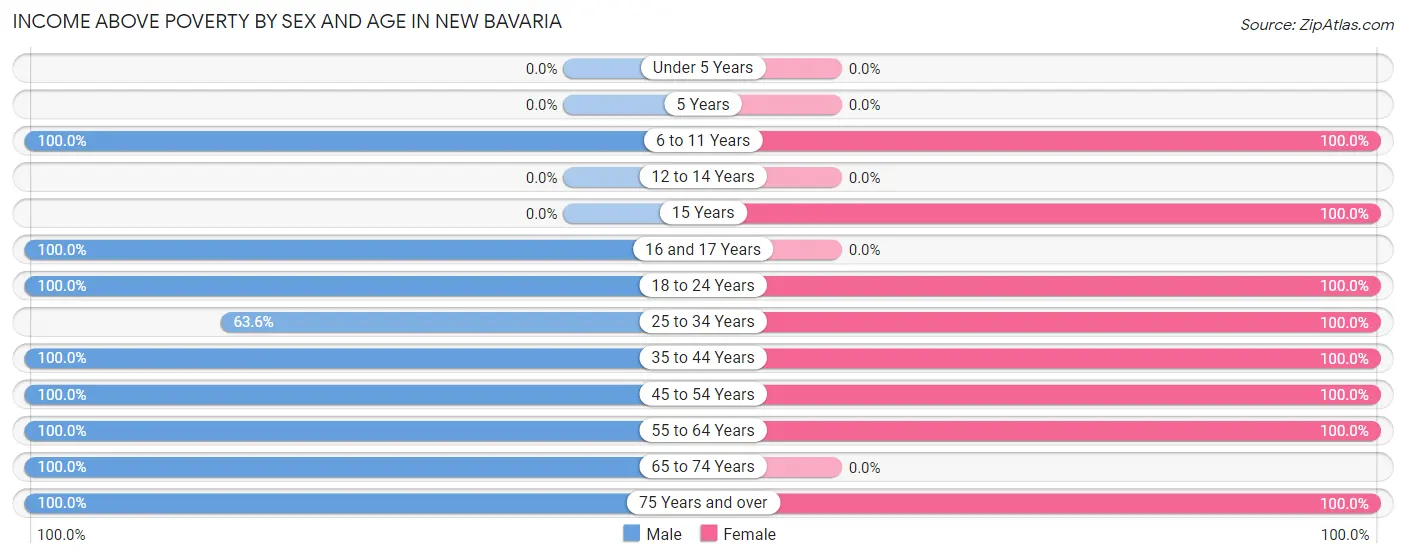
| Age Bracket | Male | Female |
| Under 5 Years | 0 (0.0%) | 0 (0.0%) |
| 5 Years | 0 (0.0%) | 0 (0.0%) |
| 6 to 11 Years | 1 (100.0%) | 1 (100.0%) |
| 12 to 14 Years | 0 (0.0%) | 0 (0.0%) |
| 15 Years | 0 (0.0%) | 4 (100.0%) |
| 16 and 17 Years | 2 (100.0%) | 0 (0.0%) |
| 18 to 24 Years | 2 (100.0%) | 8 (100.0%) |
| 25 to 34 Years | 7 (63.6%) | 3 (100.0%) |
| 35 to 44 Years | 7 (100.0%) | 1 (100.0%) |
| 45 to 54 Years | 7 (100.0%) | 12 (100.0%) |
| 55 to 64 Years | 6 (100.0%) | 16 (100.0%) |
| 65 to 74 Years | 7 (100.0%) | 0 (0.0%) |
| 75 Years and over | 5 (100.0%) | 1 (100.0%) |
| Total | 44 (91.7%) | 46 (100.0%) |
Income Below Poverty Among Married-Couple Families in New Bavaria
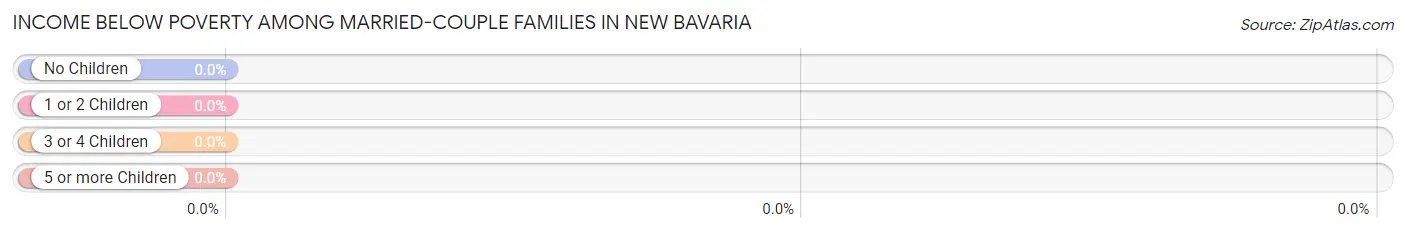
| Children | Above Poverty | Below Poverty |
| No Children | 22 (100.0%) | 0 (0.0%) |
| 1 or 2 Children | 2 (100.0%) | 0 (0.0%) |
| 3 or 4 Children | 1 (100.0%) | 0 (0.0%) |
| 5 or more Children | 0 (0.0%) | 0 (0.0%) |
| Total | 25 (100.0%) | 0 (0.0%) |
Income Below Poverty Among Single-Parent Households in New Bavaria
| Children | Single Father | Single Mother |
| No Children | 0 (0.0%) | 0 (0.0%) |
| 1 or 2 Children | 0 (0.0%) | 0 (0.0%) |
| 3 or 4 Children | 0 (0.0%) | 0 (0.0%) |
| 5 or more Children | 0 (0.0%) | 0 (0.0%) |
| Total | 0 (0.0%) | 0 (0.0%) |
Income Below Poverty Among Married-Couple vs Single-Parent Households in New Bavaria
| Children | Married-Couple Families | Single-Parent Households |
| No Children | 0 (0.0%) | 0 (0.0%) |
| 1 or 2 Children | 0 (0.0%) | 0 (0.0%) |
| 3 or 4 Children | 0 (0.0%) | 0 (0.0%) |
| 5 or more Children | 0 (0.0%) | 0 (0.0%) |
| Total | 0 (0.0%) | 0 (0.0%) |
Race in New Bavaria
The most populous races in New Bavaria are White / Caucasian (91 | 96.8%), Hispanic or Latino (4 | 4.3%), and Some other Race (2 | 2.1%).
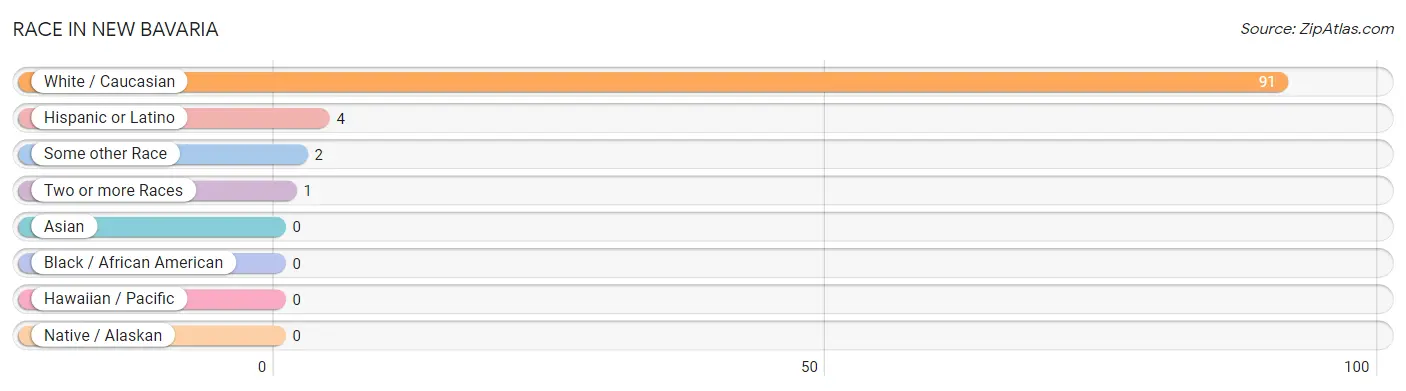
| Race | # Population | % Population |
| Asian | 0 | 0.0% |
| Black / African American | 0 | 0.0% |
| Hawaiian / Pacific | 0 | 0.0% |
| Hispanic or Latino | 4 | 4.3% |
| Native / Alaskan | 0 | 0.0% |
| White / Caucasian | 91 | 96.8% |
| Two or more Races | 1 | 1.1% |
| Some other Race | 2 | 2.1% |
| Total | 94 | 100.0% |
Ancestry in New Bavaria
The most populous ancestries reported in New Bavaria are German (49 | 52.1%), American (21 | 22.3%), English (11 | 11.7%), Swedish (5 | 5.3%), and Mexican (3 | 3.2%), together accounting for 94.7% of all New Bavaria residents.
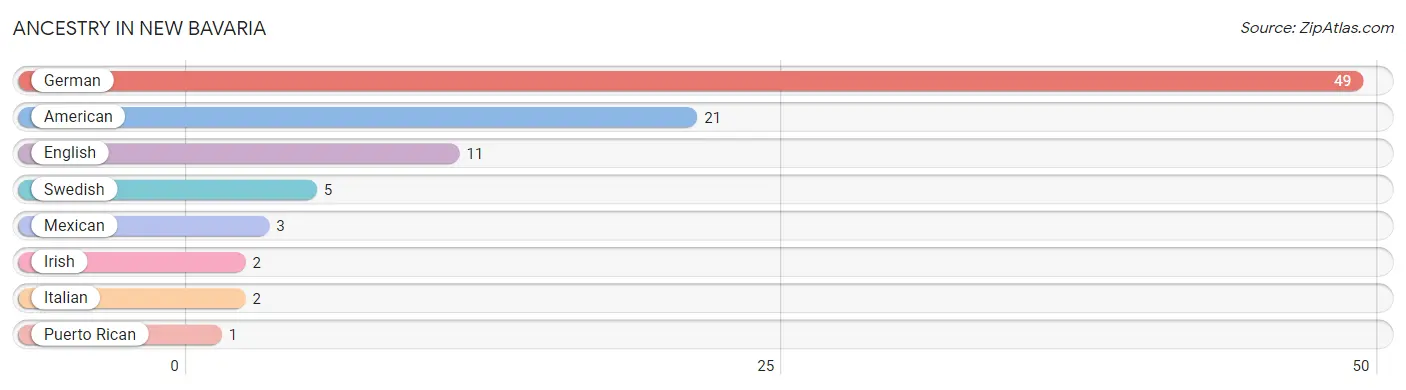
| Ancestry | # Population | % Population |
| American | 21 | 22.3% |
| English | 11 | 11.7% |
| German | 49 | 52.1% |
| Irish | 2 | 2.1% |
| Italian | 2 | 2.1% |
| Mexican | 3 | 3.2% |
| Puerto Rican | 1 | 1.1% |
| Swedish | 5 | 5.3% | View All 8 Rows |
Immigrants in New Bavaria

| Immigration Origin | # Population | % Population | View All 0 Rows |
Sex and Age in New Bavaria
Sex and Age in New Bavaria
The most populous age groups in New Bavaria are 40 to 44 Years (7 | 14.6%) for men and 55 to 59 Years (8 | 17.4%) for women.
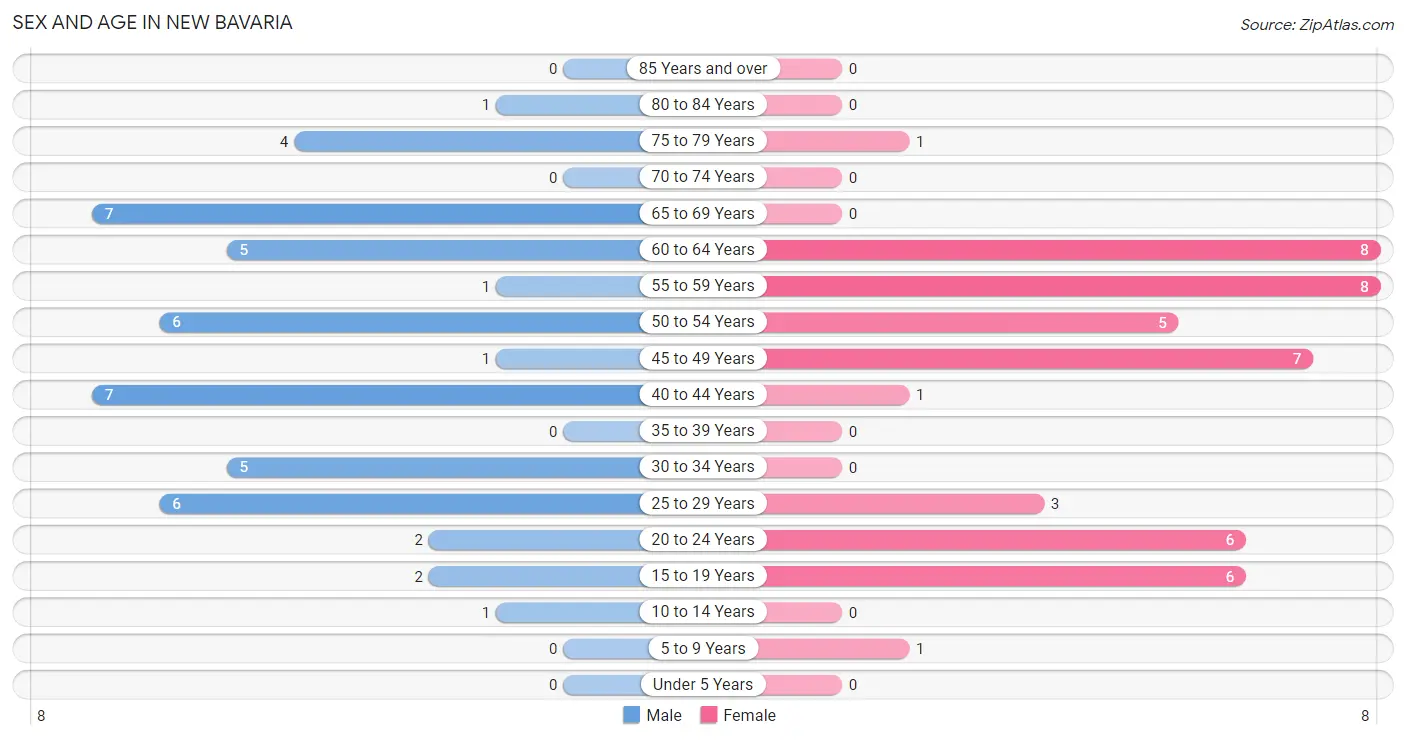
| Age Bracket | Male | Female |
| Under 5 Years | 0 (0.0%) | 0 (0.0%) |
| 5 to 9 Years | 0 (0.0%) | 1 (2.2%) |
| 10 to 14 Years | 1 (2.1%) | 0 (0.0%) |
| 15 to 19 Years | 2 (4.2%) | 6 (13.0%) |
| 20 to 24 Years | 2 (4.2%) | 6 (13.0%) |
| 25 to 29 Years | 6 (12.5%) | 3 (6.5%) |
| 30 to 34 Years | 5 (10.4%) | 0 (0.0%) |
| 35 to 39 Years | 0 (0.0%) | 0 (0.0%) |
| 40 to 44 Years | 7 (14.6%) | 1 (2.2%) |
| 45 to 49 Years | 1 (2.1%) | 7 (15.2%) |
| 50 to 54 Years | 6 (12.5%) | 5 (10.9%) |
| 55 to 59 Years | 1 (2.1%) | 8 (17.4%) |
| 60 to 64 Years | 5 (10.4%) | 8 (17.4%) |
| 65 to 69 Years | 7 (14.6%) | 0 (0.0%) |
| 70 to 74 Years | 0 (0.0%) | 0 (0.0%) |
| 75 to 79 Years | 4 (8.3%) | 1 (2.2%) |
| 80 to 84 Years | 1 (2.1%) | 0 (0.0%) |
| 85 Years and over | 0 (0.0%) | 0 (0.0%) |
| Total | 48 (100.0%) | 46 (100.0%) |
Families and Households in New Bavaria
Median Family Size in New Bavaria
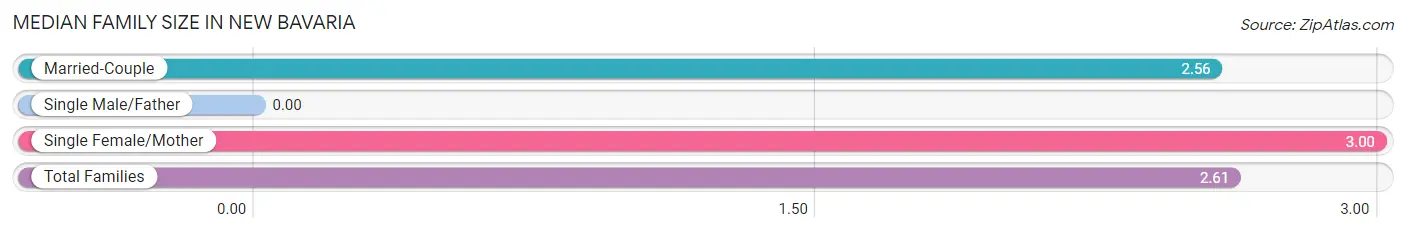
| Family Type | # Families | Family Size |
| Married-Couple | 25 (89.3%) | 2.56 |
| Single Male/Father | 0 (0.0%) | - |
| Single Female/Mother | 3 (10.7%) | 3.00 |
| Total Families | 28 (100.0%) | 2.61 |
Median Household Size in New Bavaria
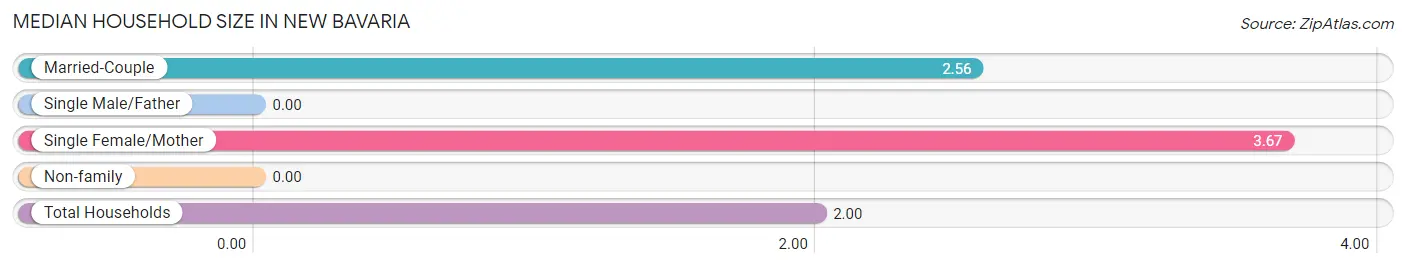
| Household Type | # Households | Household Size |
| Married-Couple | 25 (53.2%) | 2.56 |
| Single Male/Father | 0 (0.0%) | - |
| Single Female/Mother | 3 (6.4%) | 3.67 |
| Non-family | 19 (40.4%) | - |
| Total Households | 47 (100.0%) | 2.00 |
Household Size by Marriage Status in New Bavaria
Out of a total of 47 households in New Bavaria, 28 (59.6%) are family households, while 19 (40.4%) are nonfamily households. The most numerous type of family households are 2-person households, comprising 19, and the most common type of nonfamily households are 1-person households, comprising 19.
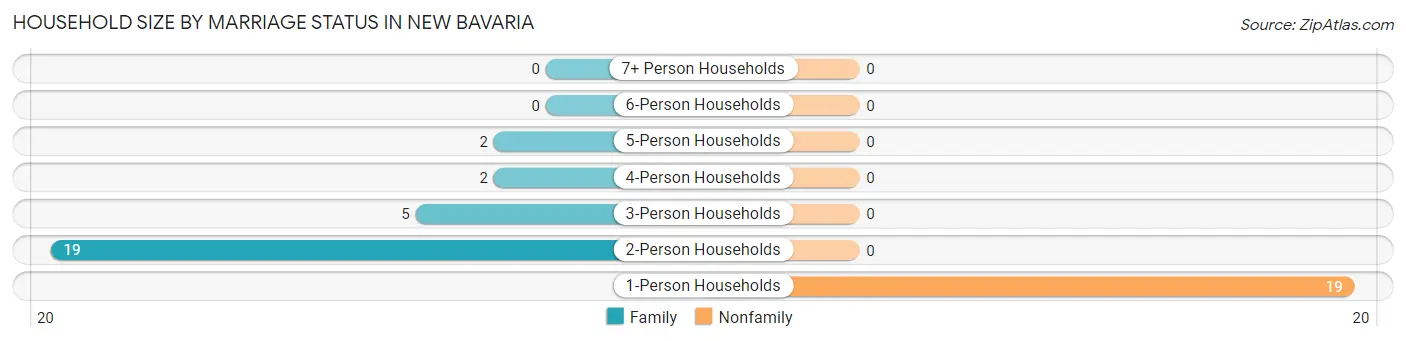
| Household Size | Family Households | Nonfamily Households |
| 1-Person Households | - | 19 (40.4%) |
| 2-Person Households | 19 (40.4%) | 0 (0.0%) |
| 3-Person Households | 5 (10.6%) | 0 (0.0%) |
| 4-Person Households | 2 (4.3%) | 0 (0.0%) |
| 5-Person Households | 2 (4.3%) | 0 (0.0%) |
| 6-Person Households | 0 (0.0%) | 0 (0.0%) |
| 7+ Person Households | 0 (0.0%) | 0 (0.0%) |
| Total | 28 (59.6%) | 19 (40.4%) |
Female Fertility in New Bavaria
Fertility by Age in New Bavaria
| Age Bracket | Women with Births | Births / 1,000 Women |
| 15 to 19 years | 0 (0.0%) | 0.0 |
| 20 to 34 years | 0 (0.0%) | 0.0 |
| 35 to 50 years | 0 (0.0%) | 0.0 |
| Total | 0 (0.0%) | 0.0 |
Fertility by Age by Marriage Status in New Bavaria
| Age Bracket | Married | Unmarried |
| 15 to 19 years | 0 (0.0%) | 0 (0.0%) |
| 20 to 34 years | 0 (0.0%) | 0 (0.0%) |
| 35 to 50 years | 0 (0.0%) | 0 (0.0%) |
| Total | 0 (0.0%) | 0 (0.0%) |
Fertility by Education in New Bavaria
| Educational Attainment | Women with Births | Births / 1,000 Women |
| Less than High School | 0 (0.0%) | 0.0 |
| High School Diploma | 0 (0.0%) | 0.0 |
| College or Associate's Degree | 0 (0.0%) | 0.0 |
| Bachelor's Degree | 0 (0.0%) | 0.0 |
| Graduate Degree | 0 (0.0%) | 0.0 |
| Total | 0 (0.0%) | 0.0 |
Fertility by Education by Marriage Status in New Bavaria
| Educational Attainment | Married | Unmarried |
| Less than High School | 0 (0.0%) | 0 (0.0%) |
| High School Diploma | 0 (0.0%) | 0 (0.0%) |
| College or Associate's Degree | 0 (0.0%) | 0 (0.0%) |
| Bachelor's Degree | 0 (0.0%) | 0 (0.0%) |
| Graduate Degree | 0 (0.0%) | 0 (0.0%) |
| Total | 0 (0.0%) | 0 (0.0%) |
Employment Characteristics in New Bavaria
Employment by Class of Employer in New Bavaria
Among the 62 employed individuals in New Bavaria, private company employees (32 | 51.6%), not-for-profit organizations (11 | 17.7%), and self-employed (incorporated) (8 | 12.9%) make up the most common classes of employment.
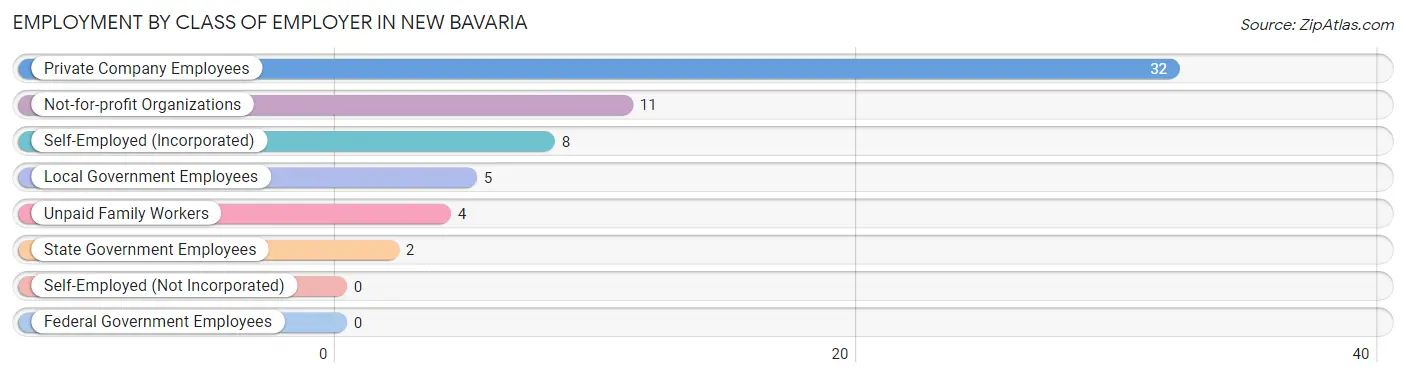
| Employer Class | # Employees | % Employees |
| Private Company Employees | 32 | 51.6% |
| Self-Employed (Incorporated) | 8 | 12.9% |
| Self-Employed (Not Incorporated) | 0 | 0.0% |
| Not-for-profit Organizations | 11 | 17.7% |
| Local Government Employees | 5 | 8.1% |
| State Government Employees | 2 | 3.2% |
| Federal Government Employees | 0 | 0.0% |
| Unpaid Family Workers | 4 | 6.5% |
| Total | 62 | 100.0% |
Employment Status by Age in New Bavaria
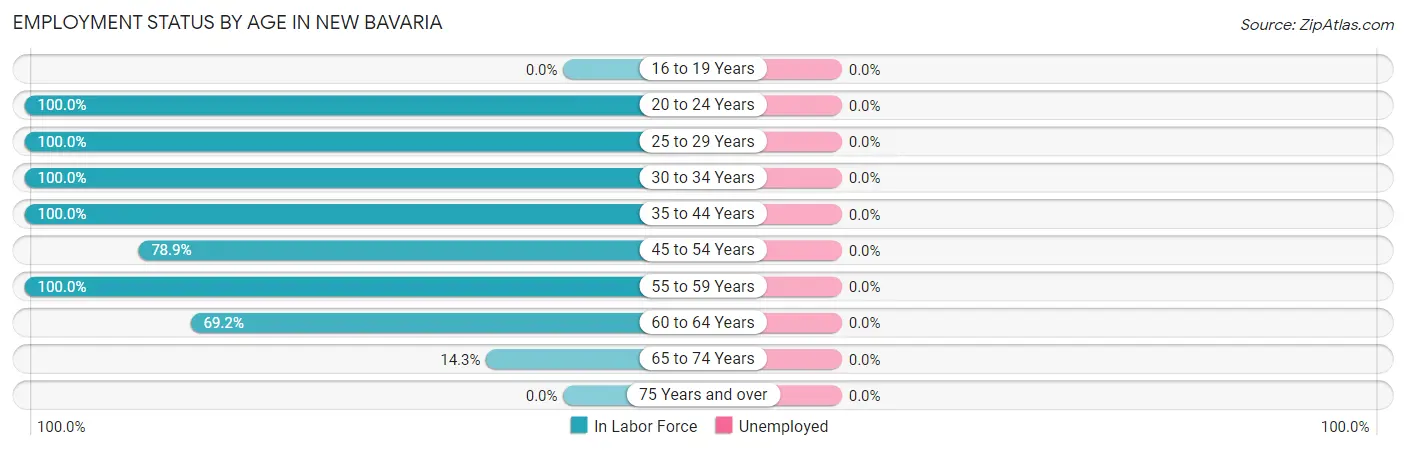
| Age Bracket | In Labor Force | Unemployed |
| 16 to 19 Years | 0 (0.0%) | 0 (0.0%) |
| 20 to 24 Years | 8 (100.0%) | 0 (0.0%) |
| 25 to 29 Years | 9 (100.0%) | 0 (0.0%) |
| 30 to 34 Years | 5 (100.0%) | 0 (0.0%) |
| 35 to 44 Years | 8 (100.0%) | 0 (0.0%) |
| 45 to 54 Years | 15 (78.9%) | 0 (0.0%) |
| 55 to 59 Years | 9 (100.0%) | 0 (0.0%) |
| 60 to 64 Years | 9 (69.2%) | 0 (0.0%) |
| 65 to 74 Years | 1 (14.3%) | 0 (0.0%) |
| 75 Years and over | 0 (0.0%) | 0 (0.0%) |
| Total | 64 (72.7%) | 0 (0.0%) |
Employment Status by Educational Attainment in New Bavaria
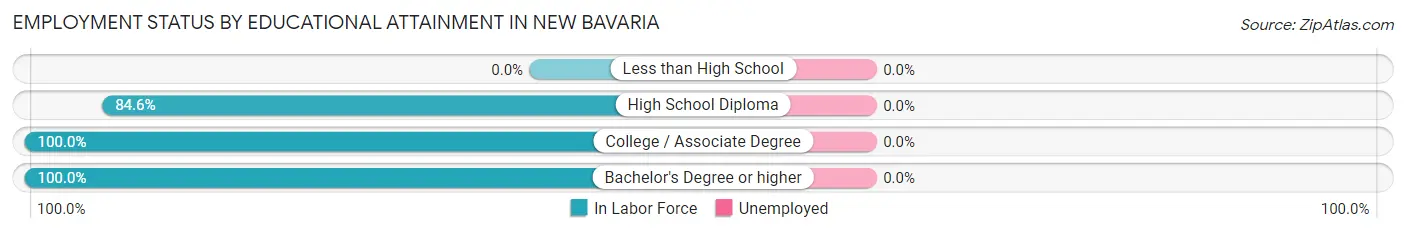
| Educational Attainment | In Labor Force | Unemployed |
| Less than High School | 0 (0.0%) | 0 (0.0%) |
| High School Diploma | 22 (84.6%) | 0 (0.0%) |
| College / Associate Degree | 18 (100.0%) | 0 (0.0%) |
| Bachelor's Degree or higher | 15 (100.0%) | 0 (0.0%) |
| Total | 55 (87.3%) | 0 (0.0%) |
Employment Occupations by Sex in New Bavaria
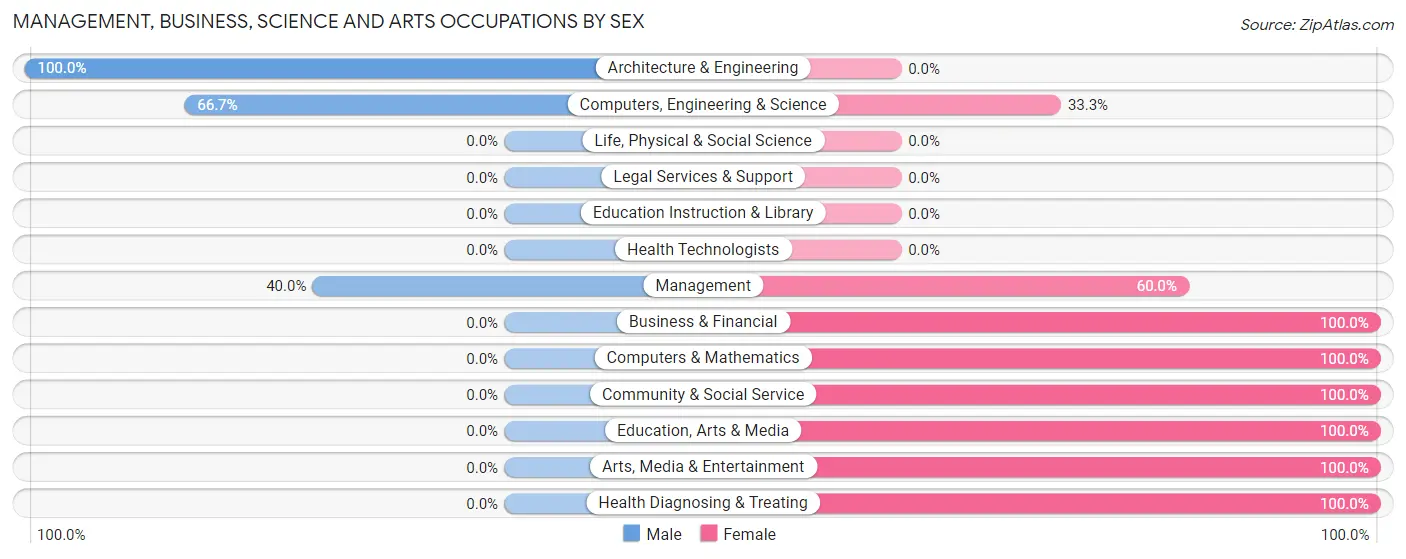
Management, Business, Science and Arts Occupations
The most common Management, Business, Science and Arts occupations in New Bavaria are Management (5 | 7.8%), Health Diagnosing & Treating (5 | 7.8%), Community & Social Service (4 | 6.2%), Computers, Engineering & Science (3 | 4.7%), and Business & Financial (2 | 3.1%).
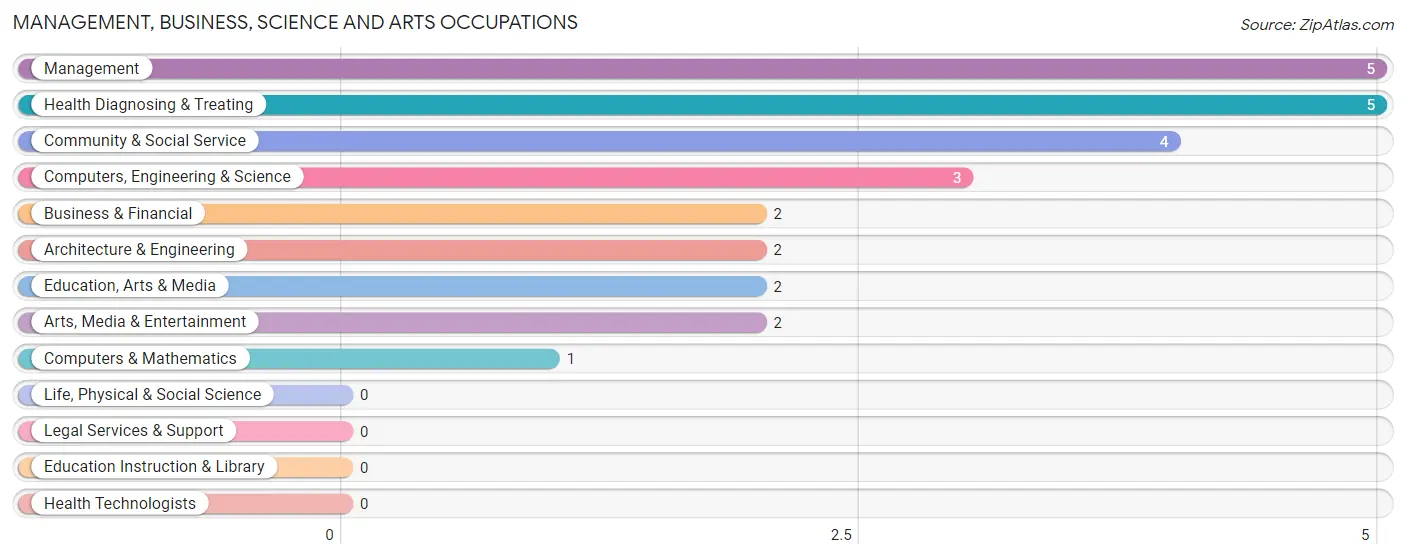
Management, Business, Science and Arts Occupations by Sex
Within the Management, Business, Science and Arts occupations in New Bavaria, the most male-oriented occupations are Architecture & Engineering (100.0%), Computers, Engineering & Science (66.7%), and Management (40.0%), while the most female-oriented occupations are Business & Financial (100.0%), Computers & Mathematics (100.0%), and Community & Social Service (100.0%).
| Occupation | Male | Female |
| Management | 2 (40.0%) | 3 (60.0%) |
| Business & Financial | 0 (0.0%) | 2 (100.0%) |
| Computers, Engineering & Science | 2 (66.7%) | 1 (33.3%) |
| Computers & Mathematics | 0 (0.0%) | 1 (100.0%) |
| Architecture & Engineering | 2 (100.0%) | 0 (0.0%) |
| Life, Physical & Social Science | 0 (0.0%) | 0 (0.0%) |
| Community & Social Service | 0 (0.0%) | 4 (100.0%) |
| Education, Arts & Media | 0 (0.0%) | 2 (100.0%) |
| Legal Services & Support | 0 (0.0%) | 0 (0.0%) |
| Education Instruction & Library | 0 (0.0%) | 0 (0.0%) |
| Arts, Media & Entertainment | 0 (0.0%) | 2 (100.0%) |
| Health Diagnosing & Treating | 0 (0.0%) | 5 (100.0%) |
| Health Technologists | 0 (0.0%) | 0 (0.0%) |
| Total (Category) | 4 (21.0%) | 15 (78.9%) |
| Total (Overall) | 34 (53.1%) | 30 (46.9%) |
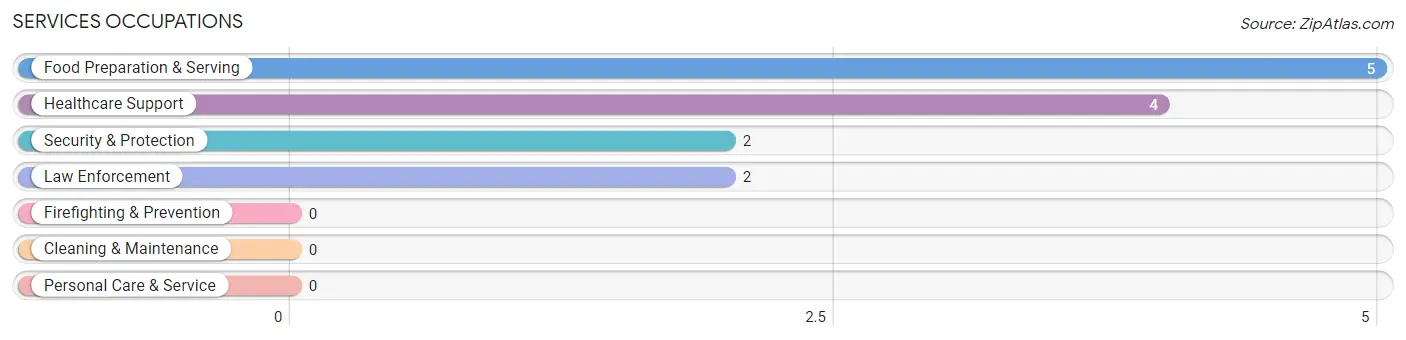
Services Occupations
The most common Services occupations in New Bavaria are Food Preparation & Serving (5 | 7.8%), Healthcare Support (4 | 6.2%), Security & Protection (2 | 3.1%), and Law Enforcement (2 | 3.1%).
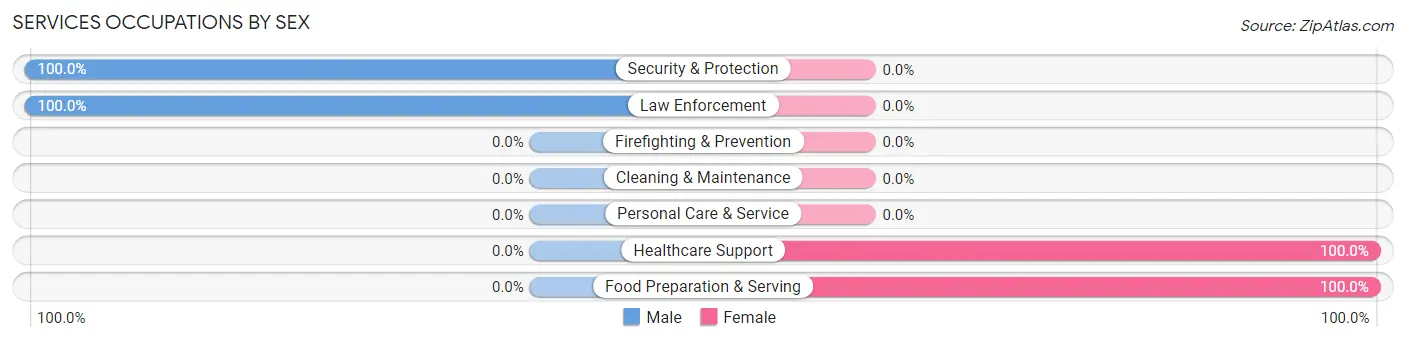
Services Occupations by Sex
Within the Services occupations in New Bavaria, the most male-oriented occupations are Security & Protection (100.0%), and Law Enforcement (100.0%), while the most female-oriented occupations are Healthcare Support (100.0%), and Food Preparation & Serving (100.0%).
| Occupation | Male | Female |
| Healthcare Support | 0 (0.0%) | 4 (100.0%) |
| Security & Protection | 2 (100.0%) | 0 (0.0%) |
| Firefighting & Prevention | 0 (0.0%) | 0 (0.0%) |
| Law Enforcement | 2 (100.0%) | 0 (0.0%) |
| Food Preparation & Serving | 0 (0.0%) | 5 (100.0%) |
| Cleaning & Maintenance | 0 (0.0%) | 0 (0.0%) |
| Personal Care & Service | 0 (0.0%) | 0 (0.0%) |
| Total (Category) | 2 (18.2%) | 9 (81.8%) |
| Total (Overall) | 34 (53.1%) | 30 (46.9%) |
Sales and Office Occupations
The most common Sales and Office occupations in New Bavaria are , and Office & Administration (4 | 6.2%).

Sales and Office Occupations by Sex

| Occupation | Male | Female |
| Sales & Related | 0 (0.0%) | 0 (0.0%) |
| Office & Administration | 0 (0.0%) | 4 (100.0%) |
| Total (Category) | 0 (0.0%) | 4 (100.0%) |
| Total (Overall) | 34 (53.1%) | 30 (46.9%) |
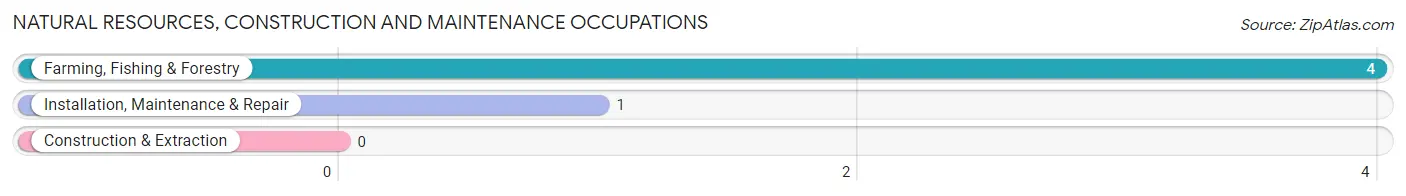
Natural Resources, Construction and Maintenance Occupations
The most common Natural Resources, Construction and Maintenance occupations in New Bavaria are Farming, Fishing & Forestry (4 | 6.2%), and Installation, Maintenance & Repair (1 | 1.6%).
Natural Resources, Construction and Maintenance Occupations by Sex
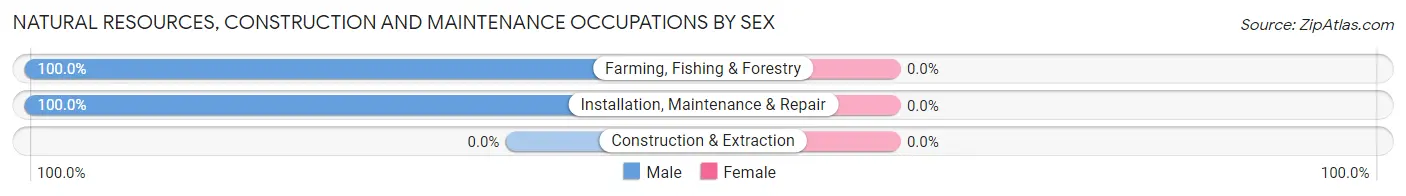
| Occupation | Male | Female |
| Farming, Fishing & Forestry | 4 (100.0%) | 0 (0.0%) |
| Construction & Extraction | 0 (0.0%) | 0 (0.0%) |
| Installation, Maintenance & Repair | 1 (100.0%) | 0 (0.0%) |
| Total (Category) | 5 (100.0%) | 0 (0.0%) |
| Total (Overall) | 34 (53.1%) | 30 (46.9%) |
Production, Transportation and Moving Occupations
The most common Production, Transportation and Moving occupations in New Bavaria are Material Moving (12 | 18.8%), Transportation (10 | 15.6%), and Production (3 | 4.7%).
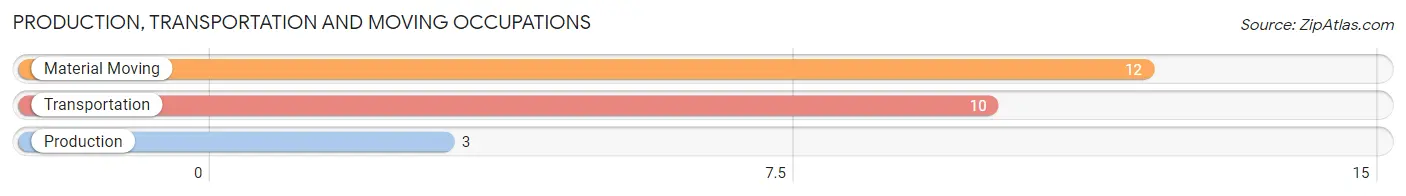
Production, Transportation and Moving Occupations by Sex
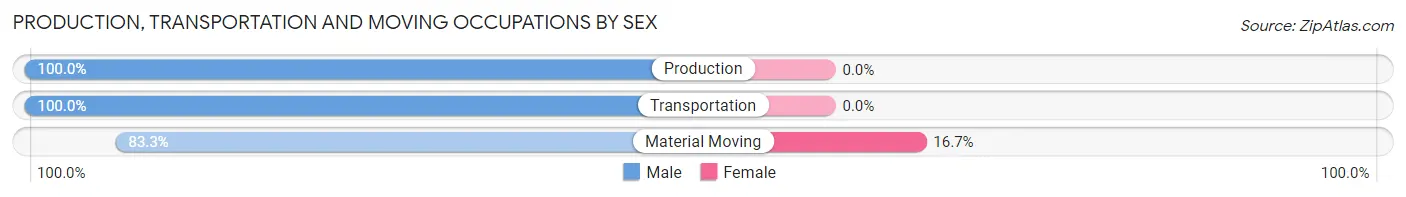
| Occupation | Male | Female |
| Production | 3 (100.0%) | 0 (0.0%) |
| Transportation | 10 (100.0%) | 0 (0.0%) |
| Material Moving | 10 (83.3%) | 2 (16.7%) |
| Total (Category) | 23 (92.0%) | 2 (8.0%) |
| Total (Overall) | 34 (53.1%) | 30 (46.9%) |
Employment Industries by Sex in New Bavaria
Employment Industries in New Bavaria
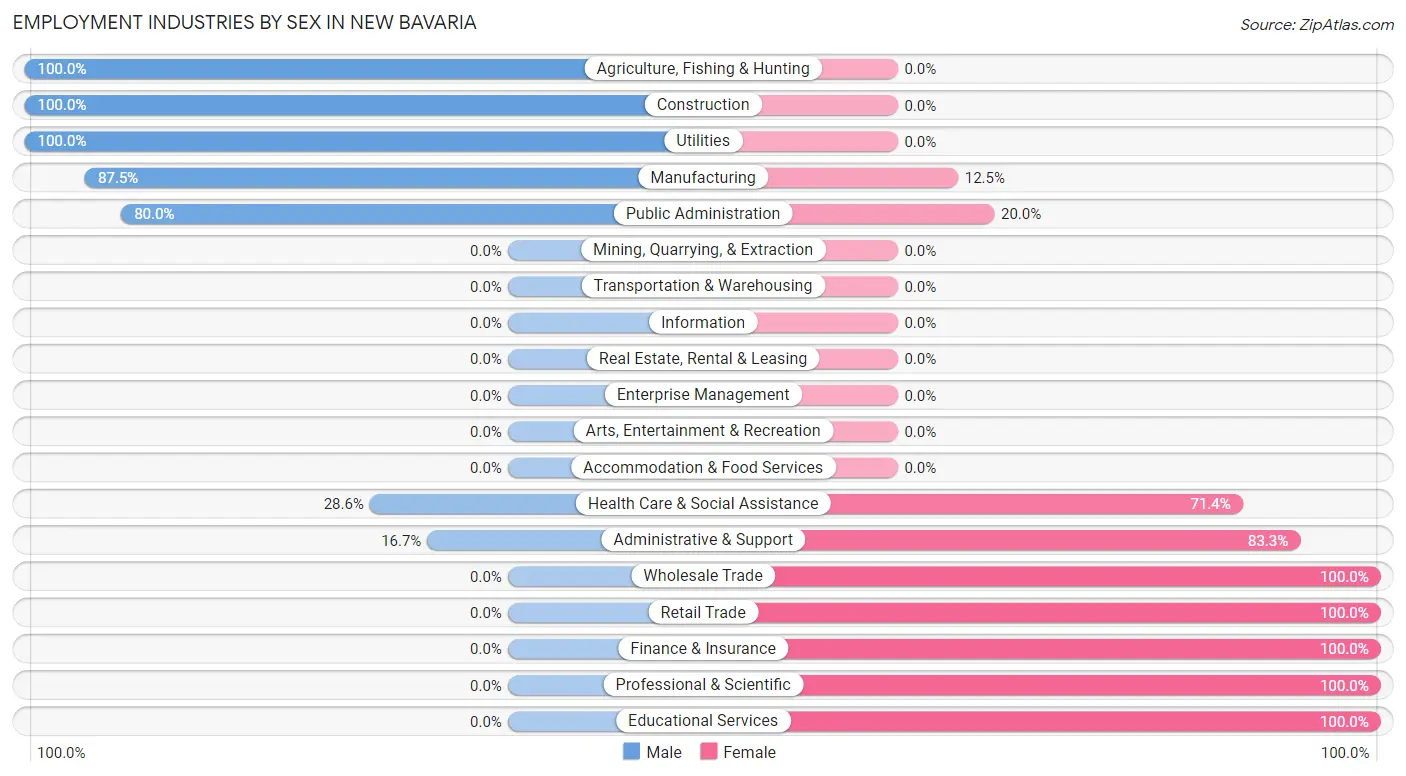
The major employment industries in New Bavaria include Manufacturing (16 | 25.0%), Agriculture, Fishing & Hunting (7 | 10.9%), Health Care & Social Assistance (7 | 10.9%), Administrative & Support (6 | 9.4%), and Public Administration (5 | 7.8%).
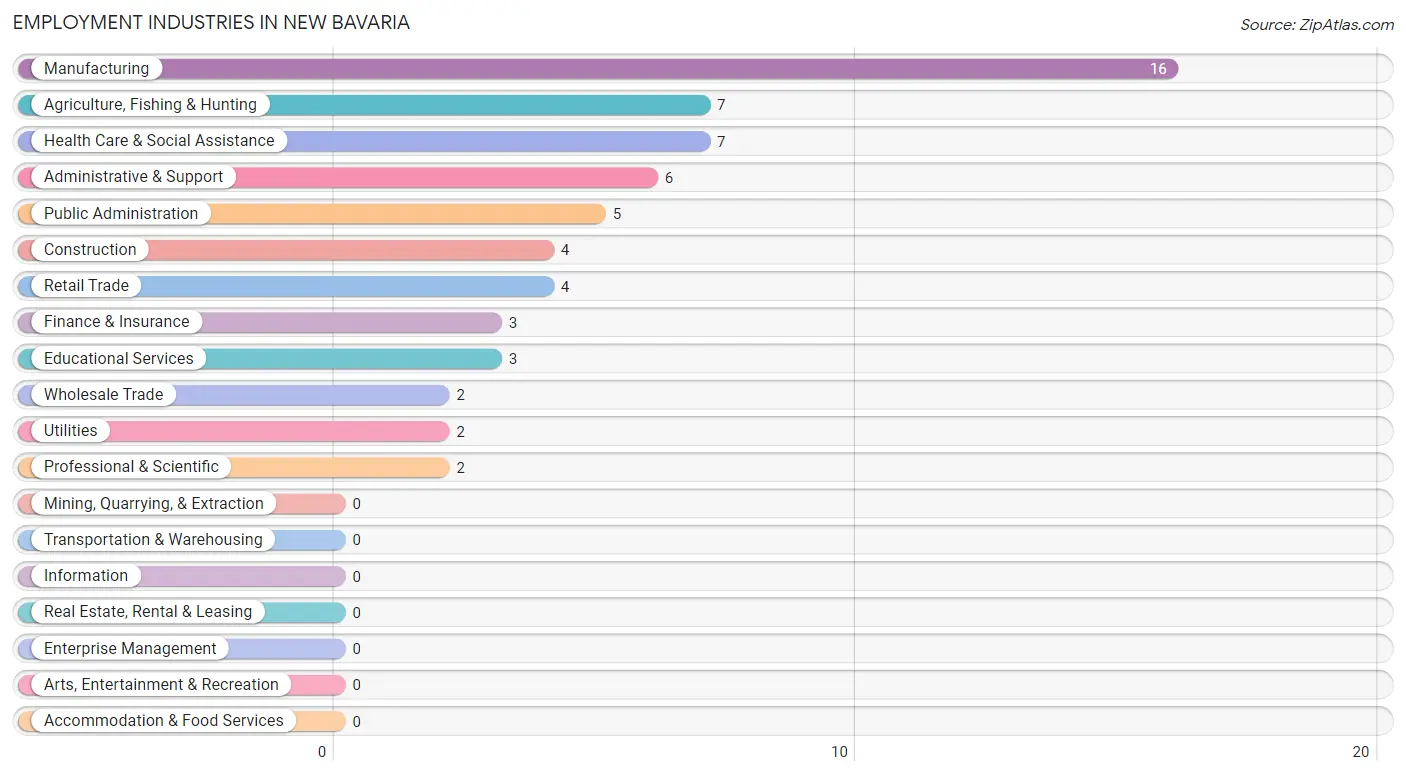
Employment Industries by Sex in New Bavaria
The New Bavaria industries that see more men than women are Agriculture, Fishing & Hunting (100.0%), Construction (100.0%), and Utilities (100.0%), whereas the industries that tend to have a higher number of women are Wholesale Trade (100.0%), Retail Trade (100.0%), and Finance & Insurance (100.0%).
| Industry | Male | Female |
| Agriculture, Fishing & Hunting | 7 (100.0%) | 0 (0.0%) |
| Mining, Quarrying, & Extraction | 0 (0.0%) | 0 (0.0%) |
| Construction | 4 (100.0%) | 0 (0.0%) |
| Manufacturing | 14 (87.5%) | 2 (12.5%) |
| Wholesale Trade | 0 (0.0%) | 2 (100.0%) |
| Retail Trade | 0 (0.0%) | 4 (100.0%) |
| Transportation & Warehousing | 0 (0.0%) | 0 (0.0%) |
| Utilities | 2 (100.0%) | 0 (0.0%) |
| Information | 0 (0.0%) | 0 (0.0%) |
| Finance & Insurance | 0 (0.0%) | 3 (100.0%) |
| Real Estate, Rental & Leasing | 0 (0.0%) | 0 (0.0%) |
| Professional & Scientific | 0 (0.0%) | 2 (100.0%) |
| Enterprise Management | 0 (0.0%) | 0 (0.0%) |
| Administrative & Support | 1 (16.7%) | 5 (83.3%) |
| Educational Services | 0 (0.0%) | 3 (100.0%) |
| Health Care & Social Assistance | 2 (28.6%) | 5 (71.4%) |
| Arts, Entertainment & Recreation | 0 (0.0%) | 0 (0.0%) |
| Accommodation & Food Services | 0 (0.0%) | 0 (0.0%) |
| Public Administration | 4 (80.0%) | 1 (20.0%) |
| Total | 34 (53.1%) | 30 (46.9%) |
Education in New Bavaria
School Enrollment in New Bavaria
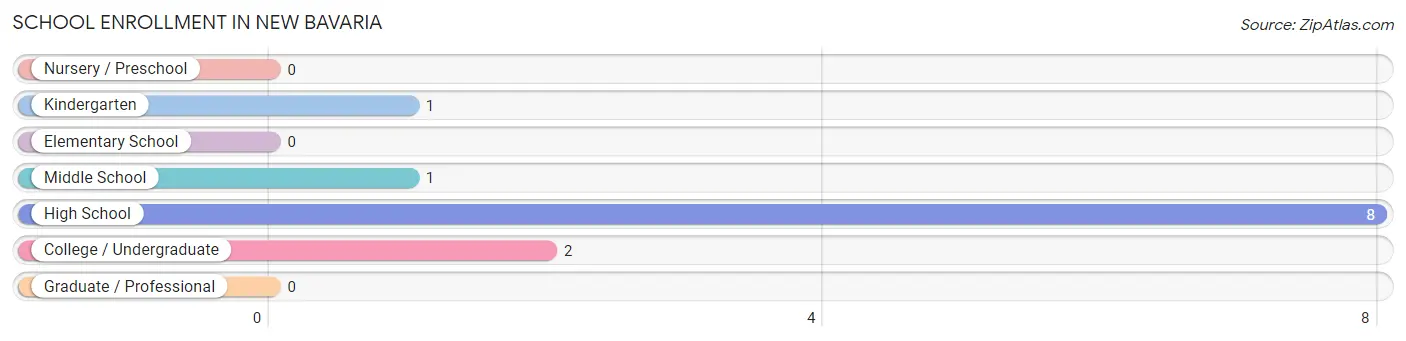
The most common levels of schooling among the 12 students in New Bavaria are high school (8 | 66.7%), college / undergraduate (2 | 16.7%), and kindergarten (1 | 8.3%).
| School Level | # Students | % Students |
| Nursery / Preschool | 0 | 0.0% |
| Kindergarten | 1 | 8.3% |
| Elementary School | 0 | 0.0% |
| Middle School | 1 | 8.3% |
| High School | 8 | 66.7% |
| College / Undergraduate | 2 | 16.7% |
| Graduate / Professional | 0 | 0.0% |
| Total | 12 | 100.0% |
School Enrollment by Age by Funding Source in New Bavaria
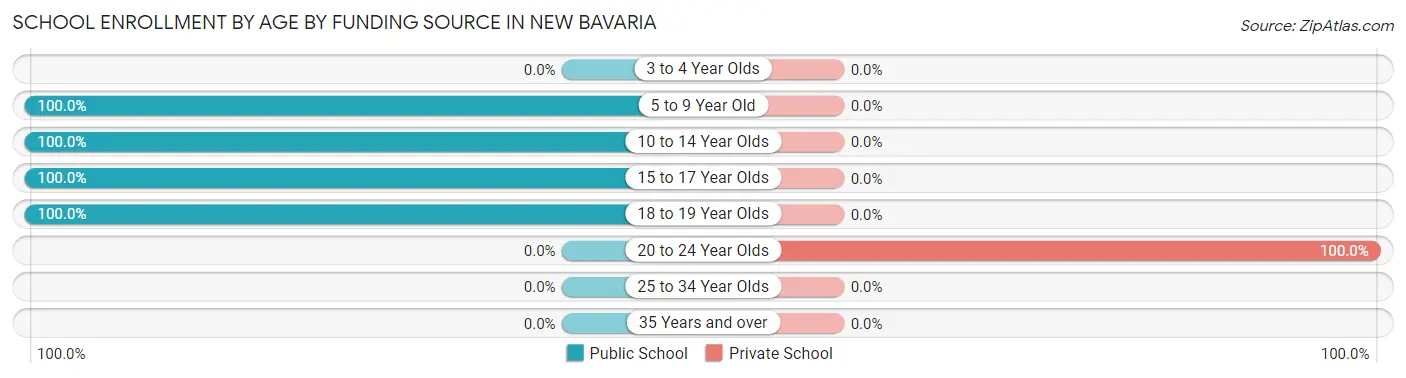
Out of a total of 12 students who are enrolled in schools in New Bavaria, 2 (16.7%) attend a private institution, while the remaining 10 (83.3%) are enrolled in public schools. The age group of 20 to 24 year olds has the highest likelihood of being enrolled in private schools, with 2 (100.0% in the age bracket) enrolled. Conversely, the age group of 5 to 9 year old has the lowest likelihood of being enrolled in a private school, with 1 (100.0% in the age bracket) attending a public institution.
| Age Bracket | Public School | Private School |
| 3 to 4 Year Olds | 0 (0.0%) | 0 (0.0%) |
| 5 to 9 Year Old | 1 (100.0%) | 0 (0.0%) |
| 10 to 14 Year Olds | 1 (100.0%) | 0 (0.0%) |
| 15 to 17 Year Olds | 6 (100.0%) | 0 (0.0%) |
| 18 to 19 Year Olds | 2 (100.0%) | 0 (0.0%) |
| 20 to 24 Year Olds | 0 (0.0%) | 2 (100.0%) |
| 25 to 34 Year Olds | 0 (0.0%) | 0 (0.0%) |
| 35 Years and over | 0 (0.0%) | 0 (0.0%) |
| Total | 10 (83.3%) | 2 (16.7%) |
Educational Attainment by Field of Study in New Bavaria
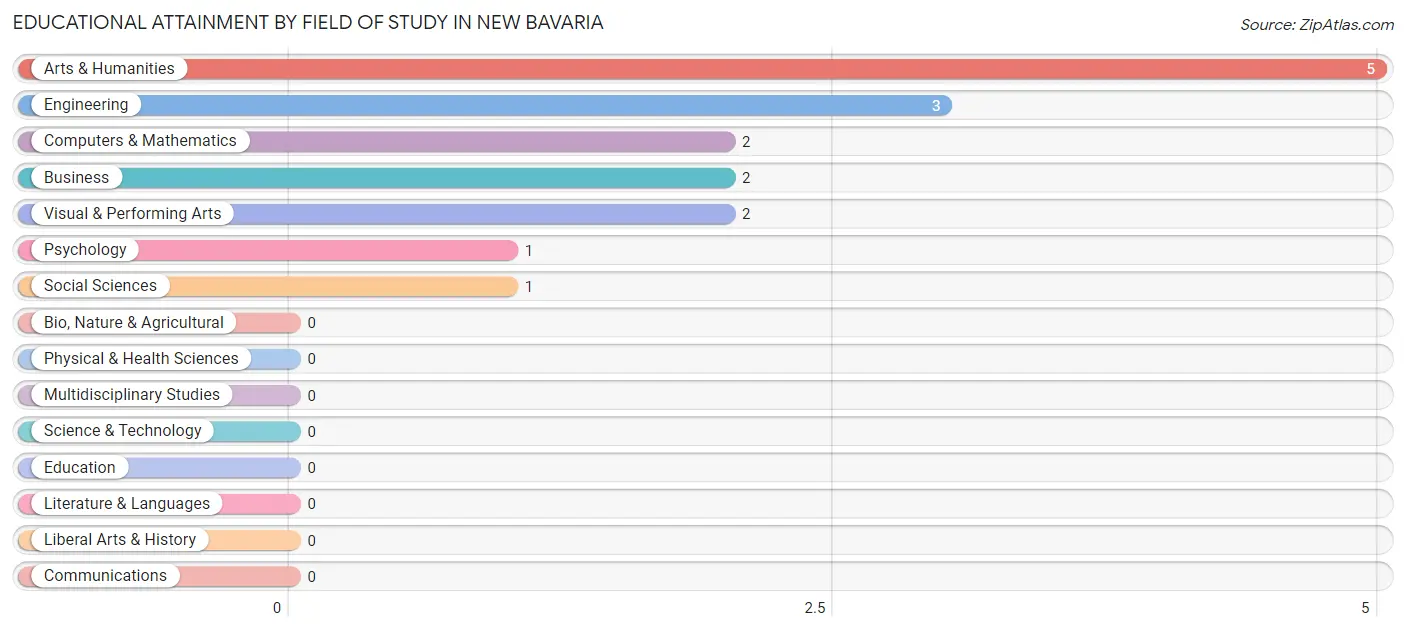
Arts & humanities (5 | 31.2%), engineering (3 | 18.8%), computers & mathematics (2 | 12.5%), business (2 | 12.5%), and visual & performing arts (2 | 12.5%) are the most common fields of study among 16 individuals in New Bavaria who have obtained a bachelor's degree or higher.
| Field of Study | # Graduates | % Graduates |
| Computers & Mathematics | 2 | 12.5% |
| Bio, Nature & Agricultural | 0 | 0.0% |
| Physical & Health Sciences | 0 | 0.0% |
| Psychology | 1 | 6.2% |
| Social Sciences | 1 | 6.2% |
| Engineering | 3 | 18.8% |
| Multidisciplinary Studies | 0 | 0.0% |
| Science & Technology | 0 | 0.0% |
| Business | 2 | 12.5% |
| Education | 0 | 0.0% |
| Literature & Languages | 0 | 0.0% |
| Liberal Arts & History | 0 | 0.0% |
| Visual & Performing Arts | 2 | 12.5% |
| Communications | 0 | 0.0% |
| Arts & Humanities | 5 | 31.2% |
| Total | 16 | 100.0% |
Transportation & Commute in New Bavaria
Vehicle Availability by Sex in New Bavaria
The most prevalent vehicle ownership categories in New Bavaria are males with 2 vehicles (13, accounting for 38.2%) and females with 2 vehicles (6, making up 46.4%).
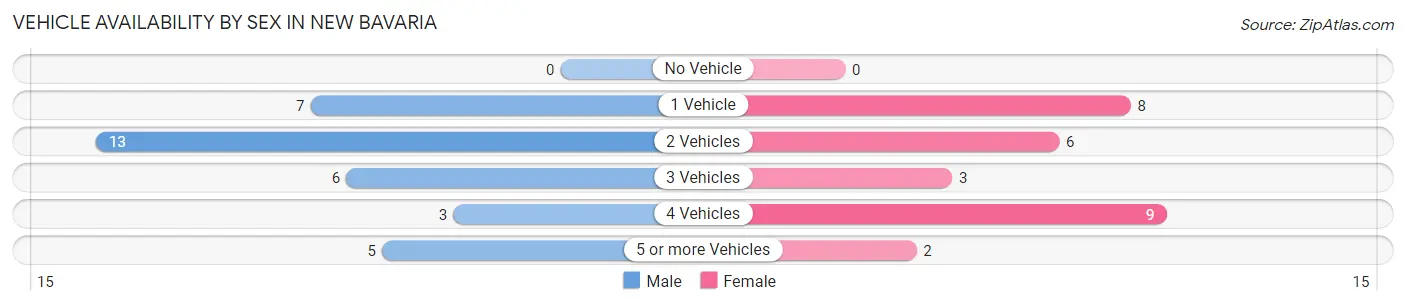
| Vehicles Available | Male | Female |
| No Vehicle | 0 (0.0%) | 0 (0.0%) |
| 1 Vehicle | 7 (20.6%) | 8 (28.6%) |
| 2 Vehicles | 13 (38.2%) | 6 (21.4%) |
| 3 Vehicles | 6 (17.6%) | 3 (10.7%) |
| 4 Vehicles | 3 (8.8%) | 9 (32.1%) |
| 5 or more Vehicles | 5 (14.7%) | 2 (7.1%) |
| Total | 34 (100.0%) | 28 (100.0%) |
Commute Time in New Bavaria
The most frequently occuring commute durations in New Bavaria are 20 to 24 minutes (18 commuters, 34.0%), 5 to 9 minutes (9 commuters, 17.0%), and 25 to 29 minutes (8 commuters, 15.1%).
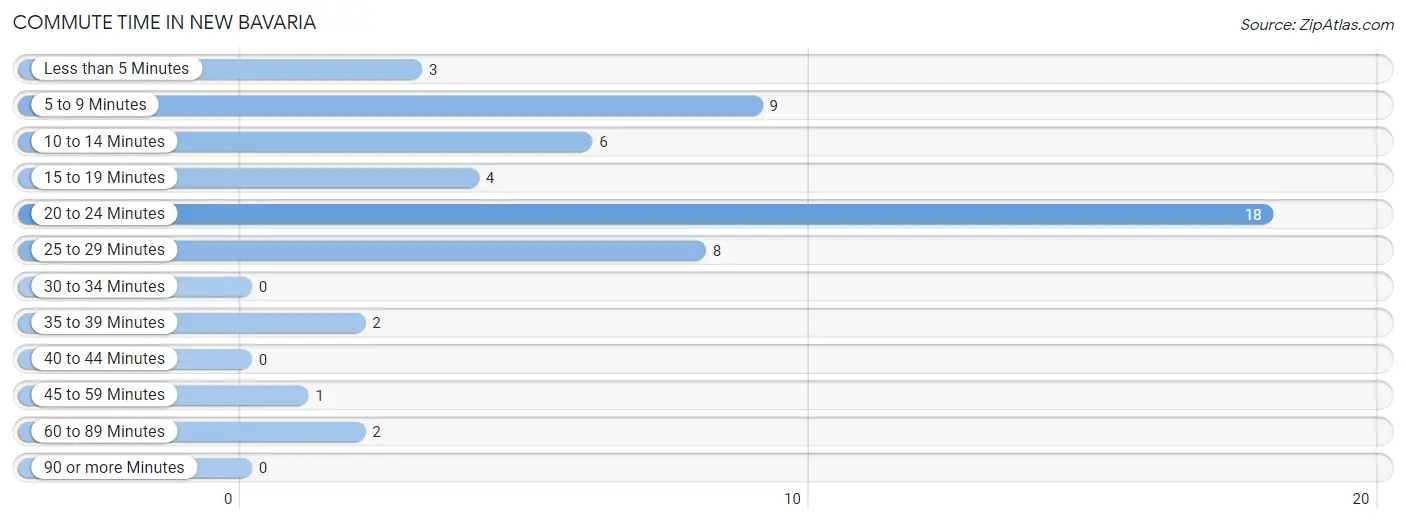
| Commute Time | # Commuters | % Commuters |
| Less than 5 Minutes | 3 | 5.7% |
| 5 to 9 Minutes | 9 | 17.0% |
| 10 to 14 Minutes | 6 | 11.3% |
| 15 to 19 Minutes | 4 | 7.5% |
| 20 to 24 Minutes | 18 | 34.0% |
| 25 to 29 Minutes | 8 | 15.1% |
| 30 to 34 Minutes | 0 | 0.0% |
| 35 to 39 Minutes | 2 | 3.8% |
| 40 to 44 Minutes | 0 | 0.0% |
| 45 to 59 Minutes | 1 | 1.9% |
| 60 to 89 Minutes | 2 | 3.8% |
| 90 or more Minutes | 0 | 0.0% |
Commute Time by Sex in New Bavaria
The most common commute times in New Bavaria are 20 to 24 minutes (12 commuters, 36.4%) for males and 20 to 24 minutes (6 commuters, 30.0%) for females.
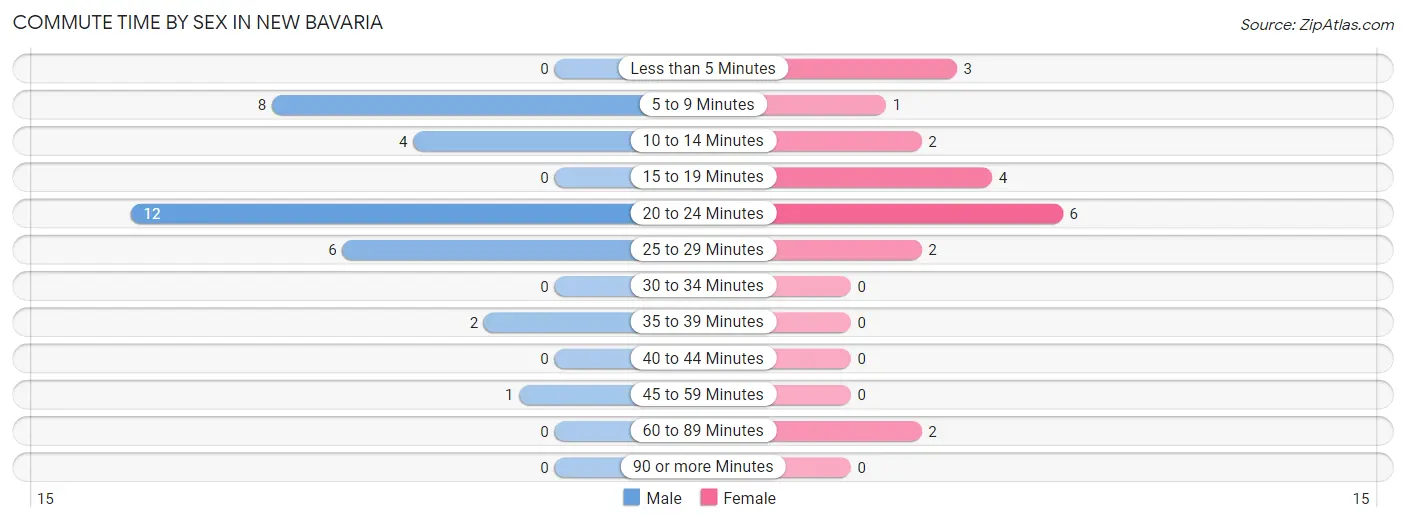
| Commute Time | Male | Female |
| Less than 5 Minutes | 0 (0.0%) | 3 (15.0%) |
| 5 to 9 Minutes | 8 (24.2%) | 1 (5.0%) |
| 10 to 14 Minutes | 4 (12.1%) | 2 (10.0%) |
| 15 to 19 Minutes | 0 (0.0%) | 4 (20.0%) |
| 20 to 24 Minutes | 12 (36.4%) | 6 (30.0%) |
| 25 to 29 Minutes | 6 (18.2%) | 2 (10.0%) |
| 30 to 34 Minutes | 0 (0.0%) | 0 (0.0%) |
| 35 to 39 Minutes | 2 (6.1%) | 0 (0.0%) |
| 40 to 44 Minutes | 0 (0.0%) | 0 (0.0%) |
| 45 to 59 Minutes | 1 (3.0%) | 0 (0.0%) |
| 60 to 89 Minutes | 0 (0.0%) | 2 (10.0%) |
| 90 or more Minutes | 0 (0.0%) | 0 (0.0%) |
Time of Departure to Work by Sex in New Bavaria
The most frequent times of departure to work in New Bavaria are 12:00 AM to 4:59 AM (8, 24.2%) for males and 5:30 AM to 5:59 AM (5, 25.0%) for females.
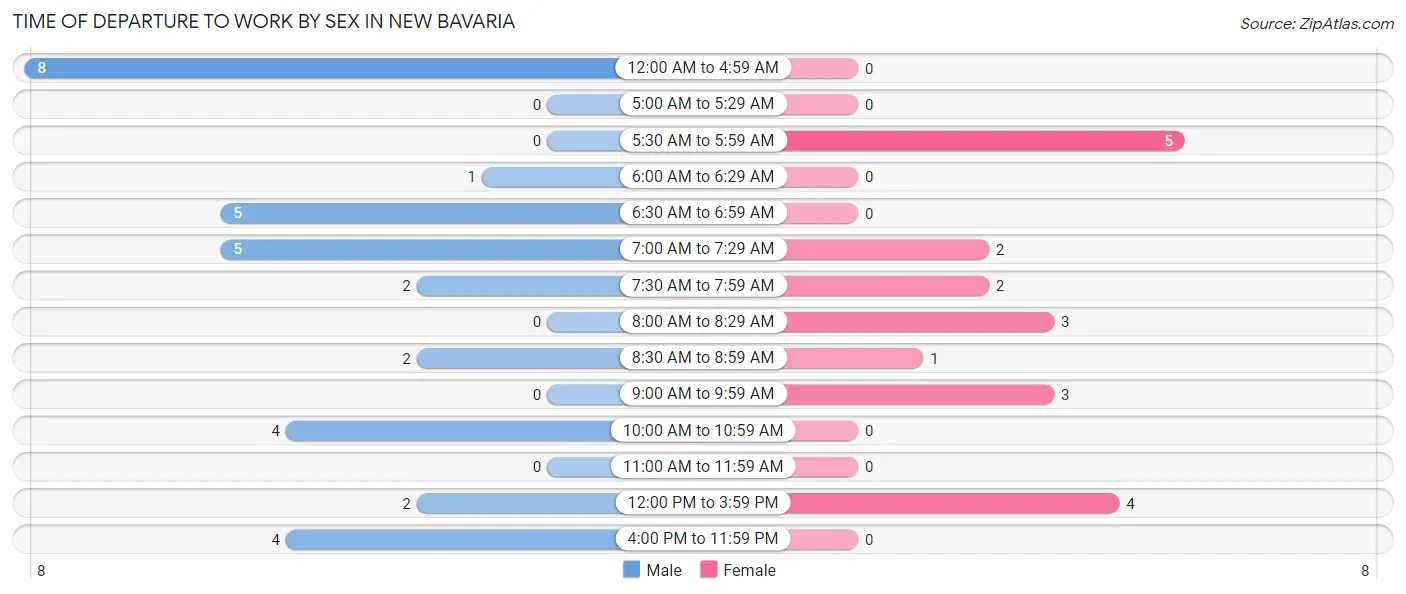
| Time of Departure | Male | Female |
| 12:00 AM to 4:59 AM | 8 (24.2%) | 0 (0.0%) |
| 5:00 AM to 5:29 AM | 0 (0.0%) | 0 (0.0%) |
| 5:30 AM to 5:59 AM | 0 (0.0%) | 5 (25.0%) |
| 6:00 AM to 6:29 AM | 1 (3.0%) | 0 (0.0%) |
| 6:30 AM to 6:59 AM | 5 (15.1%) | 0 (0.0%) |
| 7:00 AM to 7:29 AM | 5 (15.1%) | 2 (10.0%) |
| 7:30 AM to 7:59 AM | 2 (6.1%) | 2 (10.0%) |
| 8:00 AM to 8:29 AM | 0 (0.0%) | 3 (15.0%) |
| 8:30 AM to 8:59 AM | 2 (6.1%) | 1 (5.0%) |
| 9:00 AM to 9:59 AM | 0 (0.0%) | 3 (15.0%) |
| 10:00 AM to 10:59 AM | 4 (12.1%) | 0 (0.0%) |
| 11:00 AM to 11:59 AM | 0 (0.0%) | 0 (0.0%) |
| 12:00 PM to 3:59 PM | 2 (6.1%) | 4 (20.0%) |
| 4:00 PM to 11:59 PM | 4 (12.1%) | 0 (0.0%) |
| Total | 33 (100.0%) | 20 (100.0%) |
Housing Occupancy in New Bavaria
Occupancy by Ownership in New Bavaria
Of the total 47 dwellings in New Bavaria, owner-occupied units account for 41 (87.2%), while renter-occupied units make up 6 (12.8%).
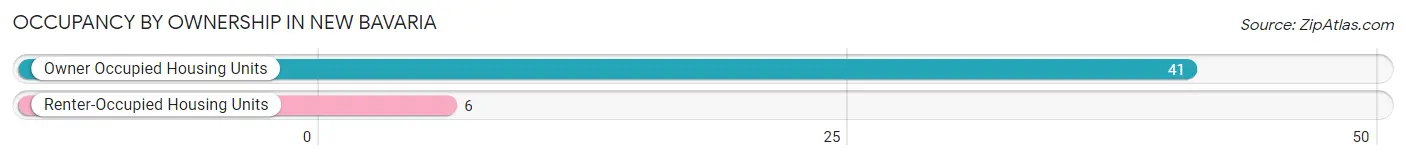
| Occupancy | # Housing Units | % Housing Units |
| Owner Occupied Housing Units | 41 | 87.2% |
| Renter-Occupied Housing Units | 6 | 12.8% |
| Total Occupied Housing Units | 47 | 100.0% |
Occupancy by Household Size in New Bavaria
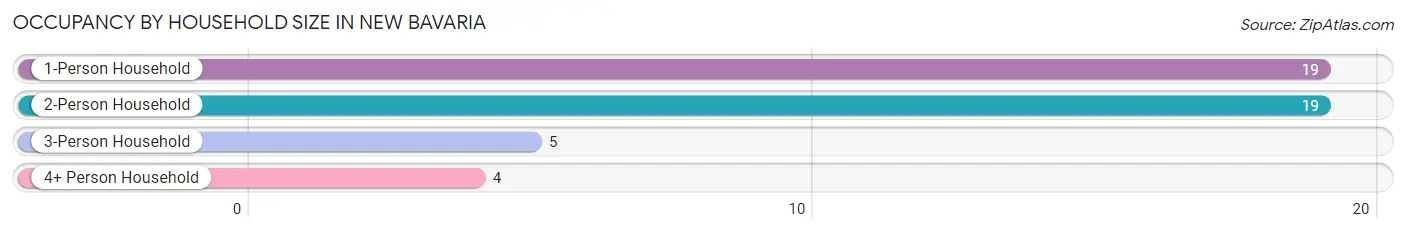
| Household Size | # Housing Units | % Housing Units |
| 1-Person Household | 19 | 40.4% |
| 2-Person Household | 19 | 40.4% |
| 3-Person Household | 5 | 10.6% |
| 4+ Person Household | 4 | 8.5% |
| Total Housing Units | 47 | 100.0% |
Occupancy by Ownership by Household Size in New Bavaria
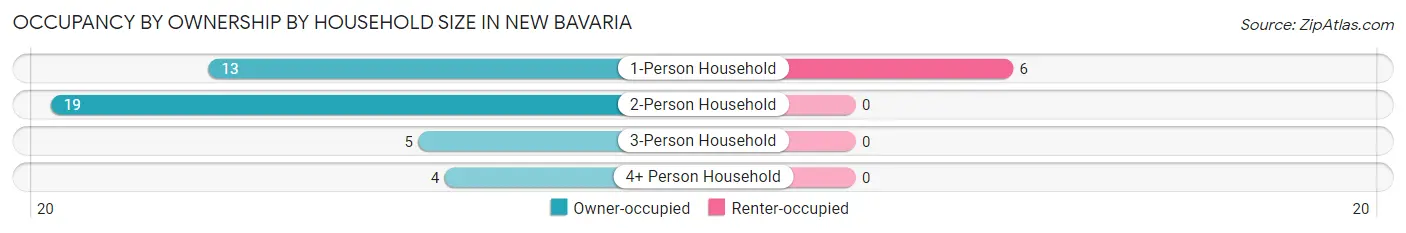
| Household Size | Owner-occupied | Renter-occupied |
| 1-Person Household | 13 (68.4%) | 6 (31.6%) |
| 2-Person Household | 19 (100.0%) | 0 (0.0%) |
| 3-Person Household | 5 (100.0%) | 0 (0.0%) |
| 4+ Person Household | 4 (100.0%) | 0 (0.0%) |
| Total Housing Units | 41 (87.2%) | 6 (12.8%) |
Occupancy by Educational Attainment in New Bavaria
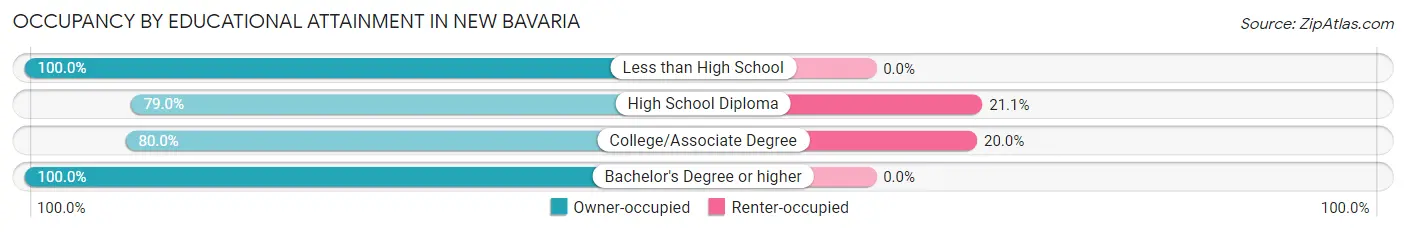
| Household Size | Owner-occupied | Renter-occupied |
| Less than High School | 6 (100.0%) | 0 (0.0%) |
| High School Diploma | 15 (78.9%) | 4 (21.0%) |
| College/Associate Degree | 8 (80.0%) | 2 (20.0%) |
| Bachelor's Degree or higher | 12 (100.0%) | 0 (0.0%) |
Occupancy by Age of Householder in New Bavaria
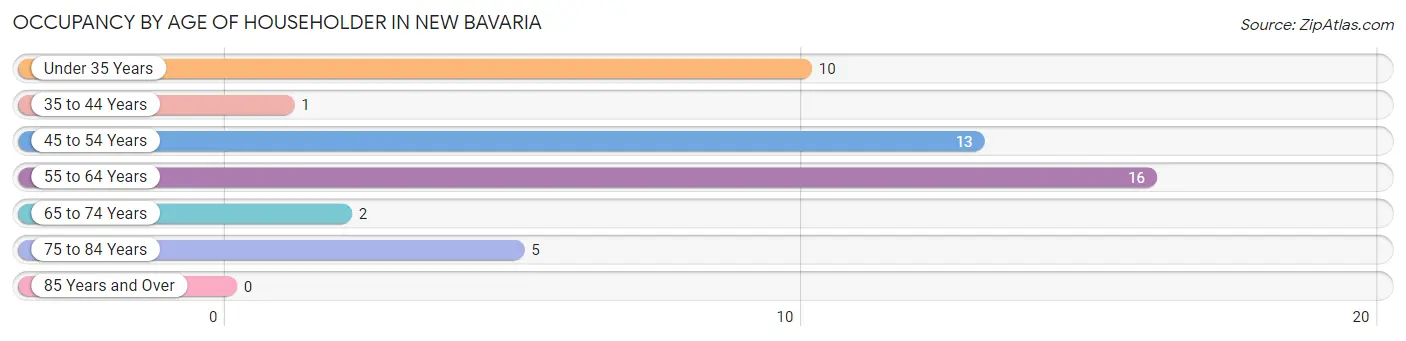
| Age Bracket | # Households | % Households |
| Under 35 Years | 10 | 21.3% |
| 35 to 44 Years | 1 | 2.1% |
| 45 to 54 Years | 13 | 27.7% |
| 55 to 64 Years | 16 | 34.0% |
| 65 to 74 Years | 2 | 4.3% |
| 75 to 84 Years | 5 | 10.6% |
| 85 Years and Over | 0 | 0.0% |
| Total | 47 | 100.0% |
Housing Finances in New Bavaria
Median Income by Occupancy in New Bavaria
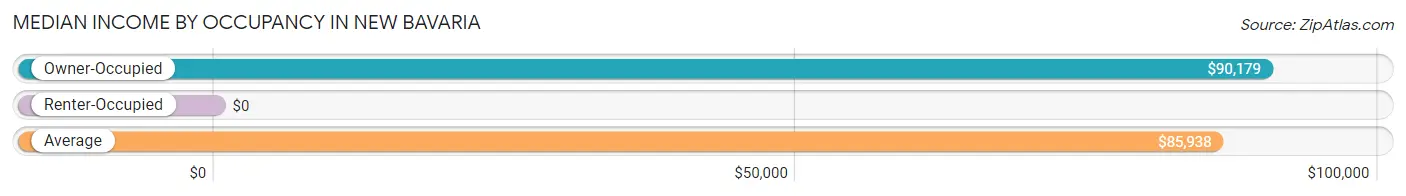
| Occupancy Type | # Households | Median Income |
| Owner-Occupied | 41 (87.2%) | $90,179 |
| Renter-Occupied | 6 (12.8%) | $0 |
| Average | 47 (100.0%) | $85,938 |
Occupancy by Householder Income Bracket in New Bavaria
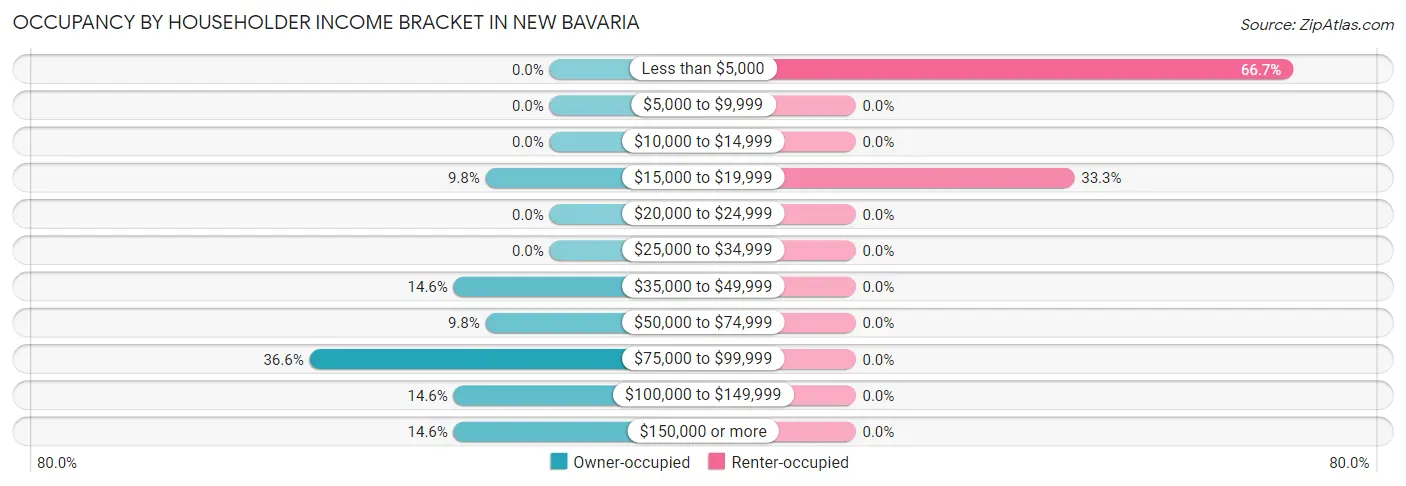
| Income Bracket | Owner-occupied | Renter-occupied |
| Less than $5,000 | 0 (0.0%) | 4 (66.7%) |
| $5,000 to $9,999 | 0 (0.0%) | 0 (0.0%) |
| $10,000 to $14,999 | 0 (0.0%) | 0 (0.0%) |
| $15,000 to $19,999 | 4 (9.8%) | 2 (33.3%) |
| $20,000 to $24,999 | 0 (0.0%) | 0 (0.0%) |
| $25,000 to $34,999 | 0 (0.0%) | 0 (0.0%) |
| $35,000 to $49,999 | 6 (14.6%) | 0 (0.0%) |
| $50,000 to $74,999 | 4 (9.8%) | 0 (0.0%) |
| $75,000 to $99,999 | 15 (36.6%) | 0 (0.0%) |
| $100,000 to $149,999 | 6 (14.6%) | 0 (0.0%) |
| $150,000 or more | 6 (14.6%) | 0 (0.0%) |
| Total | 41 (100.0%) | 6 (100.0%) |
Monthly Housing Cost Tiers in New Bavaria
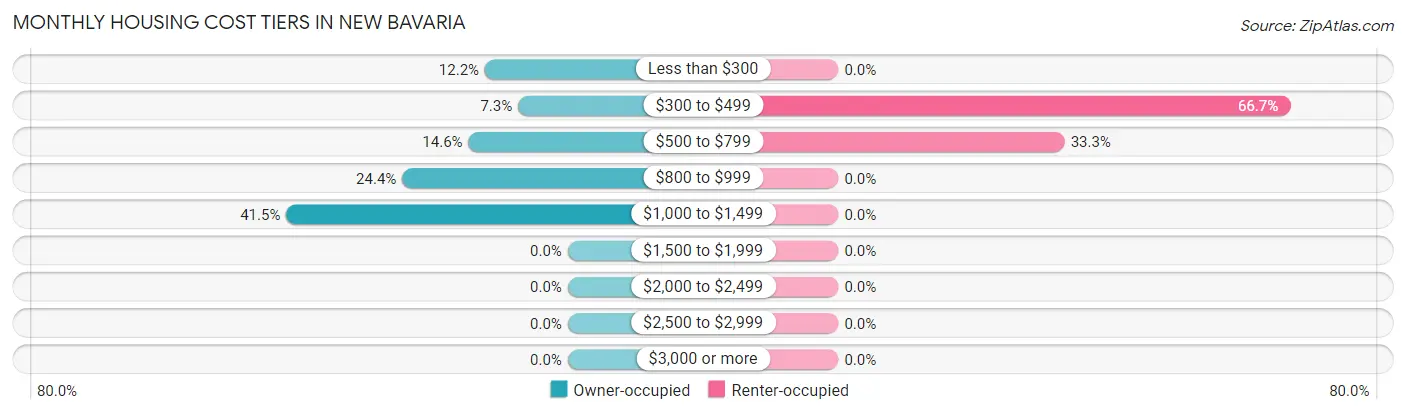
| Monthly Cost | Owner-occupied | Renter-occupied |
| Less than $300 | 5 (12.2%) | 0 (0.0%) |
| $300 to $499 | 3 (7.3%) | 4 (66.7%) |
| $500 to $799 | 6 (14.6%) | 2 (33.3%) |
| $800 to $999 | 10 (24.4%) | 0 (0.0%) |
| $1,000 to $1,499 | 17 (41.5%) | 0 (0.0%) |
| $1,500 to $1,999 | 0 (0.0%) | 0 (0.0%) |
| $2,000 to $2,499 | 0 (0.0%) | 0 (0.0%) |
| $2,500 to $2,999 | 0 (0.0%) | 0 (0.0%) |
| $3,000 or more | 0 (0.0%) | 0 (0.0%) |
| Total | 41 (100.0%) | 6 (100.0%) |
Physical Housing Characteristics in New Bavaria
Housing Structures in New Bavaria
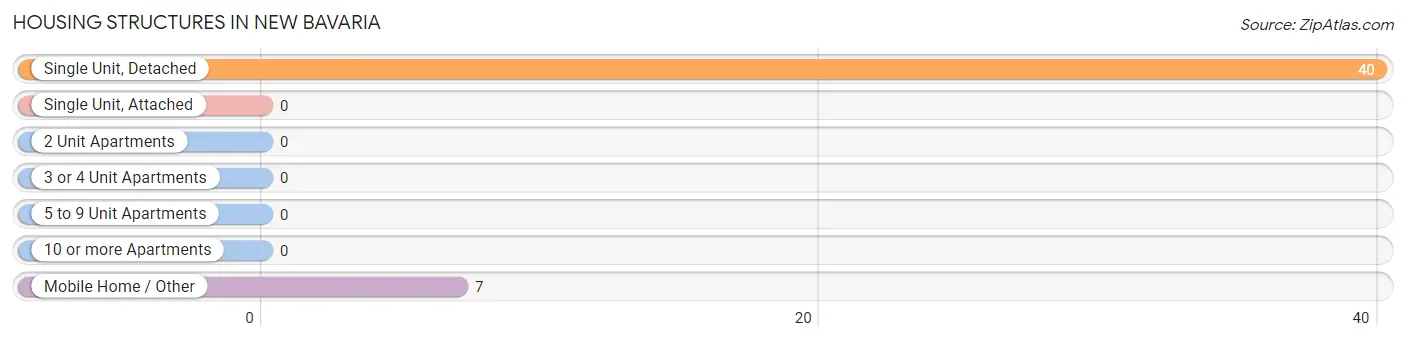
| Structure Type | # Housing Units | % Housing Units |
| Single Unit, Detached | 40 | 85.1% |
| Single Unit, Attached | 0 | 0.0% |
| 2 Unit Apartments | 0 | 0.0% |
| 3 or 4 Unit Apartments | 0 | 0.0% |
| 5 to 9 Unit Apartments | 0 | 0.0% |
| 10 or more Apartments | 0 | 0.0% |
| Mobile Home / Other | 7 | 14.9% |
| Total | 47 | 100.0% |
Housing Structures by Occupancy in New Bavaria
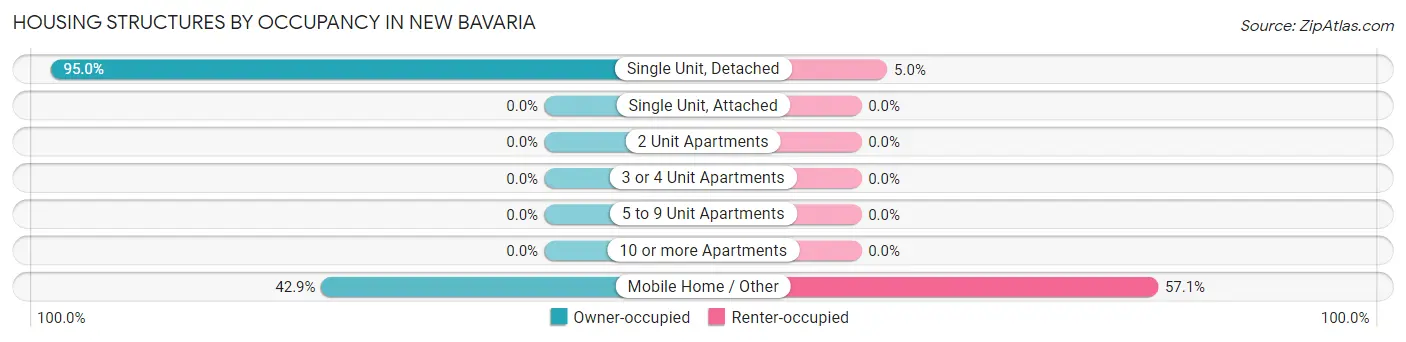
| Structure Type | Owner-occupied | Renter-occupied |
| Single Unit, Detached | 38 (95.0%) | 2 (5.0%) |
| Single Unit, Attached | 0 (0.0%) | 0 (0.0%) |
| 2 Unit Apartments | 0 (0.0%) | 0 (0.0%) |
| 3 or 4 Unit Apartments | 0 (0.0%) | 0 (0.0%) |
| 5 to 9 Unit Apartments | 0 (0.0%) | 0 (0.0%) |
| 10 or more Apartments | 0 (0.0%) | 0 (0.0%) |
| Mobile Home / Other | 3 (42.9%) | 4 (57.1%) |
| Total | 41 (87.2%) | 6 (12.8%) |
Housing Structures by Number of Rooms in New Bavaria
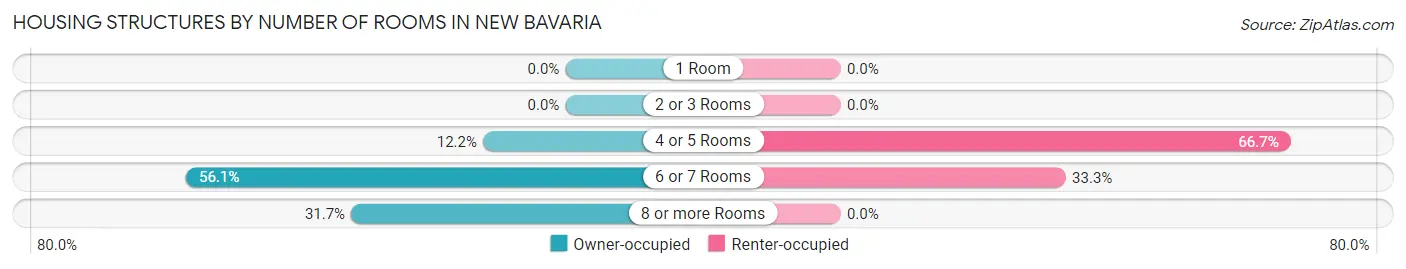
| Number of Rooms | Owner-occupied | Renter-occupied |
| 1 Room | 0 (0.0%) | 0 (0.0%) |
| 2 or 3 Rooms | 0 (0.0%) | 0 (0.0%) |
| 4 or 5 Rooms | 5 (12.2%) | 4 (66.7%) |
| 6 or 7 Rooms | 23 (56.1%) | 2 (33.3%) |
| 8 or more Rooms | 13 (31.7%) | 0 (0.0%) |
| Total | 41 (100.0%) | 6 (100.0%) |
Housing Structure by Heating Type in New Bavaria
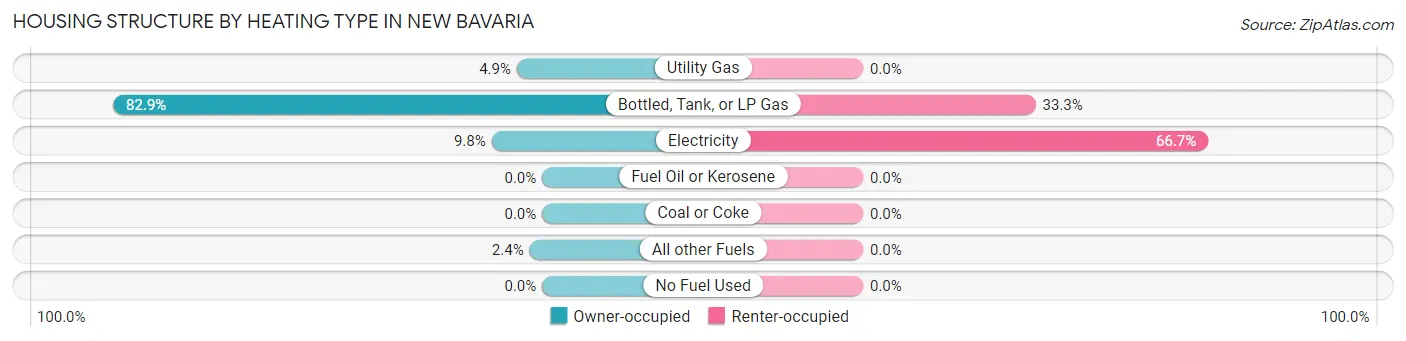
| Heating Type | Owner-occupied | Renter-occupied |
| Utility Gas | 2 (4.9%) | 0 (0.0%) |
| Bottled, Tank, or LP Gas | 34 (82.9%) | 2 (33.3%) |
| Electricity | 4 (9.8%) | 4 (66.7%) |
| Fuel Oil or Kerosene | 0 (0.0%) | 0 (0.0%) |
| Coal or Coke | 0 (0.0%) | 0 (0.0%) |
| All other Fuels | 1 (2.4%) | 0 (0.0%) |
| No Fuel Used | 0 (0.0%) | 0 (0.0%) |
| Total | 41 (100.0%) | 6 (100.0%) |
Household Vehicle Usage in New Bavaria
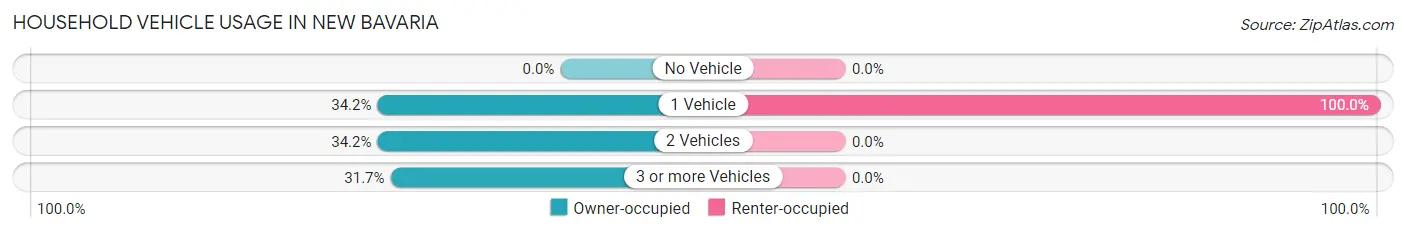
| Vehicles per Household | Owner-occupied | Renter-occupied |
| No Vehicle | 0 (0.0%) | 0 (0.0%) |
| 1 Vehicle | 14 (34.2%) | 6 (100.0%) |
| 2 Vehicles | 14 (34.2%) | 0 (0.0%) |
| 3 or more Vehicles | 13 (31.7%) | 0 (0.0%) |
| Total | 41 (100.0%) | 6 (100.0%) |
Real Estate & Mortgages in New Bavaria
Real Estate and Mortgage Overview in New Bavaria
| Characteristic | Without Mortgage | With Mortgage |
| Housing Units | 19 | 22 |
| Median Property Value | $109,400 | $96,700 |
| Median Household Income | $49,688 | $6 |
| Monthly Housing Costs | $638 | $0 |
| Real Estate Taxes | - | - |
Property Value by Mortgage Status in New Bavaria
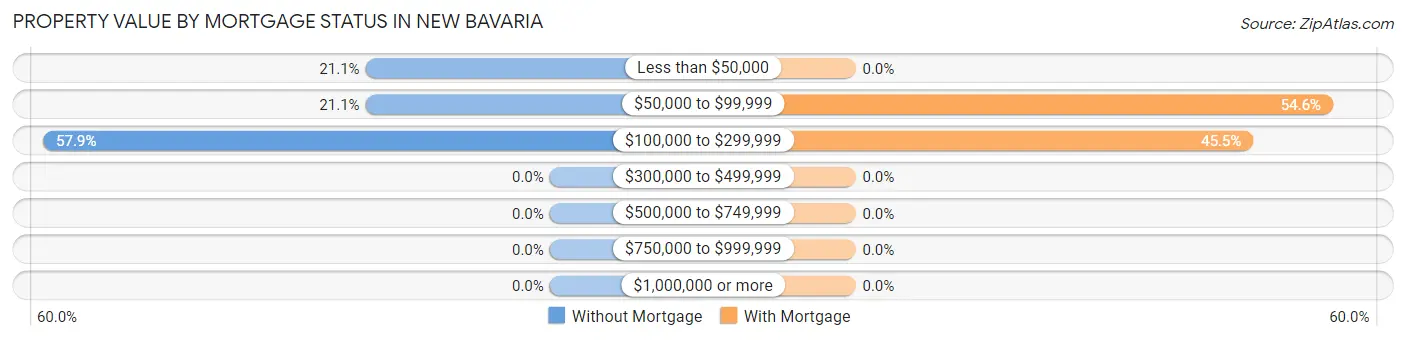
| Property Value | Without Mortgage | With Mortgage |
| Less than $50,000 | 4 (21.0%) | 0 (0.0%) |
| $50,000 to $99,999 | 4 (21.0%) | 12 (54.5%) |
| $100,000 to $299,999 | 11 (57.9%) | 10 (45.5%) |
| $300,000 to $499,999 | 0 (0.0%) | 0 (0.0%) |
| $500,000 to $749,999 | 0 (0.0%) | 0 (0.0%) |
| $750,000 to $999,999 | 0 (0.0%) | 0 (0.0%) |
| $1,000,000 or more | 0 (0.0%) | 0 (0.0%) |
| Total | 19 (100.0%) | 22 (100.0%) |
Household Income by Mortgage Status in New Bavaria
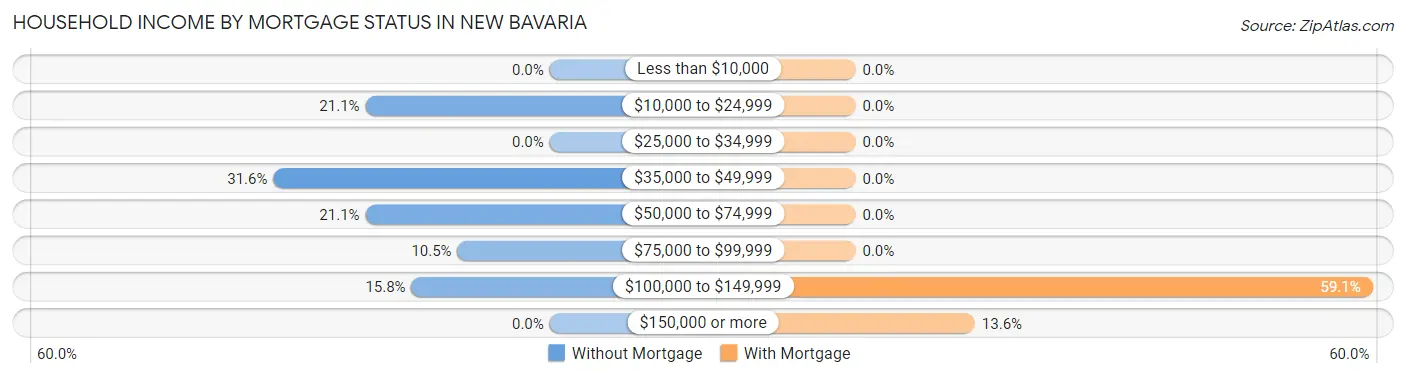
| Household Income | Without Mortgage | With Mortgage |
| Less than $10,000 | 0 (0.0%) | 0 (0.0%) |
| $10,000 to $24,999 | 4 (21.0%) | 0 (0.0%) |
| $25,000 to $34,999 | 0 (0.0%) | 0 (0.0%) |
| $35,000 to $49,999 | 6 (31.6%) | 0 (0.0%) |
| $50,000 to $74,999 | 4 (21.0%) | 0 (0.0%) |
| $75,000 to $99,999 | 2 (10.5%) | 0 (0.0%) |
| $100,000 to $149,999 | 3 (15.8%) | 13 (59.1%) |
| $150,000 or more | 0 (0.0%) | 3 (13.6%) |
| Total | 19 (100.0%) | 22 (100.0%) |
Property Value to Household Income Ratio in New Bavaria
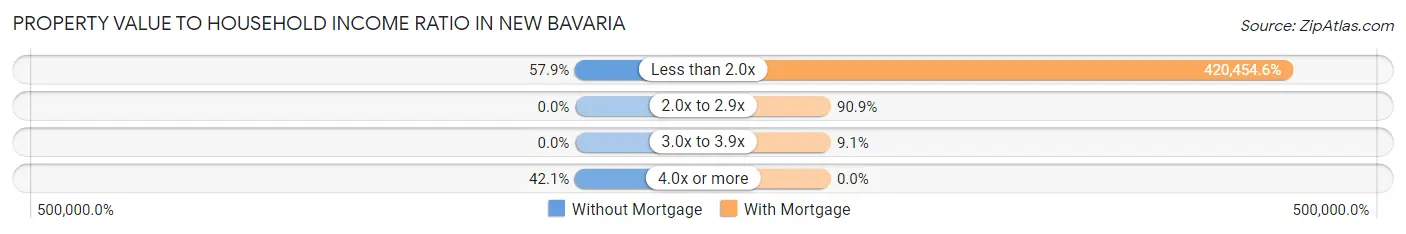
| Value-to-Income Ratio | Without Mortgage | With Mortgage |
| Less than 2.0x | 11 (57.9%) | 92,500 (420,454.6%) |
| 2.0x to 2.9x | 0 (0.0%) | 20 (90.9%) |
| 3.0x to 3.9x | 0 (0.0%) | 2 (9.1%) |
| 4.0x or more | 8 (42.1%) | 0 (0.0%) |
| Total | 19 (100.0%) | 22 (100.0%) |
Real Estate Taxes by Mortgage Status in New Bavaria
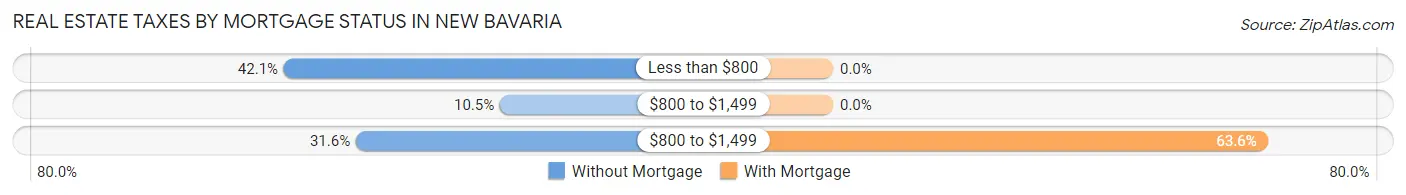
| Property Taxes | Without Mortgage | With Mortgage |
| Less than $800 | 8 (42.1%) | 0 (0.0%) |
| $800 to $1,499 | 2 (10.5%) | 0 (0.0%) |
| $800 to $1,499 | 6 (31.6%) | 14 (63.6%) |
| Total | 19 (100.0%) | 22 (100.0%) |
Health & Disability in New Bavaria
Health Insurance Coverage by Age in New Bavaria
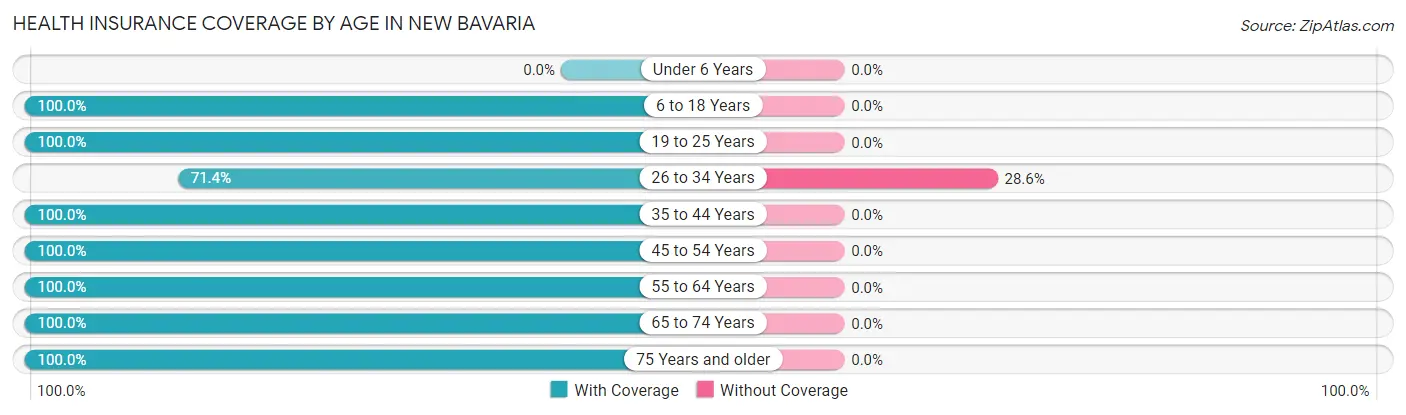
| Age Bracket | With Coverage | Without Coverage |
| Under 6 Years | 0 (0.0%) | 0 (0.0%) |
| 6 to 18 Years | 10 (100.0%) | 0 (0.0%) |
| 19 to 25 Years | 8 (100.0%) | 0 (0.0%) |
| 26 to 34 Years | 10 (71.4%) | 4 (28.6%) |
| 35 to 44 Years | 8 (100.0%) | 0 (0.0%) |
| 45 to 54 Years | 19 (100.0%) | 0 (0.0%) |
| 55 to 64 Years | 22 (100.0%) | 0 (0.0%) |
| 65 to 74 Years | 7 (100.0%) | 0 (0.0%) |
| 75 Years and older | 6 (100.0%) | 0 (0.0%) |
| Total | 90 (95.7%) | 4 (4.3%) |
Health Insurance Coverage by Citizenship Status in New Bavaria
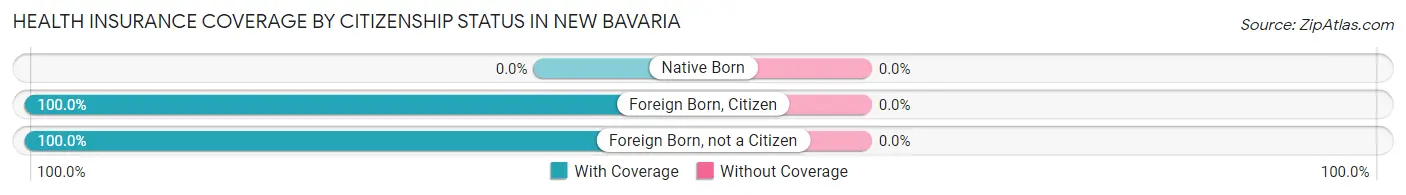
| Citizenship Status | With Coverage | Without Coverage |
| Native Born | 0 (0.0%) | 0 (0.0%) |
| Foreign Born, Citizen | 10 (100.0%) | 0 (0.0%) |
| Foreign Born, not a Citizen | 8 (100.0%) | 0 (0.0%) |
Health Insurance Coverage by Household Income in New Bavaria
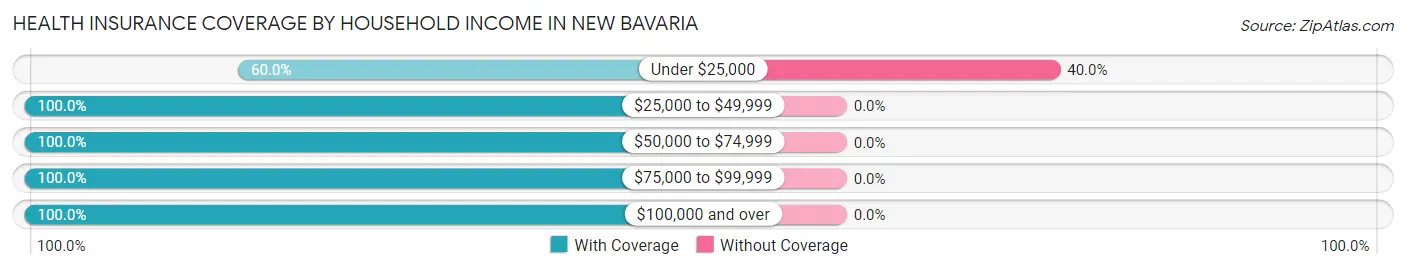
| Household Income | With Coverage | Without Coverage |
| Under $25,000 | 6 (60.0%) | 4 (40.0%) |
| $25,000 to $49,999 | 7 (100.0%) | 0 (0.0%) |
| $50,000 to $74,999 | 9 (100.0%) | 0 (0.0%) |
| $75,000 to $99,999 | 30 (100.0%) | 0 (0.0%) |
| $100,000 and over | 38 (100.0%) | 0 (0.0%) |
Public vs Private Health Insurance Coverage by Age in New Bavaria
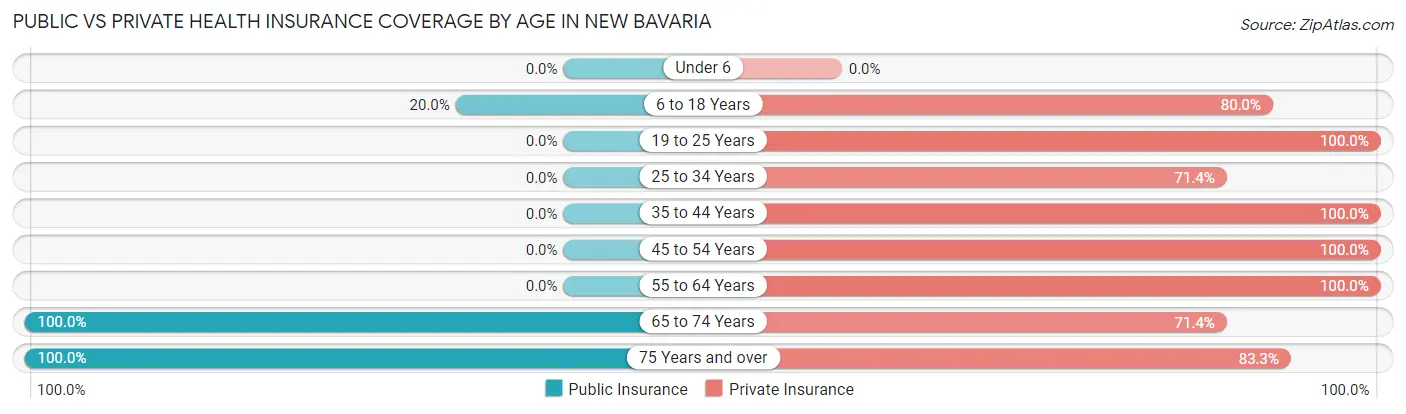
| Age Bracket | Public Insurance | Private Insurance |
| Under 6 | 0 (0.0%) | 0 (0.0%) |
| 6 to 18 Years | 2 (20.0%) | 8 (80.0%) |
| 19 to 25 Years | 0 (0.0%) | 8 (100.0%) |
| 25 to 34 Years | 0 (0.0%) | 10 (71.4%) |
| 35 to 44 Years | 0 (0.0%) | 8 (100.0%) |
| 45 to 54 Years | 0 (0.0%) | 19 (100.0%) |
| 55 to 64 Years | 0 (0.0%) | 22 (100.0%) |
| 65 to 74 Years | 7 (100.0%) | 5 (71.4%) |
| 75 Years and over | 6 (100.0%) | 5 (83.3%) |
| Total | 15 (16.0%) | 85 (90.4%) |
Disability Status by Sex by Age in New Bavaria
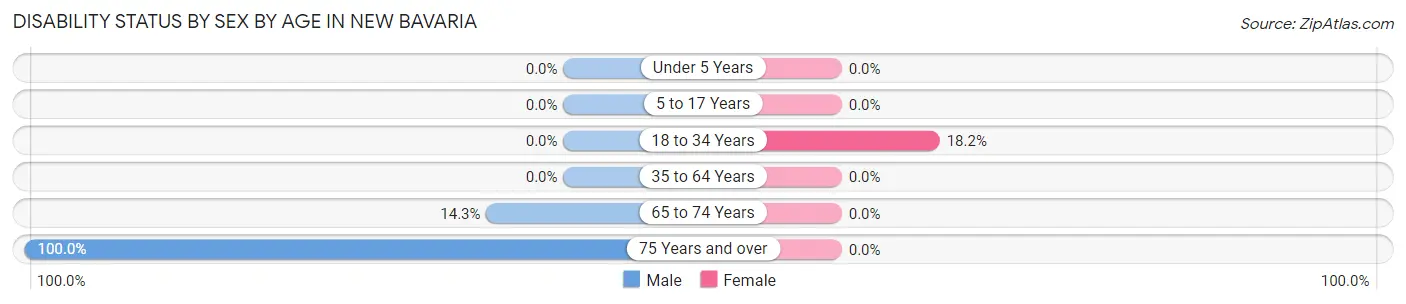
| Age Bracket | Male | Female |
| Under 5 Years | 0 (0.0%) | 0 (0.0%) |
| 5 to 17 Years | 0 (0.0%) | 0 (0.0%) |
| 18 to 34 Years | 0 (0.0%) | 2 (18.2%) |
| 35 to 64 Years | 0 (0.0%) | 0 (0.0%) |
| 65 to 74 Years | 1 (14.3%) | 0 (0.0%) |
| 75 Years and over | 5 (100.0%) | 0 (0.0%) |
Disability Class by Sex by Age in New Bavaria
Disability Class: Hearing Difficulty
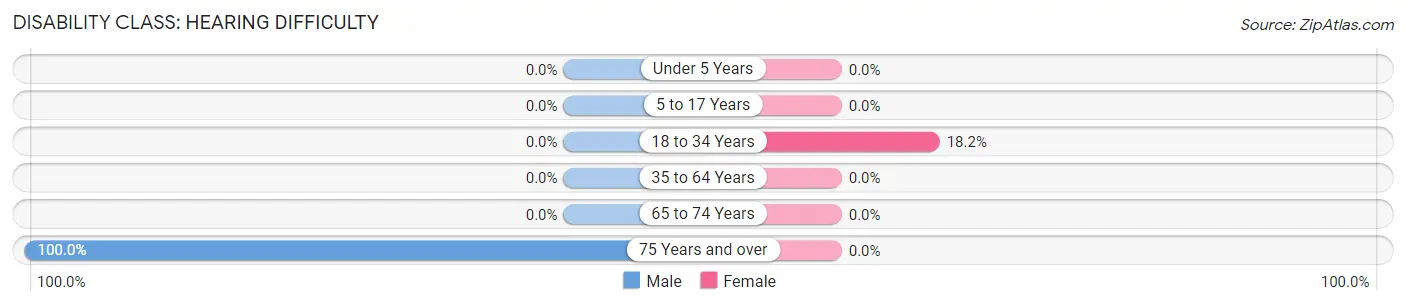
| Age Bracket | Male | Female |
| Under 5 Years | 0 (0.0%) | 0 (0.0%) |
| 5 to 17 Years | 0 (0.0%) | 0 (0.0%) |
| 18 to 34 Years | 0 (0.0%) | 2 (18.2%) |
| 35 to 64 Years | 0 (0.0%) | 0 (0.0%) |
| 65 to 74 Years | 0 (0.0%) | 0 (0.0%) |
| 75 Years and over | 5 (100.0%) | 0 (0.0%) |
Disability Class: Vision Difficulty
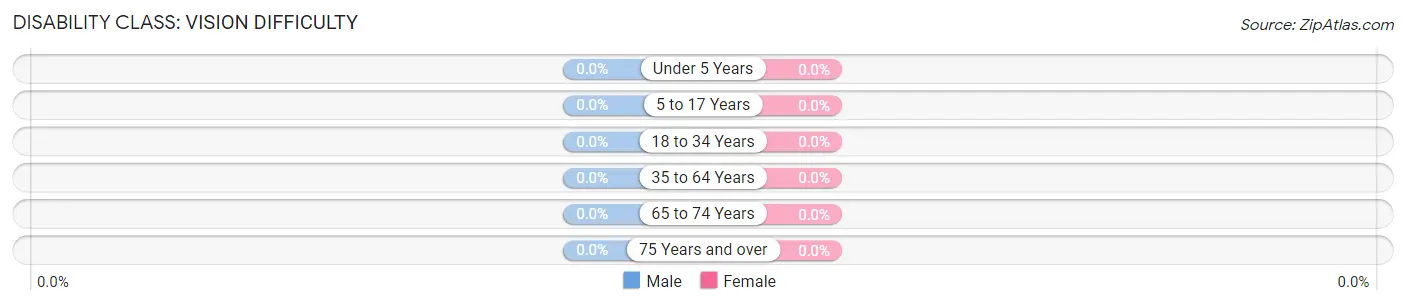
| Age Bracket | Male | Female |
| Under 5 Years | 0 (0.0%) | 0 (0.0%) |
| 5 to 17 Years | 0 (0.0%) | 0 (0.0%) |
| 18 to 34 Years | 0 (0.0%) | 0 (0.0%) |
| 35 to 64 Years | 0 (0.0%) | 0 (0.0%) |
| 65 to 74 Years | 0 (0.0%) | 0 (0.0%) |
| 75 Years and over | 0 (0.0%) | 0 (0.0%) |
Disability Class: Cognitive Difficulty
| Age Bracket | Male | Female |
| 5 to 17 Years | 0 (0.0%) | 0 (0.0%) |
| 18 to 34 Years | 0 (0.0%) | 0 (0.0%) |
| 35 to 64 Years | 0 (0.0%) | 0 (0.0%) |
| 65 to 74 Years | 0 (0.0%) | 0 (0.0%) |
| 75 Years and over | 0 (0.0%) | 0 (0.0%) |
Disability Class: Ambulatory Difficulty
| Age Bracket | Male | Female |
| 5 to 17 Years | 0 (0.0%) | 0 (0.0%) |
| 18 to 34 Years | 0 (0.0%) | 0 (0.0%) |
| 35 to 64 Years | 0 (0.0%) | 0 (0.0%) |
| 65 to 74 Years | 0 (0.0%) | 0 (0.0%) |
| 75 Years and over | 1 (20.0%) | 0 (0.0%) |
Disability Class: Self-Care Difficulty
| Age Bracket | Male | Female |
| 5 to 17 Years | 0 (0.0%) | 0 (0.0%) |
| 18 to 34 Years | 0 (0.0%) | 0 (0.0%) |
| 35 to 64 Years | 0 (0.0%) | 0 (0.0%) |
| 65 to 74 Years | 0 (0.0%) | 0 (0.0%) |
| 75 Years and over | 1 (20.0%) | 0 (0.0%) |
Technology Access in New Bavaria
Computing Device Access in New Bavaria
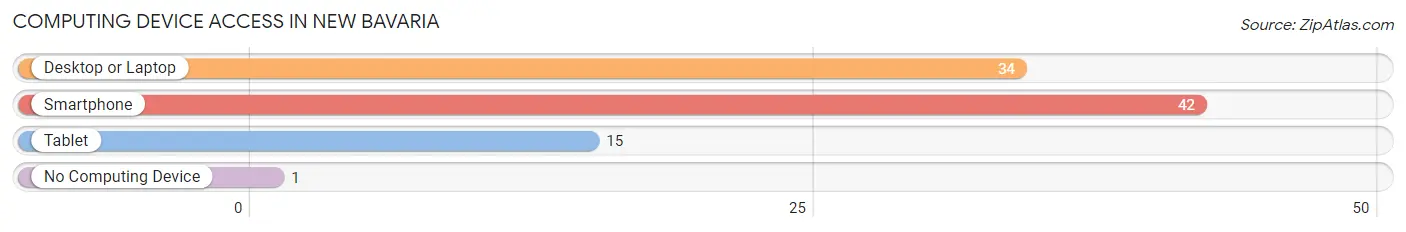
| Device Type | # Households | % Households |
| Desktop or Laptop | 34 | 72.3% |
| Smartphone | 42 | 89.4% |
| Tablet | 15 | 31.9% |
| No Computing Device | 1 | 2.1% |
| Total | 47 | 100.0% |
Internet Access in New Bavaria
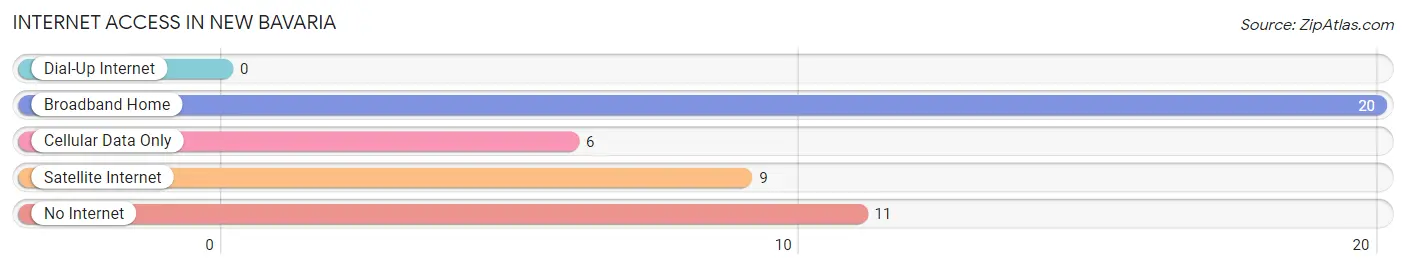
| Internet Type | # Households | % Households |
| Dial-Up Internet | 0 | 0.0% |
| Broadband Home | 20 | 42.5% |
| Cellular Data Only | 6 | 12.8% |
| Satellite Internet | 9 | 19.2% |
| No Internet | 11 | 23.4% |
| Total | 47 | 100.0% |
New Bavaria Summary
Bavaria, Ohio is a small village located in the southeastern corner of Preble County, Ohio. The village is situated on the banks of the Twin Creek, a tributary of the Great Miami River. The village was founded in 1837 by German immigrants who named it after their homeland of Bavaria. The village has a population of approximately 500 people and is located about 25 miles east of Dayton, Ohio.
History
The first settlers of Bavaria, Ohio were German immigrants who arrived in the area in 1837. The village was founded by a group of German immigrants who had come to the United States in search of a better life. The village was named after their homeland of Bavaria, Germany. The village was originally known as New Bavaria, but the name was later shortened to just Bavaria.
The village was incorporated in 1845 and the first mayor was John B. Schaeffer. The village was a small farming community and the main crops grown were wheat, corn, and oats. The village also had a few small businesses, including a blacksmith shop, a general store, and a sawmill.
In the late 1800s, the village began to grow and the population increased to over 500 people. The village was home to several churches, a school, and a post office. The village also had a railroad station, which allowed for easy transportation of goods and people.
Geography
Bavaria, Ohio is located in the southeastern corner of Preble County, Ohio. The village is situated on the banks of the Twin Creek, a tributary of the Great Miami River. The village is located about 25 miles east of Dayton, Ohio. The village is surrounded by farmland and is located in a rural area.
The village has a total area of 0.3 square miles, all of which is land. The village is located at an elevation of 890 feet above sea level. The climate in Bavaria is classified as humid continental, with hot summers and cold winters.
Economy
The economy of Bavaria, Ohio is largely based on agriculture. The village is surrounded by farmland and the main crops grown are wheat, corn, and oats. The village also has a few small businesses, including a general store, a blacksmith shop, and a sawmill.
The village is also home to a few manufacturing companies, including a plastics factory and a metal fabrication plant. The village also has a few restaurants and bars.
Demographics
As of the 2010 census, the population of Bavaria, Ohio was 498 people. The racial makeup of the village was 97.2% White, 0.2% African American, 0.2% Native American, 0.4% Asian, 0.2% from other races, and 1.8% from two or more races. Hispanic or Latino of any race were 0.8% of the population.
The median household income in Bavaria was $41,250 and the median family income was $45,000. The per capita income for the village was $17,845. About 11.2% of families and 13.2% of the population were below the poverty line, including 16.7% of those under age 18 and 8.3% of those age 65 or over.
Common Questions
What is Per Capita Income in New Bavaria?
Per Capita income in New Bavaria is $39,616.
What is the Median Family Income in New Bavaria?
Median Family Income in New Bavaria is $91,429.
What is the Median Household income in New Bavaria?
Median Household Income in New Bavaria is $85,938.
What is Income or Wage Gap in New Bavaria?
Income or Wage Gap in New Bavaria is 39.5%.
Women in New Bavaria earn 60.5 cents for every dollar earned by a man.
What is Inequality or Gini Index in New Bavaria?
Inequality or Gini Index in New Bavaria is 0.36.
What is the Total Population of New Bavaria?
Total Population of New Bavaria is 94.
What is the Total Male Population of New Bavaria?
Total Male Population of New Bavaria is 48.
What is the Total Female Population of New Bavaria?
Total Female Population of New Bavaria is 46.
What is the Ratio of Males per 100 Females in New Bavaria?
There are 104.35 Males per 100 Females in New Bavaria.
What is the Ratio of Females per 100 Males in New Bavaria?
There are 95.83 Females per 100 Males in New Bavaria.
What is the Median Population Age in New Bavaria?
Median Population Age in New Bavaria is 46.8 Years.
What is the Average Family Size in New Bavaria
Average Family Size in New Bavaria is 2.6 People.
What is the Average Household Size in New Bavaria
Average Household Size in New Bavaria is 2.0 People.
How Large is the Labor Force in New Bavaria?
There are 64 People in the Labor Forcein in New Bavaria.
What is the Percentage of People in the Labor Force in New Bavaria?
72.7% of People are in the Labor Force in New Bavaria.