Zip Codes with the Highest Percentage of Population with a Degree in Visual and Performing Arts in Youngstown, OH
RELATED REPORTS & OPTIONS
Visual and Performing Arts
Youngstown
Compare Zip Codes
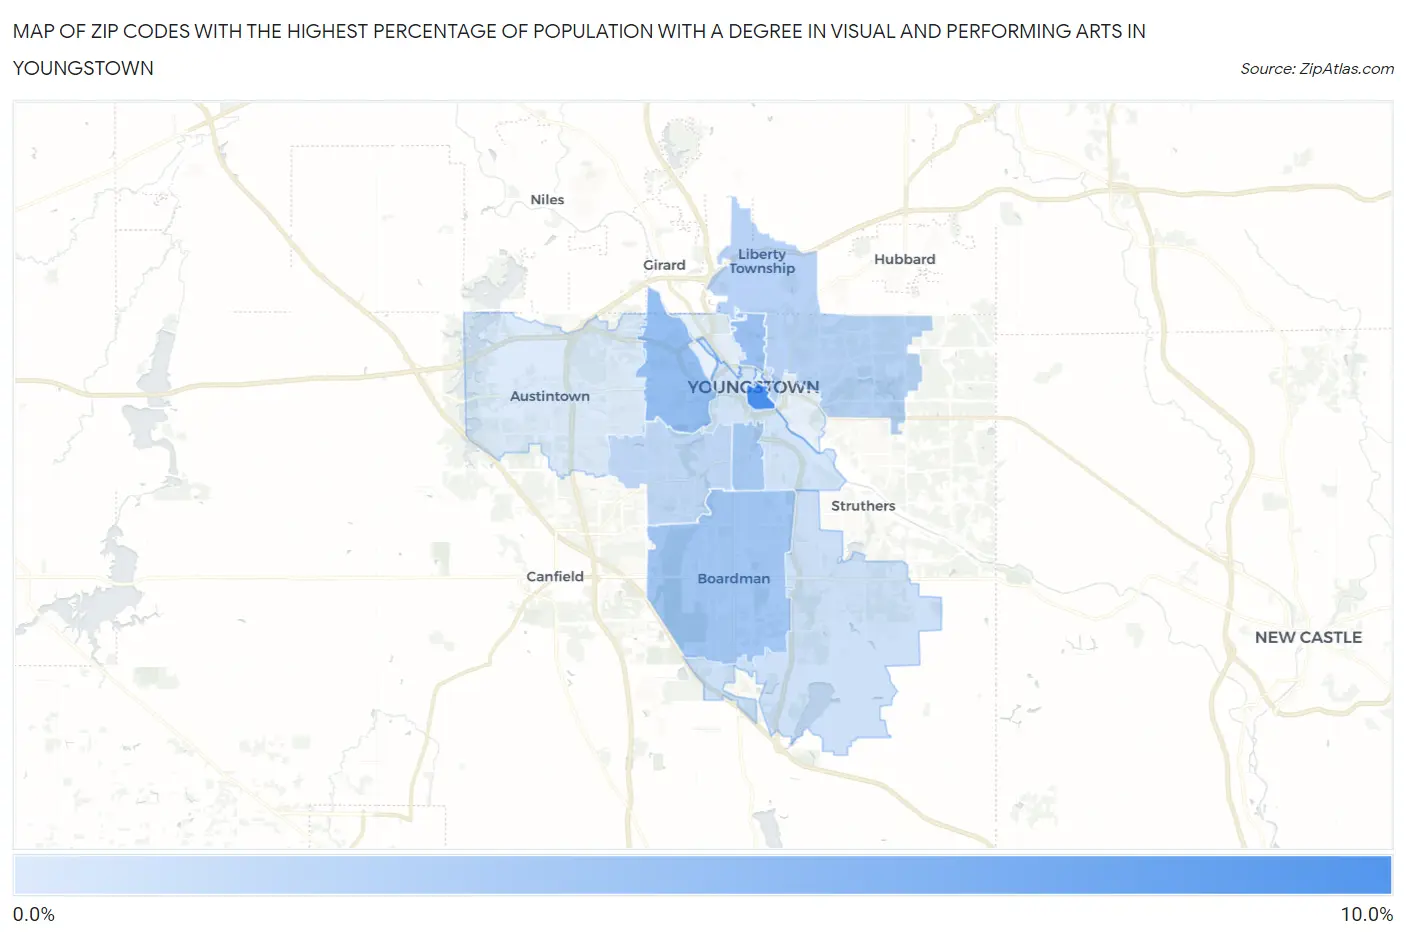
Map of Zip Codes with the Highest Percentage of Population with a Degree in Visual and Performing Arts in Youngstown
2.0%
9.0%
Zip Codes with the Highest Percentage of Population with a Degree in Visual and Performing Arts in Youngstown, OH
| Zip Code | % Graduates | vs State | vs National | |
| 1. | 44503 | 9.0% | 3.7%(+5.26)#90 | 4.3%(+4.72)#2,271 |
| 2. | 44509 | 5.2% | 3.7%(+1.54)#215 | 4.3%(+0.995)#6,154 |
| 3. | 44504 | 4.9% | 3.7%(+1.20)#242 | 4.3%(+0.658)#6,843 |
| 4. | 44512 | 4.6% | 3.7%(+0.861)#271 | 4.3%(+0.320)#7,618 |
| 5. | 44507 | 4.5% | 3.7%(+0.745)#285 | 4.3%(+0.203)#7,924 |
| 6. | 44505 | 3.7% | 3.7%(-0.010)#366 | 4.3%(-0.552)#10,174 |
| 7. | 44511 | 3.2% | 3.7%(-0.500)#428 | 4.3%(-1.04)#11,945 |
| 8. | 44514 | 2.6% | 3.7%(-1.07)#508 | 4.3%(-1.61)#14,110 |
| 9. | 44502 | 2.4% | 3.7%(-1.33)#539 | 4.3%(-1.88)#15,083 |
| 10. | 44515 | 2.0% | 3.7%(-1.72)#597 | 4.3%(-2.26)#16,495 |
1
Common Questions
What are the Top 10 Zip Codes with the Highest Percentage of Population with a Degree in Visual and Performing Arts in Youngstown, OH?
Top 10 Zip Codes with the Highest Percentage of Population with a Degree in Visual and Performing Arts in Youngstown, OH are:
What zip code has the Highest Percentage of Population with a Degree in Visual and Performing Arts in Youngstown, OH?
44503 has the Highest Percentage of Population with a Degree in Visual and Performing Arts in Youngstown, OH with 9.0%.
What is the Percentage of Population with a Degree in Visual and Performing Arts in Youngstown, OH?
Percentage of Population with a Degree in Visual and Performing Arts in Youngstown is 4.0%.
What is the Percentage of Population with a Degree in Visual and Performing Arts in Ohio?
Percentage of Population with a Degree in Visual and Performing Arts in Ohio is 3.7%.
What is the Percentage of Population with a Degree in Visual and Performing Arts in the United States?
Percentage of Population with a Degree in Visual and Performing Arts in the United States is 4.3%.