Union City, OH Map & Demographics
Union City Map
Union City Overview
$20,125
PER CAPITA INCOME
$40,278
AVG FAMILY INCOME
$36,776
AVG HOUSEHOLD INCOME
21.0%
WAGE / INCOME GAP [ % ]
79.0¢/ $1
WAGE / INCOME GAP [ $ ]
$10,737
FAMILY INCOME DEFICIT
0.43
INEQUALITY / GINI INDEX
1,528
TOTAL POPULATION
772
MALE POPULATION
756
FEMALE POPULATION
102.12
MALES / 100 FEMALES
97.93
FEMALES / 100 MALES
40.0
MEDIAN AGE
3.1
AVG FAMILY SIZE
2.4
AVG HOUSEHOLD SIZE
664
LABOR FORCE [ PEOPLE ]
56.6%
PERCENT IN LABOR FORCE
7.7%
UNEMPLOYMENT RATE
Union City Zip Codes
Union City Area Codes
Income in Union City
Income Overview in Union City
Per Capita Income in Union City is $20,125, while median incomes of families and households are $40,278 and $36,776 respectively.
| Characteristic | Number | Measure |
| Per Capita Income | 1,528 | $20,125 |
| Median Family Income | 344 | $40,278 |
| Mean Family Income | 344 | $53,436 |
| Median Household Income | 615 | $36,776 |
| Mean Household Income | 615 | $48,741 |
| Income Deficit | 344 | $10,737 |
| Wage / Income Gap (%) | 1,528 | 21.02% |
| Wage / Income Gap ($) | 1,528 | 78.98¢ per $1 |
| Gini / Inequality Index | 1,528 | 0.43 |
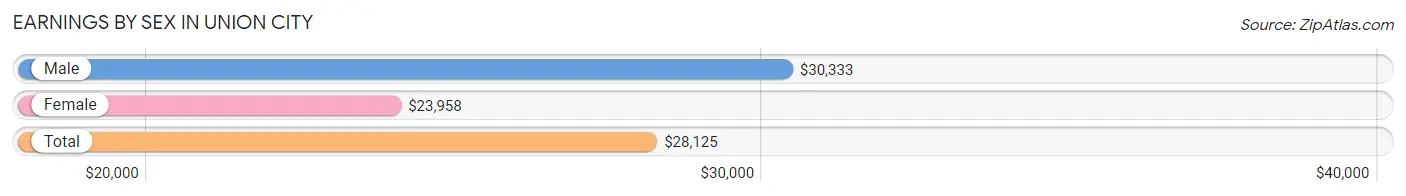
Earnings by Sex in Union City
Average Earnings in Union City are $28,125, $30,333 for men and $23,958 for women, a difference of 21.0%.
| Sex | Number | Average Earnings |
| Male | 366 (55.3%) | $30,333 |
| Female | 296 (44.7%) | $23,958 |
| Total | 662 (100.0%) | $28,125 |
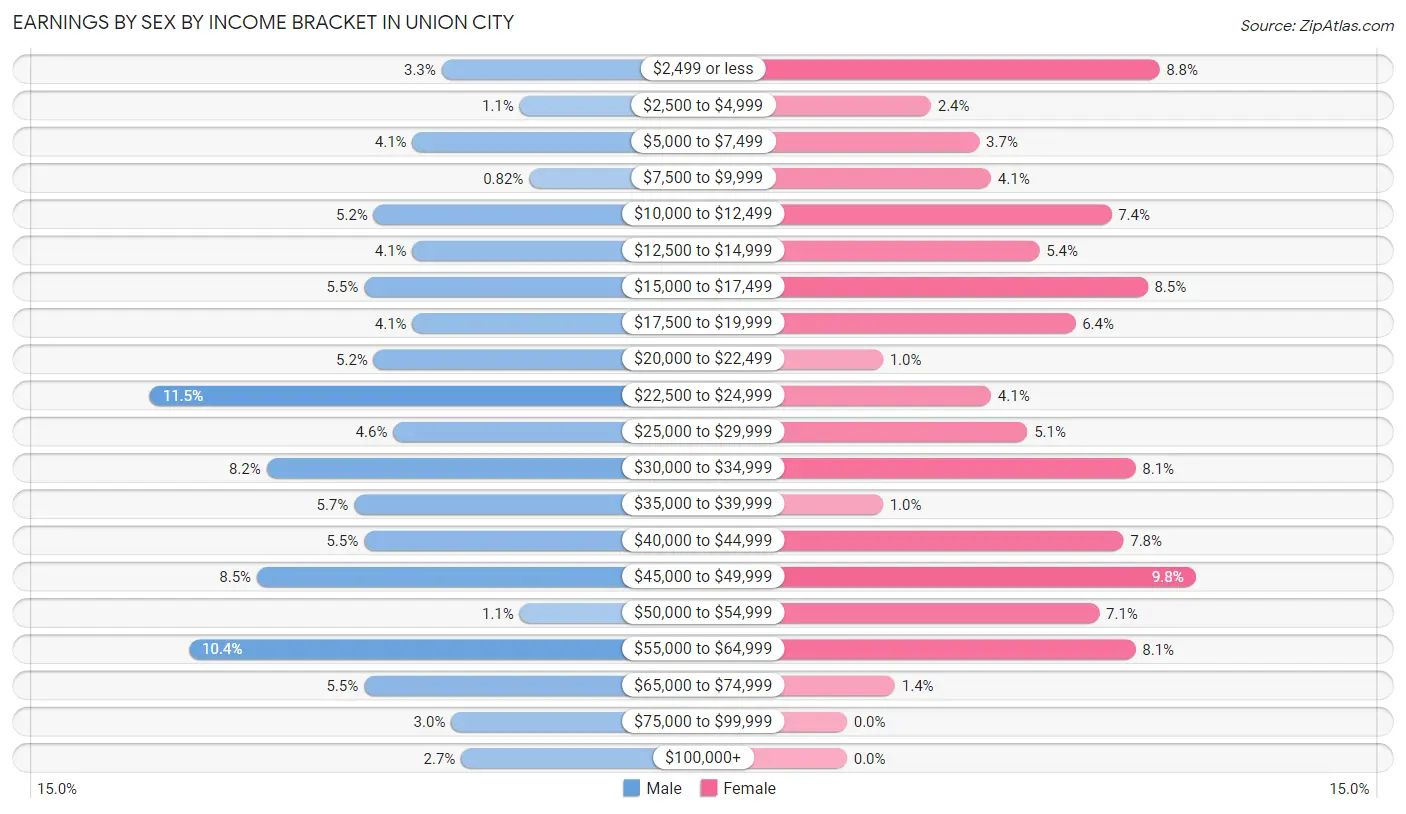
Earnings by Sex by Income Bracket in Union City
The most common earnings brackets in Union City are $22,500 to $24,999 for men (42 | 11.5%) and $45,000 to $49,999 for women (29 | 9.8%).
| Income | Male | Female |
| $2,499 or less | 12 (3.3%) | 26 (8.8%) |
| $2,500 to $4,999 | 4 (1.1%) | 7 (2.4%) |
| $5,000 to $7,499 | 15 (4.1%) | 11 (3.7%) |
| $7,500 to $9,999 | 3 (0.8%) | 12 (4.1%) |
| $10,000 to $12,499 | 19 (5.2%) | 22 (7.4%) |
| $12,500 to $14,999 | 15 (4.1%) | 16 (5.4%) |
| $15,000 to $17,499 | 20 (5.5%) | 25 (8.5%) |
| $17,500 to $19,999 | 15 (4.1%) | 19 (6.4%) |
| $20,000 to $22,499 | 19 (5.2%) | 3 (1.0%) |
| $22,500 to $24,999 | 42 (11.5%) | 12 (4.1%) |
| $25,000 to $29,999 | 17 (4.6%) | 15 (5.1%) |
| $30,000 to $34,999 | 30 (8.2%) | 24 (8.1%) |
| $35,000 to $39,999 | 21 (5.7%) | 3 (1.0%) |
| $40,000 to $44,999 | 20 (5.5%) | 23 (7.8%) |
| $45,000 to $49,999 | 31 (8.5%) | 29 (9.8%) |
| $50,000 to $54,999 | 4 (1.1%) | 21 (7.1%) |
| $55,000 to $64,999 | 38 (10.4%) | 24 (8.1%) |
| $65,000 to $74,999 | 20 (5.5%) | 4 (1.3%) |
| $75,000 to $99,999 | 11 (3.0%) | 0 (0.0%) |
| $100,000+ | 10 (2.7%) | 0 (0.0%) |
| Total | 366 (100.0%) | 296 (100.0%) |
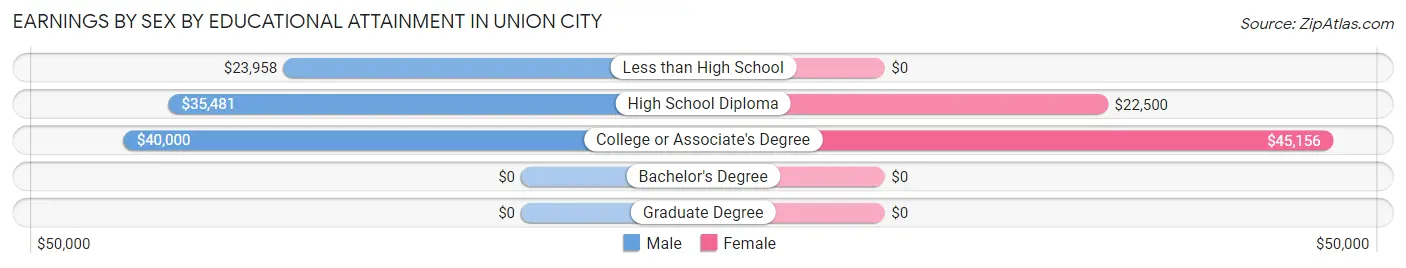
Earnings by Sex by Educational Attainment in Union City
Average earnings in Union City are $36,417 for men and $33,813 for women, a difference of 7.1%. Men with an educational attainment of college or associate's degree enjoy the highest average annual earnings of $40,000, while those with less than high school education earn the least with $23,958. Women with an educational attainment of college or associate's degree earn the most with the average annual earnings of $45,156, while those with high school diploma education have the smallest earnings of $22,500.
| Educational Attainment | Male Income | Female Income |
| Less than High School | $23,958 | $0 |
| High School Diploma | $35,481 | $22,500 |
| College or Associate's Degree | $40,000 | $45,156 |
| Bachelor's Degree | - | - |
| Graduate Degree | - | - |
| Total | $36,417 | $33,813 |
Family Income in Union City
Family Income Brackets in Union City
According to the Union City family income data, there are 86 families falling into the $15,000 to $24,999 income range, which is the most common income bracket and makes up 25.0% of all families.
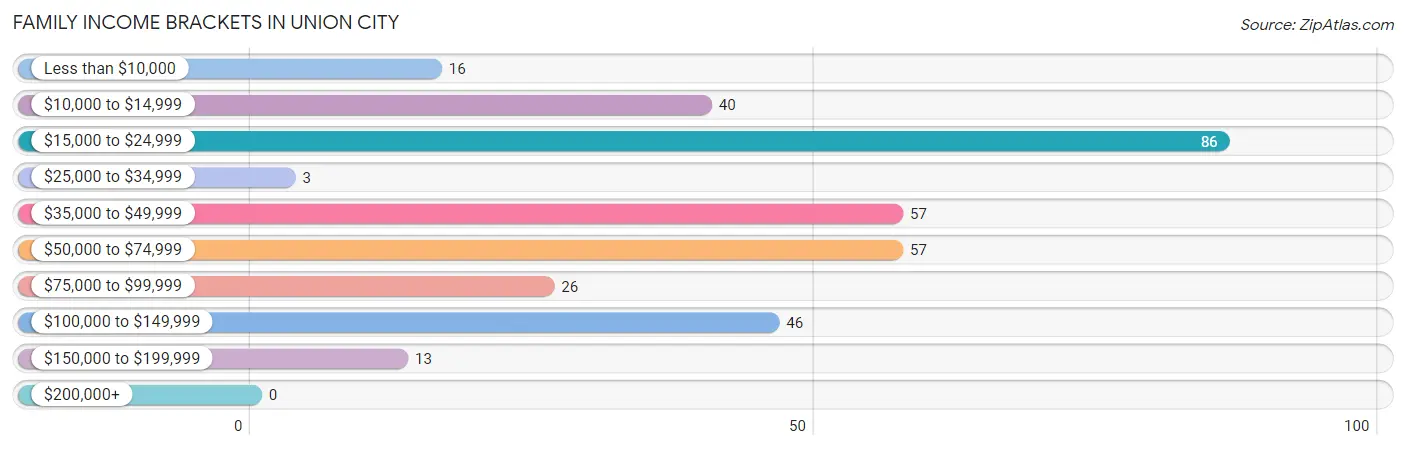
| Income Bracket | # Families | % Families |
| Less than $10,000 | 16 | 4.7% |
| $10,000 to $14,999 | 40 | 11.6% |
| $15,000 to $24,999 | 86 | 25.0% |
| $25,000 to $34,999 | 3 | 0.9% |
| $35,000 to $49,999 | 57 | 16.6% |
| $50,000 to $74,999 | 57 | 16.6% |
| $75,000 to $99,999 | 26 | 7.6% |
| $100,000 to $149,999 | 46 | 13.4% |
| $150,000 to $199,999 | 13 | 3.8% |
| $200,000+ | 0 | 0.0% |
Family Income by Famaliy Size in Union City
2-person families (134 | 39.0%) account for the highest median family income in Union City with $45,455 per family, while 2-person families (134 | 39.0%) have the highest median income of $22,728 per family member.
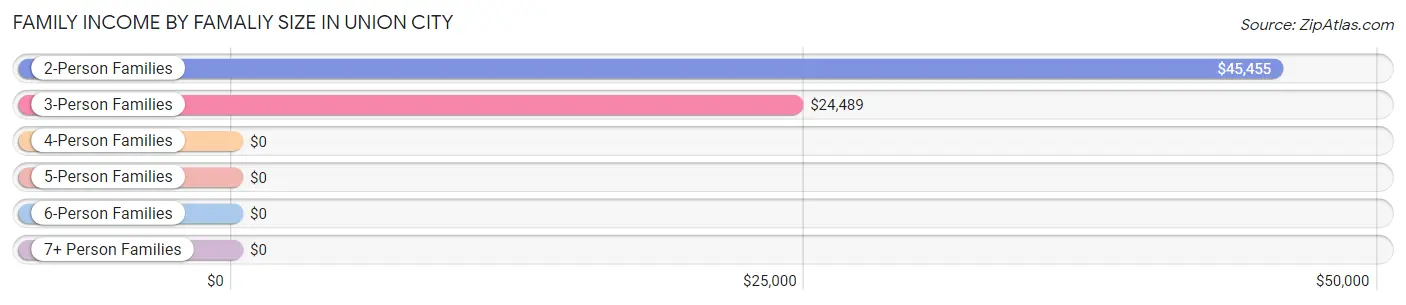
| Income Bracket | # Families | Median Income |
| 2-Person Families | 134 (39.0%) | $45,455 |
| 3-Person Families | 61 (17.7%) | $24,489 |
| 4-Person Families | 118 (34.3%) | $0 |
| 5-Person Families | 23 (6.7%) | $0 |
| 6-Person Families | 5 (1.5%) | $0 |
| 7+ Person Families | 3 (0.9%) | $0 |
| Total | 344 (100.0%) | $40,278 |
Family Income by Number of Earners in Union City
The median family income in Union City is $40,278, with families comprising 3+ earners (26) having the highest median family income of $122,679, while families with no earners (95) have the lowest median family income of $18,472, accounting for 7.6% and 27.6% of families, respectively.
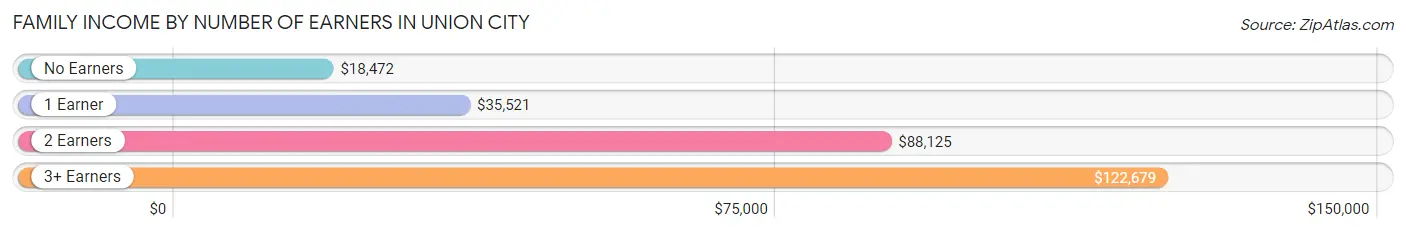
| Number of Earners | # Families | Median Income |
| No Earners | 95 (27.6%) | $18,472 |
| 1 Earner | 123 (35.8%) | $35,521 |
| 2 Earners | 100 (29.1%) | $88,125 |
| 3+ Earners | 26 (7.6%) | $122,679 |
| Total | 344 (100.0%) | $40,278 |
Household Income in Union City
Household Income Brackets in Union City
With 120 households falling in the category, the $15,000 to $24,999 income range is the most frequent in Union City, accounting for 19.5% of all households.
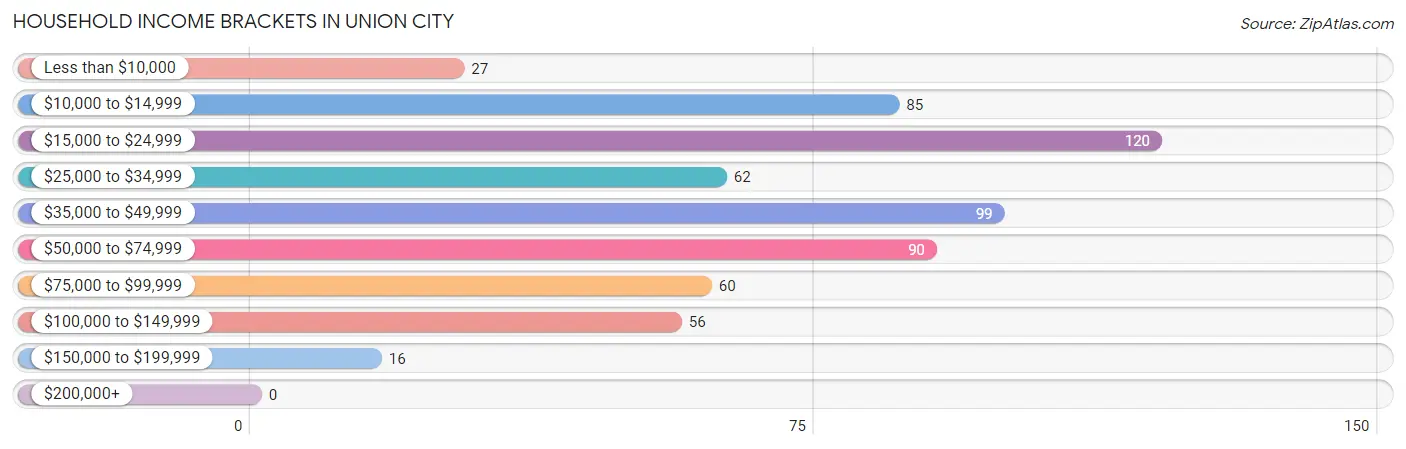
| Income Bracket | # Households | % Households |
| Less than $10,000 | 27 | 4.4% |
| $10,000 to $14,999 | 85 | 13.8% |
| $15,000 to $24,999 | 120 | 19.5% |
| $25,000 to $34,999 | 62 | 10.1% |
| $35,000 to $49,999 | 99 | 16.1% |
| $50,000 to $74,999 | 90 | 14.6% |
| $75,000 to $99,999 | 60 | 9.8% |
| $100,000 to $149,999 | 56 | 9.1% |
| $150,000 to $199,999 | 16 | 2.6% |
| $200,000+ | 0 | 0.0% |
Household Income by Householder Age in Union City
The median household income in Union City is $36,776, with the highest median household income of $43,092 found in the 25 to 44 years age bracket for the primary householder. A total of 217 households (35.3%) fall into this category. Meanwhile, the 15 to 24 years age bracket for the primary householder has the lowest median household income of $24,500, with 34 households (5.5%) in this group.
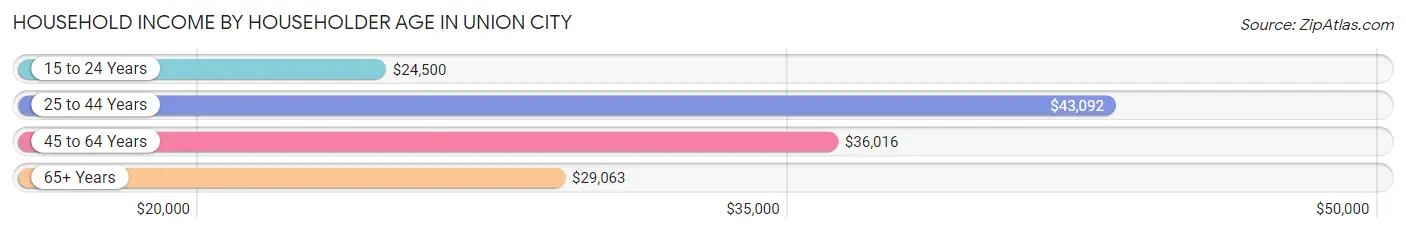
| Income Bracket | # Households | Median Income |
| 15 to 24 Years | 34 (5.5%) | $24,500 |
| 25 to 44 Years | 217 (35.3%) | $43,092 |
| 45 to 64 Years | 199 (32.4%) | $36,016 |
| 65+ Years | 165 (26.8%) | $29,063 |
| Total | 615 (100.0%) | $36,776 |
Poverty in Union City
Income Below Poverty by Sex and Age in Union City
With 29.5% poverty level for males and 44.3% for females among the residents of Union City, under 5 year old males and 15 year old females are the most vulnerable to poverty, with 21 males (100.0%) and 6 females (100.0%) in their respective age groups living below the poverty level.
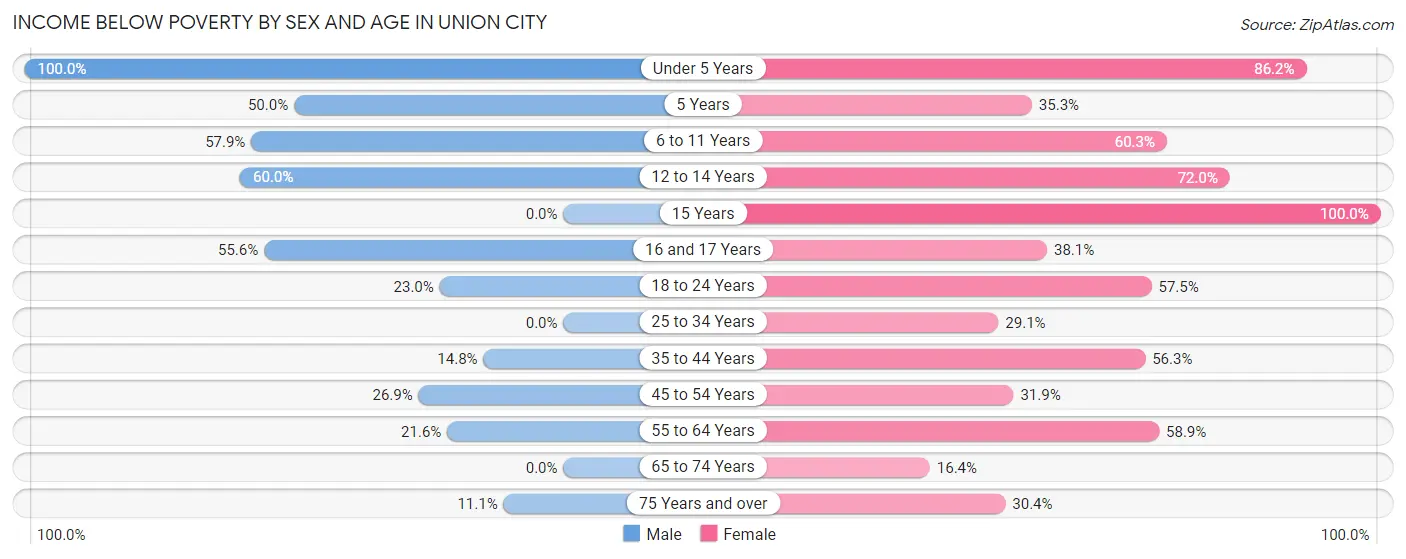
| Age Bracket | Male | Female |
| Under 5 Years | 21 (100.0%) | 25 (86.2%) |
| 5 Years | 13 (50.0%) | 6 (35.3%) |
| 6 to 11 Years | 73 (57.9%) | 38 (60.3%) |
| 12 to 14 Years | 21 (60.0%) | 18 (72.0%) |
| 15 Years | 0 (0.0%) | 6 (100.0%) |
| 16 and 17 Years | 5 (55.6%) | 8 (38.1%) |
| 18 to 24 Years | 17 (23.0%) | 46 (57.5%) |
| 25 to 34 Years | 0 (0.0%) | 25 (29.1%) |
| 35 to 44 Years | 19 (14.8%) | 49 (56.3%) |
| 45 to 54 Years | 25 (26.9%) | 29 (31.9%) |
| 55 to 64 Years | 22 (21.6%) | 43 (58.9%) |
| 65 to 74 Years | 0 (0.0%) | 17 (16.4%) |
| 75 Years and over | 3 (11.1%) | 17 (30.4%) |
| Total | 219 (29.5%) | 327 (44.3%) |
Income Above Poverty by Sex and Age in Union City
According to the poverty statistics in Union City, males aged 15 years and females aged 65 to 74 years are the age groups that are most secure financially, with 100.0% of males and 83.7% of females in these age groups living above the poverty line.
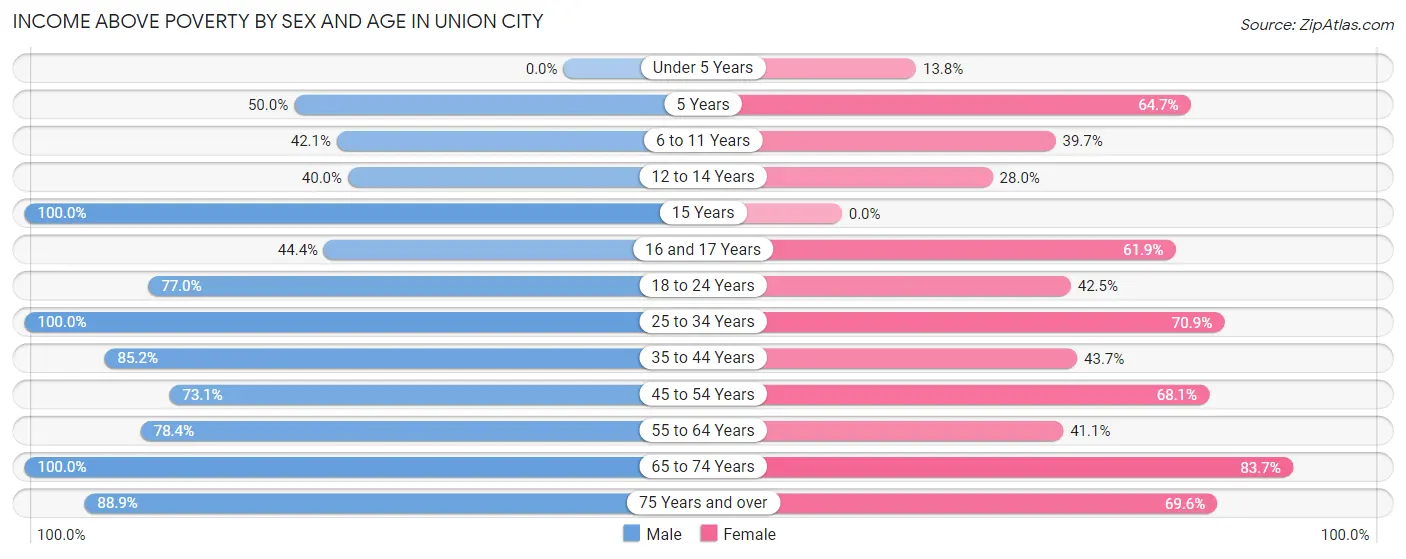
| Age Bracket | Male | Female |
| Under 5 Years | 0 (0.0%) | 4 (13.8%) |
| 5 Years | 13 (50.0%) | 11 (64.7%) |
| 6 to 11 Years | 53 (42.1%) | 25 (39.7%) |
| 12 to 14 Years | 14 (40.0%) | 7 (28.0%) |
| 15 Years | 4 (100.0%) | 0 (0.0%) |
| 16 and 17 Years | 4 (44.4%) | 13 (61.9%) |
| 18 to 24 Years | 57 (77.0%) | 34 (42.5%) |
| 25 to 34 Years | 64 (100.0%) | 61 (70.9%) |
| 35 to 44 Years | 109 (85.2%) | 38 (43.7%) |
| 45 to 54 Years | 68 (73.1%) | 62 (68.1%) |
| 55 to 64 Years | 80 (78.4%) | 30 (41.1%) |
| 65 to 74 Years | 34 (100.0%) | 87 (83.7%) |
| 75 Years and over | 24 (88.9%) | 39 (69.6%) |
| Total | 524 (70.5%) | 411 (55.7%) |
Income Below Poverty Among Married-Couple Families in Union City
The poverty statistics for married-couple families in Union City show that 18.4% or 34 of the total 185 families live below the poverty line. Families with 5 or more children have the highest poverty rate of 100.0%, comprising of 3 families. On the other hand, families with no children have the lowest poverty rate of 7.9%, which includes 9 families.
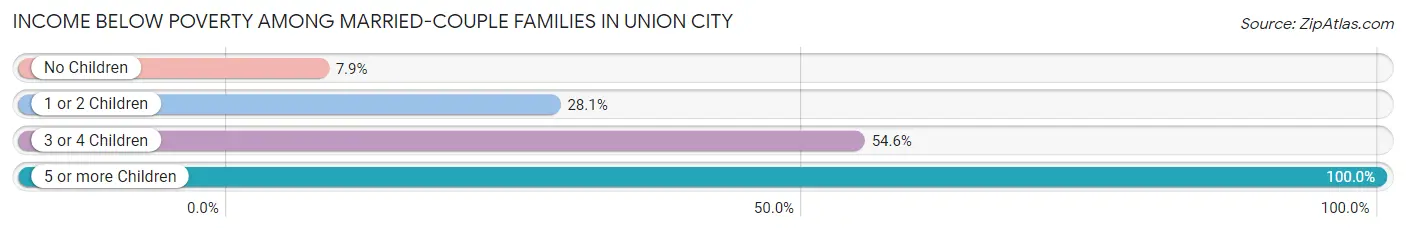
| Children | Above Poverty | Below Poverty |
| No Children | 105 (92.1%) | 9 (7.9%) |
| 1 or 2 Children | 41 (71.9%) | 16 (28.1%) |
| 3 or 4 Children | 5 (45.5%) | 6 (54.5%) |
| 5 or more Children | 0 (0.0%) | 3 (100.0%) |
| Total | 151 (81.6%) | 34 (18.4%) |
Income Below Poverty Among Single-Parent Households in Union City
According to the poverty data in Union City, 20.8% or 10 single-father households and 61.3% or 68 single-mother households are living below the poverty line. Among single-father households, those with 3 or 4 children have the highest poverty rate, with 3 households (100.0%) experiencing poverty. Likewise, among single-mother households, those with 3 or 4 children have the highest poverty rate, with 46 households (93.9%) falling below the poverty line.
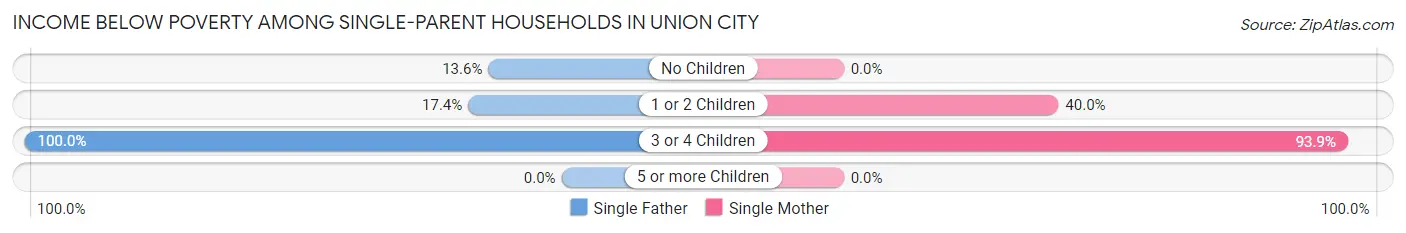
| Children | Single Father | Single Mother |
| No Children | 3 (13.6%) | 0 (0.0%) |
| 1 or 2 Children | 4 (17.4%) | 22 (40.0%) |
| 3 or 4 Children | 3 (100.0%) | 46 (93.9%) |
| 5 or more Children | 0 (0.0%) | 0 (0.0%) |
| Total | 10 (20.8%) | 68 (61.3%) |
Income Below Poverty Among Married-Couple vs Single-Parent Households in Union City
The poverty data for Union City shows that 34 of the married-couple family households (18.4%) and 78 of the single-parent households (49.1%) are living below the poverty level. Within the married-couple family households, those with 5 or more children have the highest poverty rate, with 3 households (100.0%) falling below the poverty line. Among the single-parent households, those with 3 or 4 children have the highest poverty rate, with 49 household (94.2%) living below poverty.
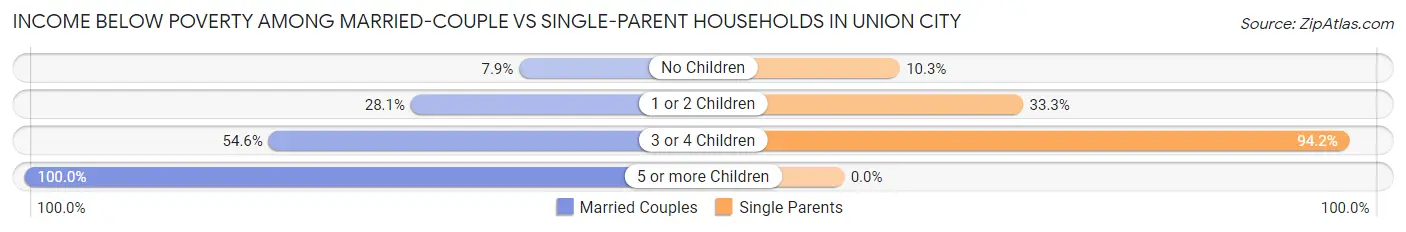
| Children | Married-Couple Families | Single-Parent Households |
| No Children | 9 (7.9%) | 3 (10.3%) |
| 1 or 2 Children | 16 (28.1%) | 26 (33.3%) |
| 3 or 4 Children | 6 (54.5%) | 49 (94.2%) |
| 5 or more Children | 3 (100.0%) | 0 (0.0%) |
| Total | 34 (18.4%) | 78 (49.1%) |
Race in Union City
The most populous races in Union City are White / Caucasian (1,356 | 88.7%), Hispanic or Latino (169 | 11.1%), and Two or more Races (82 | 5.4%).
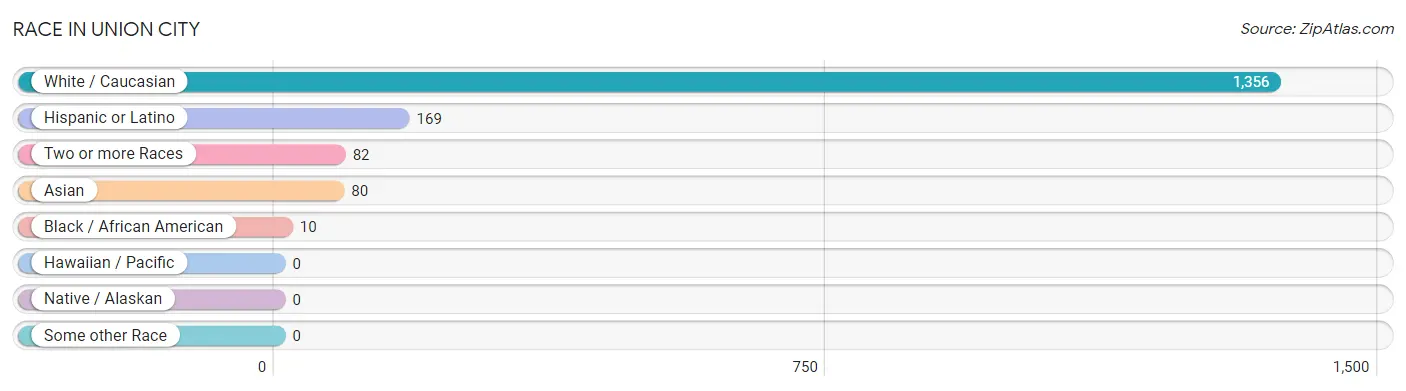
| Race | # Population | % Population |
| Asian | 80 | 5.2% |
| Black / African American | 10 | 0.6% |
| Hawaiian / Pacific | 0 | 0.0% |
| Hispanic or Latino | 169 | 11.1% |
| Native / Alaskan | 0 | 0.0% |
| White / Caucasian | 1,356 | 88.7% |
| Two or more Races | 82 | 5.4% |
| Some other Race | 0 | 0.0% |
| Total | 1,528 | 100.0% |
Ancestry in Union City
The most populous ancestries reported in Union City are German (324 | 21.2%), Mexican (160 | 10.5%), English (109 | 7.1%), American (107 | 7.0%), and Indian (Asian) (80 | 5.2%), together accounting for 51.0% of all Union City residents.
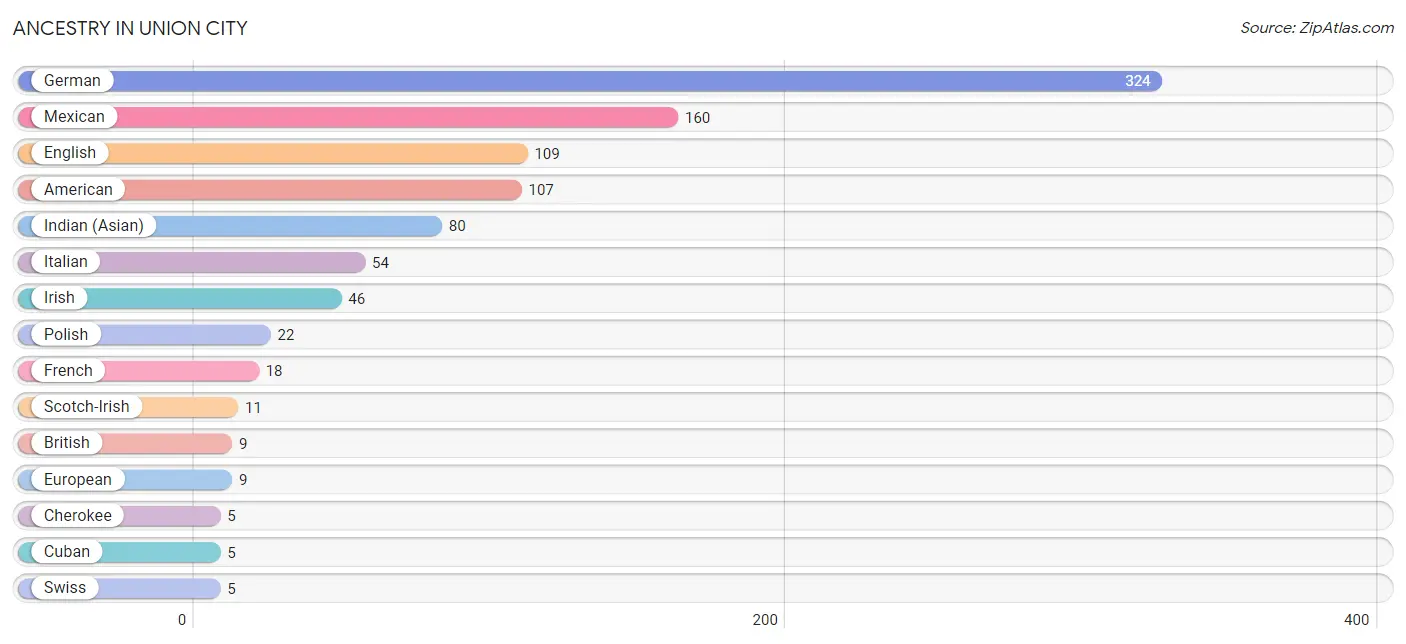
| Ancestry | # Population | % Population |
| American | 107 | 7.0% |
| British | 9 | 0.6% |
| Cherokee | 5 | 0.3% |
| Cuban | 5 | 0.3% |
| Dutch | 2 | 0.1% |
| English | 109 | 7.1% |
| European | 9 | 0.6% |
| Finnish | 2 | 0.1% |
| French | 18 | 1.2% |
| French American Indian | 1 | 0.1% |
| German | 324 | 21.2% |
| Indian (Asian) | 80 | 5.2% |
| Irish | 46 | 3.0% |
| Italian | 54 | 3.5% |
| Mexican | 160 | 10.5% |
| Northern European | 3 | 0.2% |
| Norwegian | 4 | 0.3% |
| Pennsylvania German | 4 | 0.3% |
| Polish | 22 | 1.4% |
| Puerto Rican | 4 | 0.3% |
| Scandinavian | 4 | 0.3% |
| Scotch-Irish | 11 | 0.7% |
| Scottish | 3 | 0.2% |
| Swiss | 5 | 0.3% | View All 24 Rows |
Immigrants in Union City
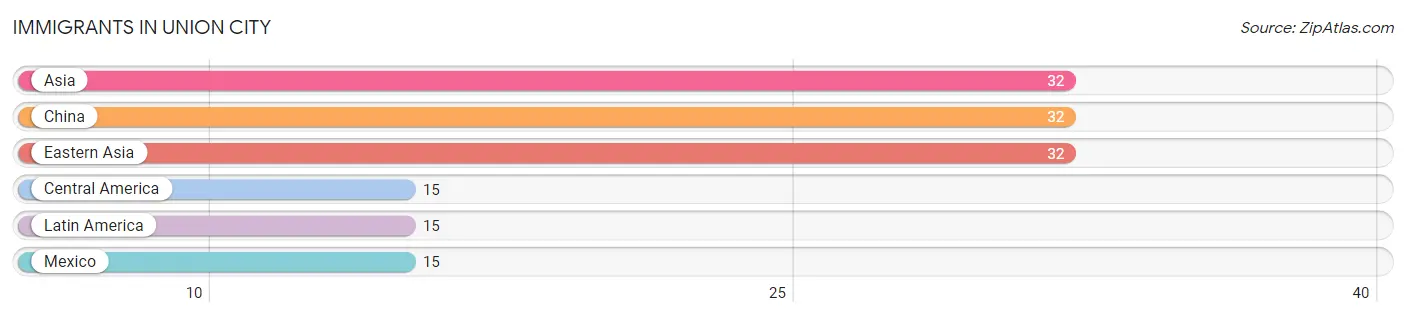
The most numerous immigrant groups reported in Union City came from Asia (32 | 2.1%), China (32 | 2.1%), Eastern Asia (32 | 2.1%), Central America (15 | 1.0%), and Latin America (15 | 1.0%), together accounting for 8.2% of all Union City residents.
| Immigration Origin | # Population | % Population |
| Asia | 32 | 2.1% |
| Central America | 15 | 1.0% |
| China | 32 | 2.1% |
| Eastern Asia | 32 | 2.1% |
| Latin America | 15 | 1.0% |
| Mexico | 15 | 1.0% | View All 6 Rows |
Sex and Age in Union City
Sex and Age in Union City
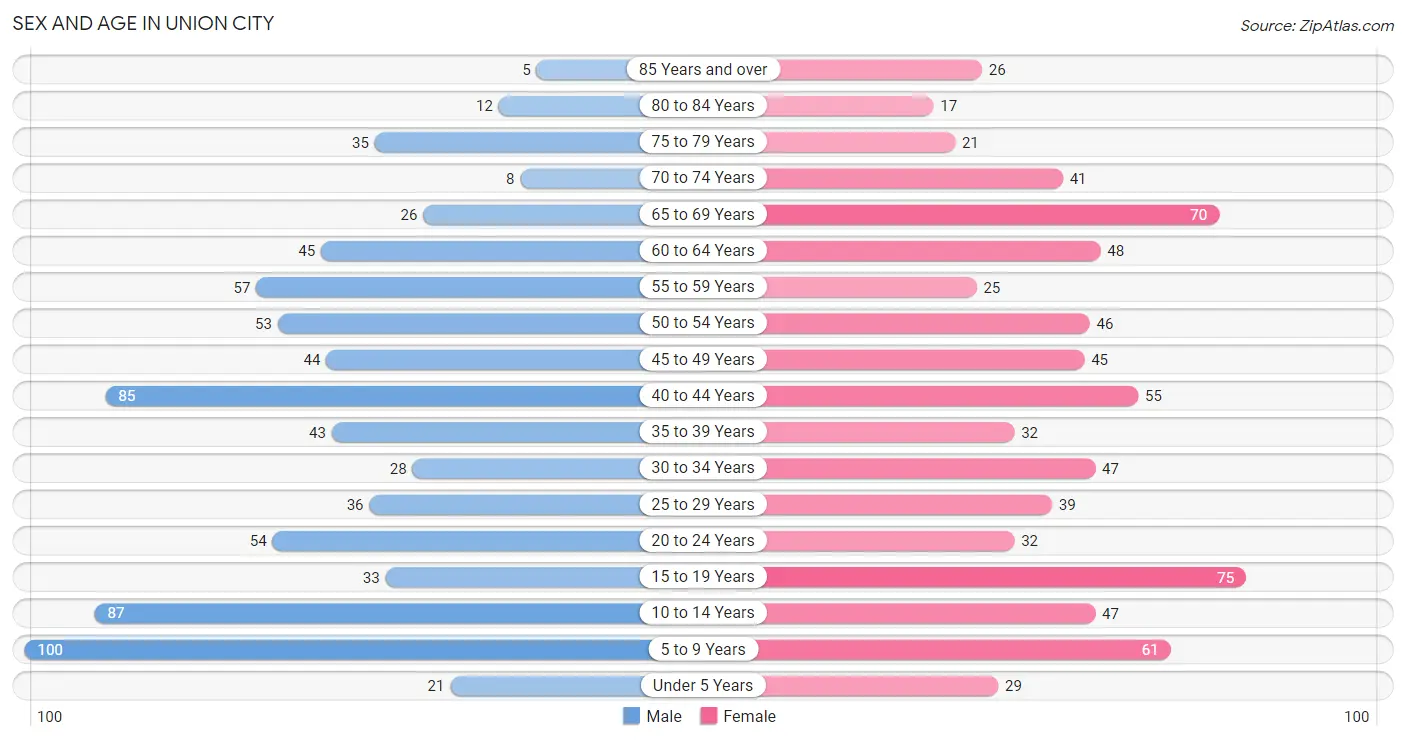
The most populous age groups in Union City are 5 to 9 Years (100 | 13.0%) for men and 15 to 19 Years (75 | 9.9%) for women.
| Age Bracket | Male | Female |
| Under 5 Years | 21 (2.7%) | 29 (3.8%) |
| 5 to 9 Years | 100 (13.0%) | 61 (8.1%) |
| 10 to 14 Years | 87 (11.3%) | 47 (6.2%) |
| 15 to 19 Years | 33 (4.3%) | 75 (9.9%) |
| 20 to 24 Years | 54 (7.0%) | 32 (4.2%) |
| 25 to 29 Years | 36 (4.7%) | 39 (5.2%) |
| 30 to 34 Years | 28 (3.6%) | 47 (6.2%) |
| 35 to 39 Years | 43 (5.6%) | 32 (4.2%) |
| 40 to 44 Years | 85 (11.0%) | 55 (7.3%) |
| 45 to 49 Years | 44 (5.7%) | 45 (5.9%) |
| 50 to 54 Years | 53 (6.9%) | 46 (6.1%) |
| 55 to 59 Years | 57 (7.4%) | 25 (3.3%) |
| 60 to 64 Years | 45 (5.8%) | 48 (6.4%) |
| 65 to 69 Years | 26 (3.4%) | 70 (9.3%) |
| 70 to 74 Years | 8 (1.0%) | 41 (5.4%) |
| 75 to 79 Years | 35 (4.5%) | 21 (2.8%) |
| 80 to 84 Years | 12 (1.5%) | 17 (2.2%) |
| 85 Years and over | 5 (0.6%) | 26 (3.4%) |
| Total | 772 (100.0%) | 756 (100.0%) |
Families and Households in Union City
Median Family Size in Union City
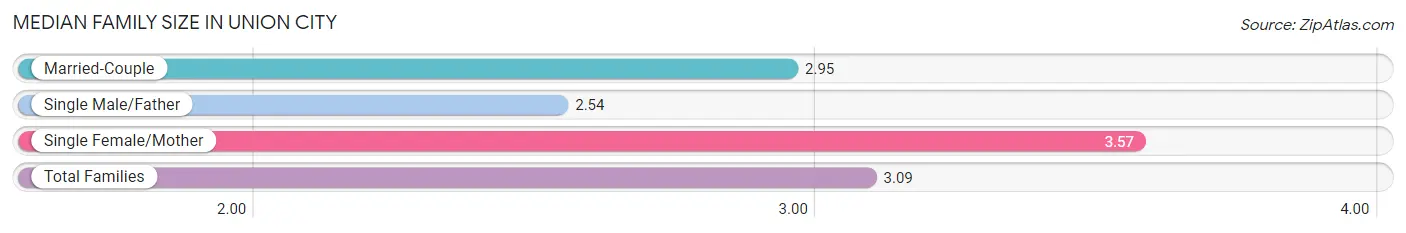
The median family size in Union City is 3.09 persons per family, with single female/mother families (111 | 32.3%) accounting for the largest median family size of 3.57 persons per family. On the other hand, single male/father families (48 | 14.0%) represent the smallest median family size with 2.54 persons per family.
| Family Type | # Families | Family Size |
| Married-Couple | 185 (53.8%) | 2.95 |
| Single Male/Father | 48 (14.0%) | 2.54 |
| Single Female/Mother | 111 (32.3%) | 3.57 |
| Total Families | 344 (100.0%) | 3.09 |
Median Household Size in Union City
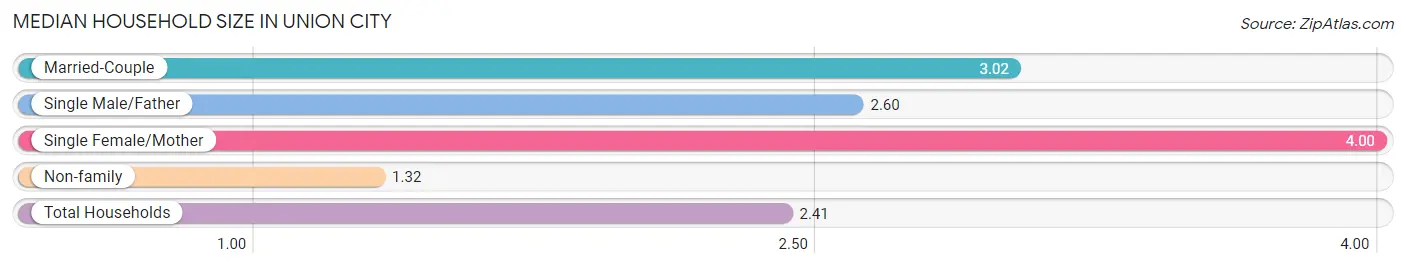
The median household size in Union City is 2.41 persons per household, with single female/mother households (111 | 18.0%) accounting for the largest median household size of 4 persons per household. non-family households (271 | 44.1%) represent the smallest median household size with 1.32 persons per household.
| Household Type | # Households | Household Size |
| Married-Couple | 185 (30.1%) | 3.02 |
| Single Male/Father | 48 (7.8%) | 2.60 |
| Single Female/Mother | 111 (18.0%) | 4.00 |
| Non-family | 271 (44.1%) | 1.32 |
| Total Households | 615 (100.0%) | 2.41 |
Household Size by Marriage Status in Union City
Out of a total of 615 households in Union City, 344 (55.9%) are family households, while 271 (44.1%) are nonfamily households. The most numerous type of family households are 2-person households, comprising 121, and the most common type of nonfamily households are 1-person households, comprising 192.
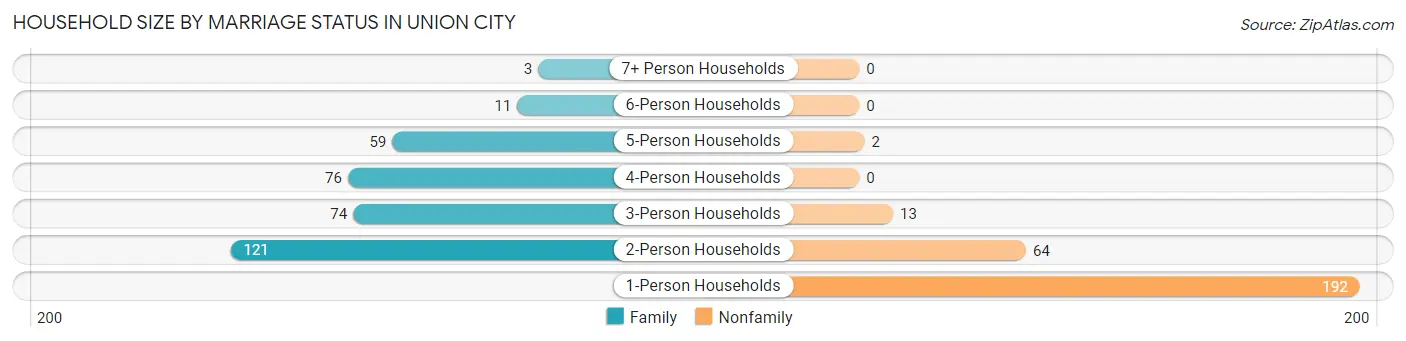
| Household Size | Family Households | Nonfamily Households |
| 1-Person Households | - | 192 (31.2%) |
| 2-Person Households | 121 (19.7%) | 64 (10.4%) |
| 3-Person Households | 74 (12.0%) | 13 (2.1%) |
| 4-Person Households | 76 (12.4%) | 0 (0.0%) |
| 5-Person Households | 59 (9.6%) | 2 (0.3%) |
| 6-Person Households | 11 (1.8%) | 0 (0.0%) |
| 7+ Person Households | 3 (0.5%) | 0 (0.0%) |
| Total | 344 (55.9%) | 271 (44.1%) |
Female Fertility in Union City
Fertility by Age in Union City
Average fertility rate in Union City is 56.0 births per 1,000 women. Women in the age bracket of 20 to 34 years have the highest fertility rate with 153.0 births per 1,000 women. Women in the age bracket of 20 to 34 years acount for 94.7% of all women with births.
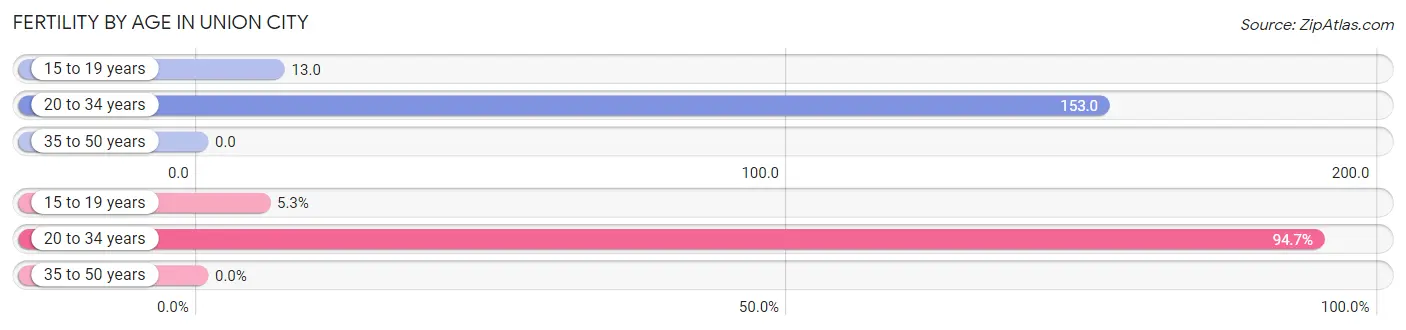
| Age Bracket | Women with Births | Births / 1,000 Women |
| 15 to 19 years | 1 (5.3%) | 13.0 |
| 20 to 34 years | 18 (94.7%) | 153.0 |
| 35 to 50 years | 0 (0.0%) | 0.0 |
| Total | 19 (100.0%) | 56.0 |
Fertility by Age by Marriage Status in Union City
57.9% of women with births (19) in Union City are married. The highest percentage of unmarried women with births falls into 20 to 34 years age bracket with 44.4% of them unmarried at the time of birth, while the lowest percentage of unmarried women with births belong to 15 to 19 years age bracket with 0.0% of them unmarried.
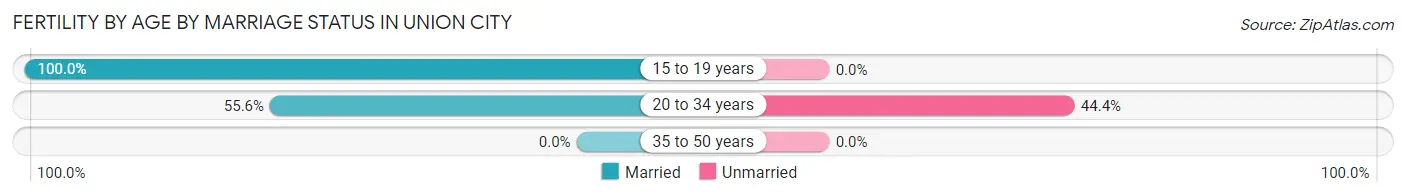
| Age Bracket | Married | Unmarried |
| 15 to 19 years | 1 (100.0%) | 0 (0.0%) |
| 20 to 34 years | 10 (55.6%) | 8 (44.4%) |
| 35 to 50 years | 0 (0.0%) | 0 (0.0%) |
| Total | 11 (57.9%) | 8 (42.1%) |
Fertility by Education in Union City
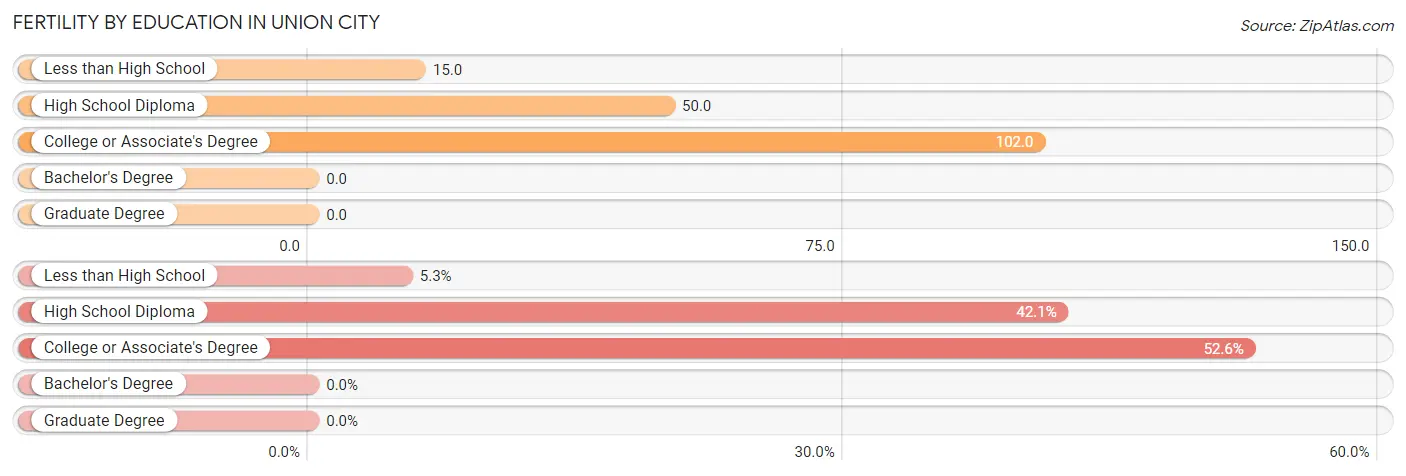
| Educational Attainment | Women with Births | Births / 1,000 Women |
| Less than High School | 1 (5.3%) | 15.0 |
| High School Diploma | 8 (42.1%) | 50.0 |
| College or Associate's Degree | 10 (52.6%) | 102.0 |
| Bachelor's Degree | 0 (0.0%) | 0.0 |
| Graduate Degree | 0 (0.0%) | 0.0 |
| Total | 19 (100.0%) | 56.0 |
Fertility by Education by Marriage Status in Union City
42.1% of women with births in Union City are unmarried. Women with the educational attainment of less than high school are most likely to be married with 100.0% of them married at childbirth, while women with the educational attainment of high school diploma are least likely to be married with 100.0% of them unmarried at childbirth.
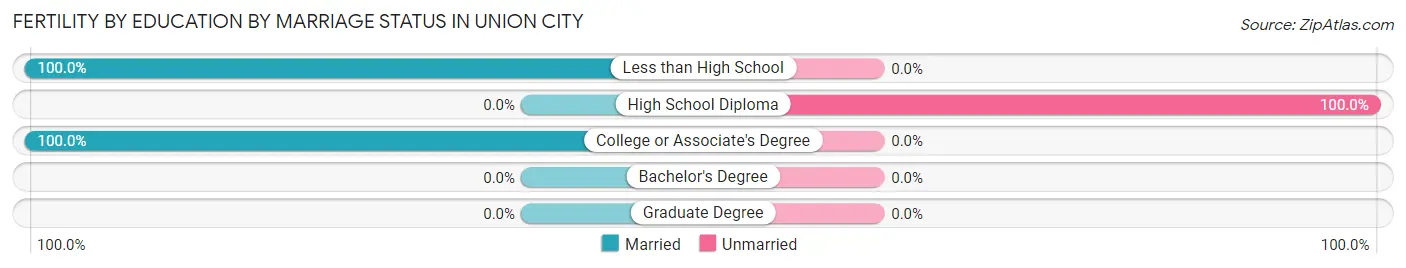
| Educational Attainment | Married | Unmarried |
| Less than High School | 1 (100.0%) | 0 (0.0%) |
| High School Diploma | 0 (0.0%) | 8 (100.0%) |
| College or Associate's Degree | 10 (100.0%) | 0 (0.0%) |
| Bachelor's Degree | 0 (0.0%) | 0 (0.0%) |
| Graduate Degree | 0 (0.0%) | 0 (0.0%) |
| Total | 11 (57.9%) | 8 (42.1%) |
Employment Characteristics in Union City
Employment by Class of Employer in Union City
Among the 613 employed individuals in Union City, private company employees (520 | 84.8%), not-for-profit organizations (27 | 4.4%), and self-employed (not incorporated) (25 | 4.1%) make up the most common classes of employment.
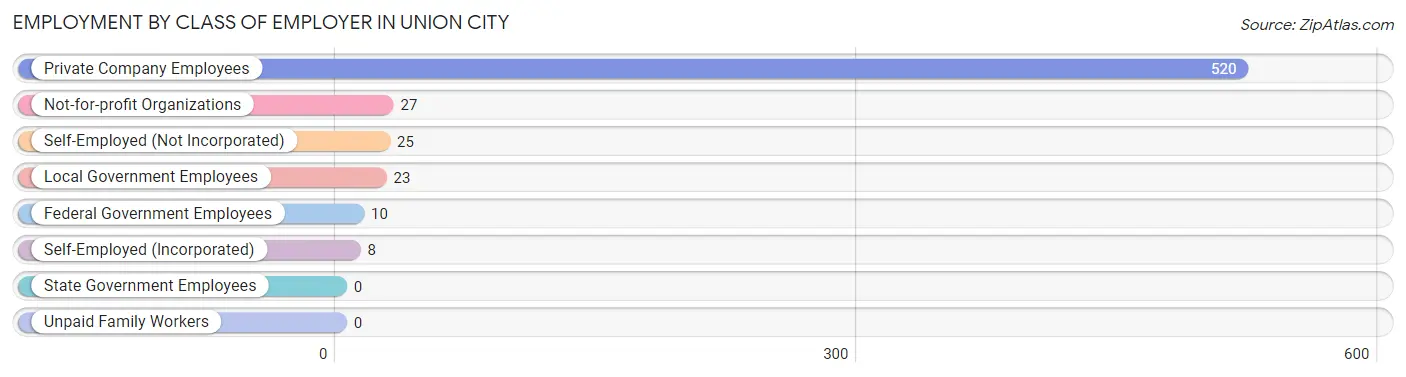
| Employer Class | # Employees | % Employees |
| Private Company Employees | 520 | 84.8% |
| Self-Employed (Incorporated) | 8 | 1.3% |
| Self-Employed (Not Incorporated) | 25 | 4.1% |
| Not-for-profit Organizations | 27 | 4.4% |
| Local Government Employees | 23 | 3.7% |
| State Government Employees | 0 | 0.0% |
| Federal Government Employees | 10 | 1.6% |
| Unpaid Family Workers | 0 | 0.0% |
| Total | 613 | 100.0% |
Employment Status by Age in Union City
According to the labor force statistics for Union City, out of the total population over 16 years of age (1,173), 56.6% or 664 individuals are in the labor force, with 7.7% or 51 of them unemployed. The age group with the highest labor force participation rate is 20 to 24 years, with 100.0% or 86 individuals in the labor force. Within the labor force, the 20 to 24 years age range has the highest percentage of unemployed individuals, with 26.7% or 23 of them being unemployed.
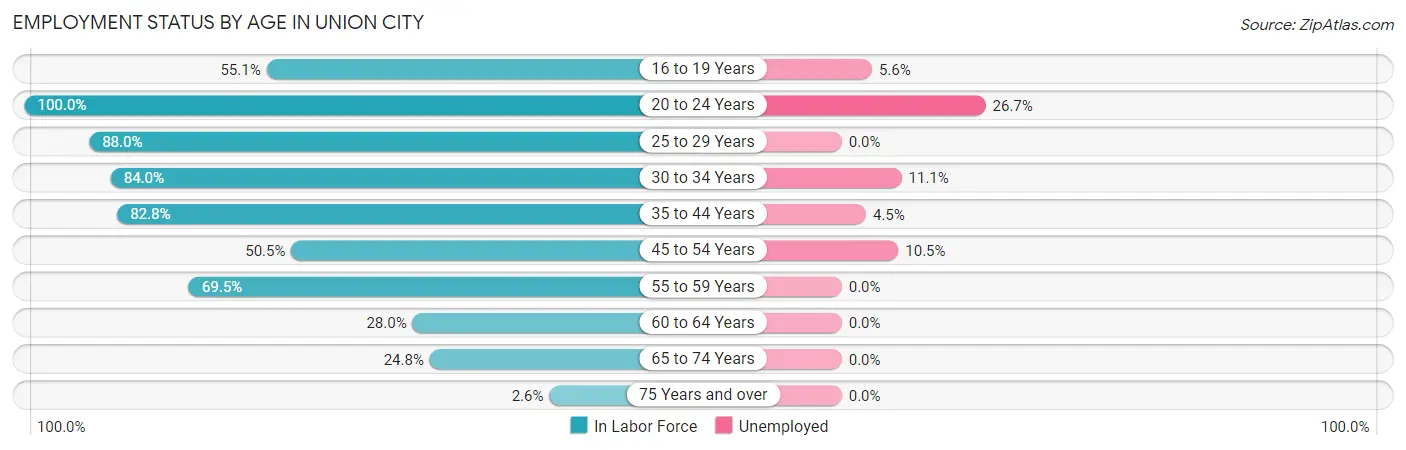
| Age Bracket | In Labor Force | Unemployed |
| 16 to 19 Years | 54 (55.1%) | 3 (5.6%) |
| 20 to 24 Years | 86 (100.0%) | 23 (26.7%) |
| 25 to 29 Years | 66 (88.0%) | 0 (0.0%) |
| 30 to 34 Years | 63 (84.0%) | 7 (11.1%) |
| 35 to 44 Years | 178 (82.8%) | 8 (4.5%) |
| 45 to 54 Years | 95 (50.5%) | 10 (10.5%) |
| 55 to 59 Years | 57 (69.5%) | 0 (0.0%) |
| 60 to 64 Years | 26 (28.0%) | 0 (0.0%) |
| 65 to 74 Years | 36 (24.8%) | 0 (0.0%) |
| 75 Years and over | 3 (2.6%) | 0 (0.0%) |
| Total | 664 (56.6%) | 51 (7.7%) |
Employment Status by Educational Attainment in Union City
According to labor force statistics for Union City, 66.6% of individuals (485) out of the total population between 25 and 64 years of age (728) are in the labor force, with 5.2% or 25 of them being unemployed. The group with the highest labor force participation rate are those with the educational attainment of college / associate degree, with 76.7% or 122 individuals in the labor force. Within the labor force, individuals with less than high school education have the highest percentage of unemployment, with 28.3% or 17 of them being unemployed.
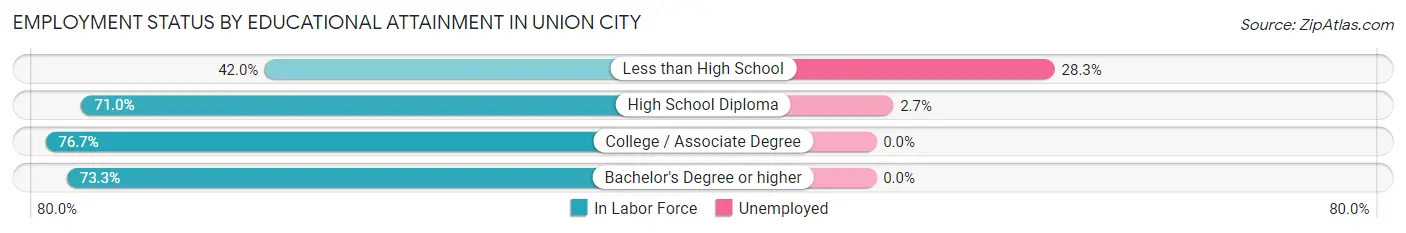
| Educational Attainment | In Labor Force | Unemployed |
| Less than High School | 60 (42.0%) | 40 (28.3%) |
| High School Diploma | 292 (71.0%) | 11 (2.7%) |
| College / Associate Degree | 122 (76.7%) | 0 (0.0%) |
| Bachelor's Degree or higher | 11 (73.3%) | 0 (0.0%) |
| Total | 485 (66.6%) | 38 (5.2%) |
Employment Occupations by Sex in Union City
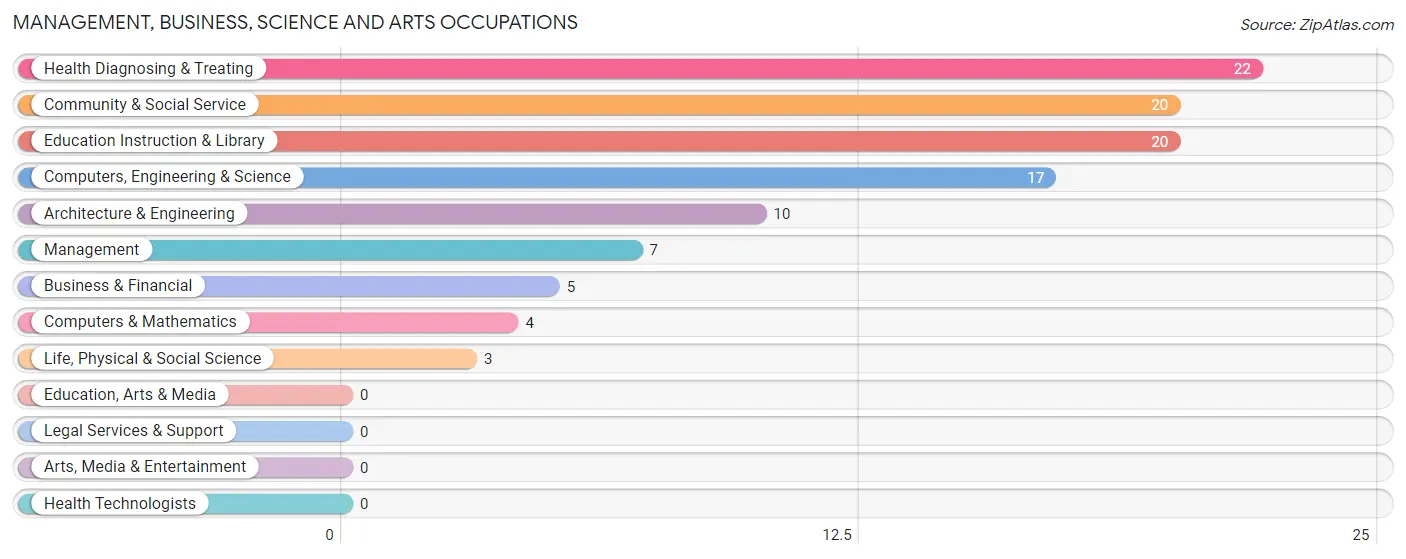
Management, Business, Science and Arts Occupations
The most common Management, Business, Science and Arts occupations in Union City are Health Diagnosing & Treating (22 | 3.6%), Community & Social Service (20 | 3.3%), Education Instruction & Library (20 | 3.3%), Computers, Engineering & Science (17 | 2.8%), and Architecture & Engineering (10 | 1.6%).
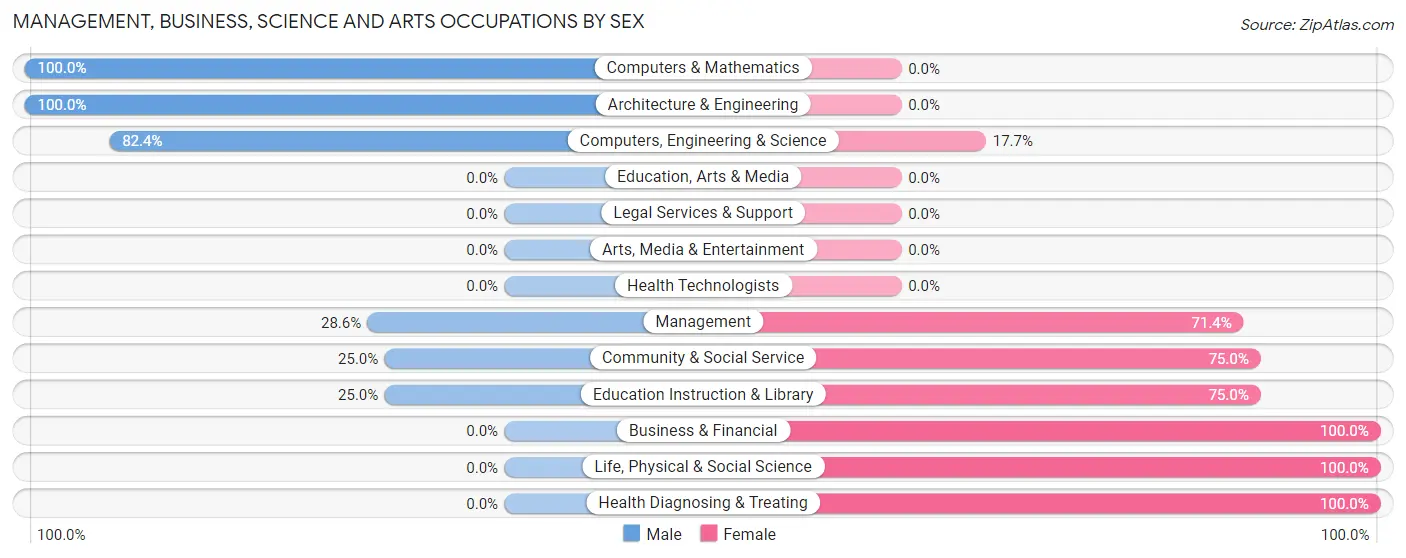
Management, Business, Science and Arts Occupations by Sex
Within the Management, Business, Science and Arts occupations in Union City, the most male-oriented occupations are Computers & Mathematics (100.0%), Architecture & Engineering (100.0%), and Computers, Engineering & Science (82.4%), while the most female-oriented occupations are Business & Financial (100.0%), Life, Physical & Social Science (100.0%), and Health Diagnosing & Treating (100.0%).
| Occupation | Male | Female |
| Management | 2 (28.6%) | 5 (71.4%) |
| Business & Financial | 0 (0.0%) | 5 (100.0%) |
| Computers, Engineering & Science | 14 (82.4%) | 3 (17.6%) |
| Computers & Mathematics | 4 (100.0%) | 0 (0.0%) |
| Architecture & Engineering | 10 (100.0%) | 0 (0.0%) |
| Life, Physical & Social Science | 0 (0.0%) | 3 (100.0%) |
| Community & Social Service | 5 (25.0%) | 15 (75.0%) |
| Education, Arts & Media | 0 (0.0%) | 0 (0.0%) |
| Legal Services & Support | 0 (0.0%) | 0 (0.0%) |
| Education Instruction & Library | 5 (25.0%) | 15 (75.0%) |
| Arts, Media & Entertainment | 0 (0.0%) | 0 (0.0%) |
| Health Diagnosing & Treating | 0 (0.0%) | 22 (100.0%) |
| Health Technologists | 0 (0.0%) | 0 (0.0%) |
| Total (Category) | 21 (29.6%) | 50 (70.4%) |
| Total (Overall) | 345 (56.3%) | 268 (43.7%) |
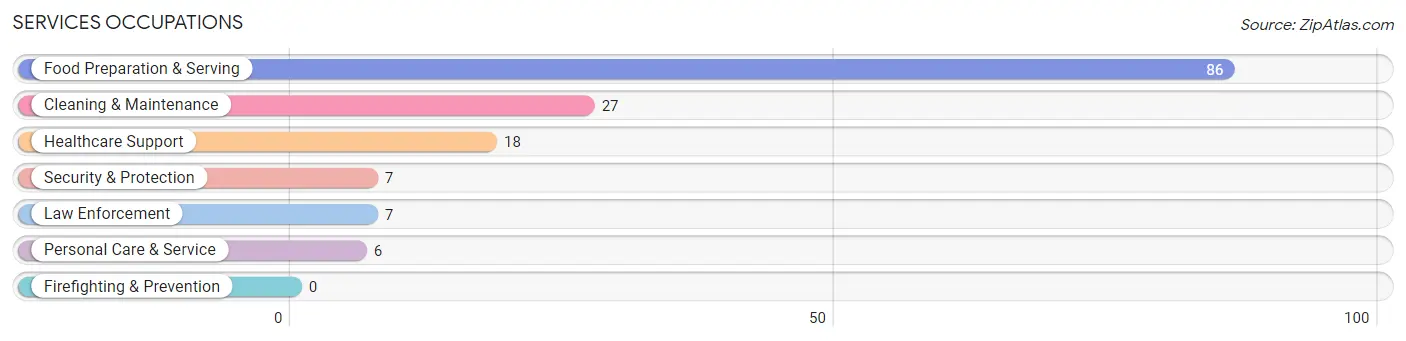
Services Occupations
The most common Services occupations in Union City are Food Preparation & Serving (86 | 14.0%), Cleaning & Maintenance (27 | 4.4%), Healthcare Support (18 | 2.9%), Security & Protection (7 | 1.1%), and Law Enforcement (7 | 1.1%).
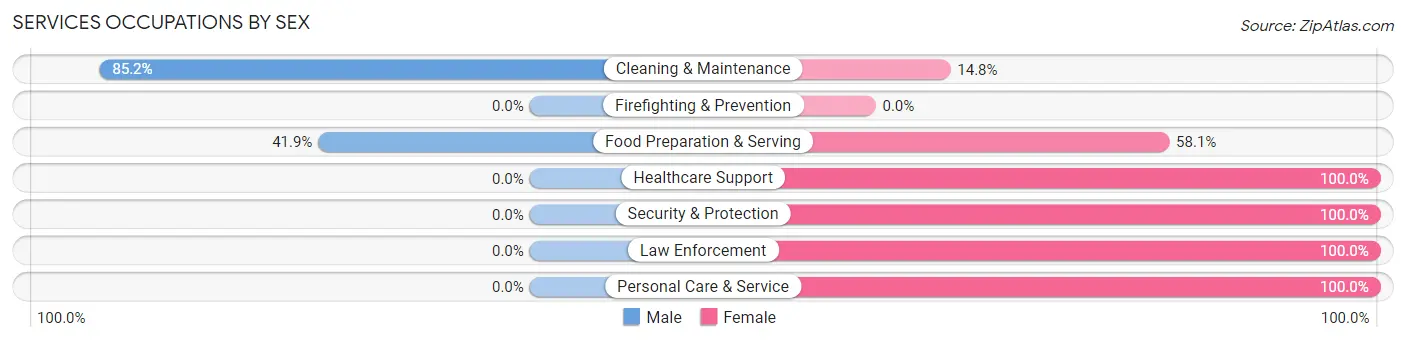
Services Occupations by Sex
Within the Services occupations in Union City, the most male-oriented occupations are Cleaning & Maintenance (85.2%), and Food Preparation & Serving (41.9%), while the most female-oriented occupations are Healthcare Support (100.0%), Security & Protection (100.0%), and Law Enforcement (100.0%).
| Occupation | Male | Female |
| Healthcare Support | 0 (0.0%) | 18 (100.0%) |
| Security & Protection | 0 (0.0%) | 7 (100.0%) |
| Firefighting & Prevention | 0 (0.0%) | 0 (0.0%) |
| Law Enforcement | 0 (0.0%) | 7 (100.0%) |
| Food Preparation & Serving | 36 (41.9%) | 50 (58.1%) |
| Cleaning & Maintenance | 23 (85.2%) | 4 (14.8%) |
| Personal Care & Service | 0 (0.0%) | 6 (100.0%) |
| Total (Category) | 59 (41.0%) | 85 (59.0%) |
| Total (Overall) | 345 (56.3%) | 268 (43.7%) |
Sales and Office Occupations
The most common Sales and Office occupations in Union City are Sales & Related (55 | 9.0%), and Office & Administration (37 | 6.0%).
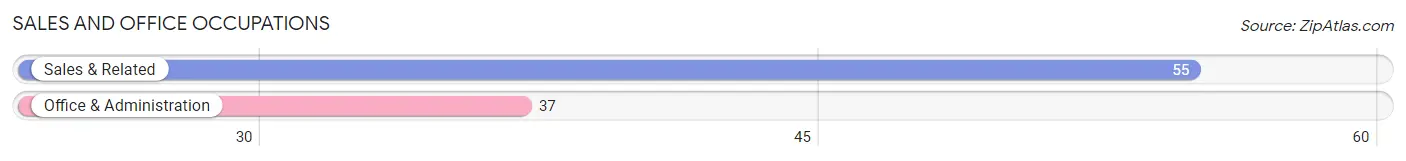
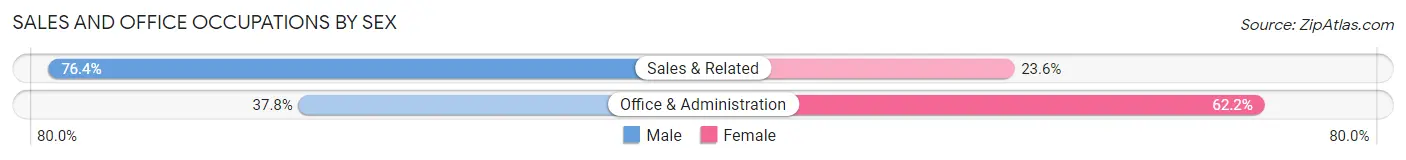
Sales and Office Occupations by Sex
| Occupation | Male | Female |
| Sales & Related | 42 (76.4%) | 13 (23.6%) |
| Office & Administration | 14 (37.8%) | 23 (62.2%) |
| Total (Category) | 56 (60.9%) | 36 (39.1%) |
| Total (Overall) | 345 (56.3%) | 268 (43.7%) |
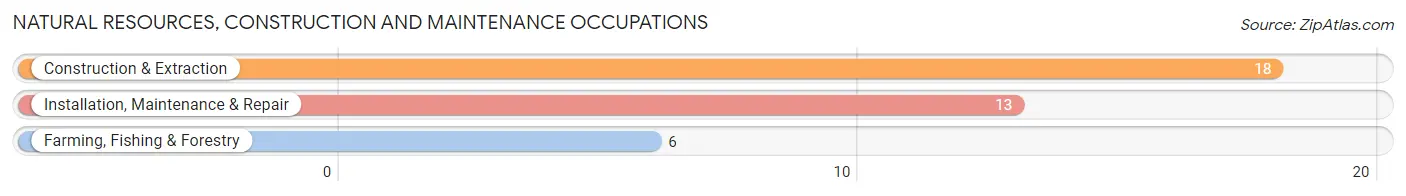
Natural Resources, Construction and Maintenance Occupations
The most common Natural Resources, Construction and Maintenance occupations in Union City are Construction & Extraction (18 | 2.9%), Installation, Maintenance & Repair (13 | 2.1%), and Farming, Fishing & Forestry (6 | 1.0%).
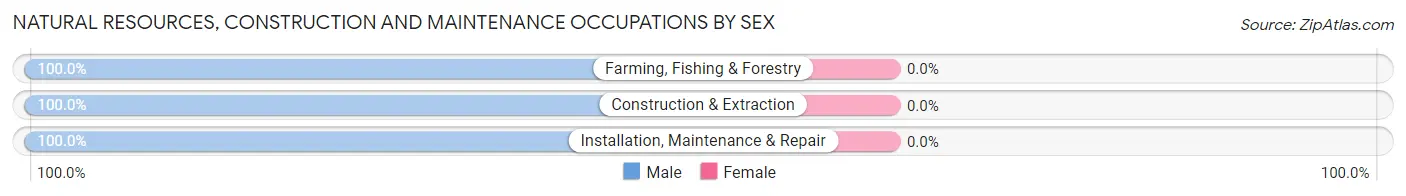
Natural Resources, Construction and Maintenance Occupations by Sex
| Occupation | Male | Female |
| Farming, Fishing & Forestry | 6 (100.0%) | 0 (0.0%) |
| Construction & Extraction | 18 (100.0%) | 0 (0.0%) |
| Installation, Maintenance & Repair | 13 (100.0%) | 0 (0.0%) |
| Total (Category) | 37 (100.0%) | 0 (0.0%) |
| Total (Overall) | 345 (56.3%) | 268 (43.7%) |
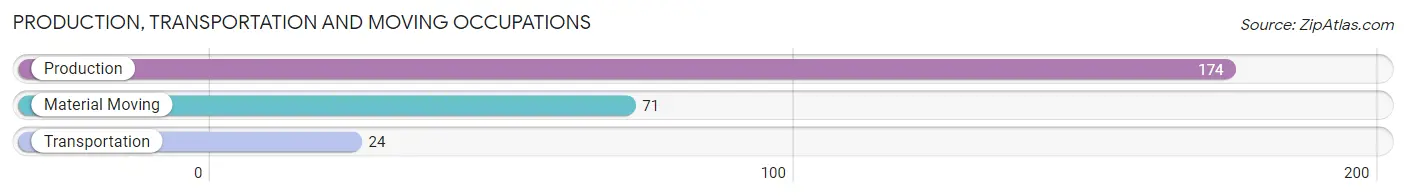
Production, Transportation and Moving Occupations
The most common Production, Transportation and Moving occupations in Union City are Production (174 | 28.4%), Material Moving (71 | 11.6%), and Transportation (24 | 3.9%).
Production, Transportation and Moving Occupations by Sex
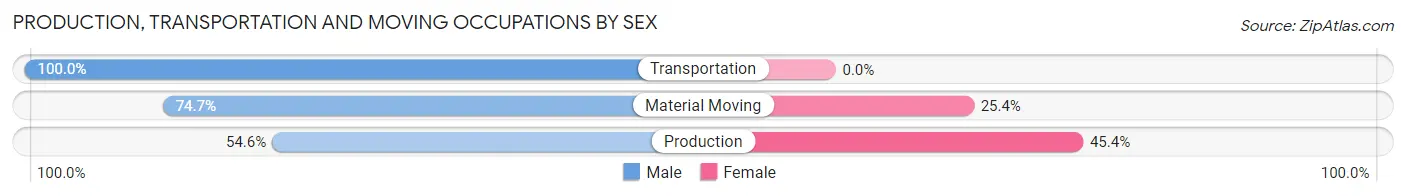
| Occupation | Male | Female |
| Production | 95 (54.6%) | 79 (45.4%) |
| Transportation | 24 (100.0%) | 0 (0.0%) |
| Material Moving | 53 (74.7%) | 18 (25.4%) |
| Total (Category) | 172 (63.9%) | 97 (36.1%) |
| Total (Overall) | 345 (56.3%) | 268 (43.7%) |
Employment Industries by Sex in Union City
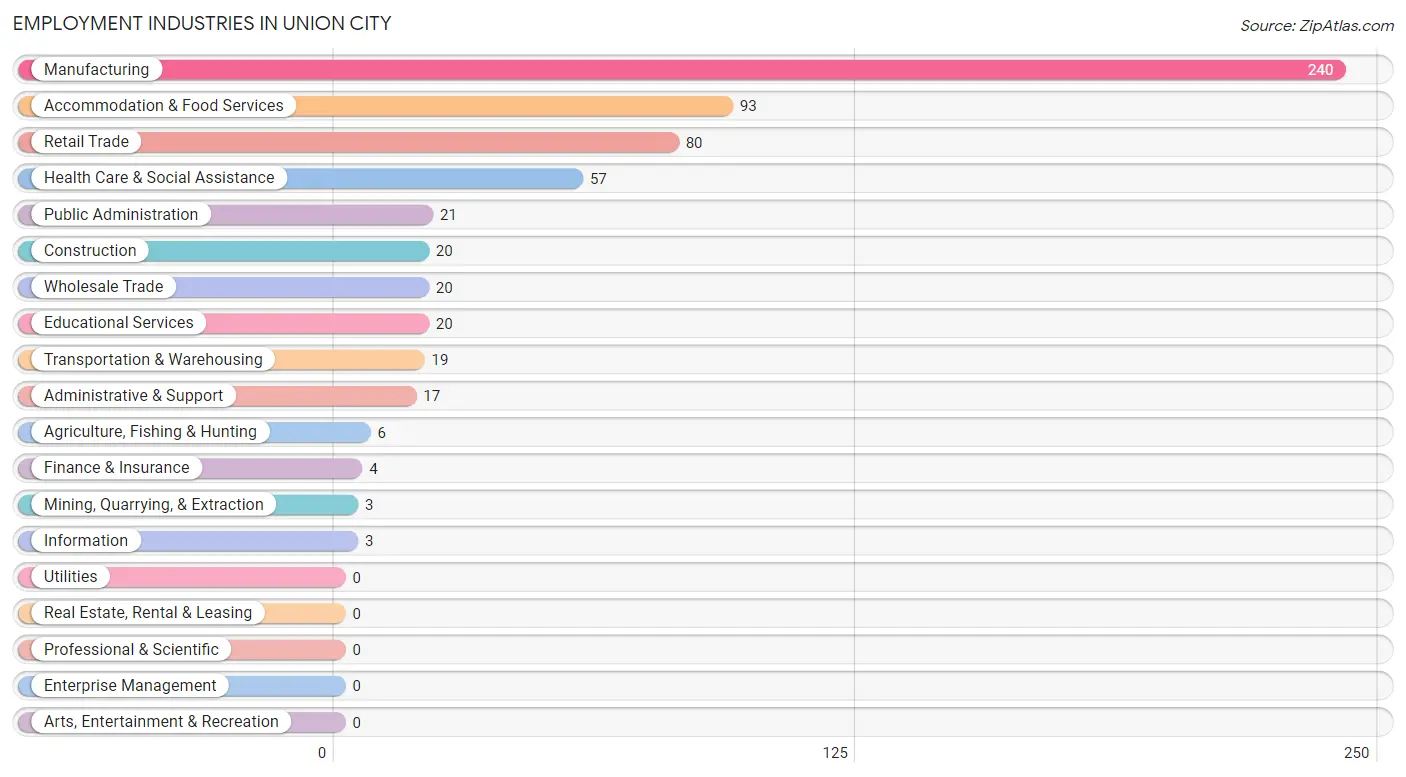
Employment Industries in Union City
The major employment industries in Union City include Manufacturing (240 | 39.2%), Accommodation & Food Services (93 | 15.2%), Retail Trade (80 | 13.1%), Health Care & Social Assistance (57 | 9.3%), and Public Administration (21 | 3.4%).
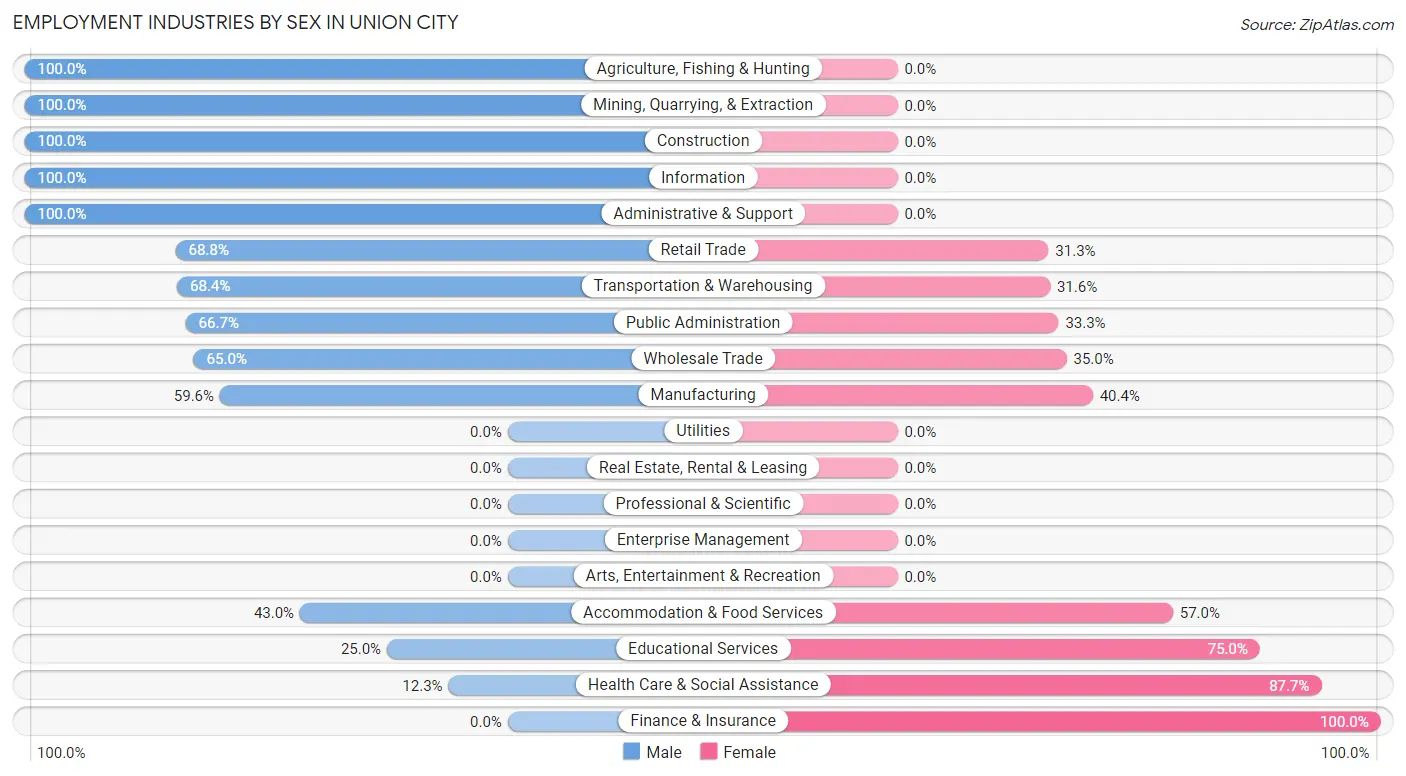
Employment Industries by Sex in Union City
The Union City industries that see more men than women are Agriculture, Fishing & Hunting (100.0%), Mining, Quarrying, & Extraction (100.0%), and Construction (100.0%), whereas the industries that tend to have a higher number of women are Finance & Insurance (100.0%), Health Care & Social Assistance (87.7%), and Educational Services (75.0%).
| Industry | Male | Female |
| Agriculture, Fishing & Hunting | 6 (100.0%) | 0 (0.0%) |
| Mining, Quarrying, & Extraction | 3 (100.0%) | 0 (0.0%) |
| Construction | 20 (100.0%) | 0 (0.0%) |
| Manufacturing | 143 (59.6%) | 97 (40.4%) |
| Wholesale Trade | 13 (65.0%) | 7 (35.0%) |
| Retail Trade | 55 (68.8%) | 25 (31.2%) |
| Transportation & Warehousing | 13 (68.4%) | 6 (31.6%) |
| Utilities | 0 (0.0%) | 0 (0.0%) |
| Information | 3 (100.0%) | 0 (0.0%) |
| Finance & Insurance | 0 (0.0%) | 4 (100.0%) |
| Real Estate, Rental & Leasing | 0 (0.0%) | 0 (0.0%) |
| Professional & Scientific | 0 (0.0%) | 0 (0.0%) |
| Enterprise Management | 0 (0.0%) | 0 (0.0%) |
| Administrative & Support | 17 (100.0%) | 0 (0.0%) |
| Educational Services | 5 (25.0%) | 15 (75.0%) |
| Health Care & Social Assistance | 7 (12.3%) | 50 (87.7%) |
| Arts, Entertainment & Recreation | 0 (0.0%) | 0 (0.0%) |
| Accommodation & Food Services | 40 (43.0%) | 53 (57.0%) |
| Public Administration | 14 (66.7%) | 7 (33.3%) |
| Total | 345 (56.3%) | 268 (43.7%) |
Education in Union City
School Enrollment in Union City
The most common levels of schooling among the 366 students in Union City are elementary school (152 | 41.5%), middle school (81 | 22.1%), and high school (53 | 14.5%).
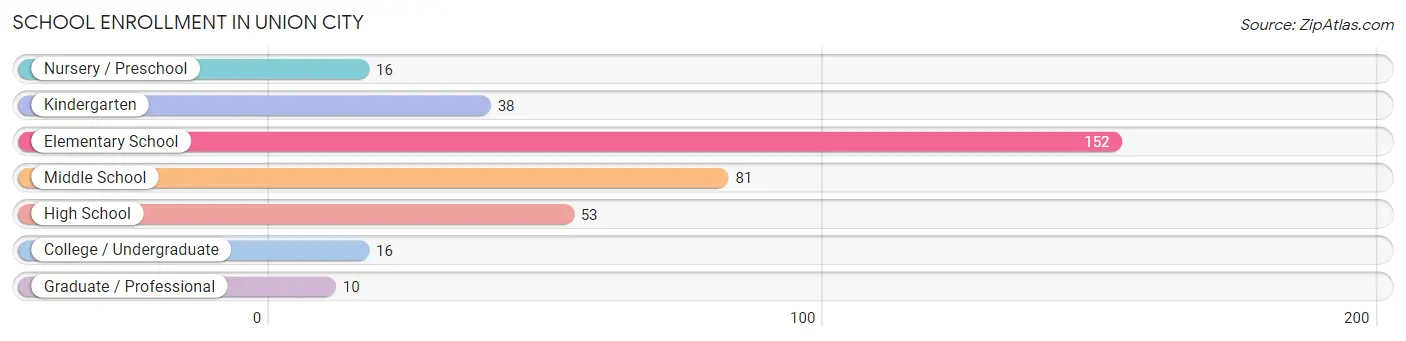
| School Level | # Students | % Students |
| Nursery / Preschool | 16 | 4.4% |
| Kindergarten | 38 | 10.4% |
| Elementary School | 152 | 41.5% |
| Middle School | 81 | 22.1% |
| High School | 53 | 14.5% |
| College / Undergraduate | 16 | 4.4% |
| Graduate / Professional | 10 | 2.7% |
| Total | 366 | 100.0% |
School Enrollment by Age by Funding Source in Union City
Out of a total of 366 students who are enrolled in schools in Union City, 23 (6.3%) attend a private institution, while the remaining 343 (93.7%) are enrolled in public schools. The age group of 35 years and over has the highest likelihood of being enrolled in private schools, with 4 (100.0% in the age bracket) enrolled. Conversely, the age group of 3 to 4 year olds has the lowest likelihood of being enrolled in a private school, with 7 (100.0% in the age bracket) attending a public institution.

| Age Bracket | Public School | Private School |
| 3 to 4 Year Olds | 7 (100.0%) | 0 (0.0%) |
| 5 to 9 Year Old | 151 (100.0%) | 0 (0.0%) |
| 10 to 14 Year Olds | 115 (85.8%) | 19 (14.2%) |
| 15 to 17 Year Olds | 36 (100.0%) | 0 (0.0%) |
| 18 to 19 Year Olds | 12 (100.0%) | 0 (0.0%) |
| 20 to 24 Year Olds | 20 (100.0%) | 0 (0.0%) |
| 25 to 34 Year Olds | 2 (100.0%) | 0 (0.0%) |
| 35 Years and over | 0 (0.0%) | 4 (100.0%) |
| Total | 343 (93.7%) | 23 (6.3%) |
Educational Attainment by Field of Study in Union City
Education (5 | 25.0%), visual & performing arts (5 | 25.0%), arts & humanities (5 | 25.0%), business (3 | 15.0%), and communications (2 | 10.0%) are the most common fields of study among 20 individuals in Union City who have obtained a bachelor's degree or higher.
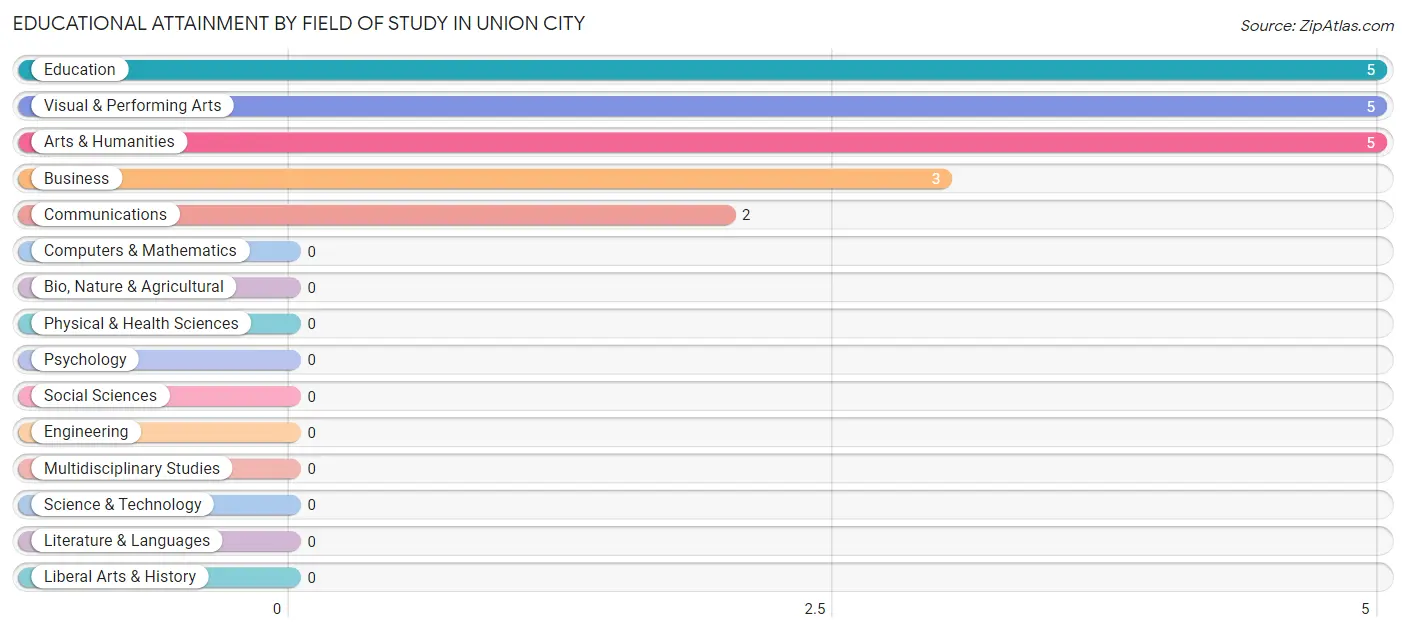
| Field of Study | # Graduates | % Graduates |
| Computers & Mathematics | 0 | 0.0% |
| Bio, Nature & Agricultural | 0 | 0.0% |
| Physical & Health Sciences | 0 | 0.0% |
| Psychology | 0 | 0.0% |
| Social Sciences | 0 | 0.0% |
| Engineering | 0 | 0.0% |
| Multidisciplinary Studies | 0 | 0.0% |
| Science & Technology | 0 | 0.0% |
| Business | 3 | 15.0% |
| Education | 5 | 25.0% |
| Literature & Languages | 0 | 0.0% |
| Liberal Arts & History | 0 | 0.0% |
| Visual & Performing Arts | 5 | 25.0% |
| Communications | 2 | 10.0% |
| Arts & Humanities | 5 | 25.0% |
| Total | 20 | 100.0% |
Transportation & Commute in Union City
Vehicle Availability by Sex in Union City
The most prevalent vehicle ownership categories in Union City are males with 2 vehicles (120, accounting for 34.8%) and females with 2 vehicles (92, making up 44.8%).
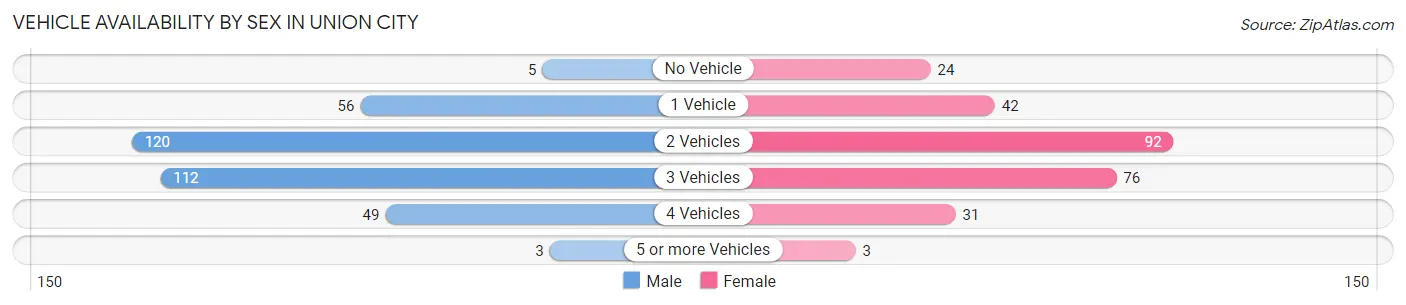
| Vehicles Available | Male | Female |
| No Vehicle | 5 (1.5%) | 24 (9.0%) |
| 1 Vehicle | 56 (16.2%) | 42 (15.7%) |
| 2 Vehicles | 120 (34.8%) | 92 (34.3%) |
| 3 Vehicles | 112 (32.5%) | 76 (28.4%) |
| 4 Vehicles | 49 (14.2%) | 31 (11.6%) |
| 5 or more Vehicles | 3 (0.9%) | 3 (1.1%) |
| Total | 345 (100.0%) | 268 (100.0%) |
Commute Time in Union City
The most frequently occuring commute durations in Union City are 20 to 24 minutes (147 commuters, 24.1%), 5 to 9 minutes (85 commuters, 13.9%), and less than 5 minutes (72 commuters, 11.8%).
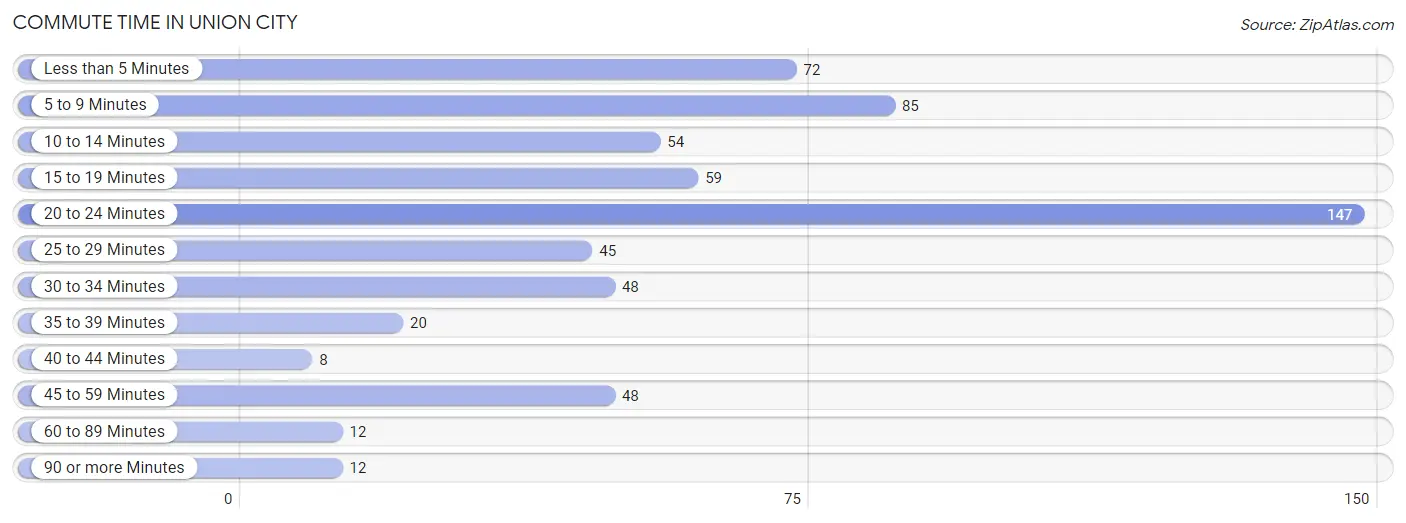
| Commute Time | # Commuters | % Commuters |
| Less than 5 Minutes | 72 | 11.8% |
| 5 to 9 Minutes | 85 | 13.9% |
| 10 to 14 Minutes | 54 | 8.8% |
| 15 to 19 Minutes | 59 | 9.7% |
| 20 to 24 Minutes | 147 | 24.1% |
| 25 to 29 Minutes | 45 | 7.4% |
| 30 to 34 Minutes | 48 | 7.9% |
| 35 to 39 Minutes | 20 | 3.3% |
| 40 to 44 Minutes | 8 | 1.3% |
| 45 to 59 Minutes | 48 | 7.9% |
| 60 to 89 Minutes | 12 | 2.0% |
| 90 or more Minutes | 12 | 2.0% |
Commute Time by Sex in Union City
The most common commute times in Union City are 20 to 24 minutes (86 commuters, 25.2%) for males and 20 to 24 minutes (61 commuters, 22.8%) for females.
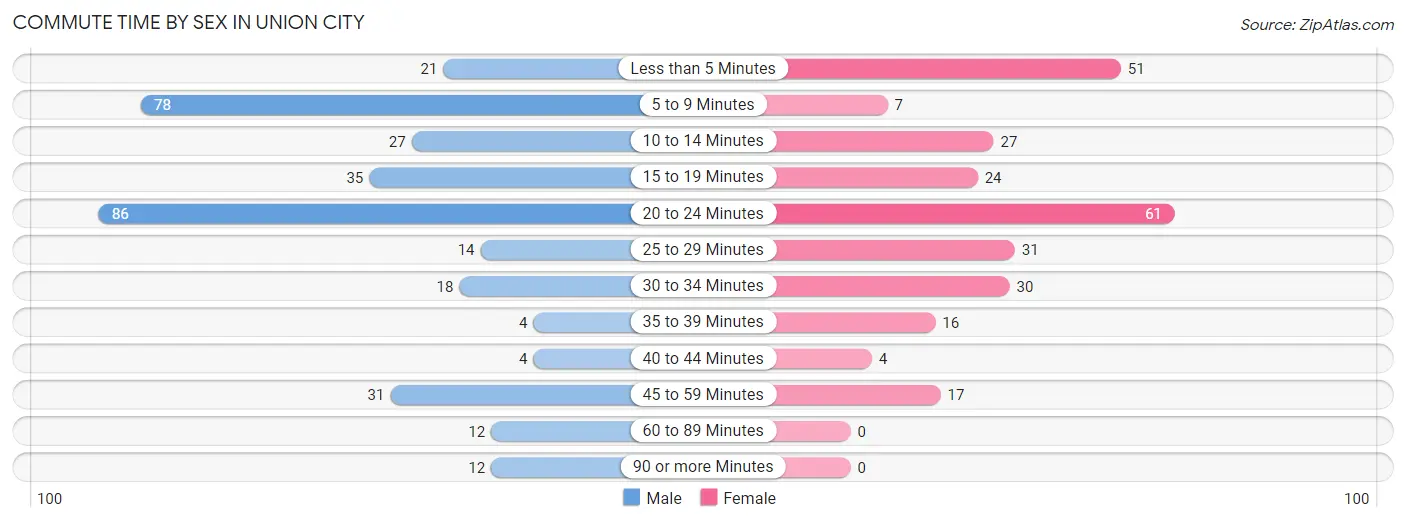
| Commute Time | Male | Female |
| Less than 5 Minutes | 21 (6.1%) | 51 (19.0%) |
| 5 to 9 Minutes | 78 (22.8%) | 7 (2.6%) |
| 10 to 14 Minutes | 27 (7.9%) | 27 (10.1%) |
| 15 to 19 Minutes | 35 (10.2%) | 24 (9.0%) |
| 20 to 24 Minutes | 86 (25.2%) | 61 (22.8%) |
| 25 to 29 Minutes | 14 (4.1%) | 31 (11.6%) |
| 30 to 34 Minutes | 18 (5.3%) | 30 (11.2%) |
| 35 to 39 Minutes | 4 (1.2%) | 16 (6.0%) |
| 40 to 44 Minutes | 4 (1.2%) | 4 (1.5%) |
| 45 to 59 Minutes | 31 (9.1%) | 17 (6.3%) |
| 60 to 89 Minutes | 12 (3.5%) | 0 (0.0%) |
| 90 or more Minutes | 12 (3.5%) | 0 (0.0%) |
Time of Departure to Work by Sex in Union City
The most frequent times of departure to work in Union City are 5:30 AM to 5:59 AM (61, 17.8%) for males and 12:00 PM to 3:59 PM (39, 14.5%) for females.
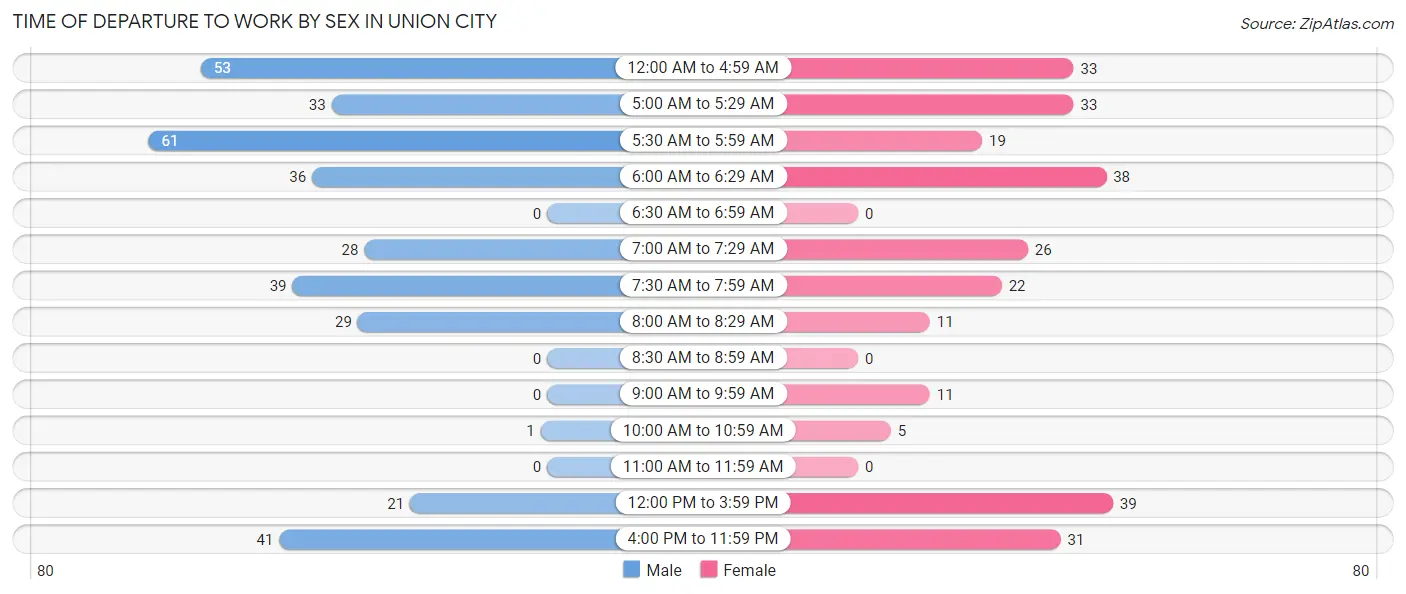
| Time of Departure | Male | Female |
| 12:00 AM to 4:59 AM | 53 (15.5%) | 33 (12.3%) |
| 5:00 AM to 5:29 AM | 33 (9.7%) | 33 (12.3%) |
| 5:30 AM to 5:59 AM | 61 (17.8%) | 19 (7.1%) |
| 6:00 AM to 6:29 AM | 36 (10.5%) | 38 (14.2%) |
| 6:30 AM to 6:59 AM | 0 (0.0%) | 0 (0.0%) |
| 7:00 AM to 7:29 AM | 28 (8.2%) | 26 (9.7%) |
| 7:30 AM to 7:59 AM | 39 (11.4%) | 22 (8.2%) |
| 8:00 AM to 8:29 AM | 29 (8.5%) | 11 (4.1%) |
| 8:30 AM to 8:59 AM | 0 (0.0%) | 0 (0.0%) |
| 9:00 AM to 9:59 AM | 0 (0.0%) | 11 (4.1%) |
| 10:00 AM to 10:59 AM | 1 (0.3%) | 5 (1.9%) |
| 11:00 AM to 11:59 AM | 0 (0.0%) | 0 (0.0%) |
| 12:00 PM to 3:59 PM | 21 (6.1%) | 39 (14.5%) |
| 4:00 PM to 11:59 PM | 41 (12.0%) | 31 (11.6%) |
| Total | 342 (100.0%) | 268 (100.0%) |
Housing Occupancy in Union City
Occupancy by Ownership in Union City
Of the total 615 dwellings in Union City, owner-occupied units account for 342 (55.6%), while renter-occupied units make up 273 (44.4%).
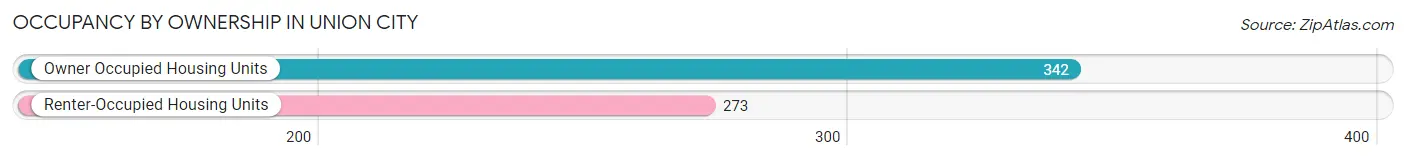
| Occupancy | # Housing Units | % Housing Units |
| Owner Occupied Housing Units | 342 | 55.6% |
| Renter-Occupied Housing Units | 273 | 44.4% |
| Total Occupied Housing Units | 615 | 100.0% |
Occupancy by Household Size in Union City
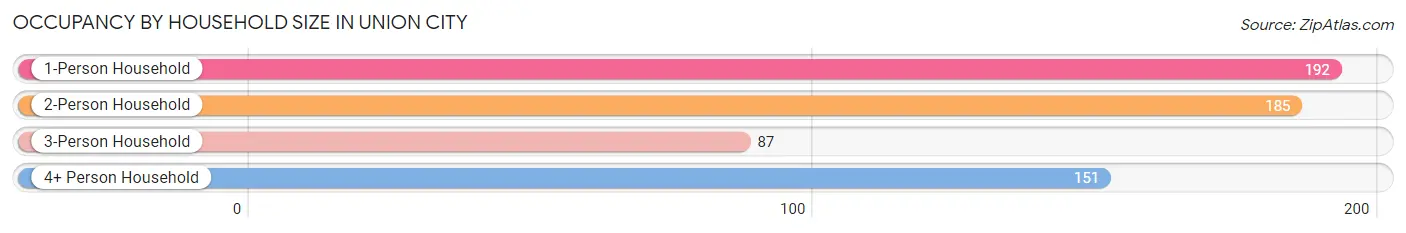
| Household Size | # Housing Units | % Housing Units |
| 1-Person Household | 192 | 31.2% |
| 2-Person Household | 185 | 30.1% |
| 3-Person Household | 87 | 14.1% |
| 4+ Person Household | 151 | 24.5% |
| Total Housing Units | 615 | 100.0% |
Occupancy by Ownership by Household Size in Union City
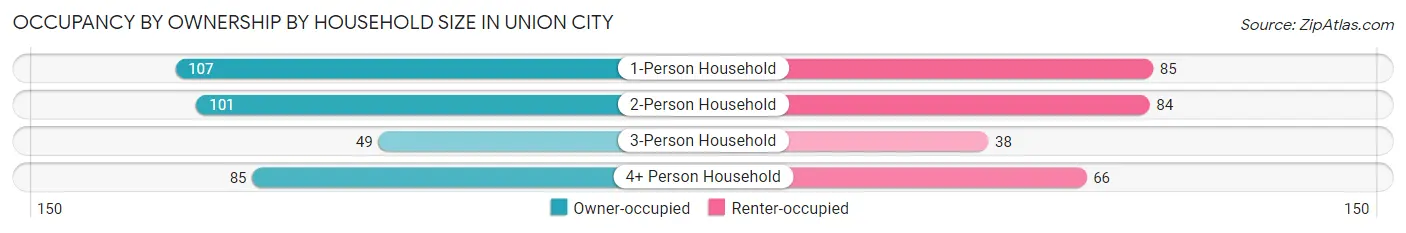
| Household Size | Owner-occupied | Renter-occupied |
| 1-Person Household | 107 (55.7%) | 85 (44.3%) |
| 2-Person Household | 101 (54.6%) | 84 (45.4%) |
| 3-Person Household | 49 (56.3%) | 38 (43.7%) |
| 4+ Person Household | 85 (56.3%) | 66 (43.7%) |
| Total Housing Units | 342 (55.6%) | 273 (44.4%) |
Occupancy by Educational Attainment in Union City
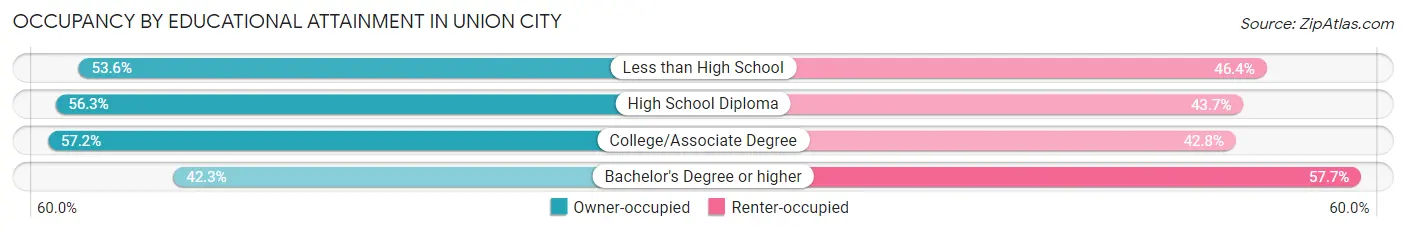
| Household Size | Owner-occupied | Renter-occupied |
| Less than High School | 45 (53.6%) | 39 (46.4%) |
| High School Diploma | 191 (56.3%) | 148 (43.7%) |
| College/Associate Degree | 95 (57.2%) | 71 (42.8%) |
| Bachelor's Degree or higher | 11 (42.3%) | 15 (57.7%) |
Occupancy by Age of Householder in Union City
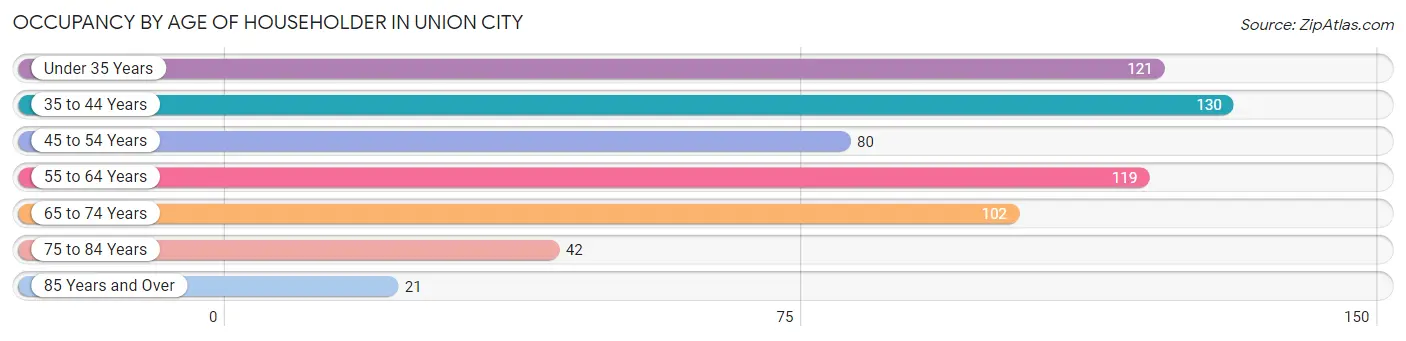
| Age Bracket | # Households | % Households |
| Under 35 Years | 121 | 19.7% |
| 35 to 44 Years | 130 | 21.1% |
| 45 to 54 Years | 80 | 13.0% |
| 55 to 64 Years | 119 | 19.4% |
| 65 to 74 Years | 102 | 16.6% |
| 75 to 84 Years | 42 | 6.8% |
| 85 Years and Over | 21 | 3.4% |
| Total | 615 | 100.0% |
Housing Finances in Union City
Median Income by Occupancy in Union City
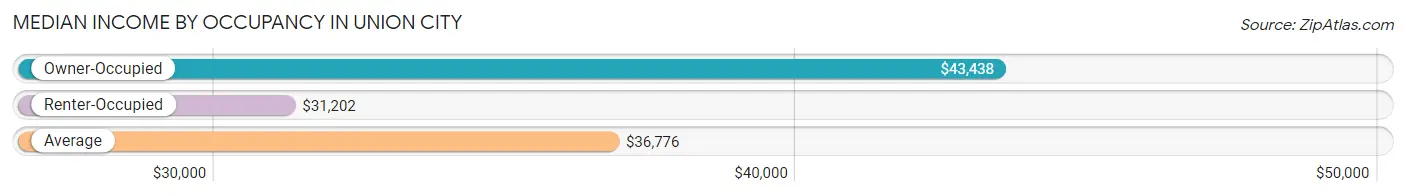
| Occupancy Type | # Households | Median Income |
| Owner-Occupied | 342 (55.6%) | $43,438 |
| Renter-Occupied | 273 (44.4%) | $31,202 |
| Average | 615 (100.0%) | $36,776 |
Occupancy by Householder Income Bracket in Union City
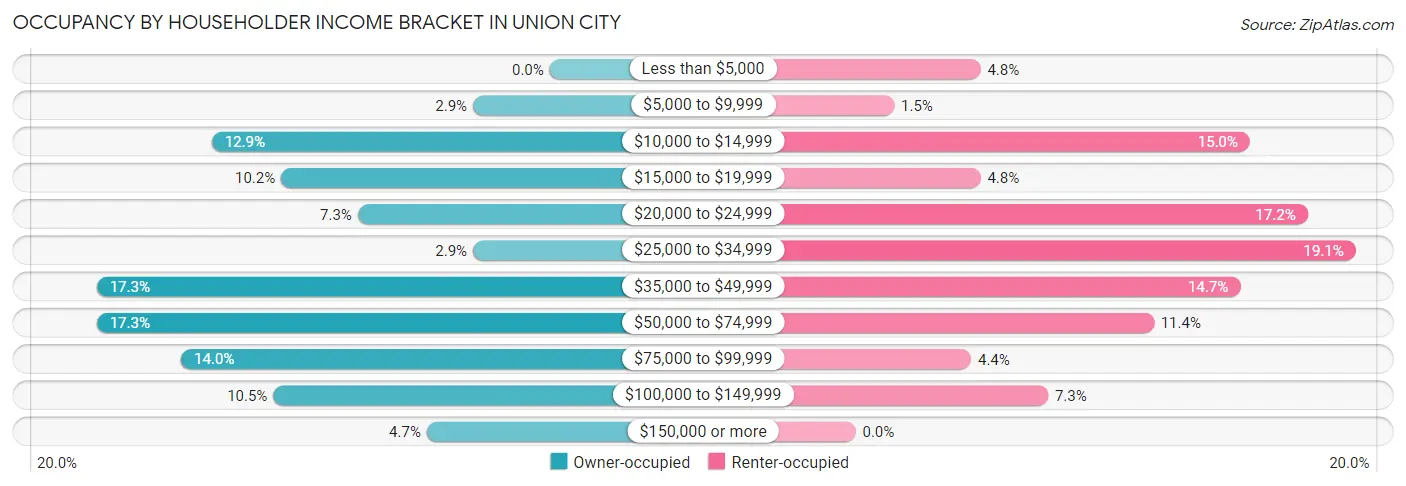
| Income Bracket | Owner-occupied | Renter-occupied |
| Less than $5,000 | 0 (0.0%) | 13 (4.8%) |
| $5,000 to $9,999 | 10 (2.9%) | 4 (1.5%) |
| $10,000 to $14,999 | 44 (12.9%) | 41 (15.0%) |
| $15,000 to $19,999 | 35 (10.2%) | 13 (4.8%) |
| $20,000 to $24,999 | 25 (7.3%) | 47 (17.2%) |
| $25,000 to $34,999 | 10 (2.9%) | 52 (19.1%) |
| $35,000 to $49,999 | 59 (17.2%) | 40 (14.6%) |
| $50,000 to $74,999 | 59 (17.2%) | 31 (11.4%) |
| $75,000 to $99,999 | 48 (14.0%) | 12 (4.4%) |
| $100,000 to $149,999 | 36 (10.5%) | 20 (7.3%) |
| $150,000 or more | 16 (4.7%) | 0 (0.0%) |
| Total | 342 (100.0%) | 273 (100.0%) |
Monthly Housing Cost Tiers in Union City
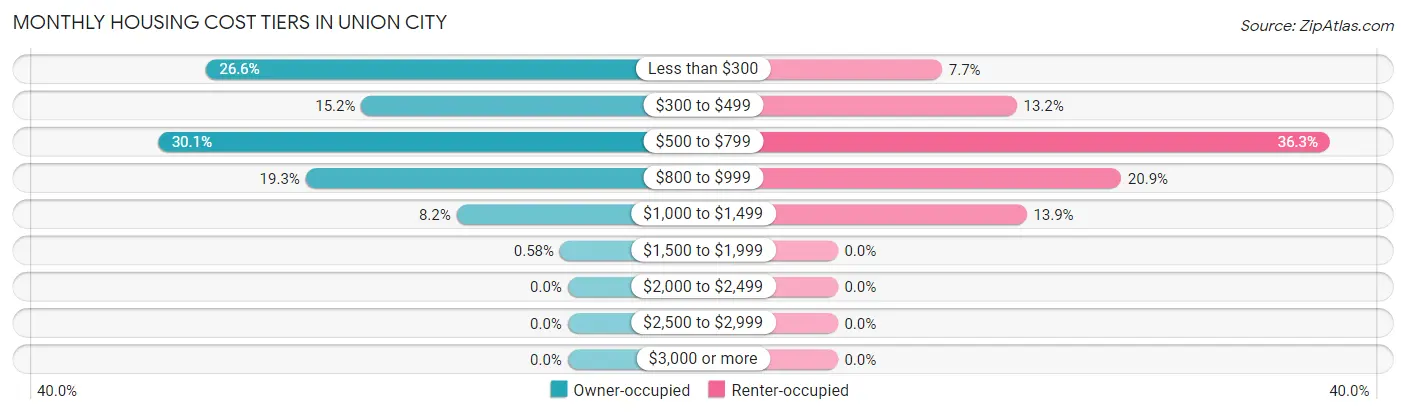
| Monthly Cost | Owner-occupied | Renter-occupied |
| Less than $300 | 91 (26.6%) | 21 (7.7%) |
| $300 to $499 | 52 (15.2%) | 36 (13.2%) |
| $500 to $799 | 103 (30.1%) | 99 (36.3%) |
| $800 to $999 | 66 (19.3%) | 57 (20.9%) |
| $1,000 to $1,499 | 28 (8.2%) | 38 (13.9%) |
| $1,500 to $1,999 | 2 (0.6%) | 0 (0.0%) |
| $2,000 to $2,499 | 0 (0.0%) | 0 (0.0%) |
| $2,500 to $2,999 | 0 (0.0%) | 0 (0.0%) |
| $3,000 or more | 0 (0.0%) | 0 (0.0%) |
| Total | 342 (100.0%) | 273 (100.0%) |
Physical Housing Characteristics in Union City
Housing Structures in Union City
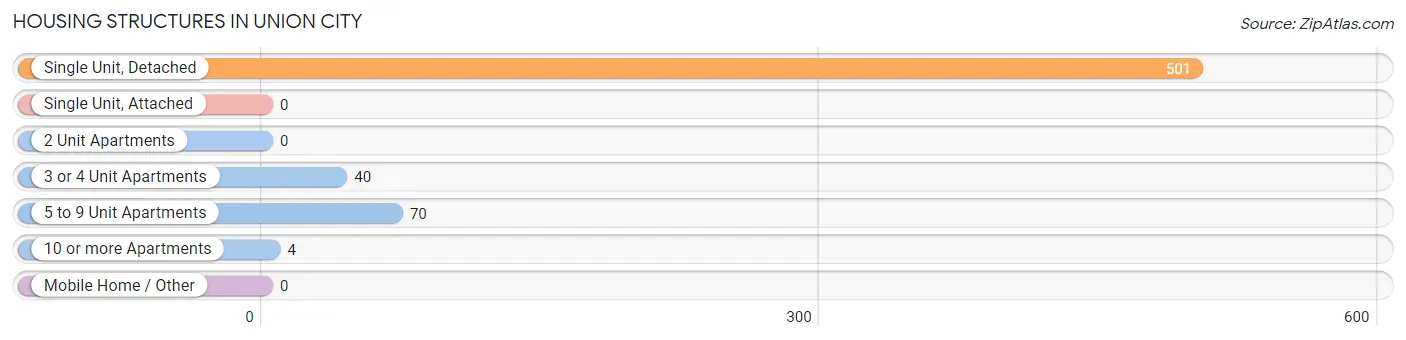
| Structure Type | # Housing Units | % Housing Units |
| Single Unit, Detached | 501 | 81.5% |
| Single Unit, Attached | 0 | 0.0% |
| 2 Unit Apartments | 0 | 0.0% |
| 3 or 4 Unit Apartments | 40 | 6.5% |
| 5 to 9 Unit Apartments | 70 | 11.4% |
| 10 or more Apartments | 4 | 0.6% |
| Mobile Home / Other | 0 | 0.0% |
| Total | 615 | 100.0% |
Housing Structures by Occupancy in Union City
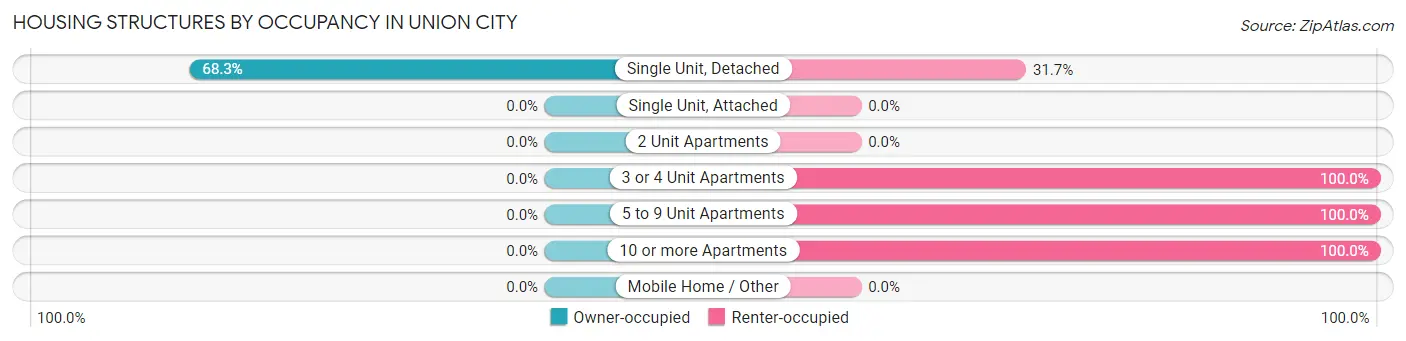
| Structure Type | Owner-occupied | Renter-occupied |
| Single Unit, Detached | 342 (68.3%) | 159 (31.7%) |
| Single Unit, Attached | 0 (0.0%) | 0 (0.0%) |
| 2 Unit Apartments | 0 (0.0%) | 0 (0.0%) |
| 3 or 4 Unit Apartments | 0 (0.0%) | 40 (100.0%) |
| 5 to 9 Unit Apartments | 0 (0.0%) | 70 (100.0%) |
| 10 or more Apartments | 0 (0.0%) | 4 (100.0%) |
| Mobile Home / Other | 0 (0.0%) | 0 (0.0%) |
| Total | 342 (55.6%) | 273 (44.4%) |
Housing Structures by Number of Rooms in Union City
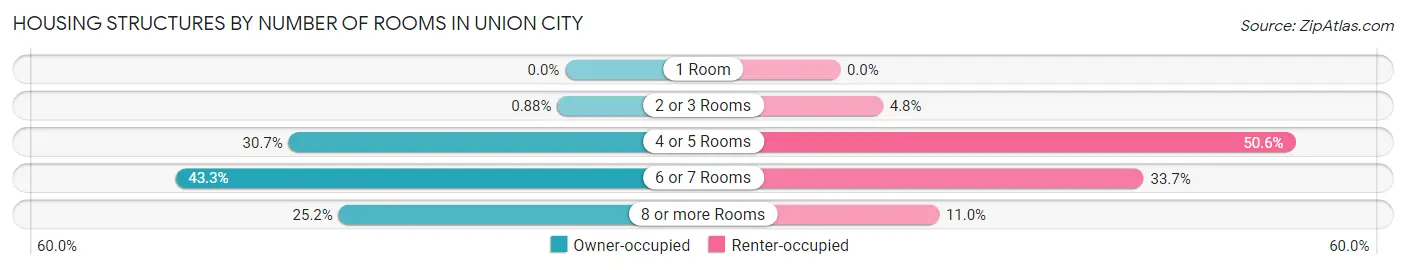
| Number of Rooms | Owner-occupied | Renter-occupied |
| 1 Room | 0 (0.0%) | 0 (0.0%) |
| 2 or 3 Rooms | 3 (0.9%) | 13 (4.8%) |
| 4 or 5 Rooms | 105 (30.7%) | 138 (50.5%) |
| 6 or 7 Rooms | 148 (43.3%) | 92 (33.7%) |
| 8 or more Rooms | 86 (25.2%) | 30 (11.0%) |
| Total | 342 (100.0%) | 273 (100.0%) |
Housing Structure by Heating Type in Union City
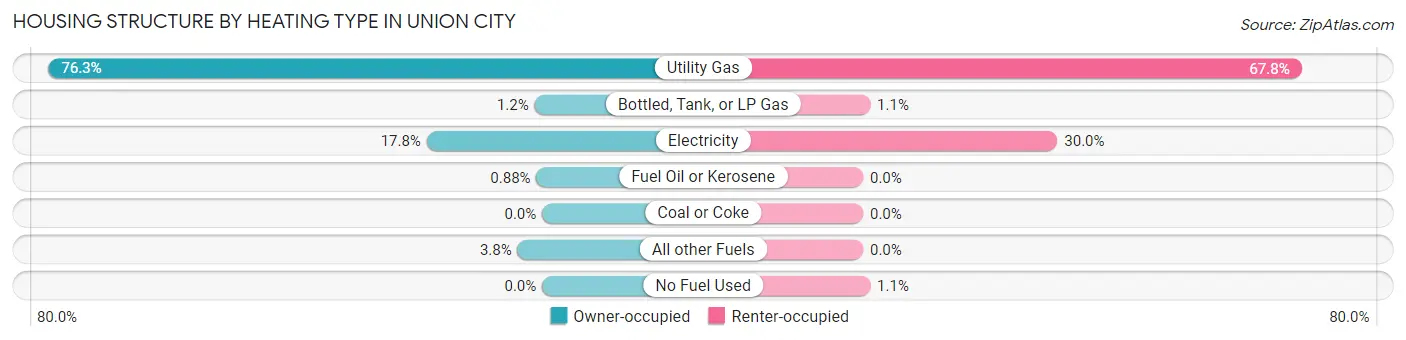
| Heating Type | Owner-occupied | Renter-occupied |
| Utility Gas | 261 (76.3%) | 185 (67.8%) |
| Bottled, Tank, or LP Gas | 4 (1.2%) | 3 (1.1%) |
| Electricity | 61 (17.8%) | 82 (30.0%) |
| Fuel Oil or Kerosene | 3 (0.9%) | 0 (0.0%) |
| Coal or Coke | 0 (0.0%) | 0 (0.0%) |
| All other Fuels | 13 (3.8%) | 0 (0.0%) |
| No Fuel Used | 0 (0.0%) | 3 (1.1%) |
| Total | 342 (100.0%) | 273 (100.0%) |
Household Vehicle Usage in Union City
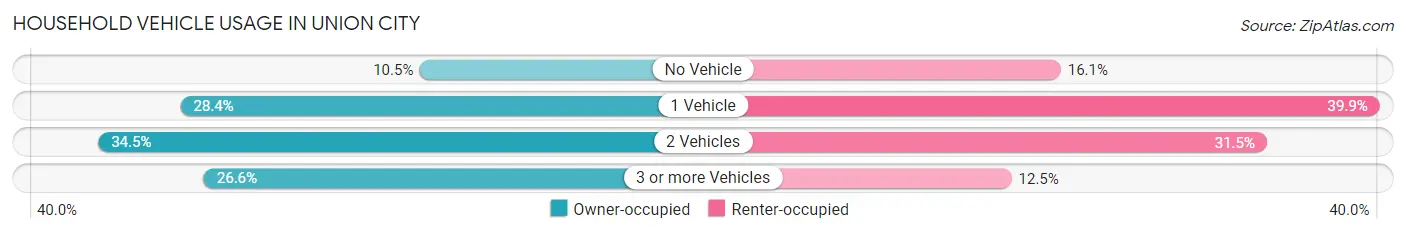
| Vehicles per Household | Owner-occupied | Renter-occupied |
| No Vehicle | 36 (10.5%) | 44 (16.1%) |
| 1 Vehicle | 97 (28.4%) | 109 (39.9%) |
| 2 Vehicles | 118 (34.5%) | 86 (31.5%) |
| 3 or more Vehicles | 91 (26.6%) | 34 (12.4%) |
| Total | 342 (100.0%) | 273 (100.0%) |
Real Estate & Mortgages in Union City
Real Estate and Mortgage Overview in Union City
| Characteristic | Without Mortgage | With Mortgage |
| Housing Units | 175 | 167 |
| Median Property Value | $44,900 | $72,000 |
| Median Household Income | $24,750 | $10 |
| Monthly Housing Costs | $294 | $0 |
| Real Estate Taxes | $524 | $12 |
Property Value by Mortgage Status in Union City
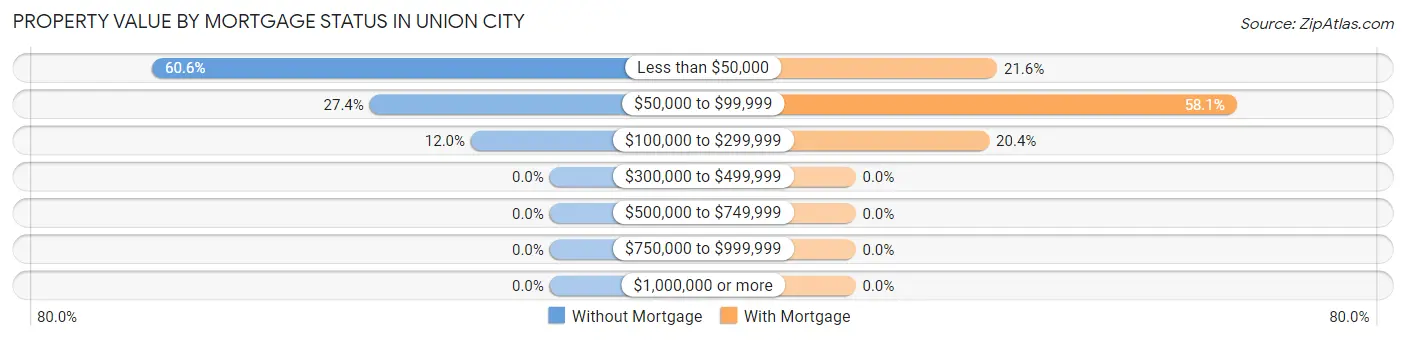
| Property Value | Without Mortgage | With Mortgage |
| Less than $50,000 | 106 (60.6%) | 36 (21.6%) |
| $50,000 to $99,999 | 48 (27.4%) | 97 (58.1%) |
| $100,000 to $299,999 | 21 (12.0%) | 34 (20.4%) |
| $300,000 to $499,999 | 0 (0.0%) | 0 (0.0%) |
| $500,000 to $749,999 | 0 (0.0%) | 0 (0.0%) |
| $750,000 to $999,999 | 0 (0.0%) | 0 (0.0%) |
| $1,000,000 or more | 0 (0.0%) | 0 (0.0%) |
| Total | 175 (100.0%) | 167 (100.0%) |
Household Income by Mortgage Status in Union City
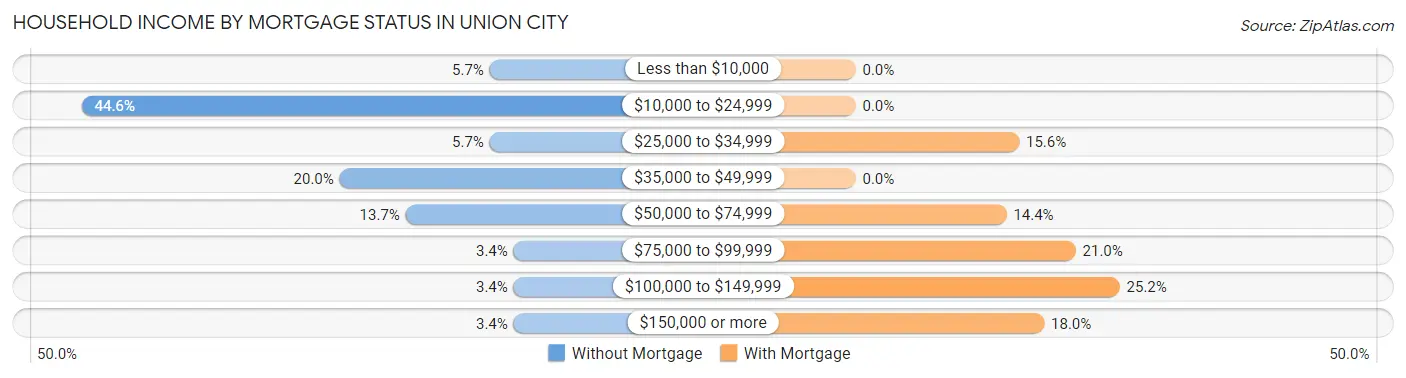
| Household Income | Without Mortgage | With Mortgage |
| Less than $10,000 | 10 (5.7%) | 0 (0.0%) |
| $10,000 to $24,999 | 78 (44.6%) | 0 (0.0%) |
| $25,000 to $34,999 | 10 (5.7%) | 26 (15.6%) |
| $35,000 to $49,999 | 35 (20.0%) | 0 (0.0%) |
| $50,000 to $74,999 | 24 (13.7%) | 24 (14.4%) |
| $75,000 to $99,999 | 6 (3.4%) | 35 (21.0%) |
| $100,000 to $149,999 | 6 (3.4%) | 42 (25.2%) |
| $150,000 or more | 6 (3.4%) | 30 (18.0%) |
| Total | 175 (100.0%) | 167 (100.0%) |
Property Value to Household Income Ratio in Union City
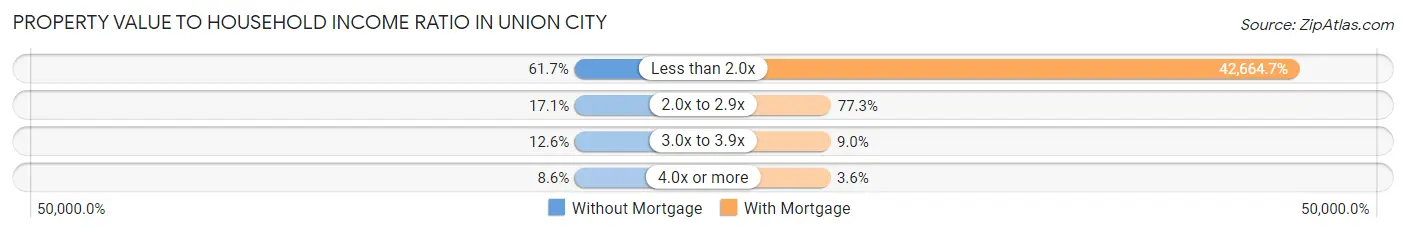
| Value-to-Income Ratio | Without Mortgage | With Mortgage |
| Less than 2.0x | 108 (61.7%) | 71,250 (42,664.7%) |
| 2.0x to 2.9x | 30 (17.1%) | 129 (77.2%) |
| 3.0x to 3.9x | 22 (12.6%) | 15 (9.0%) |
| 4.0x or more | 15 (8.6%) | 6 (3.6%) |
| Total | 175 (100.0%) | 167 (100.0%) |
Real Estate Taxes by Mortgage Status in Union City
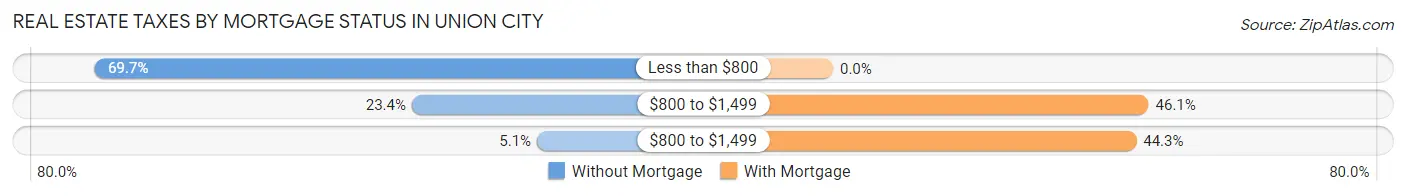
| Property Taxes | Without Mortgage | With Mortgage |
| Less than $800 | 122 (69.7%) | 0 (0.0%) |
| $800 to $1,499 | 41 (23.4%) | 77 (46.1%) |
| $800 to $1,499 | 9 (5.1%) | 74 (44.3%) |
| Total | 175 (100.0%) | 167 (100.0%) |
Health & Disability in Union City
Health Insurance Coverage by Age in Union City
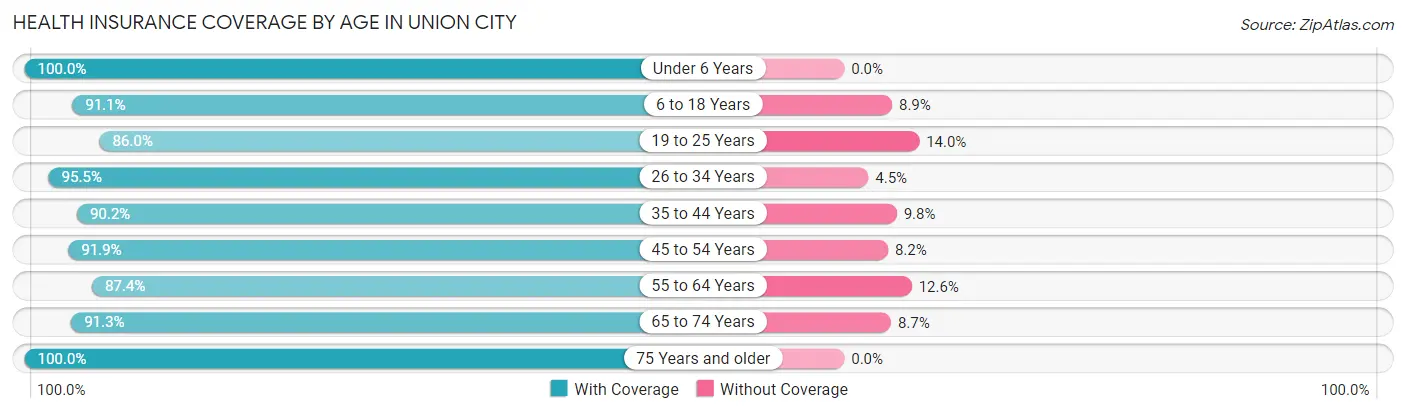
| Age Bracket | With Coverage | Without Coverage |
| Under 6 Years | 93 (100.0%) | 0 (0.0%) |
| 6 to 18 Years | 297 (91.1%) | 29 (8.9%) |
| 19 to 25 Years | 117 (86.0%) | 19 (14.0%) |
| 26 to 34 Years | 128 (95.5%) | 6 (4.5%) |
| 35 to 44 Years | 194 (90.2%) | 21 (9.8%) |
| 45 to 54 Years | 169 (91.8%) | 15 (8.2%) |
| 55 to 64 Years | 153 (87.4%) | 22 (12.6%) |
| 65 to 74 Years | 126 (91.3%) | 12 (8.7%) |
| 75 Years and older | 83 (100.0%) | 0 (0.0%) |
| Total | 1,360 (91.6%) | 124 (8.4%) |
Health Insurance Coverage by Citizenship Status in Union City
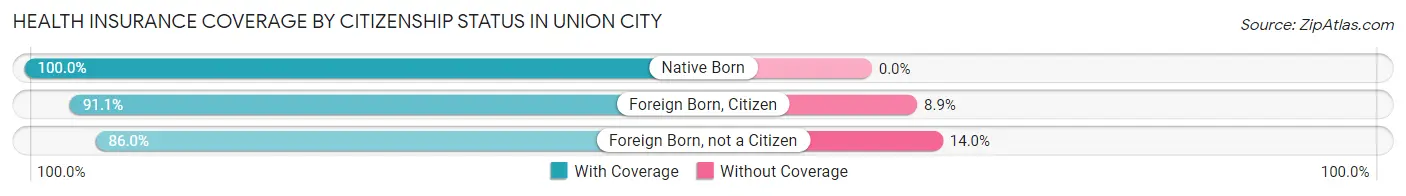
| Citizenship Status | With Coverage | Without Coverage |
| Native Born | 93 (100.0%) | 0 (0.0%) |
| Foreign Born, Citizen | 297 (91.1%) | 29 (8.9%) |
| Foreign Born, not a Citizen | 117 (86.0%) | 19 (14.0%) |
Health Insurance Coverage by Household Income in Union City
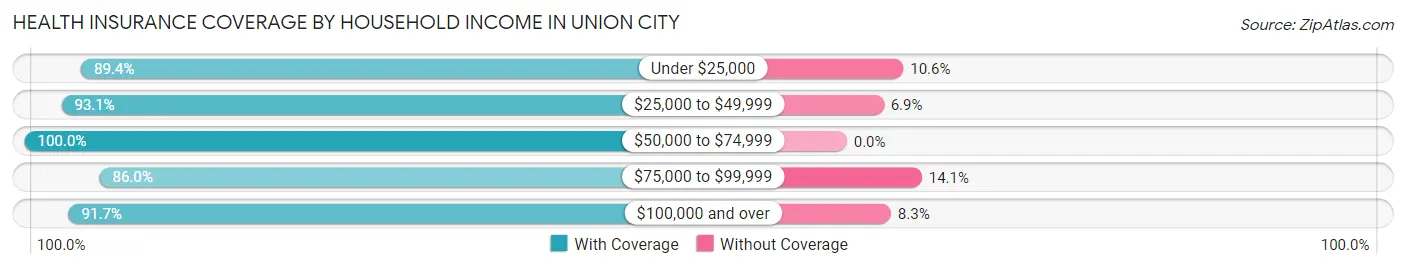
| Household Income | With Coverage | Without Coverage |
| Under $25,000 | 431 (89.4%) | 51 (10.6%) |
| $25,000 to $49,999 | 364 (93.1%) | 27 (6.9%) |
| $50,000 to $74,999 | 184 (100.0%) | 0 (0.0%) |
| $75,000 to $99,999 | 159 (86.0%) | 26 (14.1%) |
| $100,000 and over | 222 (91.7%) | 20 (8.3%) |
Public vs Private Health Insurance Coverage by Age in Union City
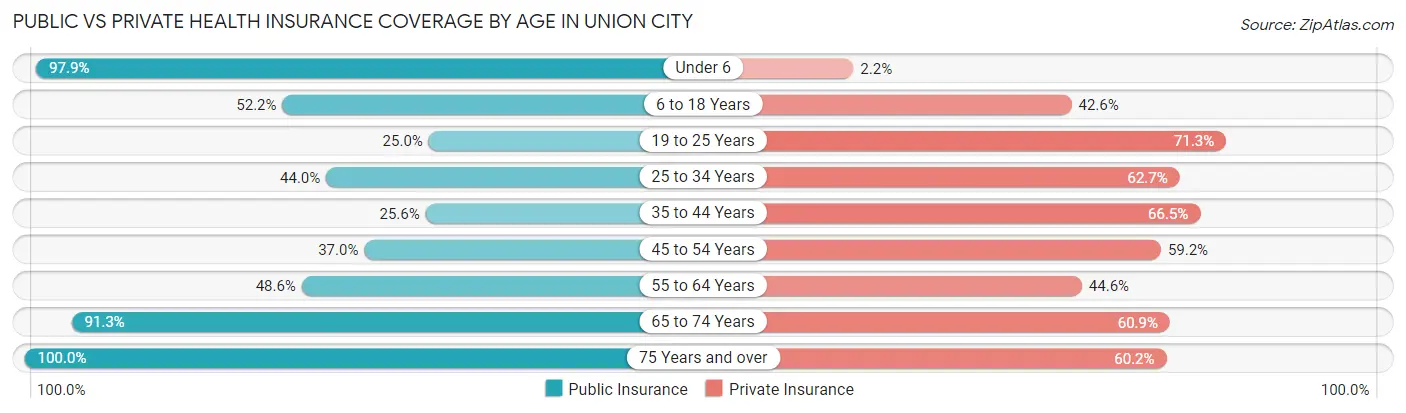
| Age Bracket | Public Insurance | Private Insurance |
| Under 6 | 91 (97.9%) | 2 (2.1%) |
| 6 to 18 Years | 170 (52.1%) | 139 (42.6%) |
| 19 to 25 Years | 34 (25.0%) | 97 (71.3%) |
| 25 to 34 Years | 59 (44.0%) | 84 (62.7%) |
| 35 to 44 Years | 55 (25.6%) | 143 (66.5%) |
| 45 to 54 Years | 68 (37.0%) | 109 (59.2%) |
| 55 to 64 Years | 85 (48.6%) | 78 (44.6%) |
| 65 to 74 Years | 126 (91.3%) | 84 (60.9%) |
| 75 Years and over | 83 (100.0%) | 50 (60.2%) |
| Total | 771 (51.9%) | 786 (53.0%) |
Disability Status by Sex by Age in Union City
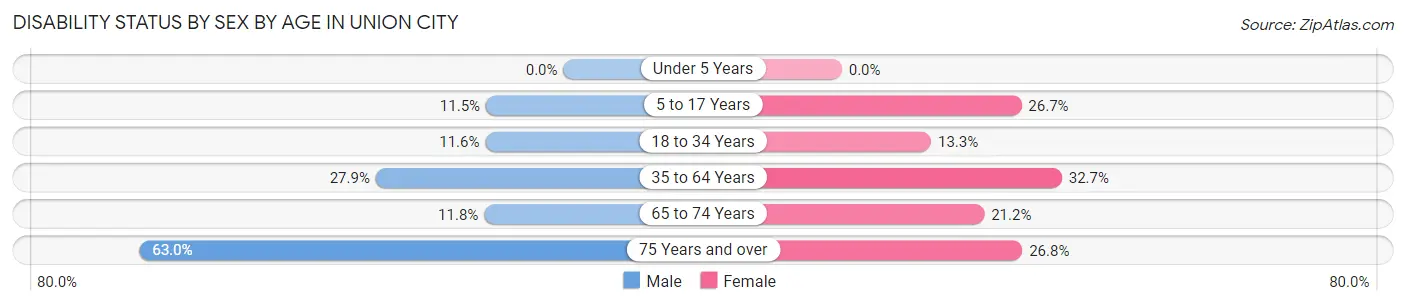
| Age Bracket | Male | Female |
| Under 5 Years | 0 (0.0%) | 0 (0.0%) |
| 5 to 17 Years | 23 (11.5%) | 36 (26.7%) |
| 18 to 34 Years | 16 (11.6%) | 22 (13.3%) |
| 35 to 64 Years | 90 (27.9%) | 82 (32.7%) |
| 65 to 74 Years | 4 (11.8%) | 22 (21.1%) |
| 75 Years and over | 17 (63.0%) | 15 (26.8%) |
Disability Class by Sex by Age in Union City
Disability Class: Hearing Difficulty
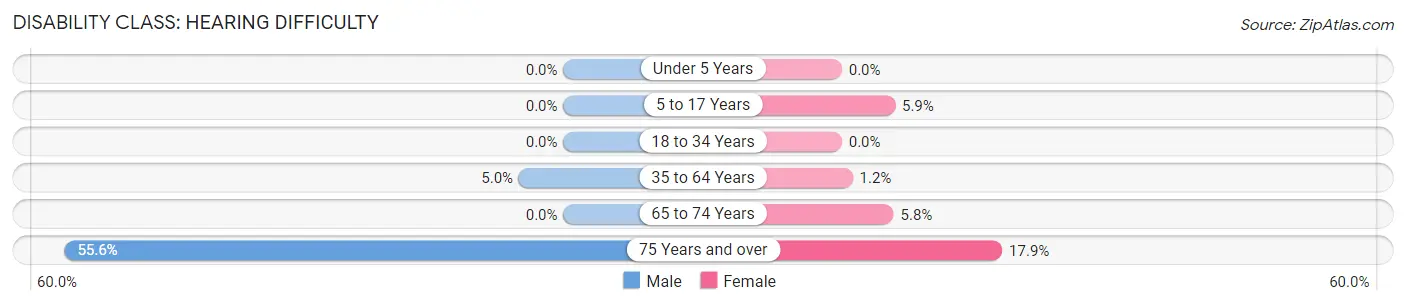
| Age Bracket | Male | Female |
| Under 5 Years | 0 (0.0%) | 0 (0.0%) |
| 5 to 17 Years | 0 (0.0%) | 8 (5.9%) |
| 18 to 34 Years | 0 (0.0%) | 0 (0.0%) |
| 35 to 64 Years | 16 (5.0%) | 3 (1.2%) |
| 65 to 74 Years | 0 (0.0%) | 6 (5.8%) |
| 75 Years and over | 15 (55.6%) | 10 (17.9%) |
Disability Class: Vision Difficulty
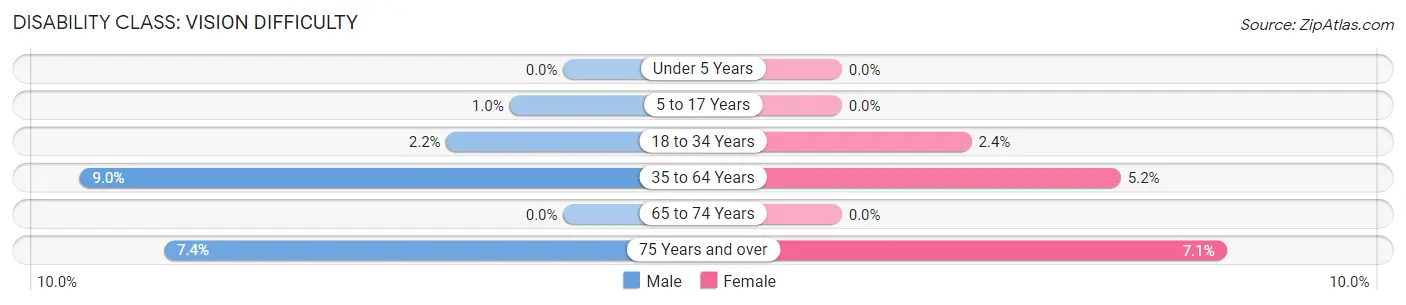
| Age Bracket | Male | Female |
| Under 5 Years | 0 (0.0%) | 0 (0.0%) |
| 5 to 17 Years | 2 (1.0%) | 0 (0.0%) |
| 18 to 34 Years | 3 (2.2%) | 4 (2.4%) |
| 35 to 64 Years | 29 (9.0%) | 13 (5.2%) |
| 65 to 74 Years | 0 (0.0%) | 0 (0.0%) |
| 75 Years and over | 2 (7.4%) | 4 (7.1%) |
Disability Class: Cognitive Difficulty
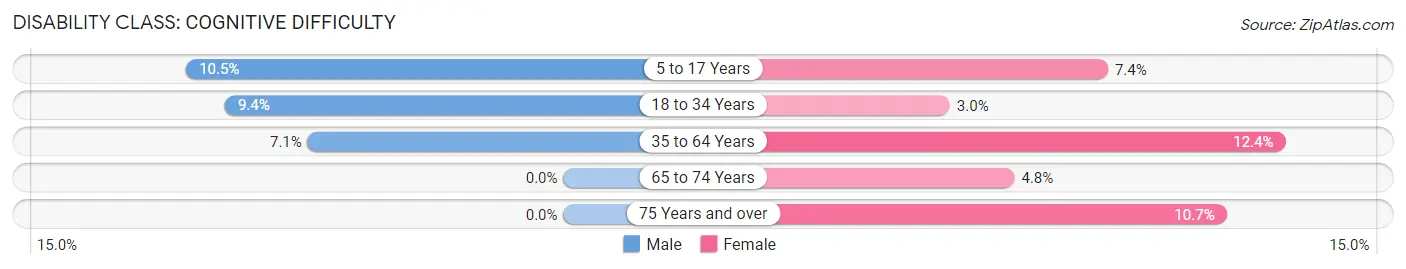
| Age Bracket | Male | Female |
| 5 to 17 Years | 21 (10.5%) | 10 (7.4%) |
| 18 to 34 Years | 13 (9.4%) | 5 (3.0%) |
| 35 to 64 Years | 23 (7.1%) | 31 (12.3%) |
| 65 to 74 Years | 0 (0.0%) | 5 (4.8%) |
| 75 Years and over | 0 (0.0%) | 6 (10.7%) |
Disability Class: Ambulatory Difficulty
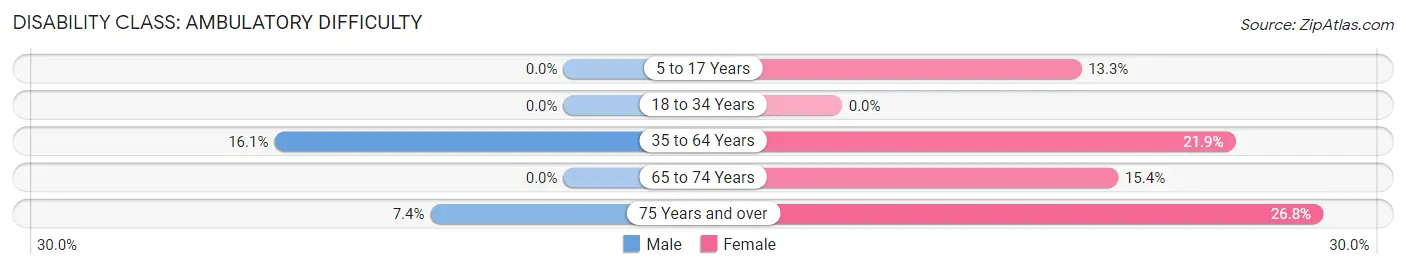
| Age Bracket | Male | Female |
| 5 to 17 Years | 0 (0.0%) | 18 (13.3%) |
| 18 to 34 Years | 0 (0.0%) | 0 (0.0%) |
| 35 to 64 Years | 52 (16.1%) | 55 (21.9%) |
| 65 to 74 Years | 0 (0.0%) | 16 (15.4%) |
| 75 Years and over | 2 (7.4%) | 15 (26.8%) |
Disability Class: Self-Care Difficulty
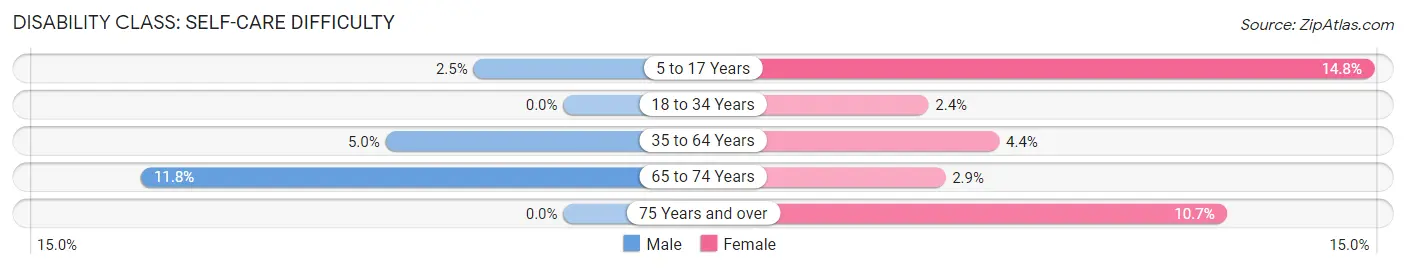
| Age Bracket | Male | Female |
| 5 to 17 Years | 5 (2.5%) | 20 (14.8%) |
| 18 to 34 Years | 0 (0.0%) | 4 (2.4%) |
| 35 to 64 Years | 16 (5.0%) | 11 (4.4%) |
| 65 to 74 Years | 4 (11.8%) | 3 (2.9%) |
| 75 Years and over | 0 (0.0%) | 6 (10.7%) |
Technology Access in Union City
Computing Device Access in Union City
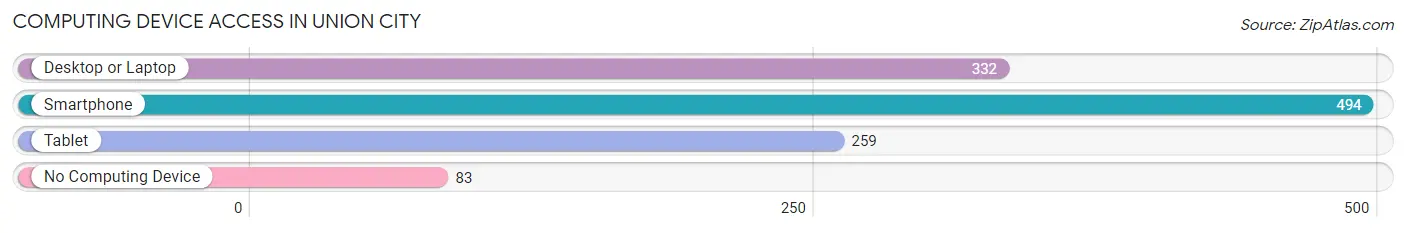
| Device Type | # Households | % Households |
| Desktop or Laptop | 332 | 54.0% |
| Smartphone | 494 | 80.3% |
| Tablet | 259 | 42.1% |
| No Computing Device | 83 | 13.5% |
| Total | 615 | 100.0% |
Internet Access in Union City
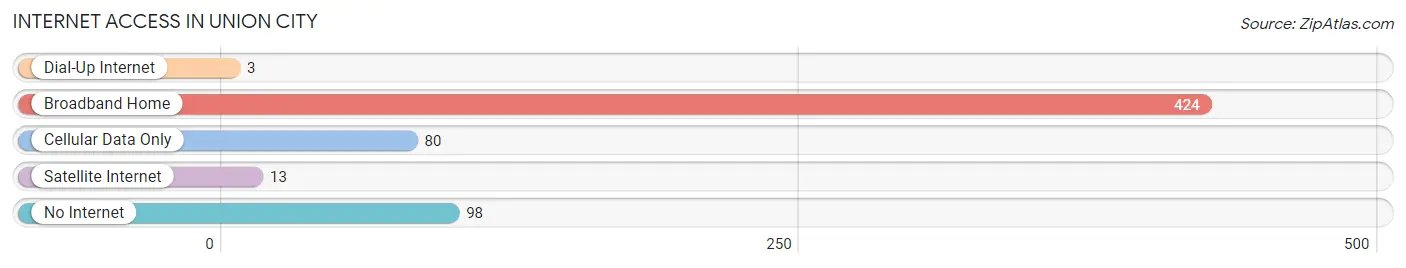
| Internet Type | # Households | % Households |
| Dial-Up Internet | 3 | 0.5% |
| Broadband Home | 424 | 68.9% |
| Cellular Data Only | 80 | 13.0% |
| Satellite Internet | 13 | 2.1% |
| No Internet | 98 | 15.9% |
| Total | 615 | 100.0% |
Union City Summary
History
Union City, Ohio is a small village located in the western part of Darke County, Ohio. It is situated along the Indiana border and is part of the Dayton Metropolitan Statistical Area. The village was founded in 1845 by a group of settlers from Uniontown, Pennsylvania. The settlers named the village after their hometown and it has been known as Union City ever since.
The village was originally a farming community and the main crops grown were wheat, corn, and oats. The village also had a few small businesses, such as a general store, a blacksmith shop, and a sawmill. In the late 1800s, the village began to grow and more businesses were established. The first bank was opened in 1891 and the first newspaper was published in 1895.
The village continued to grow and by the early 1900s, it had become a bustling small town. The population had grown to over 1,000 people and the village had a variety of businesses, including a hotel, a movie theater, and several stores. The village also had a train station, which allowed people to travel to nearby cities.
In the 1950s, the village began to decline as many of the businesses closed and the population began to decrease. The decline continued until the late 1990s when the village began to experience a resurgence. The village has seen an increase in population and businesses, and it is now a thriving small town.
Geography
Union City is located in the western part of Darke County, Ohio. It is situated along the Indiana border and is part of the Dayton Metropolitan Statistical Area. The village is located on the banks of the Mississinewa River and is surrounded by rolling hills and farmland. The village is located approximately 30 miles from Dayton and 60 miles from Indianapolis.
The village has a total area of 1.2 square miles, all of which is land. The village has a humid continental climate, with hot summers and cold winters. The average temperature in the summer is around 75 degrees Fahrenheit and the average temperature in the winter is around 30 degrees Fahrenheit.
Economy
Union City has a diverse economy that is largely based on agriculture and manufacturing. The village is home to several small businesses, including a grocery store, a hardware store, and a few restaurants. The village also has a few larger employers, such as a manufacturing plant and a trucking company.
The village is also home to a few tourist attractions, such as the Union City Historical Museum and the Union City Antique Mall. The village also has a few parks and recreational areas, including a golf course and a swimming pool.
Demographics
As of the 2010 census, the village had a population of 1,845 people. The population is largely white (94.3%) and the median age is 40.7 years. The median household income is $41,944 and the median home value is $90,000. The village has a high school graduation rate of 87.3%.
Conclusion
Union City, Ohio is a small village located in the western part of Darke County, Ohio. It is situated along the Indiana border and is part of the Dayton Metropolitan Statistical Area. The village was founded in 1845 by a group of settlers from Uniontown, Pennsylvania and has since grown into a thriving small town. The village has a diverse economy that is largely based on agriculture and manufacturing, and it is home to several small businesses, tourist attractions, and recreational areas. The population is largely white and the median age is 40.7 years. The median household income is $41,944 and the median home value is $90,000. Union City is a great place to live and work and is a great example of a small town that has been able to thrive in the modern world.
Common Questions
What is Per Capita Income in Union City?
Per Capita income in Union City is $20,125.
What is the Median Family Income in Union City?
Median Family Income in Union City is $40,278.
What is the Median Household income in Union City?
Median Household Income in Union City is $36,776.
What is Income or Wage Gap in Union City?
Income or Wage Gap in Union City is 21.0%.
Women in Union City earn 79.0 cents for every dollar earned by a man.
What is Family Income Deficit in Union City?
Family Income Deficit in Union City is $10,737.
Families that are below poverty line in Union City earn $10,737 less on average than the poverty threshold level.
What is Inequality or Gini Index in Union City?
Inequality or Gini Index in Union City is 0.43.
What is the Total Population of Union City?
Total Population of Union City is 1,528.
What is the Total Male Population of Union City?
Total Male Population of Union City is 772.
What is the Total Female Population of Union City?
Total Female Population of Union City is 756.
What is the Ratio of Males per 100 Females in Union City?
There are 102.12 Males per 100 Females in Union City.
What is the Ratio of Females per 100 Males in Union City?
There are 97.93 Females per 100 Males in Union City.
What is the Median Population Age in Union City?
Median Population Age in Union City is 40.0 Years.
What is the Average Family Size in Union City
Average Family Size in Union City is 3.1 People.
What is the Average Household Size in Union City
Average Household Size in Union City is 2.4 People.
How Large is the Labor Force in Union City?
There are 664 People in the Labor Forcein in Union City.
What is the Percentage of People in the Labor Force in Union City?
56.6% of People are in the Labor Force in Union City.
What is the Unemployment Rate in Union City?
Unemployment Rate in Union City is 7.7%.