Gratis, OH Map & Demographics
Gratis Map
Gratis Overview
$27,145
PER CAPITA INCOME
$75,000
AVG FAMILY INCOME
$72,647
AVG HOUSEHOLD INCOME
38.2%
WAGE / INCOME GAP [ % ]
61.8¢/ $1
WAGE / INCOME GAP [ $ ]
0.28
INEQUALITY / GINI INDEX
703
TOTAL POPULATION
385
MALE POPULATION
318
FEMALE POPULATION
121.07
MALES / 100 FEMALES
82.60
FEMALES / 100 MALES
34.3
MEDIAN AGE
2.8
AVG FAMILY SIZE
2.4
AVG HOUSEHOLD SIZE
330
LABOR FORCE [ PEOPLE ]
59.2%
PERCENT IN LABOR FORCE
Gratis Zip Codes
Income in Gratis
Income Overview in Gratis
Per Capita Income in Gratis is $27,145, while median incomes of families and households are $75,000 and $72,647 respectively.
| Characteristic | Number | Measure |
| Per Capita Income | 703 | $27,145 |
| Median Family Income | 214 | $75,000 |
| Mean Family Income | 214 | $76,451 |
| Median Household Income | 288 | $72,647 |
| Mean Household Income | 288 | $67,837 |
| Income Deficit | 214 | $0 |
| Wage / Income Gap (%) | 703 | 38.18% |
| Wage / Income Gap ($) | 703 | 61.82¢ per $1 |
| Gini / Inequality Index | 703 | 0.28 |
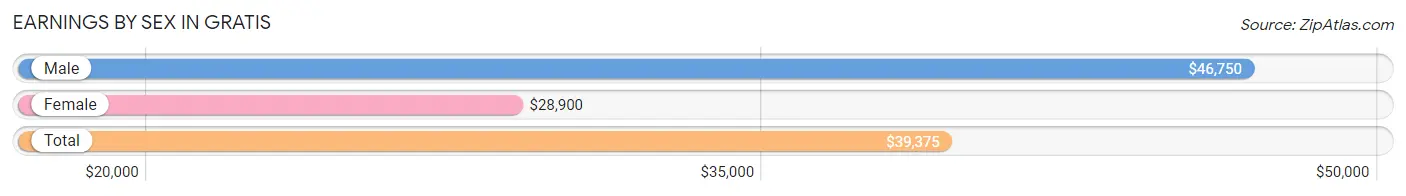
Earnings by Sex in Gratis
Average Earnings in Gratis are $39,375, $46,750 for men and $28,900 for women, a difference of 38.2%.
| Sex | Number | Average Earnings |
| Male | 207 (60.0%) | $46,750 |
| Female | 138 (40.0%) | $28,900 |
| Total | 345 (100.0%) | $39,375 |
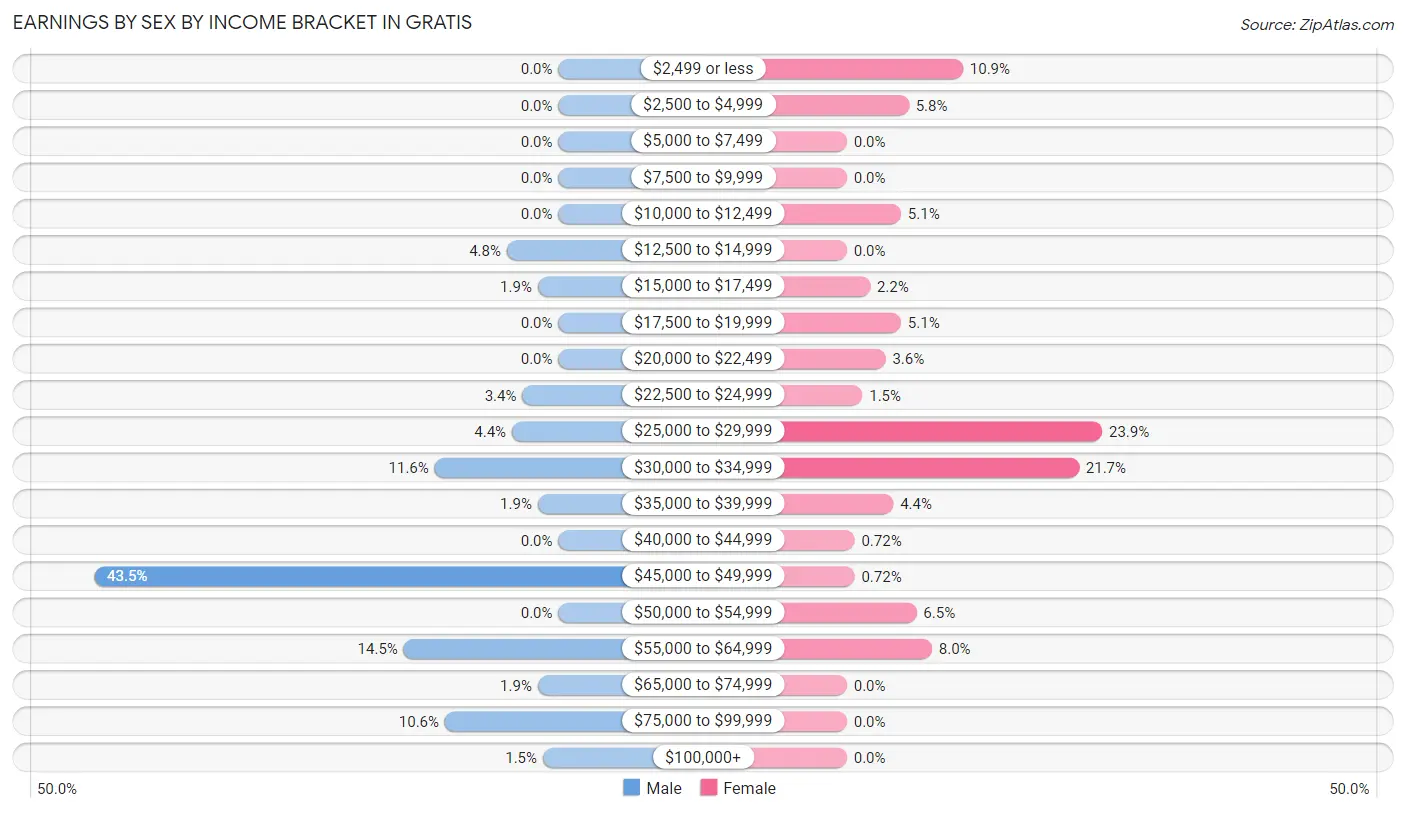
Earnings by Sex by Income Bracket in Gratis
The most common earnings brackets in Gratis are $45,000 to $49,999 for men (90 | 43.5%) and $25,000 to $29,999 for women (33 | 23.9%).
| Income | Male | Female |
| $2,499 or less | 0 (0.0%) | 15 (10.9%) |
| $2,500 to $4,999 | 0 (0.0%) | 8 (5.8%) |
| $5,000 to $7,499 | 0 (0.0%) | 0 (0.0%) |
| $7,500 to $9,999 | 0 (0.0%) | 0 (0.0%) |
| $10,000 to $12,499 | 0 (0.0%) | 7 (5.1%) |
| $12,500 to $14,999 | 10 (4.8%) | 0 (0.0%) |
| $15,000 to $17,499 | 4 (1.9%) | 3 (2.2%) |
| $17,500 to $19,999 | 0 (0.0%) | 7 (5.1%) |
| $20,000 to $22,499 | 0 (0.0%) | 5 (3.6%) |
| $22,500 to $24,999 | 7 (3.4%) | 2 (1.5%) |
| $25,000 to $29,999 | 9 (4.3%) | 33 (23.9%) |
| $30,000 to $34,999 | 24 (11.6%) | 30 (21.7%) |
| $35,000 to $39,999 | 4 (1.9%) | 6 (4.3%) |
| $40,000 to $44,999 | 0 (0.0%) | 1 (0.7%) |
| $45,000 to $49,999 | 90 (43.5%) | 1 (0.7%) |
| $50,000 to $54,999 | 0 (0.0%) | 9 (6.5%) |
| $55,000 to $64,999 | 30 (14.5%) | 11 (8.0%) |
| $65,000 to $74,999 | 4 (1.9%) | 0 (0.0%) |
| $75,000 to $99,999 | 22 (10.6%) | 0 (0.0%) |
| $100,000+ | 3 (1.5%) | 0 (0.0%) |
| Total | 207 (100.0%) | 138 (100.0%) |
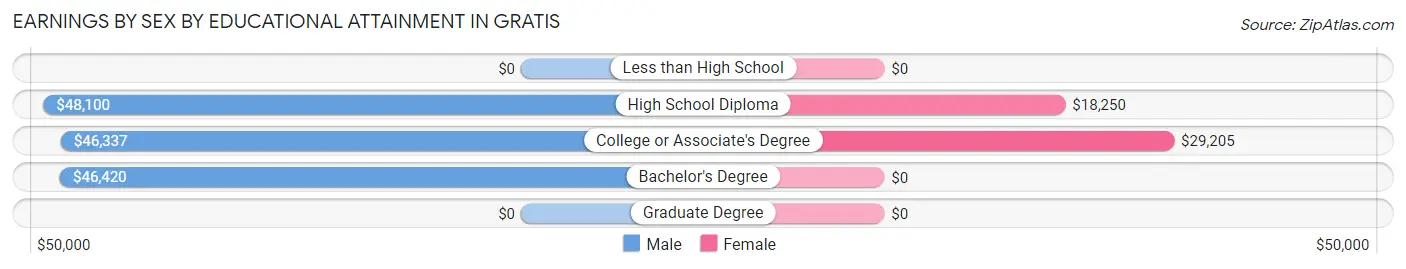
Earnings by Sex by Educational Attainment in Gratis
Average earnings in Gratis are $46,635 for men and $29,300 for women, a difference of 37.2%. Men with an educational attainment of high school diploma enjoy the highest average annual earnings of $48,100, while those with college or associate's degree education earn the least with $46,337. Women with an educational attainment of college or associate's degree earn the most with the average annual earnings of $29,205, while those with high school diploma education have the smallest earnings of $18,250.
| Educational Attainment | Male Income | Female Income |
| Less than High School | - | - |
| High School Diploma | $48,100 | $18,250 |
| College or Associate's Degree | $46,337 | $29,205 |
| Bachelor's Degree | $46,420 | $0 |
| Graduate Degree | - | - |
| Total | $46,635 | $29,300 |
Family Income in Gratis
Family Income Brackets in Gratis
According to the Gratis family income data, there are 70 families falling into the $75,000 to $99,999 income range, which is the most common income bracket and makes up 32.7% of all families.
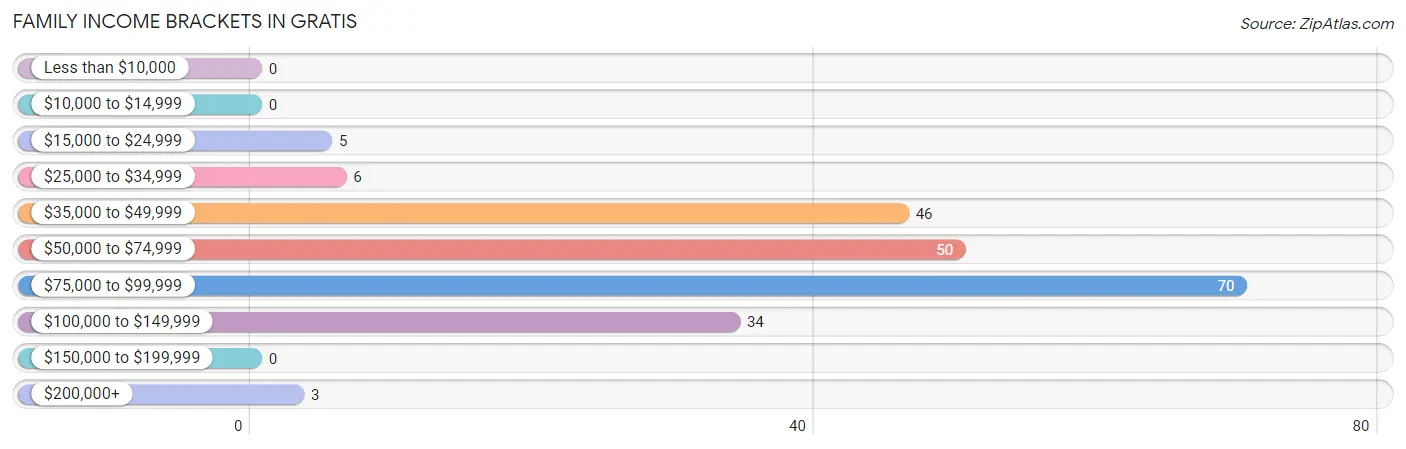
| Income Bracket | # Families | % Families |
| Less than $10,000 | 0 | 0.0% |
| $10,000 to $14,999 | 0 | 0.0% |
| $15,000 to $24,999 | 5 | 2.3% |
| $25,000 to $34,999 | 6 | 2.8% |
| $35,000 to $49,999 | 46 | 21.5% |
| $50,000 to $74,999 | 50 | 23.4% |
| $75,000 to $99,999 | 70 | 32.7% |
| $100,000 to $149,999 | 34 | 15.9% |
| $150,000 to $199,999 | 0 | 0.0% |
| $200,000+ | 3 | 1.4% |
Family Income by Famaliy Size in Gratis
3-person families (47 | 22.0%) account for the highest median family income in Gratis with $79,323 per family, while 2-person families (95 | 44.4%) have the highest median income of $30,438 per family member.
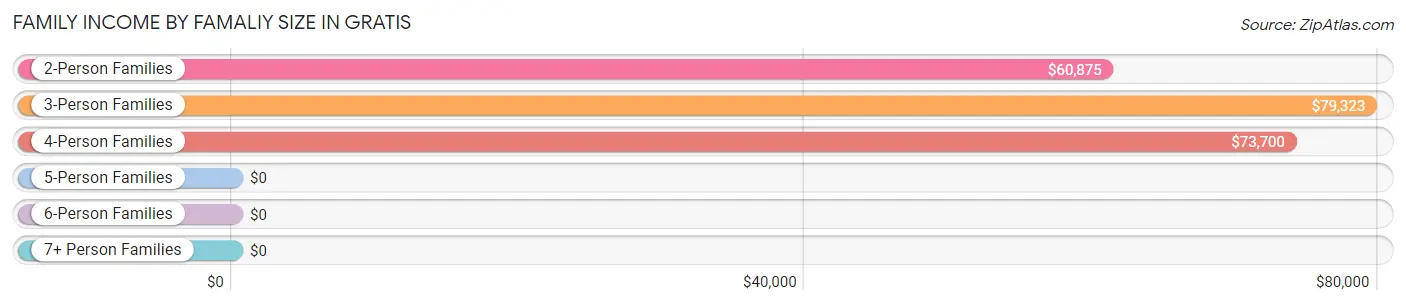
| Income Bracket | # Families | Median Income |
| 2-Person Families | 95 (44.4%) | $60,875 |
| 3-Person Families | 47 (22.0%) | $79,323 |
| 4-Person Families | 66 (30.8%) | $73,700 |
| 5-Person Families | 3 (1.4%) | $0 |
| 6-Person Families | 3 (1.4%) | $0 |
| 7+ Person Families | 0 (0.0%) | $0 |
| Total | 214 (100.0%) | $75,000 |
Family Income by Number of Earners in Gratis
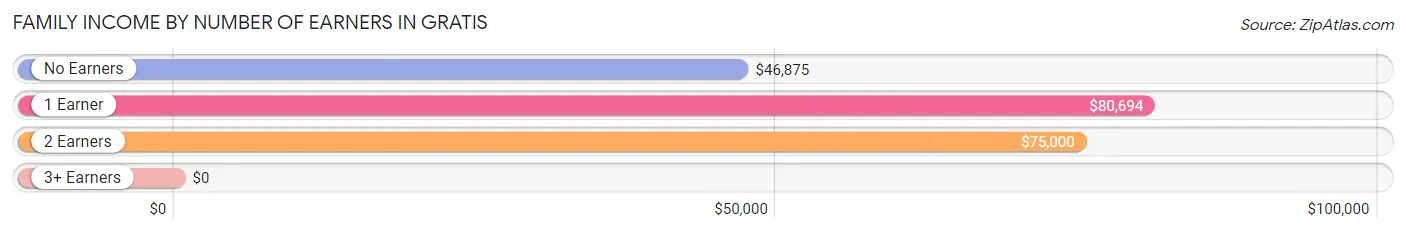
| Number of Earners | # Families | Median Income |
| No Earners | 22 (10.3%) | $46,875 |
| 1 Earner | 90 (42.1%) | $80,694 |
| 2 Earners | 102 (47.7%) | $75,000 |
| 3+ Earners | 0 (0.0%) | $0 |
| Total | 214 (100.0%) | $75,000 |
Household Income in Gratis
Household Income Brackets in Gratis
With 73 households falling in the category, the $75,000 to $99,999 income range is the most frequent in Gratis, accounting for 25.4% of all households.
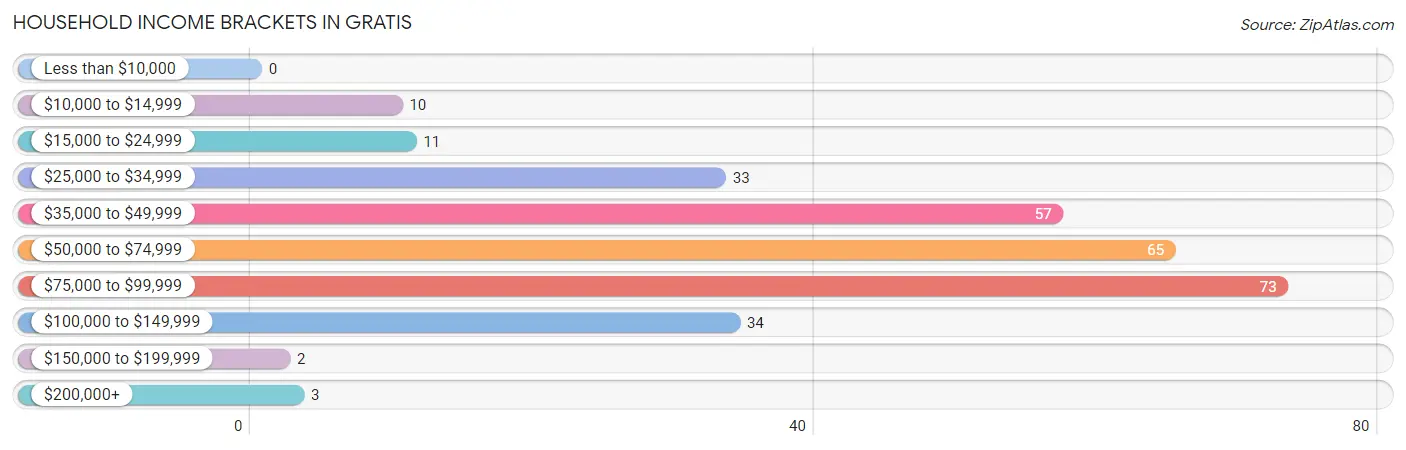
| Income Bracket | # Households | % Households |
| Less than $10,000 | 0 | 0.0% |
| $10,000 to $14,999 | 10 | 3.5% |
| $15,000 to $24,999 | 11 | 3.8% |
| $25,000 to $34,999 | 33 | 11.5% |
| $35,000 to $49,999 | 57 | 19.8% |
| $50,000 to $74,999 | 65 | 22.6% |
| $75,000 to $99,999 | 73 | 25.3% |
| $100,000 to $149,999 | 34 | 11.8% |
| $150,000 to $199,999 | 2 | 0.7% |
| $200,000+ | 3 | 1.0% |
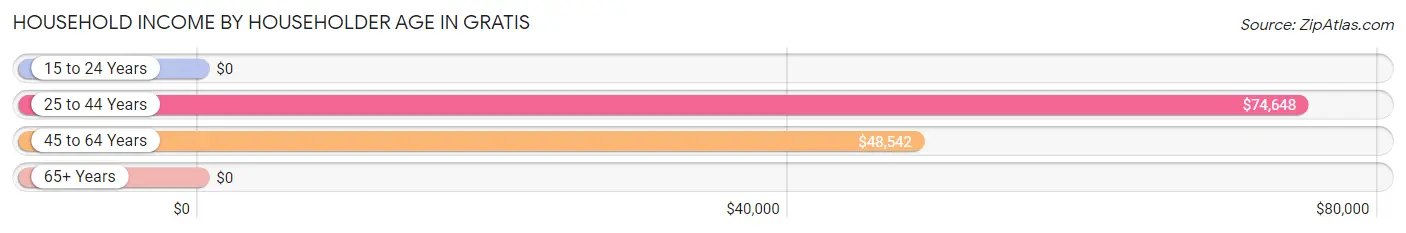
Household Income by Householder Age in Gratis
The median household income in Gratis is $72,647, with the highest median household income of $74,648 found in the 25 to 44 years age bracket for the primary householder. A total of 131 households (45.5%) fall into this category. Meanwhile, the 15 to 24 years age bracket for the primary householder has the lowest median household income of $0, with 8 households (2.8%) in this group.
| Income Bracket | # Households | Median Income |
| 15 to 24 Years | 8 (2.8%) | $0 |
| 25 to 44 Years | 131 (45.5%) | $74,648 |
| 45 to 64 Years | 51 (17.7%) | $48,542 |
| 65+ Years | 98 (34.0%) | $0 |
| Total | 288 (100.0%) | $72,647 |
Poverty in Gratis
Income Below Poverty by Sex and Age in Gratis
With 8.8% poverty level for males and 2.2% for females among the residents of Gratis, 65 to 74 year old males and 35 to 44 year old females are the most vulnerable to poverty, with 10 males (38.5%) and 7 females (35.0%) in their respective age groups living below the poverty level.
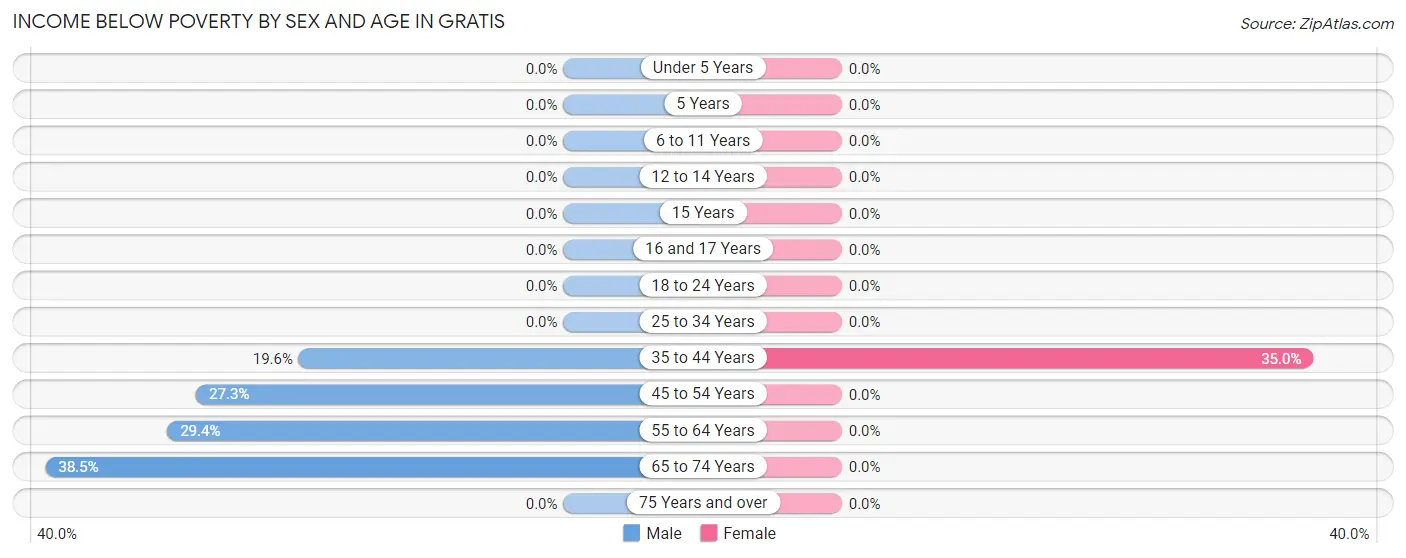
| Age Bracket | Male | Female |
| Under 5 Years | 0 (0.0%) | 0 (0.0%) |
| 5 Years | 0 (0.0%) | 0 (0.0%) |
| 6 to 11 Years | 0 (0.0%) | 0 (0.0%) |
| 12 to 14 Years | 0 (0.0%) | 0 (0.0%) |
| 15 Years | 0 (0.0%) | 0 (0.0%) |
| 16 and 17 Years | 0 (0.0%) | 0 (0.0%) |
| 18 to 24 Years | 0 (0.0%) | 0 (0.0%) |
| 25 to 34 Years | 0 (0.0%) | 0 (0.0%) |
| 35 to 44 Years | 11 (19.6%) | 7 (35.0%) |
| 45 to 54 Years | 3 (27.3%) | 0 (0.0%) |
| 55 to 64 Years | 10 (29.4%) | 0 (0.0%) |
| 65 to 74 Years | 10 (38.5%) | 0 (0.0%) |
| 75 Years and over | 0 (0.0%) | 0 (0.0%) |
| Total | 34 (8.8%) | 7 (2.2%) |
Income Above Poverty by Sex and Age in Gratis
According to the poverty statistics in Gratis, males aged under 5 years and females aged under 5 years are the age groups that are most secure financially, with 100.0% of males and 100.0% of females in these age groups living above the poverty line.
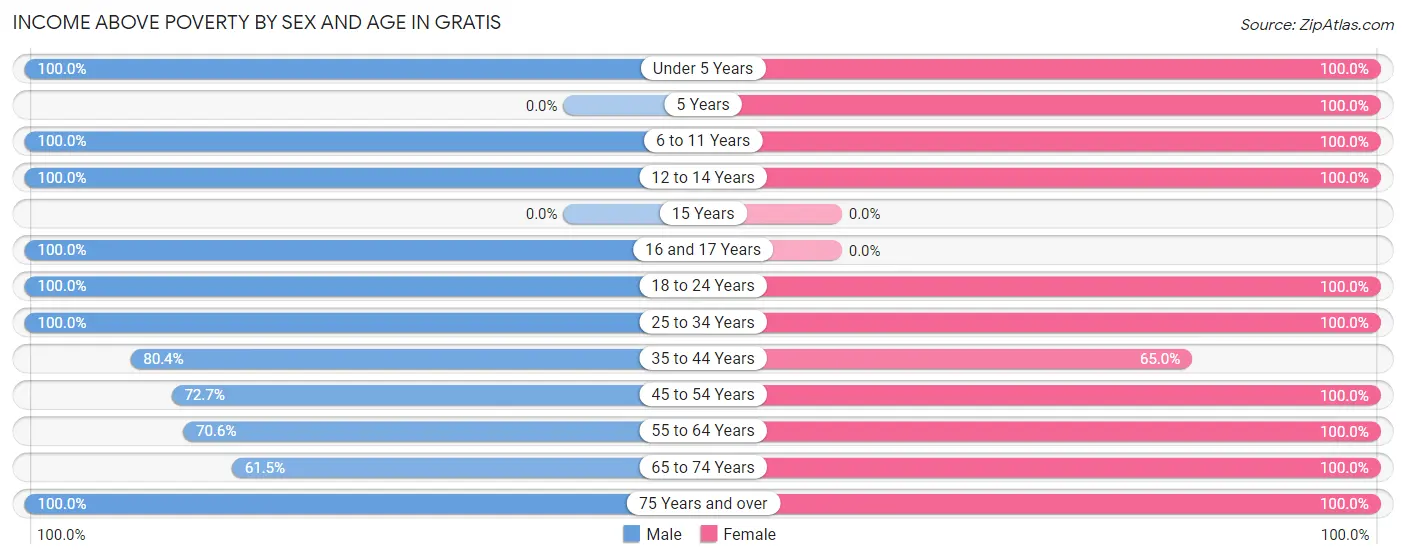
| Age Bracket | Male | Female |
| Under 5 Years | 59 (100.0%) | 38 (100.0%) |
| 5 Years | 0 (0.0%) | 7 (100.0%) |
| 6 to 11 Years | 33 (100.0%) | 2 (100.0%) |
| 12 to 14 Years | 5 (100.0%) | 2 (100.0%) |
| 15 Years | 0 (0.0%) | 0 (0.0%) |
| 16 and 17 Years | 7 (100.0%) | 0 (0.0%) |
| 18 to 24 Years | 14 (100.0%) | 22 (100.0%) |
| 25 to 34 Years | 101 (100.0%) | 84 (100.0%) |
| 35 to 44 Years | 45 (80.4%) | 13 (65.0%) |
| 45 to 54 Years | 8 (72.7%) | 30 (100.0%) |
| 55 to 64 Years | 24 (70.6%) | 17 (100.0%) |
| 65 to 74 Years | 16 (61.5%) | 61 (100.0%) |
| 75 Years and over | 39 (100.0%) | 35 (100.0%) |
| Total | 351 (91.2%) | 311 (97.8%) |
Income Below Poverty Among Married-Couple Families in Gratis
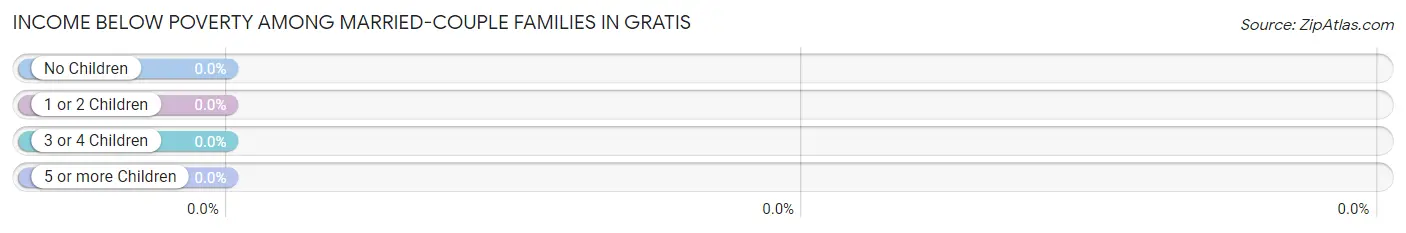
| Children | Above Poverty | Below Poverty |
| No Children | 78 (100.0%) | 0 (0.0%) |
| 1 or 2 Children | 102 (100.0%) | 0 (0.0%) |
| 3 or 4 Children | 3 (100.0%) | 0 (0.0%) |
| 5 or more Children | 0 (0.0%) | 0 (0.0%) |
| Total | 183 (100.0%) | 0 (0.0%) |
Income Below Poverty Among Single-Parent Households in Gratis
| Children | Single Father | Single Mother |
| No Children | 0 (0.0%) | 0 (0.0%) |
| 1 or 2 Children | 0 (0.0%) | 0 (0.0%) |
| 3 or 4 Children | 0 (0.0%) | 0 (0.0%) |
| 5 or more Children | 0 (0.0%) | 0 (0.0%) |
| Total | 0 (0.0%) | 0 (0.0%) |
Income Below Poverty Among Married-Couple vs Single-Parent Households in Gratis
| Children | Married-Couple Families | Single-Parent Households |
| No Children | 0 (0.0%) | 0 (0.0%) |
| 1 or 2 Children | 0 (0.0%) | 0 (0.0%) |
| 3 or 4 Children | 0 (0.0%) | 0 (0.0%) |
| 5 or more Children | 0 (0.0%) | 0 (0.0%) |
| Total | 0 (0.0%) | 0 (0.0%) |
Race in Gratis
The most populous races in Gratis are , and White / Caucasian (703 | 100.0%).
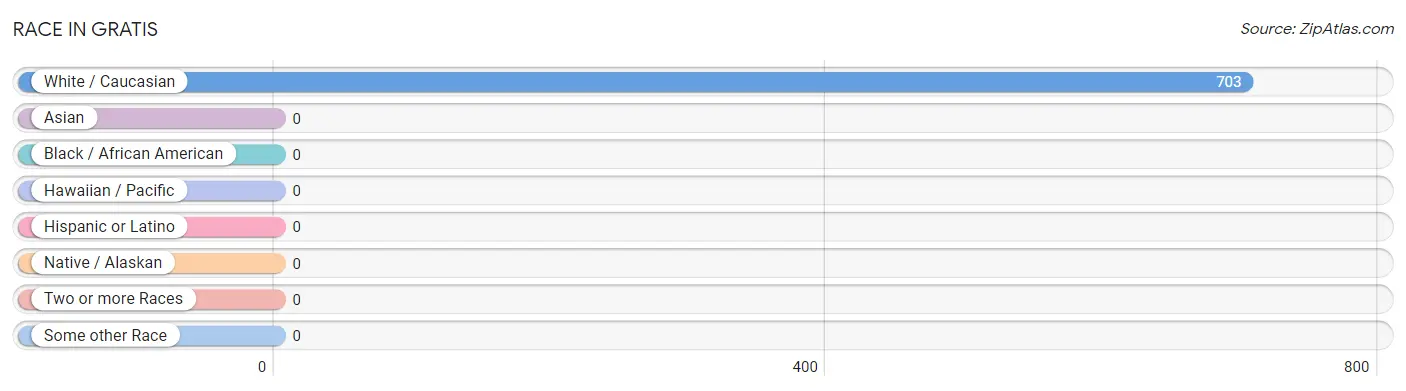
| Race | # Population | % Population |
| Asian | 0 | 0.0% |
| Black / African American | 0 | 0.0% |
| Hawaiian / Pacific | 0 | 0.0% |
| Hispanic or Latino | 0 | 0.0% |
| Native / Alaskan | 0 | 0.0% |
| White / Caucasian | 703 | 100.0% |
| Two or more Races | 0 | 0.0% |
| Some other Race | 0 | 0.0% |
| Total | 703 | 100.0% |
Ancestry in Gratis
The most populous ancestries reported in Gratis are German (119 | 16.9%), English (58 | 8.3%), Irish (51 | 7.2%), American (35 | 5.0%), and Italian (28 | 4.0%), together accounting for 41.4% of all Gratis residents.
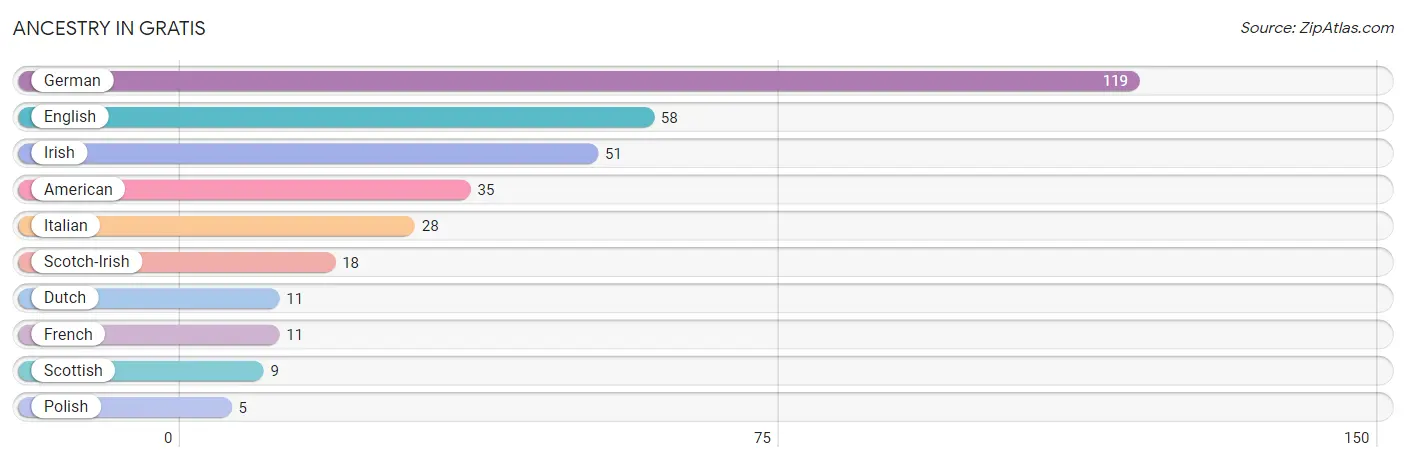
| Ancestry | # Population | % Population |
| American | 35 | 5.0% |
| Dutch | 11 | 1.6% |
| English | 58 | 8.3% |
| French | 11 | 1.6% |
| German | 119 | 16.9% |
| Irish | 51 | 7.2% |
| Italian | 28 | 4.0% |
| Polish | 5 | 0.7% |
| Scotch-Irish | 18 | 2.6% |
| Scottish | 9 | 1.3% | View All 10 Rows |
Immigrants in Gratis

| Immigration Origin | # Population | % Population | View All 0 Rows |
Sex and Age in Gratis
Sex and Age in Gratis
The most populous age groups in Gratis are 30 to 34 Years (61 | 15.8%) for men and 25 to 29 Years (48 | 15.1%) for women.
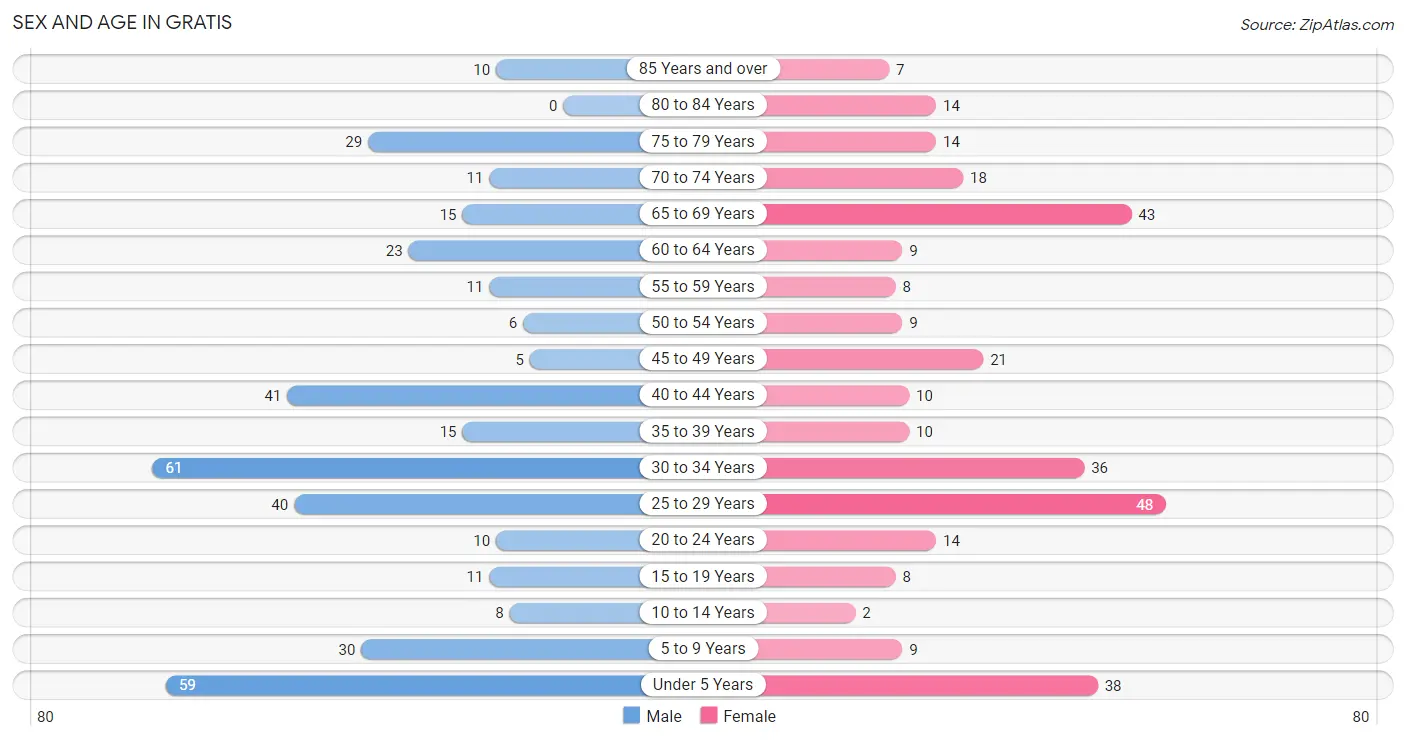
| Age Bracket | Male | Female |
| Under 5 Years | 59 (15.3%) | 38 (11.9%) |
| 5 to 9 Years | 30 (7.8%) | 9 (2.8%) |
| 10 to 14 Years | 8 (2.1%) | 2 (0.6%) |
| 15 to 19 Years | 11 (2.9%) | 8 (2.5%) |
| 20 to 24 Years | 10 (2.6%) | 14 (4.4%) |
| 25 to 29 Years | 40 (10.4%) | 48 (15.1%) |
| 30 to 34 Years | 61 (15.8%) | 36 (11.3%) |
| 35 to 39 Years | 15 (3.9%) | 10 (3.1%) |
| 40 to 44 Years | 41 (10.6%) | 10 (3.1%) |
| 45 to 49 Years | 5 (1.3%) | 21 (6.6%) |
| 50 to 54 Years | 6 (1.6%) | 9 (2.8%) |
| 55 to 59 Years | 11 (2.9%) | 8 (2.5%) |
| 60 to 64 Years | 23 (6.0%) | 9 (2.8%) |
| 65 to 69 Years | 15 (3.9%) | 43 (13.5%) |
| 70 to 74 Years | 11 (2.9%) | 18 (5.7%) |
| 75 to 79 Years | 29 (7.5%) | 14 (4.4%) |
| 80 to 84 Years | 0 (0.0%) | 14 (4.4%) |
| 85 Years and over | 10 (2.6%) | 7 (2.2%) |
| Total | 385 (100.0%) | 318 (100.0%) |
Families and Households in Gratis
Median Family Size in Gratis
The median family size in Gratis is 2.78 persons per family, with married-couple families (183 | 85.5%) accounting for the largest median family size of 2.9 persons per family. On the other hand, single female/mother families (24 | 11.2%) represent the smallest median family size with 2.04 persons per family.
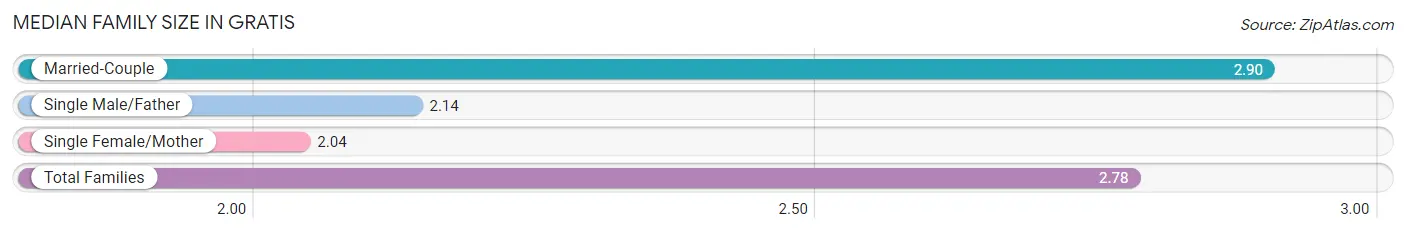
| Family Type | # Families | Family Size |
| Married-Couple | 183 (85.5%) | 2.90 |
| Single Male/Father | 7 (3.3%) | 2.14 |
| Single Female/Mother | 24 (11.2%) | 2.04 |
| Total Families | 214 (100.0%) | 2.78 |
Median Household Size in Gratis
The median household size in Gratis is 2.37 persons per household, with single male/father households (7 | 2.4%) accounting for the largest median household size of 3.14 persons per household. non-family households (74 | 25.7%) represent the smallest median household size with 1.08 persons per household.
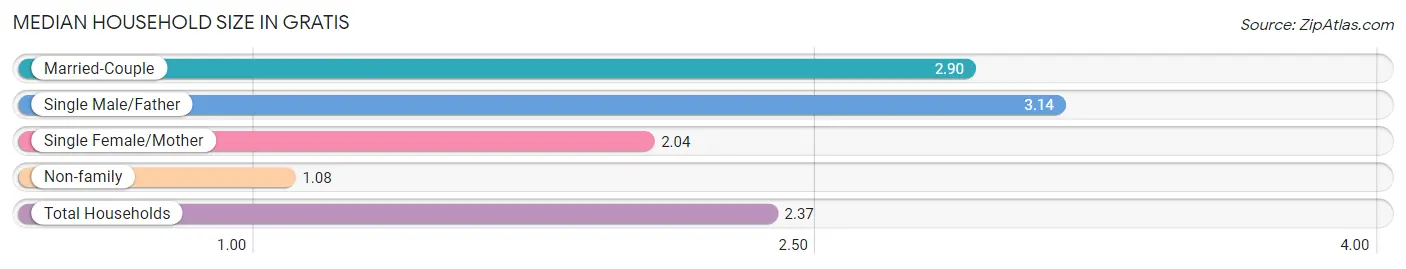
| Household Type | # Households | Household Size |
| Married-Couple | 183 (63.5%) | 2.90 |
| Single Male/Father | 7 (2.4%) | 3.14 |
| Single Female/Mother | 24 (8.3%) | 2.04 |
| Non-family | 74 (25.7%) | 1.08 |
| Total Households | 288 (100.0%) | 2.37 |
Household Size by Marriage Status in Gratis
Out of a total of 288 households in Gratis, 214 (74.3%) are family households, while 74 (25.7%) are nonfamily households. The most numerous type of family households are 2-person households, comprising 88, and the most common type of nonfamily households are 1-person households, comprising 70.
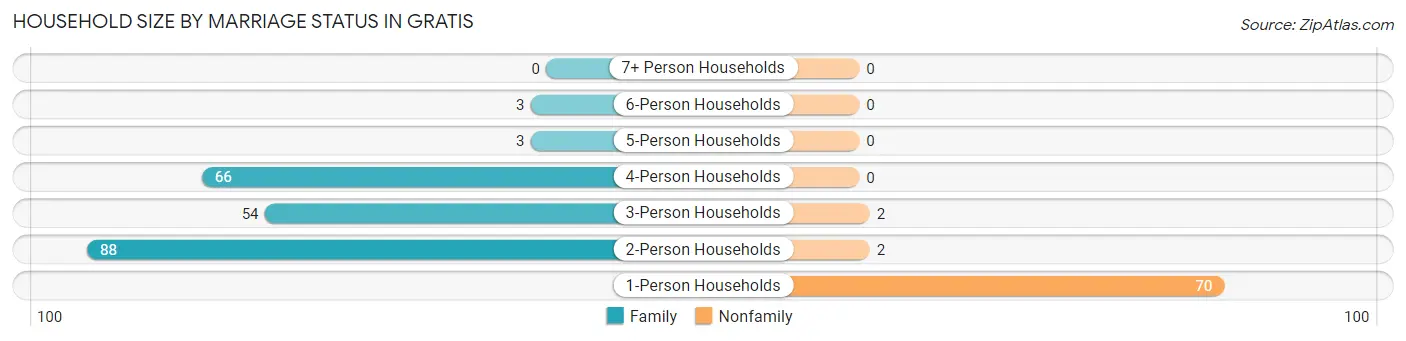
| Household Size | Family Households | Nonfamily Households |
| 1-Person Households | - | 70 (24.3%) |
| 2-Person Households | 88 (30.6%) | 2 (0.7%) |
| 3-Person Households | 54 (18.8%) | 2 (0.7%) |
| 4-Person Households | 66 (22.9%) | 0 (0.0%) |
| 5-Person Households | 3 (1.0%) | 0 (0.0%) |
| 6-Person Households | 3 (1.0%) | 0 (0.0%) |
| 7+ Person Households | 0 (0.0%) | 0 (0.0%) |
| Total | 214 (74.3%) | 74 (25.7%) |
Female Fertility in Gratis
Fertility by Age in Gratis
Average fertility rate in Gratis is 193.0 births per 1,000 women. Women in the age bracket of 20 to 34 years have the highest fertility rate with 296.0 births per 1,000 women. Women in the age bracket of 20 to 34 years acount for 100.0% of all women with births.
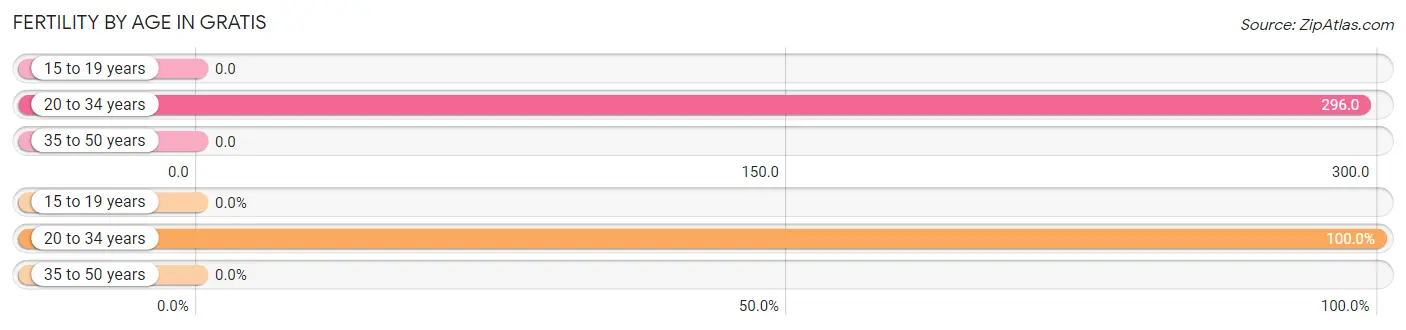
| Age Bracket | Women with Births | Births / 1,000 Women |
| 15 to 19 years | 0 (0.0%) | 0.0 |
| 20 to 34 years | 29 (100.0%) | 296.0 |
| 35 to 50 years | 0 (0.0%) | 0.0 |
| Total | 29 (100.0%) | 193.0 |
Fertility by Age by Marriage Status in Gratis
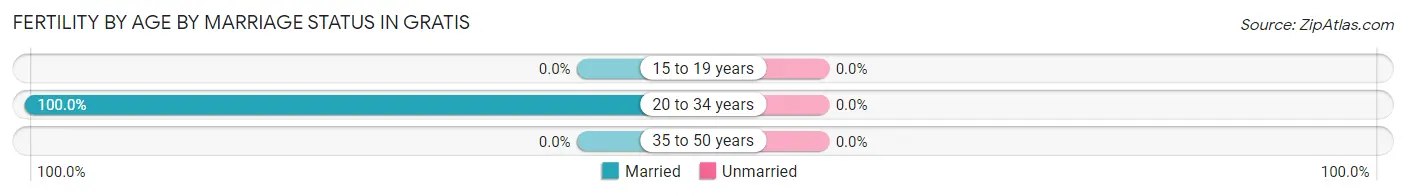
| Age Bracket | Married | Unmarried |
| 15 to 19 years | 0 (0.0%) | 0 (0.0%) |
| 20 to 34 years | 29 (100.0%) | 0 (0.0%) |
| 35 to 50 years | 0 (0.0%) | 0 (0.0%) |
| Total | 29 (100.0%) | 0 (0.0%) |
Fertility by Education in Gratis
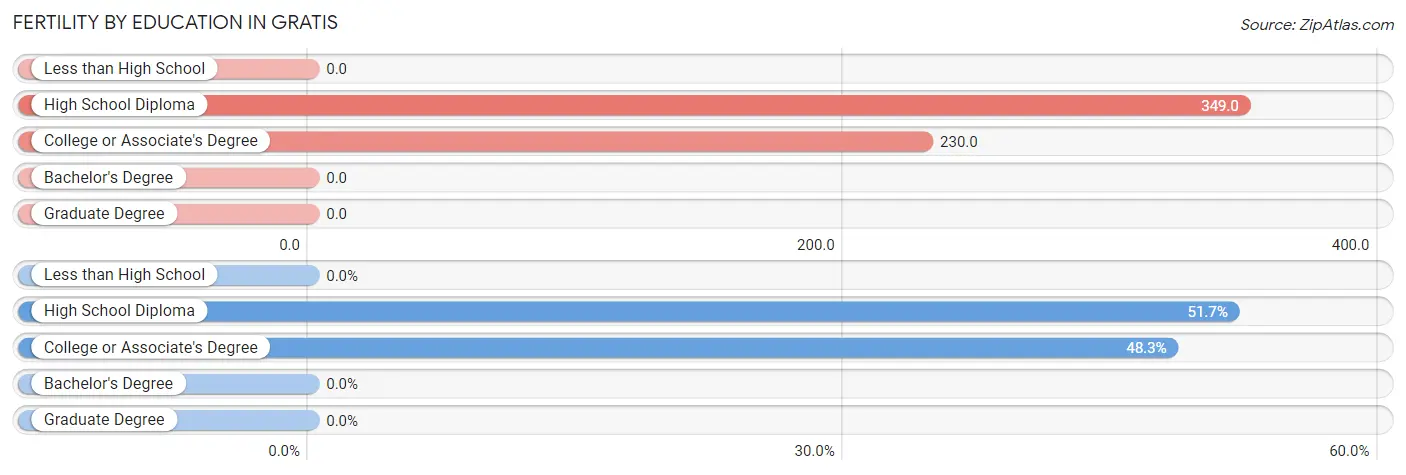
| Educational Attainment | Women with Births | Births / 1,000 Women |
| Less than High School | 0 (0.0%) | 0.0 |
| High School Diploma | 15 (51.7%) | 349.0 |
| College or Associate's Degree | 14 (48.3%) | 230.0 |
| Bachelor's Degree | 0 (0.0%) | 0.0 |
| Graduate Degree | 0 (0.0%) | 0.0 |
| Total | 29 (100.0%) | 193.0 |
Fertility by Education by Marriage Status in Gratis
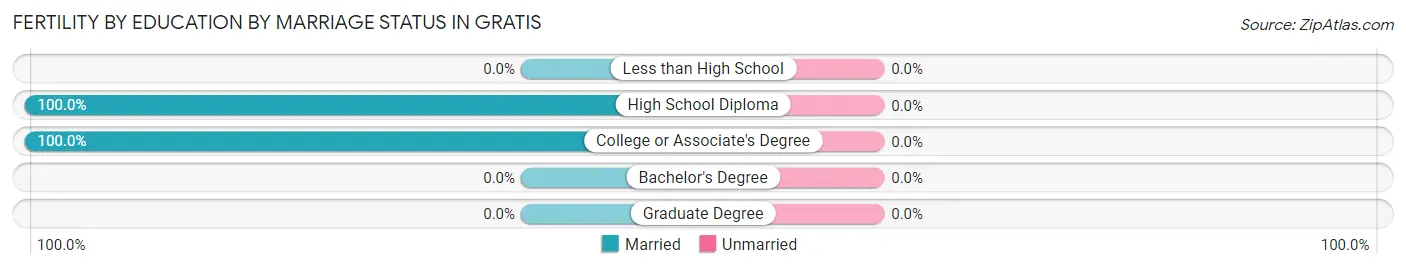
| Educational Attainment | Married | Unmarried |
| Less than High School | 0 (0.0%) | 0 (0.0%) |
| High School Diploma | 15 (100.0%) | 0 (0.0%) |
| College or Associate's Degree | 14 (100.0%) | 0 (0.0%) |
| Bachelor's Degree | 0 (0.0%) | 0 (0.0%) |
| Graduate Degree | 0 (0.0%) | 0 (0.0%) |
| Total | 29 (100.0%) | 0 (0.0%) |
Employment Characteristics in Gratis
Employment by Class of Employer in Gratis
Among the 321 employed individuals in Gratis, private company employees (266 | 82.9%), self-employed (incorporated) (16 | 5.0%), and not-for-profit organizations (16 | 5.0%) make up the most common classes of employment.
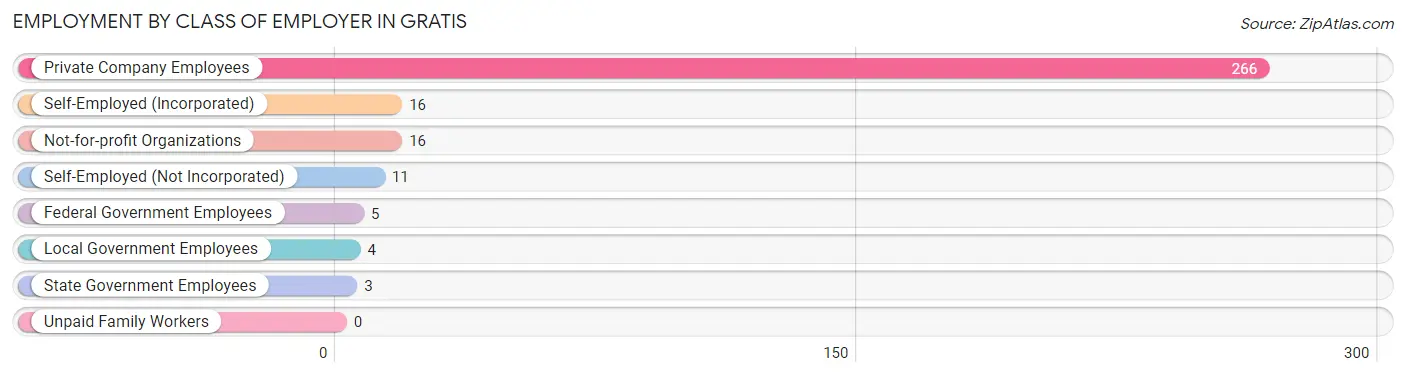
| Employer Class | # Employees | % Employees |
| Private Company Employees | 266 | 82.9% |
| Self-Employed (Incorporated) | 16 | 5.0% |
| Self-Employed (Not Incorporated) | 11 | 3.4% |
| Not-for-profit Organizations | 16 | 5.0% |
| Local Government Employees | 4 | 1.3% |
| State Government Employees | 3 | 0.9% |
| Federal Government Employees | 5 | 1.6% |
| Unpaid Family Workers | 0 | 0.0% |
| Total | 321 | 100.0% |
Employment Status by Age in Gratis
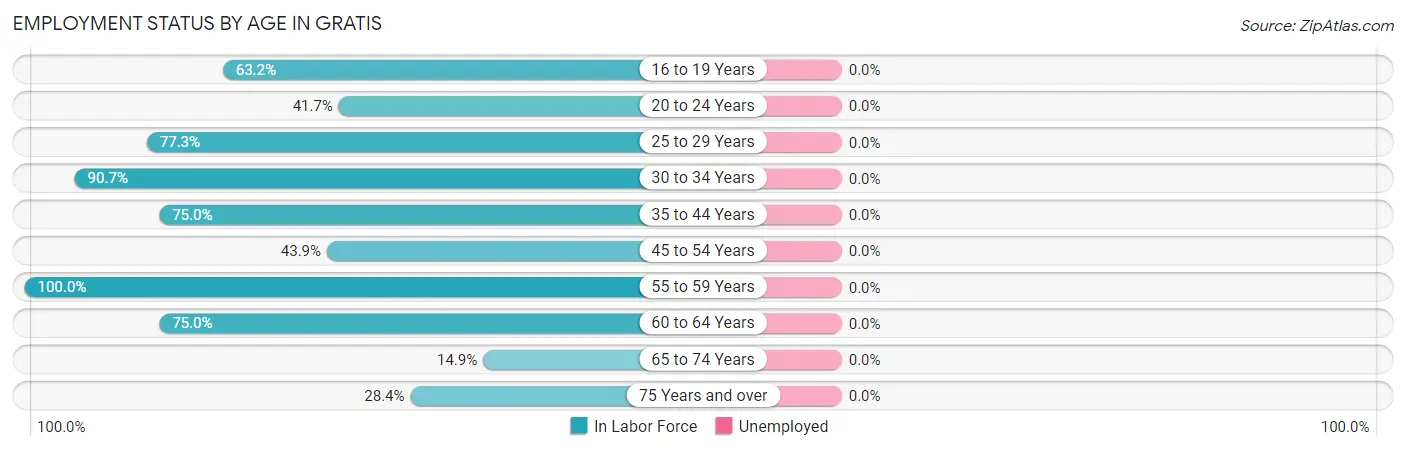
| Age Bracket | In Labor Force | Unemployed |
| 16 to 19 Years | 12 (63.2%) | 0 (0.0%) |
| 20 to 24 Years | 10 (41.7%) | 0 (0.0%) |
| 25 to 29 Years | 68 (77.3%) | 0 (0.0%) |
| 30 to 34 Years | 88 (90.7%) | 0 (0.0%) |
| 35 to 44 Years | 57 (75.0%) | 0 (0.0%) |
| 45 to 54 Years | 18 (43.9%) | 0 (0.0%) |
| 55 to 59 Years | 19 (100.0%) | 0 (0.0%) |
| 60 to 64 Years | 24 (75.0%) | 0 (0.0%) |
| 65 to 74 Years | 13 (14.9%) | 0 (0.0%) |
| 75 Years and over | 21 (28.4%) | 0 (0.0%) |
| Total | 330 (59.2%) | 0 (0.0%) |
Employment Status by Educational Attainment in Gratis
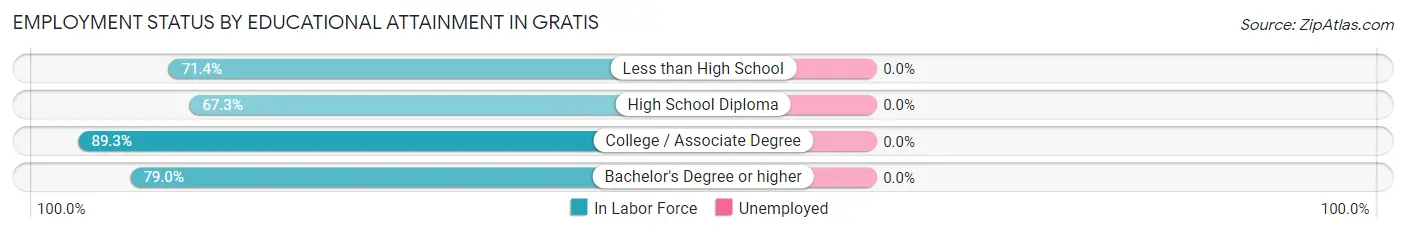
| Educational Attainment | In Labor Force | Unemployed |
| Less than High School | 5 (71.4%) | 0 (0.0%) |
| High School Diploma | 103 (67.3%) | 0 (0.0%) |
| College / Associate Degree | 117 (89.3%) | 0 (0.0%) |
| Bachelor's Degree or higher | 49 (79.0%) | 0 (0.0%) |
| Total | 274 (77.6%) | 0 (0.0%) |
Employment Occupations by Sex in Gratis
Management, Business, Science and Arts Occupations
The most common Management, Business, Science and Arts occupations in Gratis are Management (15 | 4.5%), Health Diagnosing & Treating (14 | 4.2%), Computers, Engineering & Science (9 | 2.7%), Computers & Mathematics (9 | 2.7%), and Health Technologists (9 | 2.7%).
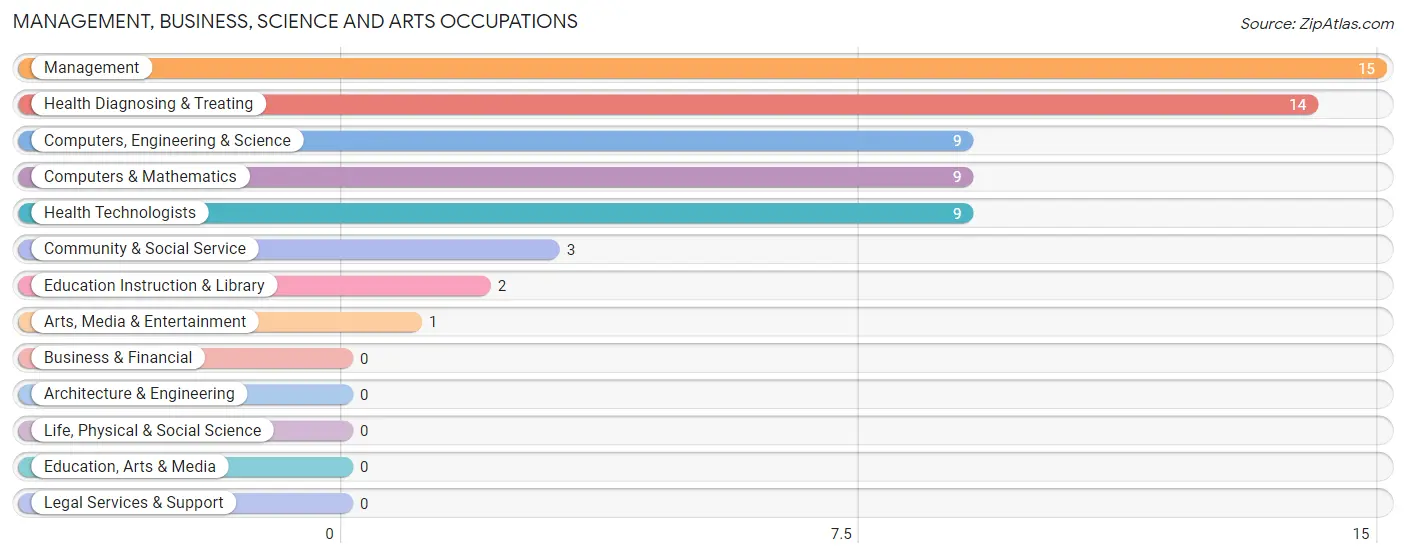
Management, Business, Science and Arts Occupations by Sex
Within the Management, Business, Science and Arts occupations in Gratis, the most male-oriented occupations are Management (100.0%), Computers, Engineering & Science (100.0%), and Computers & Mathematics (100.0%), while the most female-oriented occupations are Education Instruction & Library (100.0%), Health Diagnosing & Treating (100.0%), and Health Technologists (100.0%).
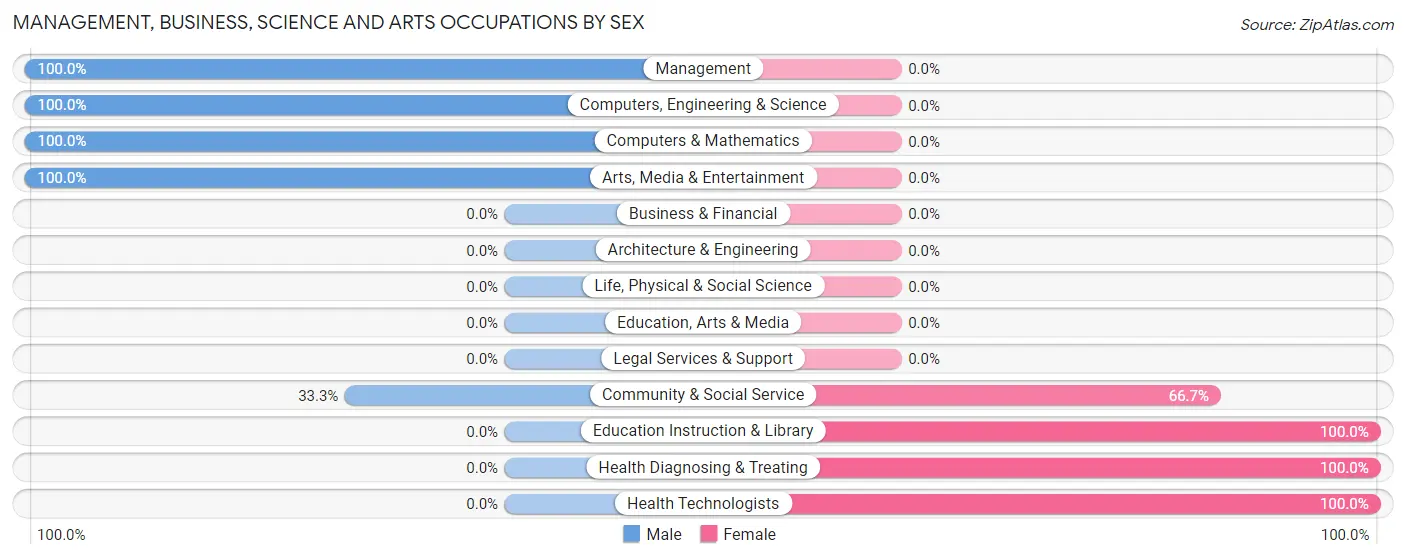
| Occupation | Male | Female |
| Management | 15 (100.0%) | 0 (0.0%) |
| Business & Financial | 0 (0.0%) | 0 (0.0%) |
| Computers, Engineering & Science | 9 (100.0%) | 0 (0.0%) |
| Computers & Mathematics | 9 (100.0%) | 0 (0.0%) |
| Architecture & Engineering | 0 (0.0%) | 0 (0.0%) |
| Life, Physical & Social Science | 0 (0.0%) | 0 (0.0%) |
| Community & Social Service | 1 (33.3%) | 2 (66.7%) |
| Education, Arts & Media | 0 (0.0%) | 0 (0.0%) |
| Legal Services & Support | 0 (0.0%) | 0 (0.0%) |
| Education Instruction & Library | 0 (0.0%) | 2 (100.0%) |
| Arts, Media & Entertainment | 1 (100.0%) | 0 (0.0%) |
| Health Diagnosing & Treating | 0 (0.0%) | 14 (100.0%) |
| Health Technologists | 0 (0.0%) | 9 (100.0%) |
| Total (Category) | 25 (61.0%) | 16 (39.0%) |
| Total (Overall) | 207 (62.7%) | 123 (37.3%) |
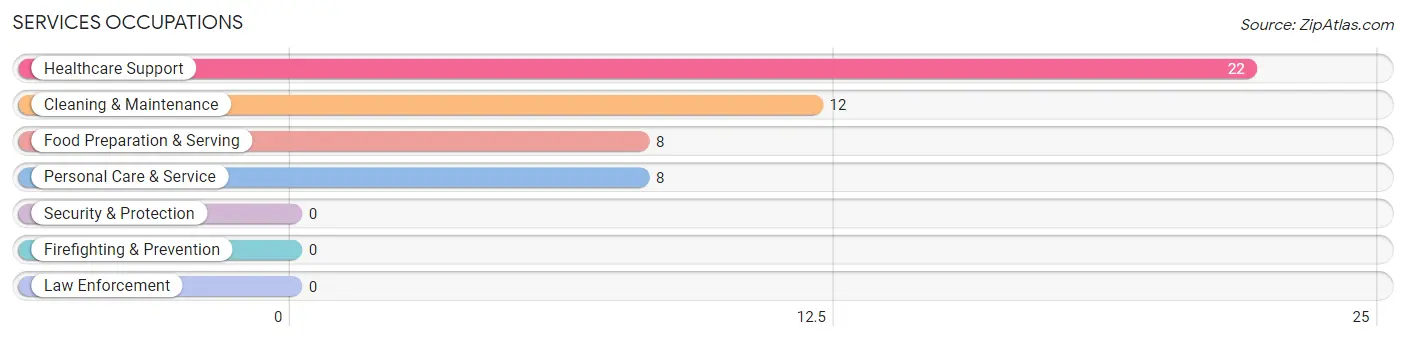
Services Occupations
The most common Services occupations in Gratis are Healthcare Support (22 | 6.7%), Cleaning & Maintenance (12 | 3.6%), Food Preparation & Serving (8 | 2.4%), and Personal Care & Service (8 | 2.4%).
Services Occupations by Sex
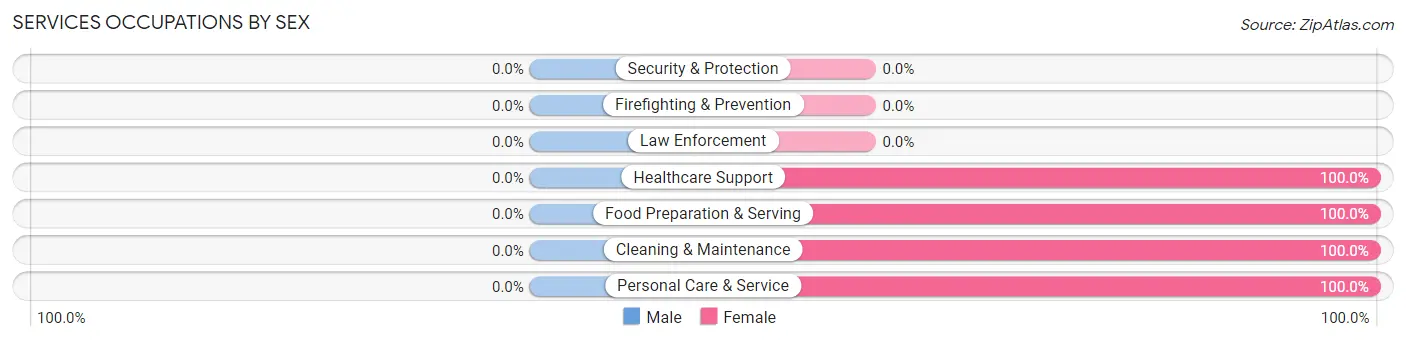
| Occupation | Male | Female |
| Healthcare Support | 0 (0.0%) | 22 (100.0%) |
| Security & Protection | 0 (0.0%) | 0 (0.0%) |
| Firefighting & Prevention | 0 (0.0%) | 0 (0.0%) |
| Law Enforcement | 0 (0.0%) | 0 (0.0%) |
| Food Preparation & Serving | 0 (0.0%) | 8 (100.0%) |
| Cleaning & Maintenance | 0 (0.0%) | 12 (100.0%) |
| Personal Care & Service | 0 (0.0%) | 8 (100.0%) |
| Total (Category) | 0 (0.0%) | 50 (100.0%) |
| Total (Overall) | 207 (62.7%) | 123 (37.3%) |
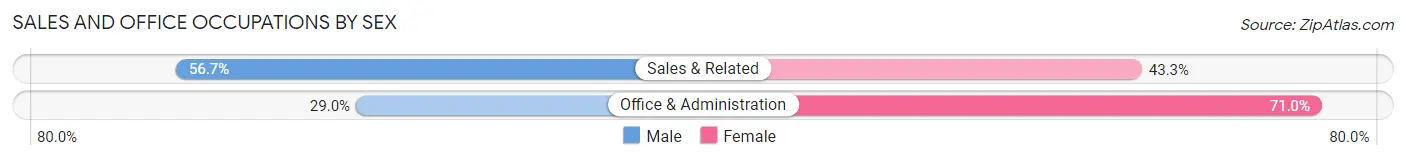
Sales and Office Occupations
The most common Sales and Office occupations in Gratis are Sales & Related (67 | 20.3%), and Office & Administration (31 | 9.4%).
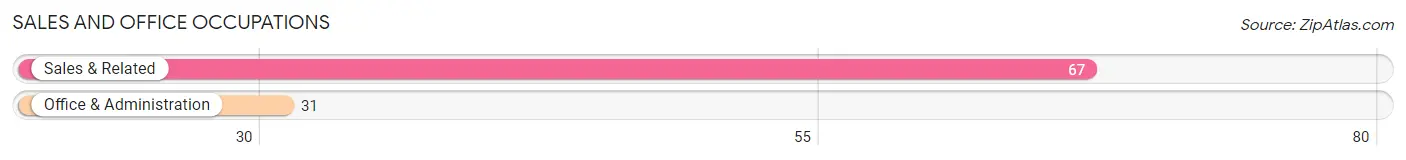
Sales and Office Occupations by Sex
| Occupation | Male | Female |
| Sales & Related | 38 (56.7%) | 29 (43.3%) |
| Office & Administration | 9 (29.0%) | 22 (71.0%) |
| Total (Category) | 47 (48.0%) | 51 (52.0%) |
| Total (Overall) | 207 (62.7%) | 123 (37.3%) |
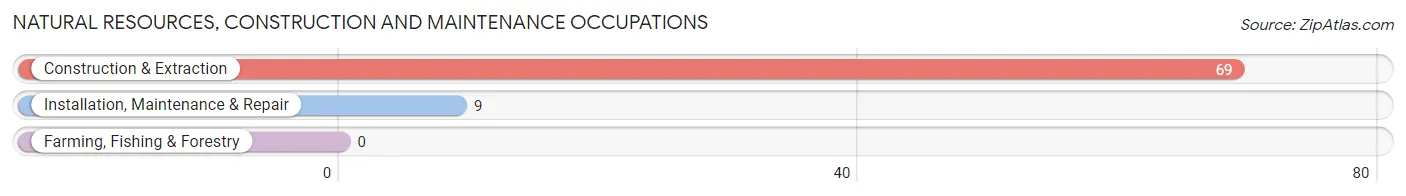
Natural Resources, Construction and Maintenance Occupations
The most common Natural Resources, Construction and Maintenance occupations in Gratis are Construction & Extraction (69 | 20.9%), and Installation, Maintenance & Repair (9 | 2.7%).
Natural Resources, Construction and Maintenance Occupations by Sex
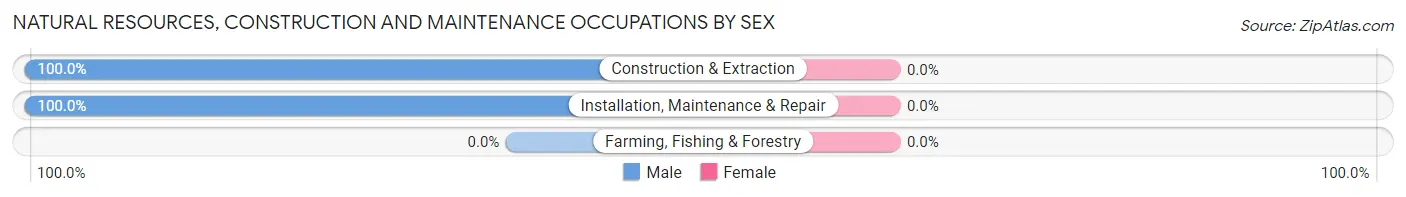
| Occupation | Male | Female |
| Farming, Fishing & Forestry | 0 (0.0%) | 0 (0.0%) |
| Construction & Extraction | 69 (100.0%) | 0 (0.0%) |
| Installation, Maintenance & Repair | 9 (100.0%) | 0 (0.0%) |
| Total (Category) | 78 (100.0%) | 0 (0.0%) |
| Total (Overall) | 207 (62.7%) | 123 (37.3%) |
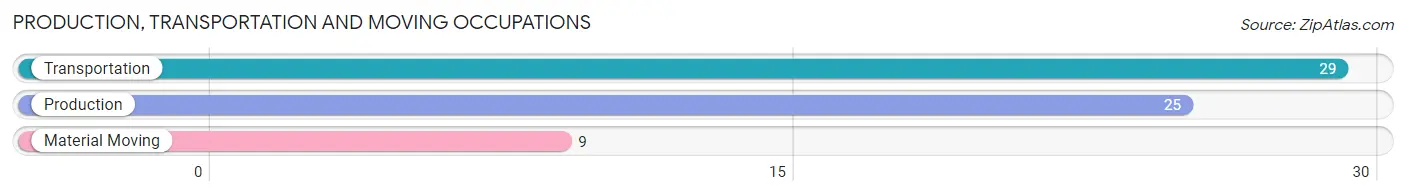
Production, Transportation and Moving Occupations
The most common Production, Transportation and Moving occupations in Gratis are Transportation (29 | 8.8%), Production (25 | 7.6%), and Material Moving (9 | 2.7%).
Production, Transportation and Moving Occupations by Sex
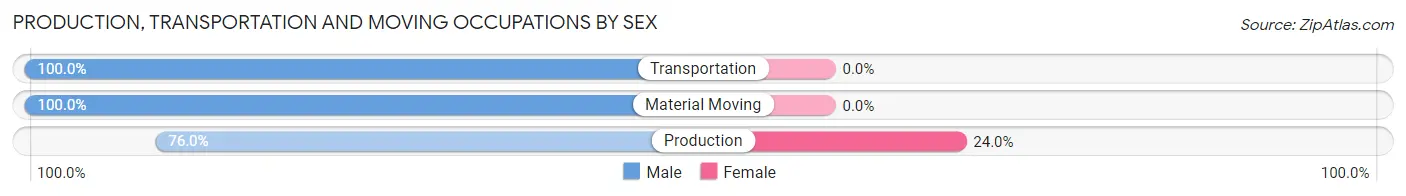
| Occupation | Male | Female |
| Production | 19 (76.0%) | 6 (24.0%) |
| Transportation | 29 (100.0%) | 0 (0.0%) |
| Material Moving | 9 (100.0%) | 0 (0.0%) |
| Total (Category) | 57 (90.5%) | 6 (9.5%) |
| Total (Overall) | 207 (62.7%) | 123 (37.3%) |
Employment Industries by Sex in Gratis
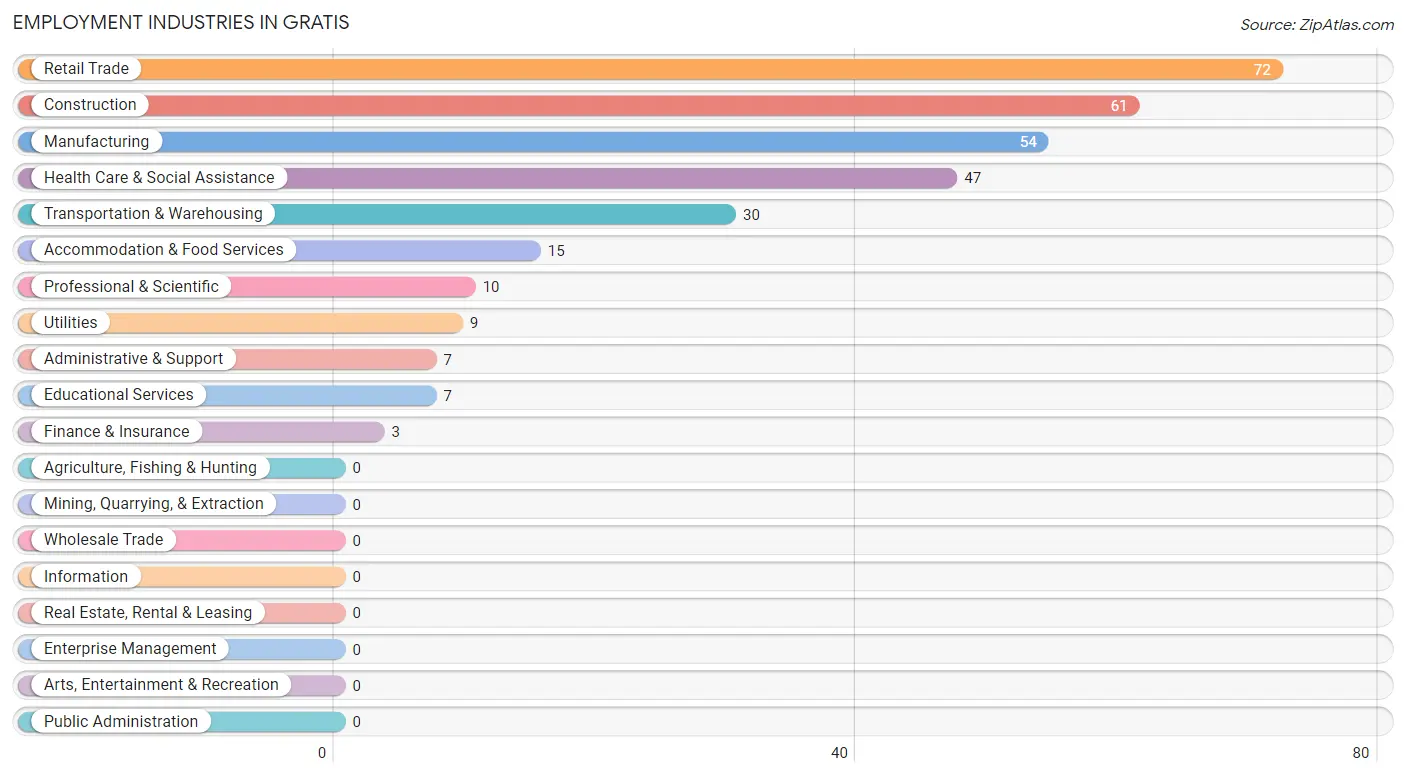
Employment Industries in Gratis
The major employment industries in Gratis include Retail Trade (72 | 21.8%), Construction (61 | 18.5%), Manufacturing (54 | 16.4%), Health Care & Social Assistance (47 | 14.2%), and Transportation & Warehousing (30 | 9.1%).
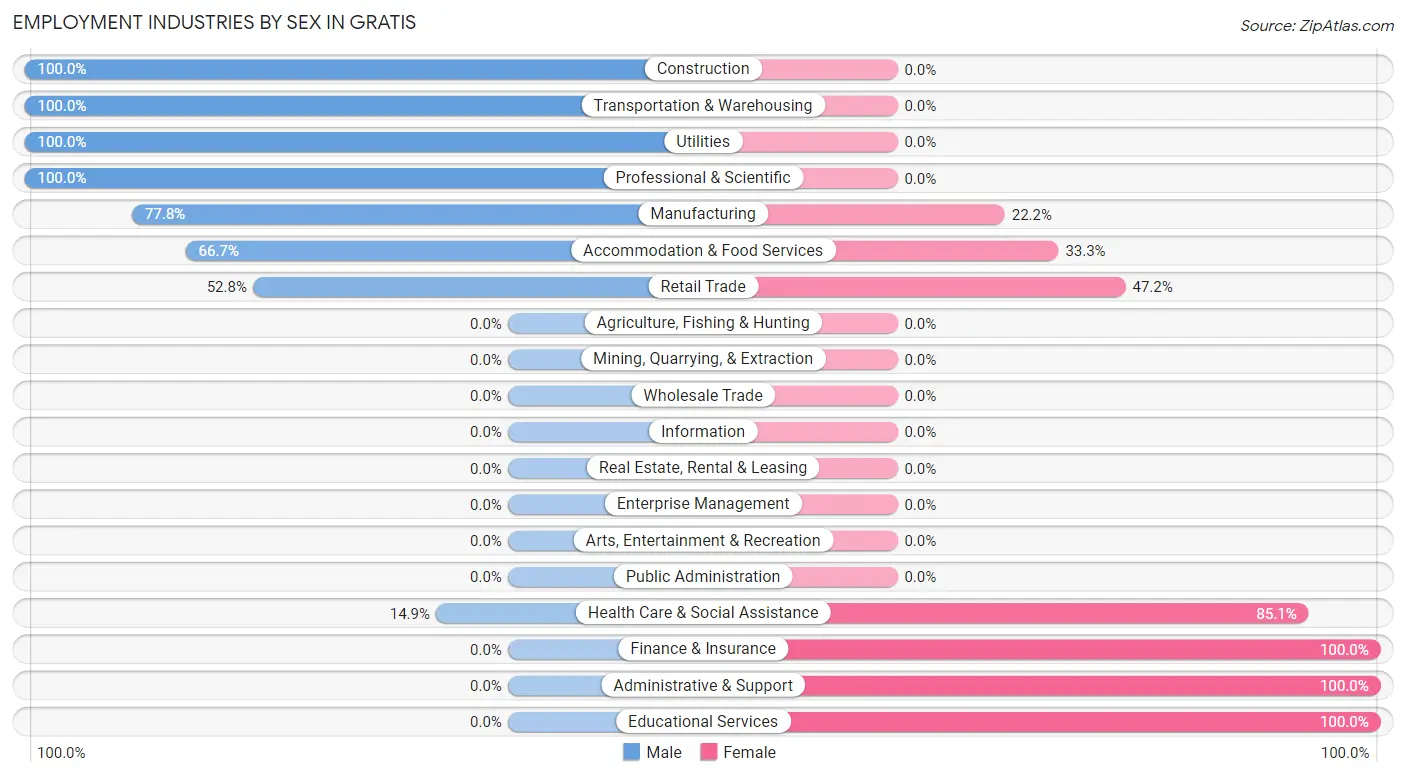
Employment Industries by Sex in Gratis
The Gratis industries that see more men than women are Construction (100.0%), Transportation & Warehousing (100.0%), and Utilities (100.0%), whereas the industries that tend to have a higher number of women are Finance & Insurance (100.0%), Administrative & Support (100.0%), and Educational Services (100.0%).
| Industry | Male | Female |
| Agriculture, Fishing & Hunting | 0 (0.0%) | 0 (0.0%) |
| Mining, Quarrying, & Extraction | 0 (0.0%) | 0 (0.0%) |
| Construction | 61 (100.0%) | 0 (0.0%) |
| Manufacturing | 42 (77.8%) | 12 (22.2%) |
| Wholesale Trade | 0 (0.0%) | 0 (0.0%) |
| Retail Trade | 38 (52.8%) | 34 (47.2%) |
| Transportation & Warehousing | 30 (100.0%) | 0 (0.0%) |
| Utilities | 9 (100.0%) | 0 (0.0%) |
| Information | 0 (0.0%) | 0 (0.0%) |
| Finance & Insurance | 0 (0.0%) | 3 (100.0%) |
| Real Estate, Rental & Leasing | 0 (0.0%) | 0 (0.0%) |
| Professional & Scientific | 10 (100.0%) | 0 (0.0%) |
| Enterprise Management | 0 (0.0%) | 0 (0.0%) |
| Administrative & Support | 0 (0.0%) | 7 (100.0%) |
| Educational Services | 0 (0.0%) | 7 (100.0%) |
| Health Care & Social Assistance | 7 (14.9%) | 40 (85.1%) |
| Arts, Entertainment & Recreation | 0 (0.0%) | 0 (0.0%) |
| Accommodation & Food Services | 10 (66.7%) | 5 (33.3%) |
| Public Administration | 0 (0.0%) | 0 (0.0%) |
| Total | 207 (62.7%) | 123 (37.3%) |
Education in Gratis
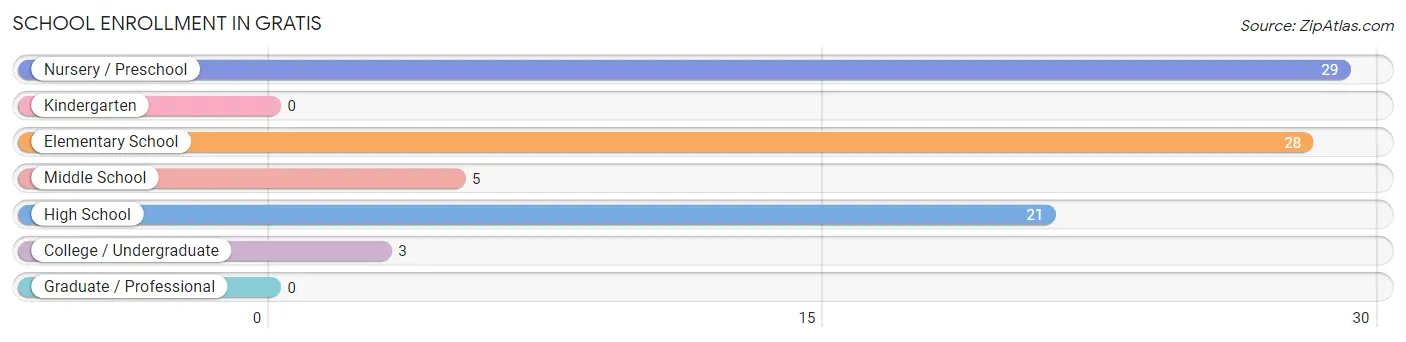
School Enrollment in Gratis
The most common levels of schooling among the 86 students in Gratis are nursery / preschool (29 | 33.7%), elementary school (28 | 32.6%), and high school (21 | 24.4%).
| School Level | # Students | % Students |
| Nursery / Preschool | 29 | 33.7% |
| Kindergarten | 0 | 0.0% |
| Elementary School | 28 | 32.6% |
| Middle School | 5 | 5.8% |
| High School | 21 | 24.4% |
| College / Undergraduate | 3 | 3.5% |
| Graduate / Professional | 0 | 0.0% |
| Total | 86 | 100.0% |
School Enrollment by Age by Funding Source in Gratis
Out of a total of 86 students who are enrolled in schools in Gratis, 20 (23.3%) attend a private institution, while the remaining 66 (76.7%) are enrolled in public schools. The age group of 3 to 4 year olds has the highest likelihood of being enrolled in private schools, with 20 (69.0% in the age bracket) enrolled. Conversely, the age group of 5 to 9 year old has the lowest likelihood of being enrolled in a private school, with 28 (100.0% in the age bracket) attending a public institution.
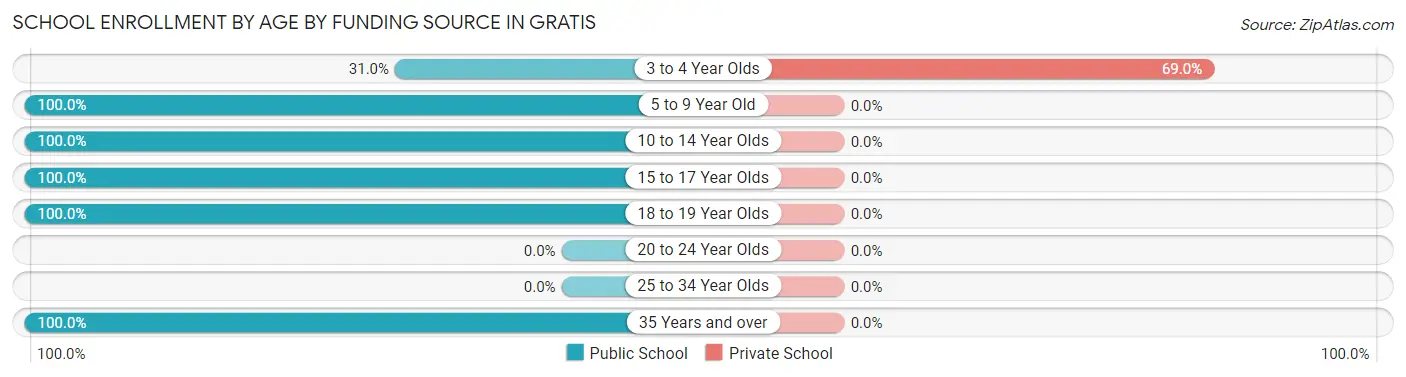
| Age Bracket | Public School | Private School |
| 3 to 4 Year Olds | 9 (31.0%) | 20 (69.0%) |
| 5 to 9 Year Old | 28 (100.0%) | 0 (0.0%) |
| 10 to 14 Year Olds | 7 (100.0%) | 0 (0.0%) |
| 15 to 17 Year Olds | 7 (100.0%) | 0 (0.0%) |
| 18 to 19 Year Olds | 12 (100.0%) | 0 (0.0%) |
| 20 to 24 Year Olds | 0 (0.0%) | 0 (0.0%) |
| 25 to 34 Year Olds | 0 (0.0%) | 0 (0.0%) |
| 35 Years and over | 3 (100.0%) | 0 (0.0%) |
| Total | 66 (76.7%) | 20 (23.3%) |
Educational Attainment by Field of Study in Gratis
Visual & performing arts (48 | 60.0%), science & technology (13 | 16.3%), business (7 | 8.7%), computers & mathematics (6 | 7.5%), and education (6 | 7.5%) are the most common fields of study among 80 individuals in Gratis who have obtained a bachelor's degree or higher.
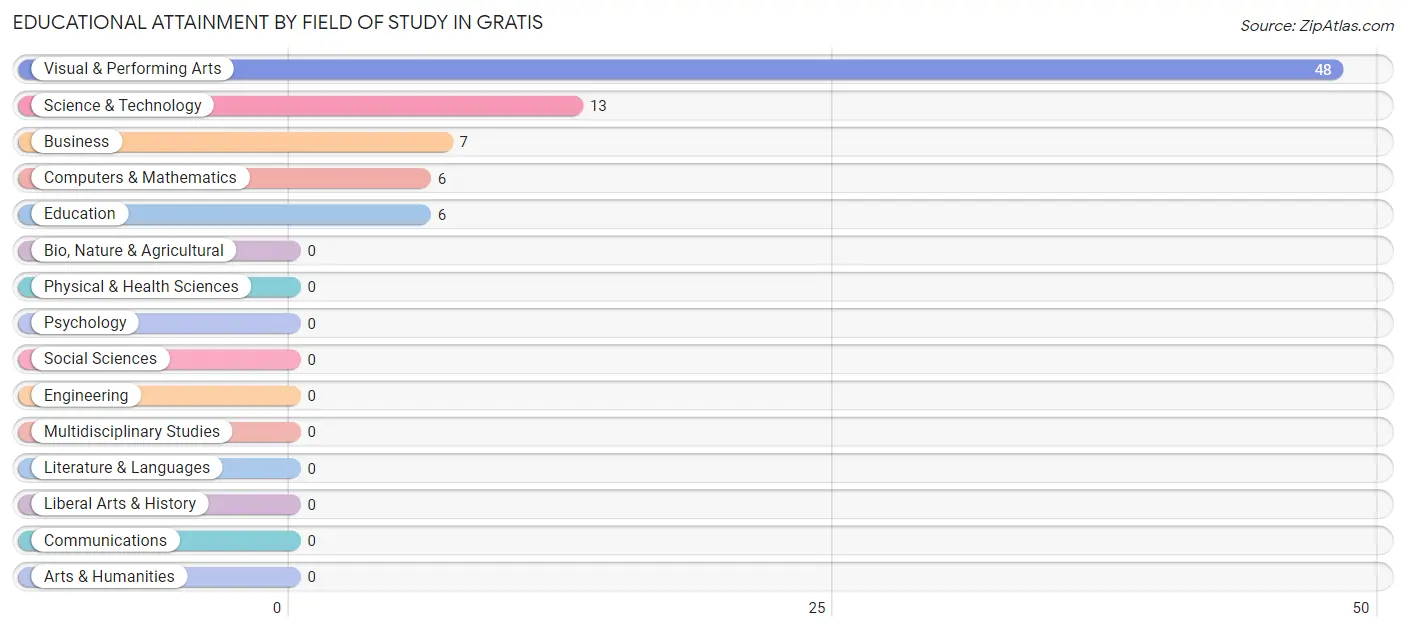
| Field of Study | # Graduates | % Graduates |
| Computers & Mathematics | 6 | 7.5% |
| Bio, Nature & Agricultural | 0 | 0.0% |
| Physical & Health Sciences | 0 | 0.0% |
| Psychology | 0 | 0.0% |
| Social Sciences | 0 | 0.0% |
| Engineering | 0 | 0.0% |
| Multidisciplinary Studies | 0 | 0.0% |
| Science & Technology | 13 | 16.3% |
| Business | 7 | 8.7% |
| Education | 6 | 7.5% |
| Literature & Languages | 0 | 0.0% |
| Liberal Arts & History | 0 | 0.0% |
| Visual & Performing Arts | 48 | 60.0% |
| Communications | 0 | 0.0% |
| Arts & Humanities | 0 | 0.0% |
| Total | 80 | 100.0% |
Transportation & Commute in Gratis
Vehicle Availability by Sex in Gratis
The most prevalent vehicle ownership categories in Gratis are males with 2 vehicles (110, accounting for 53.1%) and females with 2 vehicles (68, making up 96.5%).
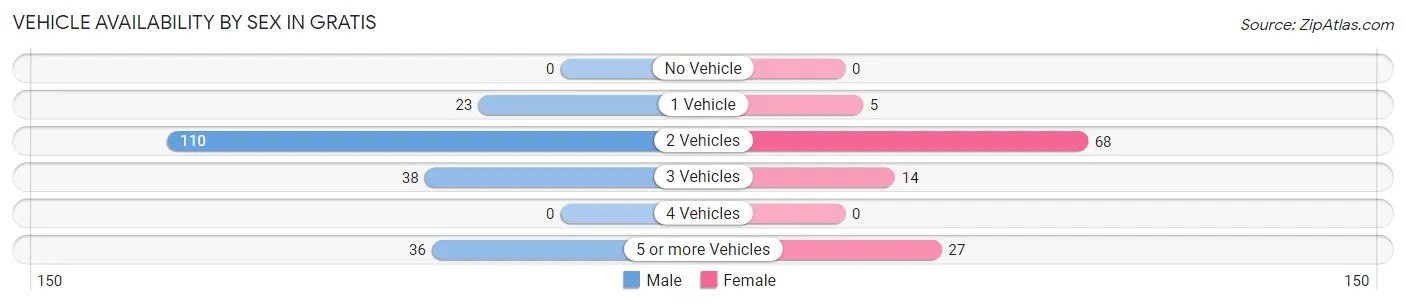
| Vehicles Available | Male | Female |
| No Vehicle | 0 (0.0%) | 0 (0.0%) |
| 1 Vehicle | 23 (11.1%) | 5 (4.4%) |
| 2 Vehicles | 110 (53.1%) | 68 (59.7%) |
| 3 Vehicles | 38 (18.4%) | 14 (12.3%) |
| 4 Vehicles | 0 (0.0%) | 0 (0.0%) |
| 5 or more Vehicles | 36 (17.4%) | 27 (23.7%) |
| Total | 207 (100.0%) | 114 (100.0%) |
Commute Time in Gratis
The most frequently occuring commute durations in Gratis are 45 to 59 minutes (62 commuters, 19.5%), 30 to 34 minutes (56 commuters, 17.6%), and 20 to 24 minutes (55 commuters, 17.3%).
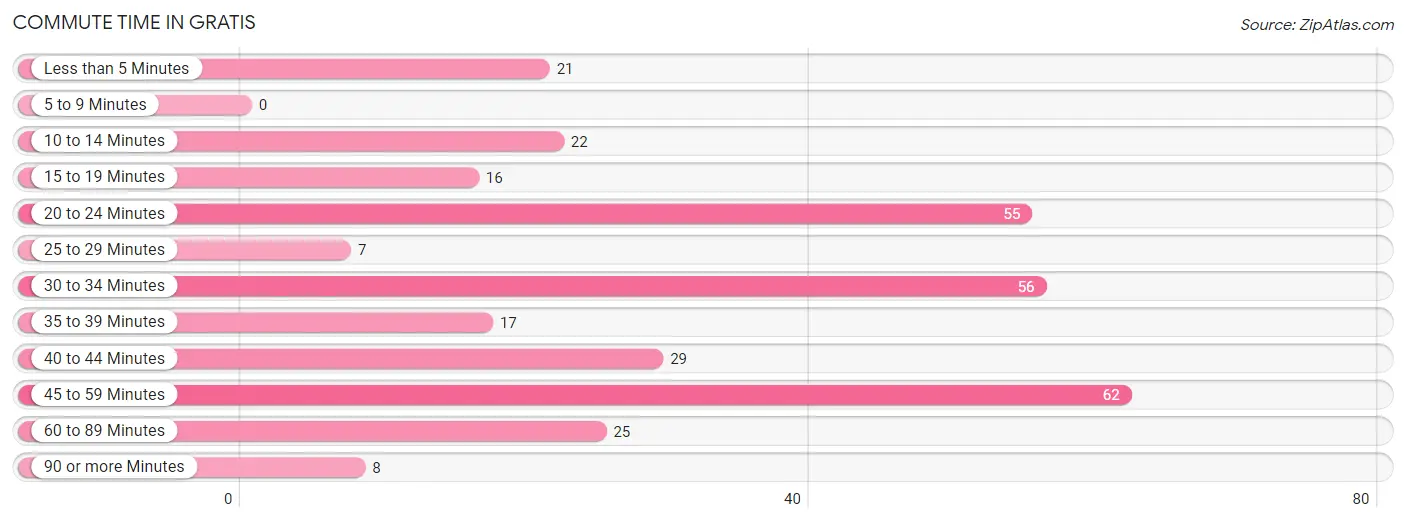
| Commute Time | # Commuters | % Commuters |
| Less than 5 Minutes | 21 | 6.6% |
| 5 to 9 Minutes | 0 | 0.0% |
| 10 to 14 Minutes | 22 | 6.9% |
| 15 to 19 Minutes | 16 | 5.0% |
| 20 to 24 Minutes | 55 | 17.3% |
| 25 to 29 Minutes | 7 | 2.2% |
| 30 to 34 Minutes | 56 | 17.6% |
| 35 to 39 Minutes | 17 | 5.3% |
| 40 to 44 Minutes | 29 | 9.1% |
| 45 to 59 Minutes | 62 | 19.5% |
| 60 to 89 Minutes | 25 | 7.9% |
| 90 or more Minutes | 8 | 2.5% |
Commute Time by Sex in Gratis
The most common commute times in Gratis are 20 to 24 minutes (52 commuters, 25.2%) for males and 30 to 34 minutes (37 commuters, 33.0%) for females.
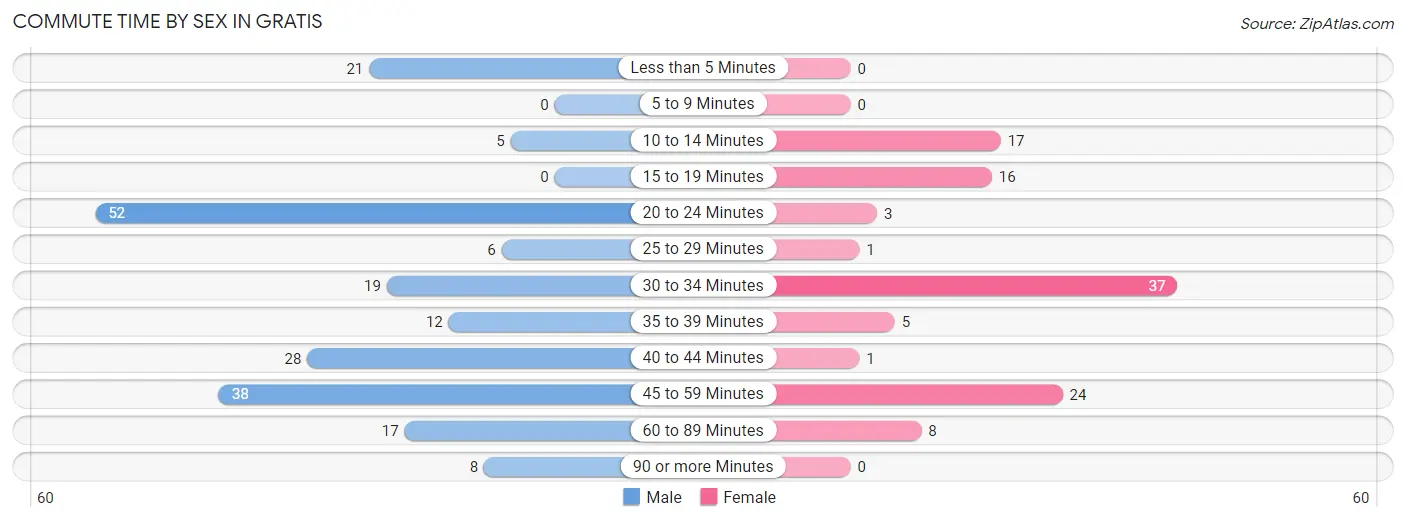
| Commute Time | Male | Female |
| Less than 5 Minutes | 21 (10.2%) | 0 (0.0%) |
| 5 to 9 Minutes | 0 (0.0%) | 0 (0.0%) |
| 10 to 14 Minutes | 5 (2.4%) | 17 (15.2%) |
| 15 to 19 Minutes | 0 (0.0%) | 16 (14.3%) |
| 20 to 24 Minutes | 52 (25.2%) | 3 (2.7%) |
| 25 to 29 Minutes | 6 (2.9%) | 1 (0.9%) |
| 30 to 34 Minutes | 19 (9.2%) | 37 (33.0%) |
| 35 to 39 Minutes | 12 (5.8%) | 5 (4.5%) |
| 40 to 44 Minutes | 28 (13.6%) | 1 (0.9%) |
| 45 to 59 Minutes | 38 (18.4%) | 24 (21.4%) |
| 60 to 89 Minutes | 17 (8.3%) | 8 (7.1%) |
| 90 or more Minutes | 8 (3.9%) | 0 (0.0%) |
Time of Departure to Work by Sex in Gratis
The most frequent times of departure to work in Gratis are 7:00 AM to 7:29 AM (46, 22.3%) for males and 9:00 AM to 9:59 AM (24, 21.4%) for females.
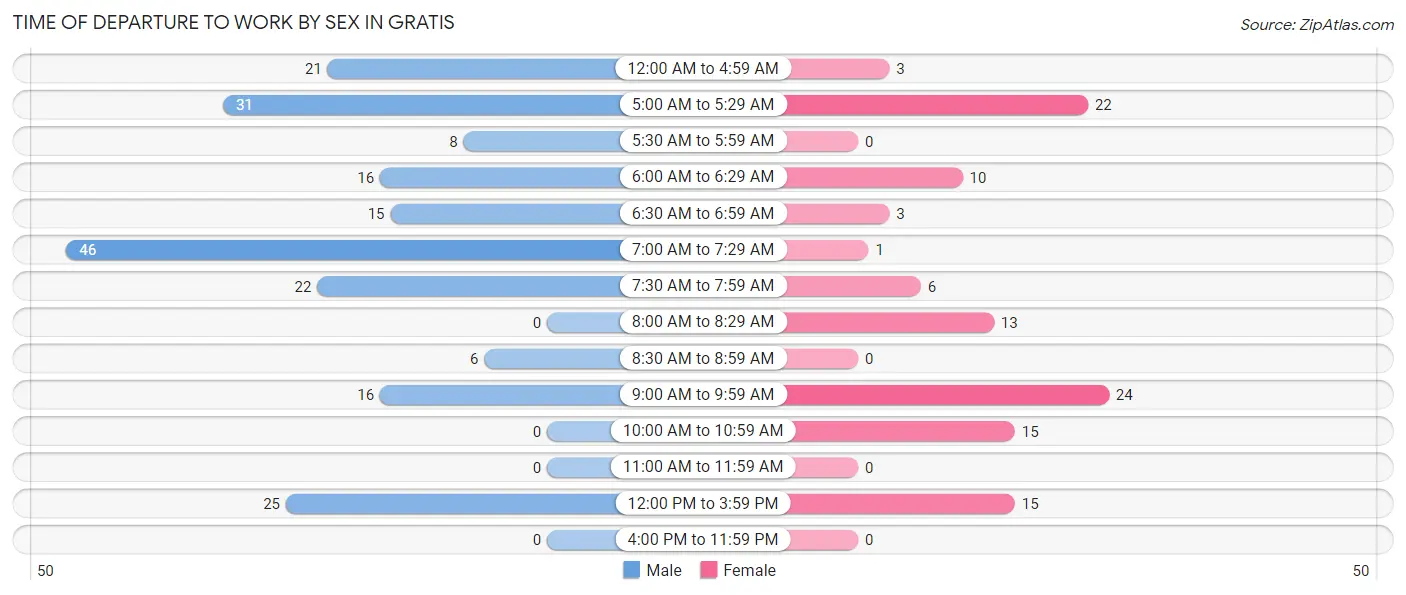
| Time of Departure | Male | Female |
| 12:00 AM to 4:59 AM | 21 (10.2%) | 3 (2.7%) |
| 5:00 AM to 5:29 AM | 31 (15.0%) | 22 (19.6%) |
| 5:30 AM to 5:59 AM | 8 (3.9%) | 0 (0.0%) |
| 6:00 AM to 6:29 AM | 16 (7.8%) | 10 (8.9%) |
| 6:30 AM to 6:59 AM | 15 (7.3%) | 3 (2.7%) |
| 7:00 AM to 7:29 AM | 46 (22.3%) | 1 (0.9%) |
| 7:30 AM to 7:59 AM | 22 (10.7%) | 6 (5.4%) |
| 8:00 AM to 8:29 AM | 0 (0.0%) | 13 (11.6%) |
| 8:30 AM to 8:59 AM | 6 (2.9%) | 0 (0.0%) |
| 9:00 AM to 9:59 AM | 16 (7.8%) | 24 (21.4%) |
| 10:00 AM to 10:59 AM | 0 (0.0%) | 15 (13.4%) |
| 11:00 AM to 11:59 AM | 0 (0.0%) | 0 (0.0%) |
| 12:00 PM to 3:59 PM | 25 (12.1%) | 15 (13.4%) |
| 4:00 PM to 11:59 PM | 0 (0.0%) | 0 (0.0%) |
| Total | 206 (100.0%) | 112 (100.0%) |
Housing Occupancy in Gratis
Occupancy by Ownership in Gratis
Of the total 288 dwellings in Gratis, owner-occupied units account for 248 (86.1%), while renter-occupied units make up 40 (13.9%).
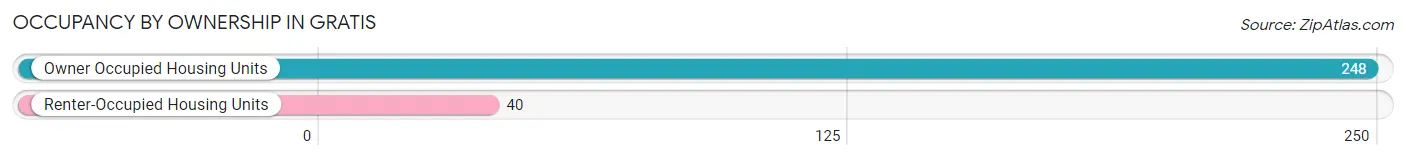
| Occupancy | # Housing Units | % Housing Units |
| Owner Occupied Housing Units | 248 | 86.1% |
| Renter-Occupied Housing Units | 40 | 13.9% |
| Total Occupied Housing Units | 288 | 100.0% |
Occupancy by Household Size in Gratis
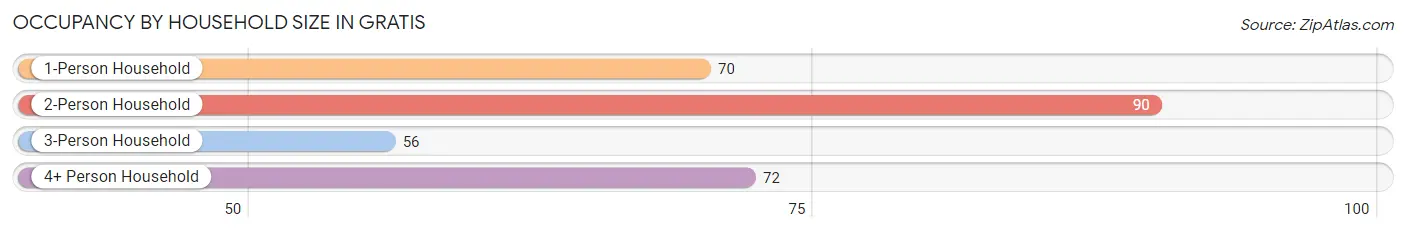
| Household Size | # Housing Units | % Housing Units |
| 1-Person Household | 70 | 24.3% |
| 2-Person Household | 90 | 31.2% |
| 3-Person Household | 56 | 19.4% |
| 4+ Person Household | 72 | 25.0% |
| Total Housing Units | 288 | 100.0% |
Occupancy by Ownership by Household Size in Gratis
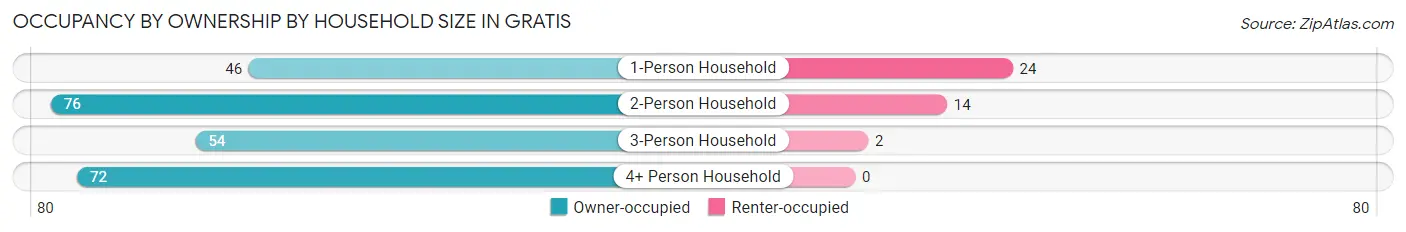
| Household Size | Owner-occupied | Renter-occupied |
| 1-Person Household | 46 (65.7%) | 24 (34.3%) |
| 2-Person Household | 76 (84.4%) | 14 (15.6%) |
| 3-Person Household | 54 (96.4%) | 2 (3.6%) |
| 4+ Person Household | 72 (100.0%) | 0 (0.0%) |
| Total Housing Units | 248 (86.1%) | 40 (13.9%) |
Occupancy by Educational Attainment in Gratis
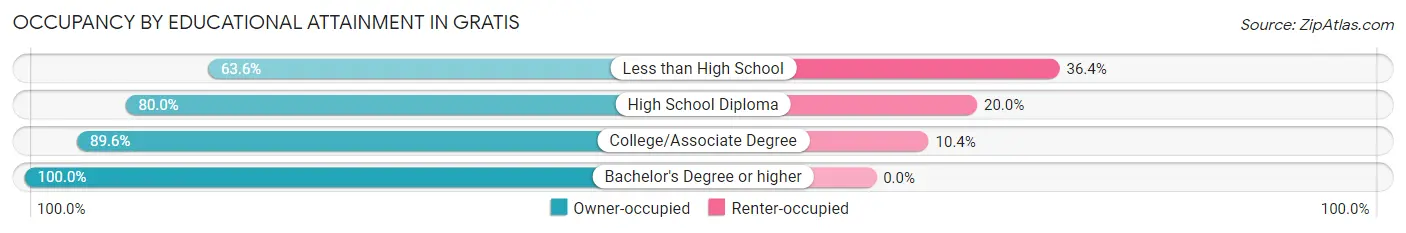
| Household Size | Owner-occupied | Renter-occupied |
| Less than High School | 7 (63.6%) | 4 (36.4%) |
| High School Diploma | 92 (80.0%) | 23 (20.0%) |
| College/Associate Degree | 112 (89.6%) | 13 (10.4%) |
| Bachelor's Degree or higher | 37 (100.0%) | 0 (0.0%) |
Occupancy by Age of Householder in Gratis
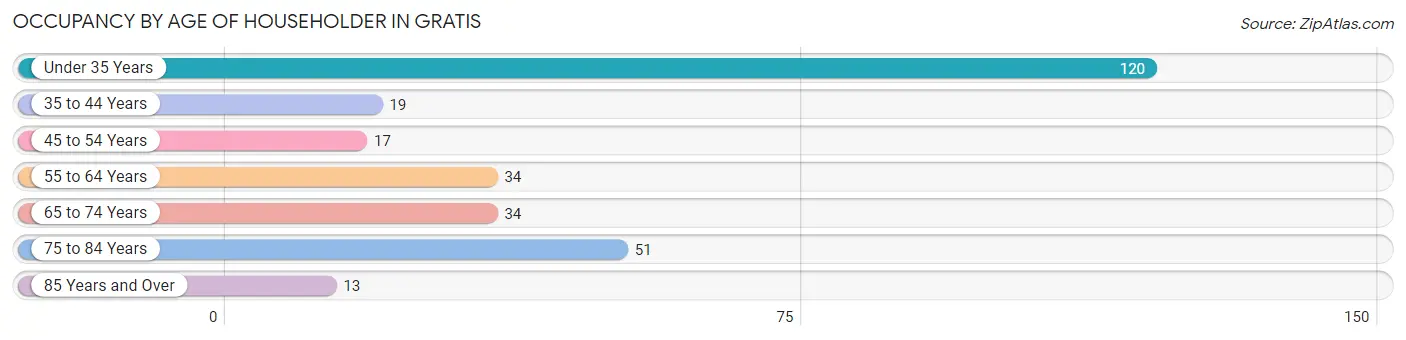
| Age Bracket | # Households | % Households |
| Under 35 Years | 120 | 41.7% |
| 35 to 44 Years | 19 | 6.6% |
| 45 to 54 Years | 17 | 5.9% |
| 55 to 64 Years | 34 | 11.8% |
| 65 to 74 Years | 34 | 11.8% |
| 75 to 84 Years | 51 | 17.7% |
| 85 Years and Over | 13 | 4.5% |
| Total | 288 | 100.0% |
Housing Finances in Gratis
Median Income by Occupancy in Gratis
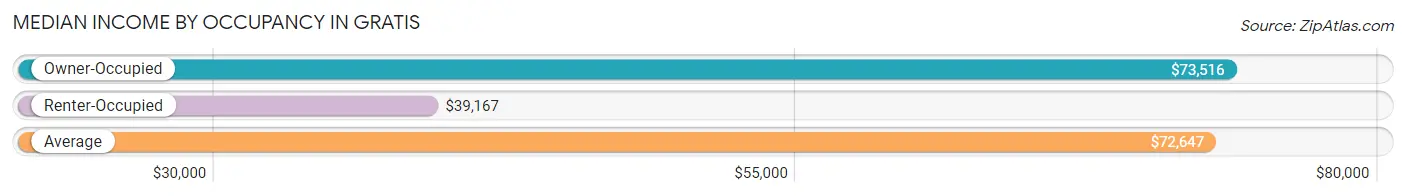
| Occupancy Type | # Households | Median Income |
| Owner-Occupied | 248 (86.1%) | $73,516 |
| Renter-Occupied | 40 (13.9%) | $39,167 |
| Average | 288 (100.0%) | $72,647 |
Occupancy by Householder Income Bracket in Gratis
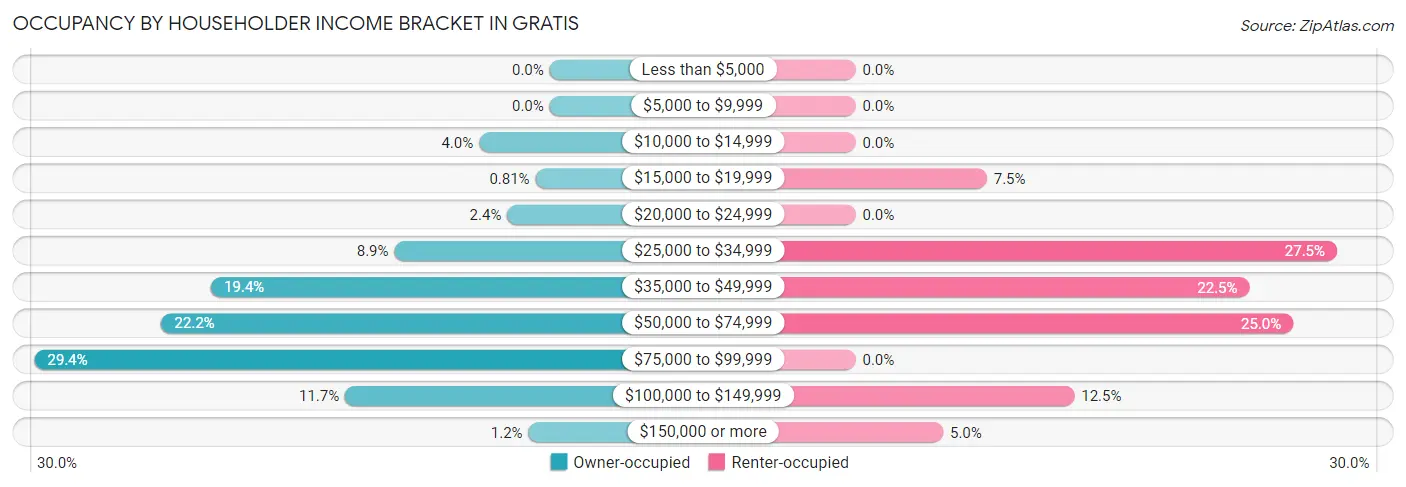
| Income Bracket | Owner-occupied | Renter-occupied |
| Less than $5,000 | 0 (0.0%) | 0 (0.0%) |
| $5,000 to $9,999 | 0 (0.0%) | 0 (0.0%) |
| $10,000 to $14,999 | 10 (4.0%) | 0 (0.0%) |
| $15,000 to $19,999 | 2 (0.8%) | 3 (7.5%) |
| $20,000 to $24,999 | 6 (2.4%) | 0 (0.0%) |
| $25,000 to $34,999 | 22 (8.9%) | 11 (27.5%) |
| $35,000 to $49,999 | 48 (19.4%) | 9 (22.5%) |
| $50,000 to $74,999 | 55 (22.2%) | 10 (25.0%) |
| $75,000 to $99,999 | 73 (29.4%) | 0 (0.0%) |
| $100,000 to $149,999 | 29 (11.7%) | 5 (12.5%) |
| $150,000 or more | 3 (1.2%) | 2 (5.0%) |
| Total | 248 (100.0%) | 40 (100.0%) |
Monthly Housing Cost Tiers in Gratis
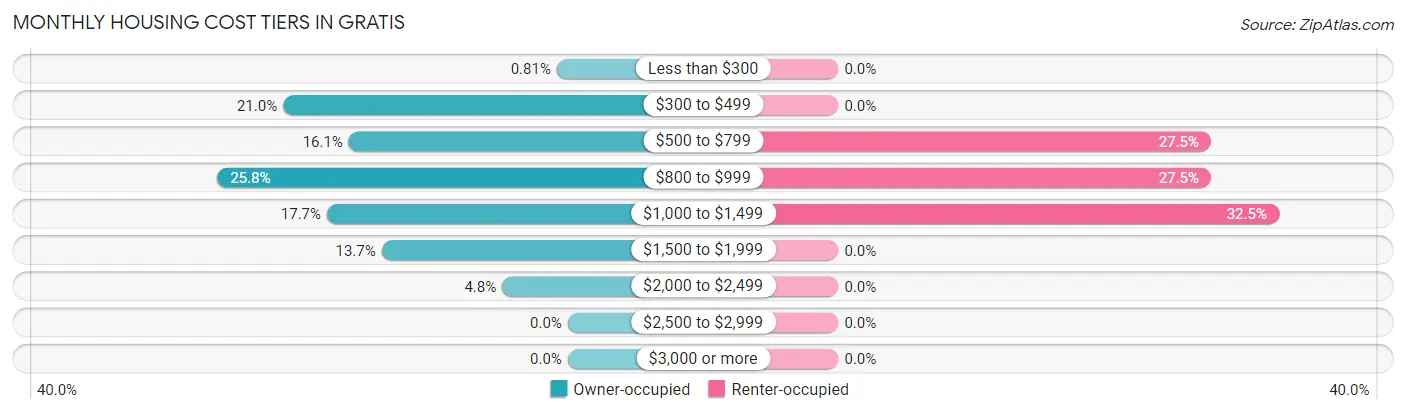
| Monthly Cost | Owner-occupied | Renter-occupied |
| Less than $300 | 2 (0.8%) | 0 (0.0%) |
| $300 to $499 | 52 (21.0%) | 0 (0.0%) |
| $500 to $799 | 40 (16.1%) | 11 (27.5%) |
| $800 to $999 | 64 (25.8%) | 11 (27.5%) |
| $1,000 to $1,499 | 44 (17.7%) | 13 (32.5%) |
| $1,500 to $1,999 | 34 (13.7%) | 0 (0.0%) |
| $2,000 to $2,499 | 12 (4.8%) | 0 (0.0%) |
| $2,500 to $2,999 | 0 (0.0%) | 0 (0.0%) |
| $3,000 or more | 0 (0.0%) | 0 (0.0%) |
| Total | 248 (100.0%) | 40 (100.0%) |
Physical Housing Characteristics in Gratis
Housing Structures in Gratis
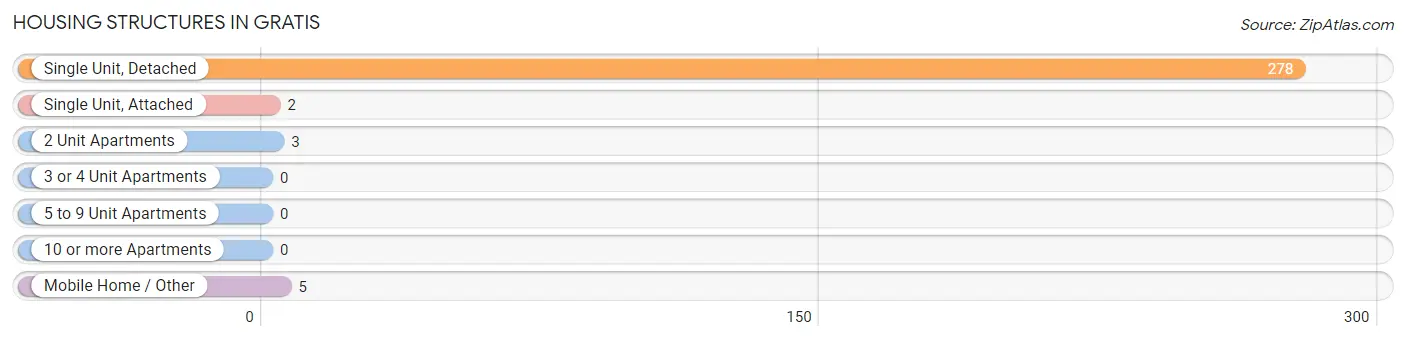
| Structure Type | # Housing Units | % Housing Units |
| Single Unit, Detached | 278 | 96.5% |
| Single Unit, Attached | 2 | 0.7% |
| 2 Unit Apartments | 3 | 1.0% |
| 3 or 4 Unit Apartments | 0 | 0.0% |
| 5 to 9 Unit Apartments | 0 | 0.0% |
| 10 or more Apartments | 0 | 0.0% |
| Mobile Home / Other | 5 | 1.7% |
| Total | 288 | 100.0% |
Housing Structures by Occupancy in Gratis
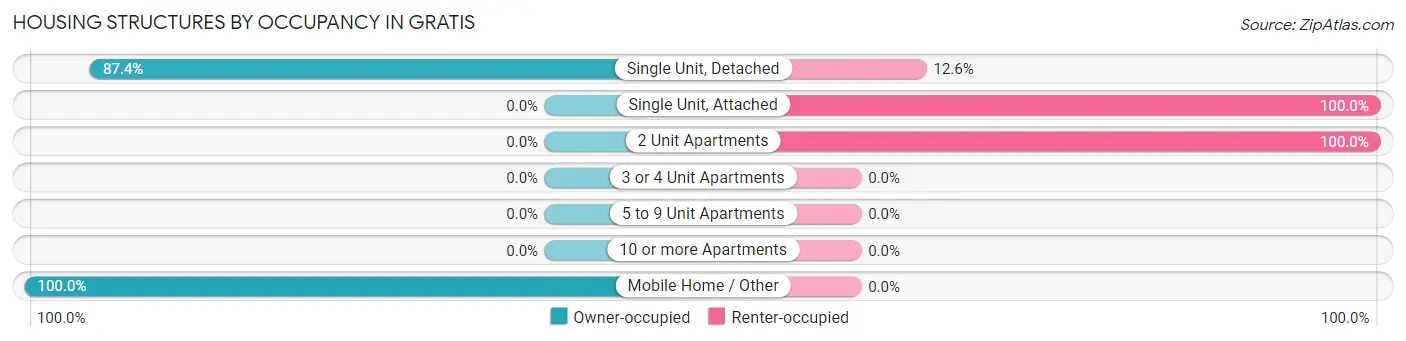
| Structure Type | Owner-occupied | Renter-occupied |
| Single Unit, Detached | 243 (87.4%) | 35 (12.6%) |
| Single Unit, Attached | 0 (0.0%) | 2 (100.0%) |
| 2 Unit Apartments | 0 (0.0%) | 3 (100.0%) |
| 3 or 4 Unit Apartments | 0 (0.0%) | 0 (0.0%) |
| 5 to 9 Unit Apartments | 0 (0.0%) | 0 (0.0%) |
| 10 or more Apartments | 0 (0.0%) | 0 (0.0%) |
| Mobile Home / Other | 5 (100.0%) | 0 (0.0%) |
| Total | 248 (86.1%) | 40 (13.9%) |
Housing Structures by Number of Rooms in Gratis
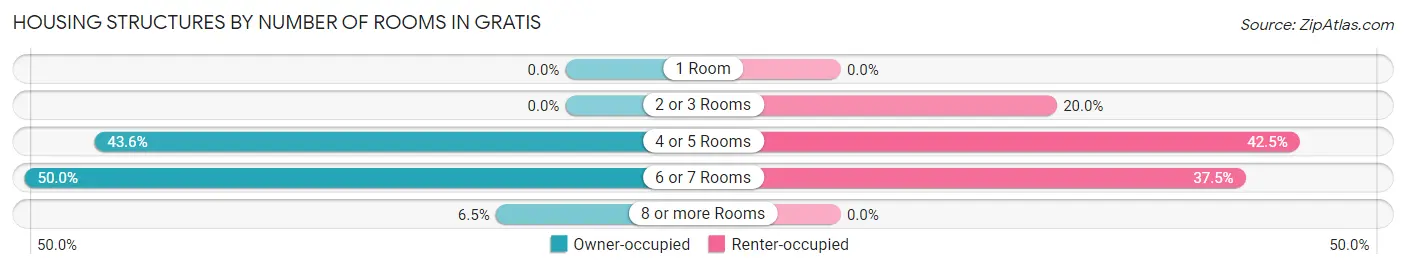
| Number of Rooms | Owner-occupied | Renter-occupied |
| 1 Room | 0 (0.0%) | 0 (0.0%) |
| 2 or 3 Rooms | 0 (0.0%) | 8 (20.0%) |
| 4 or 5 Rooms | 108 (43.5%) | 17 (42.5%) |
| 6 or 7 Rooms | 124 (50.0%) | 15 (37.5%) |
| 8 or more Rooms | 16 (6.5%) | 0 (0.0%) |
| Total | 248 (100.0%) | 40 (100.0%) |
Housing Structure by Heating Type in Gratis
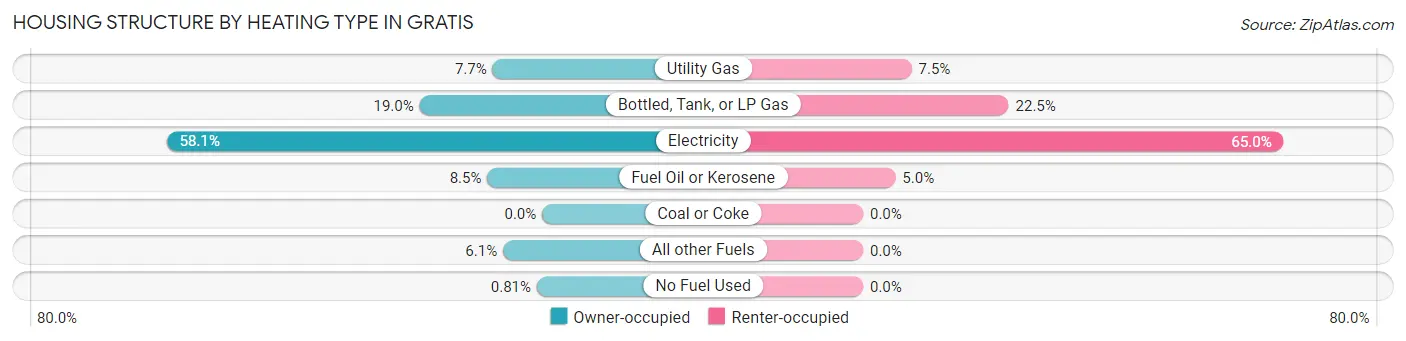
| Heating Type | Owner-occupied | Renter-occupied |
| Utility Gas | 19 (7.7%) | 3 (7.5%) |
| Bottled, Tank, or LP Gas | 47 (19.0%) | 9 (22.5%) |
| Electricity | 144 (58.1%) | 26 (65.0%) |
| Fuel Oil or Kerosene | 21 (8.5%) | 2 (5.0%) |
| Coal or Coke | 0 (0.0%) | 0 (0.0%) |
| All other Fuels | 15 (6.0%) | 0 (0.0%) |
| No Fuel Used | 2 (0.8%) | 0 (0.0%) |
| Total | 248 (100.0%) | 40 (100.0%) |
Household Vehicle Usage in Gratis
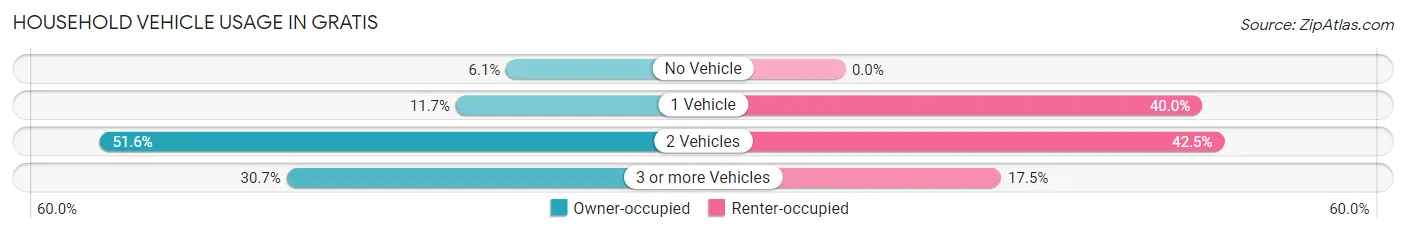
| Vehicles per Household | Owner-occupied | Renter-occupied |
| No Vehicle | 15 (6.0%) | 0 (0.0%) |
| 1 Vehicle | 29 (11.7%) | 16 (40.0%) |
| 2 Vehicles | 128 (51.6%) | 17 (42.5%) |
| 3 or more Vehicles | 76 (30.6%) | 7 (17.5%) |
| Total | 248 (100.0%) | 40 (100.0%) |
Real Estate & Mortgages in Gratis
Real Estate and Mortgage Overview in Gratis
| Characteristic | Without Mortgage | With Mortgage |
| Housing Units | 111 | 137 |
| Median Property Value | $102,500 | $116,200 |
| Median Household Income | $78,177 | $3 |
| Monthly Housing Costs | $506 | $0 |
| Real Estate Taxes | $1,246 | $9 |
Property Value by Mortgage Status in Gratis
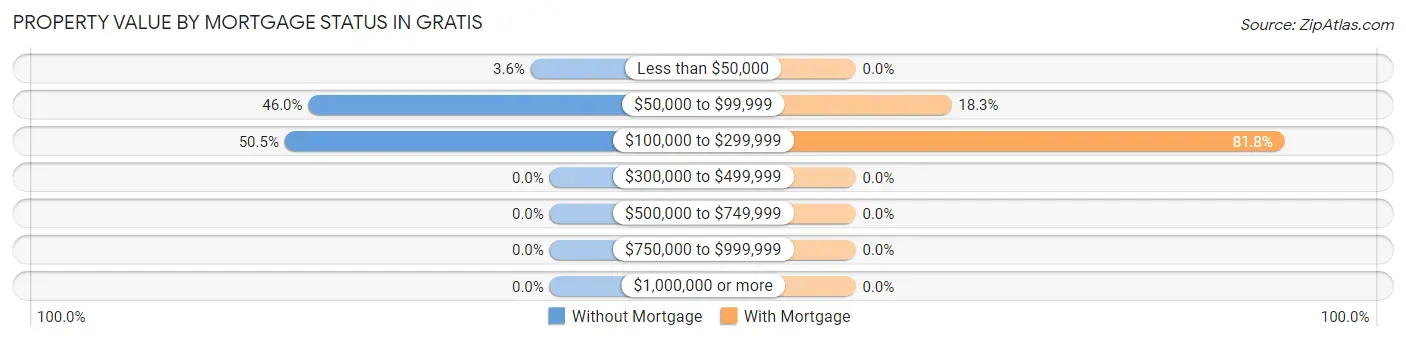
| Property Value | Without Mortgage | With Mortgage |
| Less than $50,000 | 4 (3.6%) | 0 (0.0%) |
| $50,000 to $99,999 | 51 (46.0%) | 25 (18.2%) |
| $100,000 to $299,999 | 56 (50.4%) | 112 (81.8%) |
| $300,000 to $499,999 | 0 (0.0%) | 0 (0.0%) |
| $500,000 to $749,999 | 0 (0.0%) | 0 (0.0%) |
| $750,000 to $999,999 | 0 (0.0%) | 0 (0.0%) |
| $1,000,000 or more | 0 (0.0%) | 0 (0.0%) |
| Total | 111 (100.0%) | 137 (100.0%) |
Household Income by Mortgage Status in Gratis
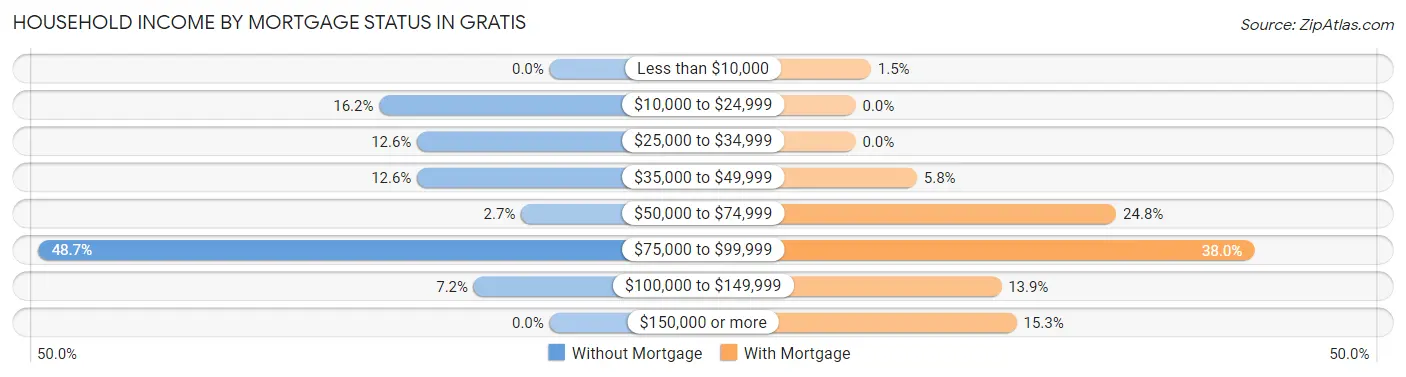
| Household Income | Without Mortgage | With Mortgage |
| Less than $10,000 | 0 (0.0%) | 2 (1.5%) |
| $10,000 to $24,999 | 18 (16.2%) | 0 (0.0%) |
| $25,000 to $34,999 | 14 (12.6%) | 0 (0.0%) |
| $35,000 to $49,999 | 14 (12.6%) | 8 (5.8%) |
| $50,000 to $74,999 | 3 (2.7%) | 34 (24.8%) |
| $75,000 to $99,999 | 54 (48.6%) | 52 (38.0%) |
| $100,000 to $149,999 | 8 (7.2%) | 19 (13.9%) |
| $150,000 or more | 0 (0.0%) | 21 (15.3%) |
| Total | 111 (100.0%) | 137 (100.0%) |
Property Value to Household Income Ratio in Gratis
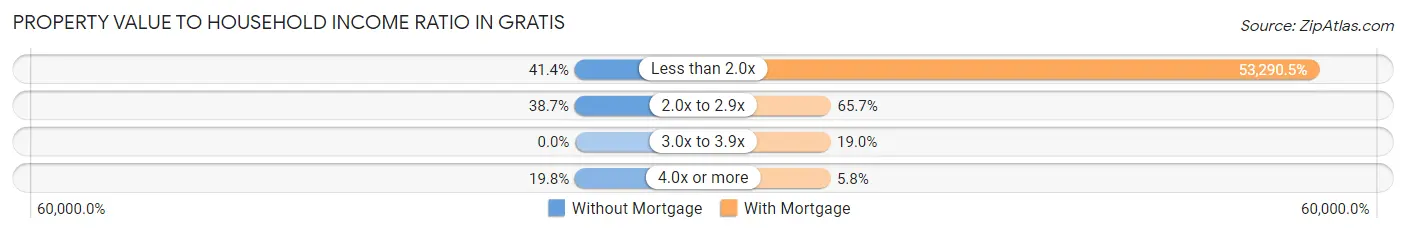
| Value-to-Income Ratio | Without Mortgage | With Mortgage |
| Less than 2.0x | 46 (41.4%) | 73,008 (53,290.5%) |
| 2.0x to 2.9x | 43 (38.7%) | 90 (65.7%) |
| 3.0x to 3.9x | 0 (0.0%) | 26 (19.0%) |
| 4.0x or more | 22 (19.8%) | 8 (5.8%) |
| Total | 111 (100.0%) | 137 (100.0%) |
Real Estate Taxes by Mortgage Status in Gratis
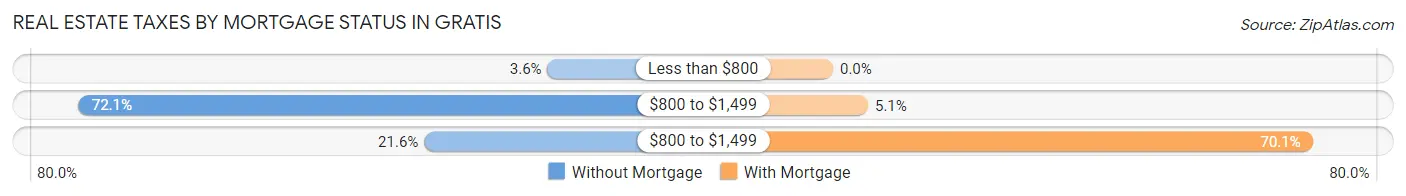
| Property Taxes | Without Mortgage | With Mortgage |
| Less than $800 | 4 (3.6%) | 0 (0.0%) |
| $800 to $1,499 | 80 (72.1%) | 7 (5.1%) |
| $800 to $1,499 | 24 (21.6%) | 96 (70.1%) |
| Total | 111 (100.0%) | 137 (100.0%) |
Health & Disability in Gratis
Health Insurance Coverage by Age in Gratis
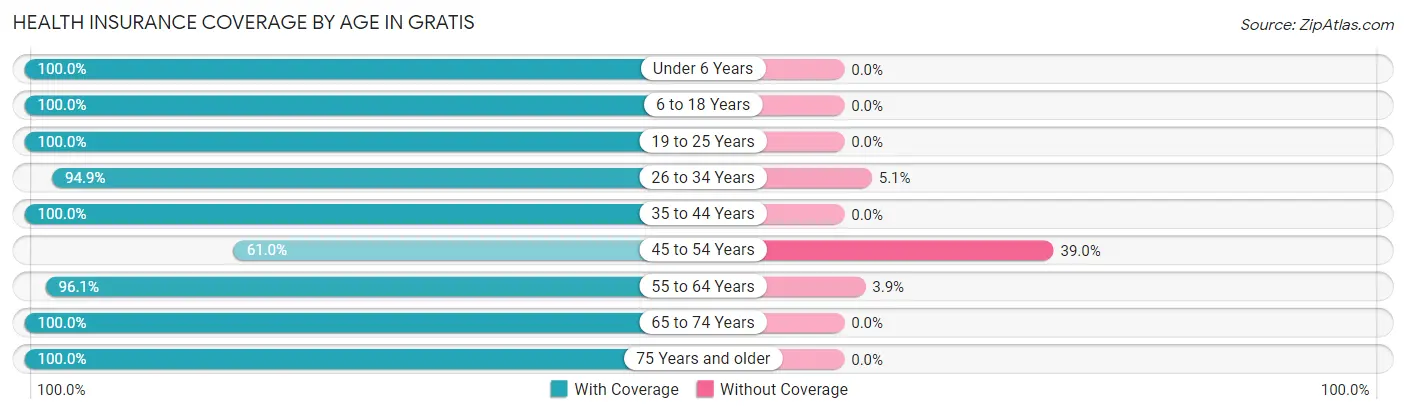
| Age Bracket | With Coverage | Without Coverage |
| Under 6 Years | 104 (100.0%) | 0 (0.0%) |
| 6 to 18 Years | 61 (100.0%) | 0 (0.0%) |
| 19 to 25 Years | 53 (100.0%) | 0 (0.0%) |
| 26 to 34 Years | 148 (94.9%) | 8 (5.1%) |
| 35 to 44 Years | 76 (100.0%) | 0 (0.0%) |
| 45 to 54 Years | 25 (61.0%) | 16 (39.0%) |
| 55 to 64 Years | 49 (96.1%) | 2 (3.9%) |
| 65 to 74 Years | 87 (100.0%) | 0 (0.0%) |
| 75 Years and older | 74 (100.0%) | 0 (0.0%) |
| Total | 677 (96.3%) | 26 (3.7%) |
Health Insurance Coverage by Citizenship Status in Gratis
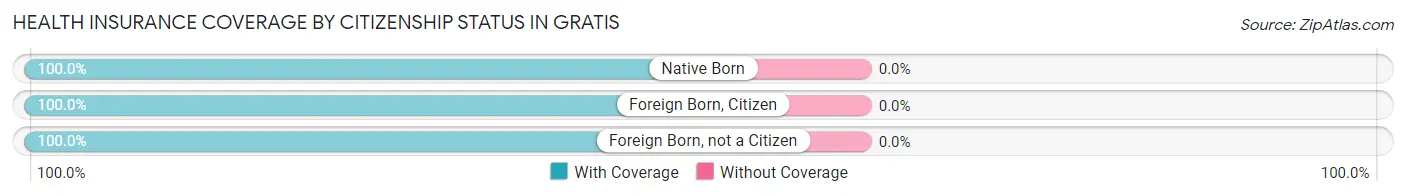
| Citizenship Status | With Coverage | Without Coverage |
| Native Born | 104 (100.0%) | 0 (0.0%) |
| Foreign Born, Citizen | 61 (100.0%) | 0 (0.0%) |
| Foreign Born, not a Citizen | 53 (100.0%) | 0 (0.0%) |
Health Insurance Coverage by Household Income in Gratis
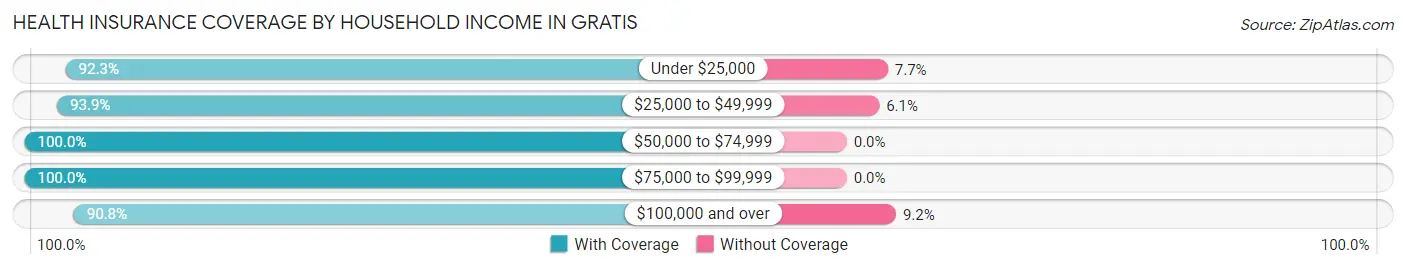
| Household Income | With Coverage | Without Coverage |
| Under $25,000 | 24 (92.3%) | 2 (7.7%) |
| $25,000 to $49,999 | 170 (93.9%) | 11 (6.1%) |
| $50,000 to $74,999 | 173 (100.0%) | 0 (0.0%) |
| $75,000 to $99,999 | 161 (100.0%) | 0 (0.0%) |
| $100,000 and over | 128 (90.8%) | 13 (9.2%) |
Public vs Private Health Insurance Coverage by Age in Gratis
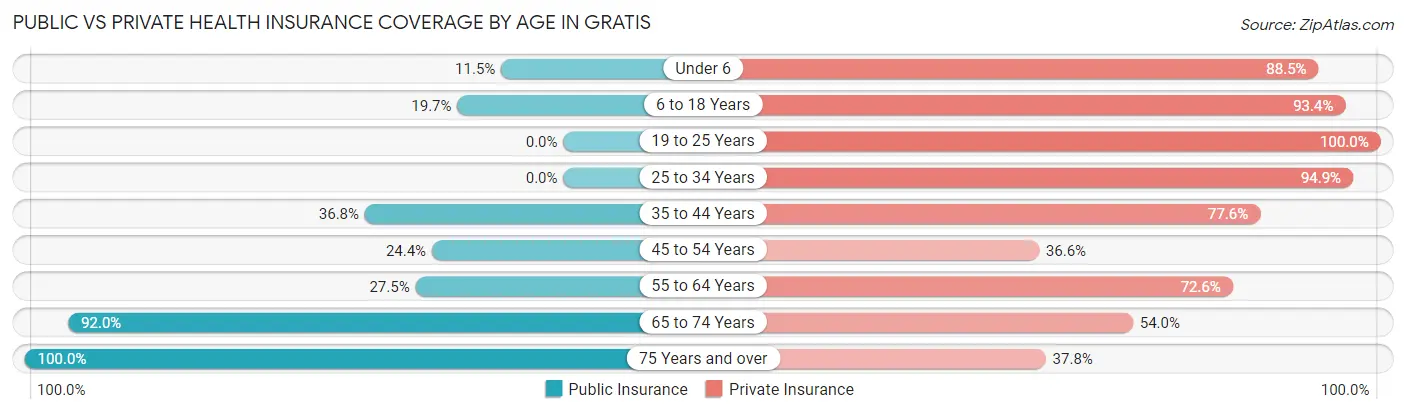
| Age Bracket | Public Insurance | Private Insurance |
| Under 6 | 12 (11.5%) | 92 (88.5%) |
| 6 to 18 Years | 12 (19.7%) | 57 (93.4%) |
| 19 to 25 Years | 0 (0.0%) | 53 (100.0%) |
| 25 to 34 Years | 0 (0.0%) | 148 (94.9%) |
| 35 to 44 Years | 28 (36.8%) | 59 (77.6%) |
| 45 to 54 Years | 10 (24.4%) | 15 (36.6%) |
| 55 to 64 Years | 14 (27.5%) | 37 (72.6%) |
| 65 to 74 Years | 80 (91.9%) | 47 (54.0%) |
| 75 Years and over | 74 (100.0%) | 28 (37.8%) |
| Total | 230 (32.7%) | 536 (76.2%) |
Disability Status by Sex by Age in Gratis
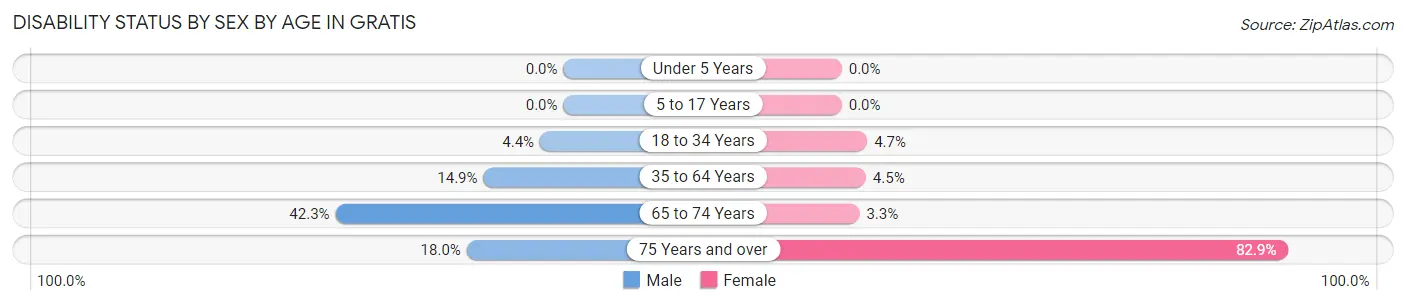
| Age Bracket | Male | Female |
| Under 5 Years | 0 (0.0%) | 0 (0.0%) |
| 5 to 17 Years | 0 (0.0%) | 0 (0.0%) |
| 18 to 34 Years | 5 (4.3%) | 5 (4.7%) |
| 35 to 64 Years | 15 (14.8%) | 3 (4.5%) |
| 65 to 74 Years | 11 (42.3%) | 2 (3.3%) |
| 75 Years and over | 7 (17.9%) | 29 (82.9%) |
Disability Class by Sex by Age in Gratis
Disability Class: Hearing Difficulty
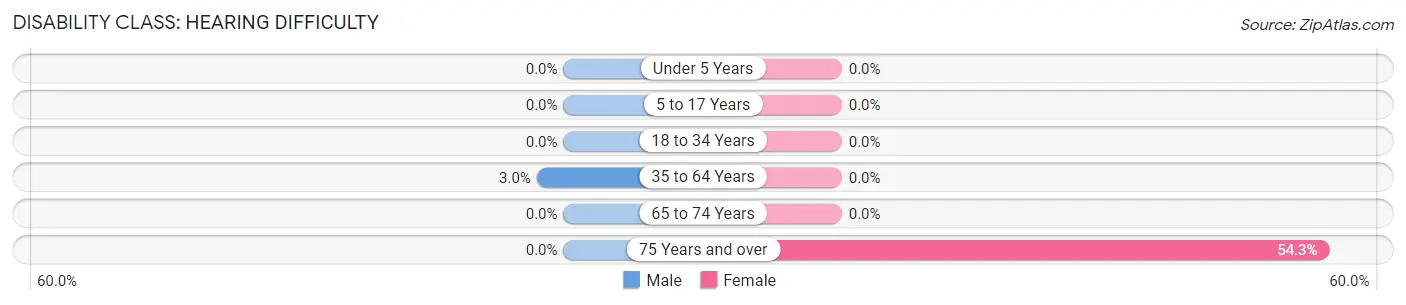
| Age Bracket | Male | Female |
| Under 5 Years | 0 (0.0%) | 0 (0.0%) |
| 5 to 17 Years | 0 (0.0%) | 0 (0.0%) |
| 18 to 34 Years | 0 (0.0%) | 0 (0.0%) |
| 35 to 64 Years | 3 (3.0%) | 0 (0.0%) |
| 65 to 74 Years | 0 (0.0%) | 0 (0.0%) |
| 75 Years and over | 0 (0.0%) | 19 (54.3%) |
Disability Class: Vision Difficulty
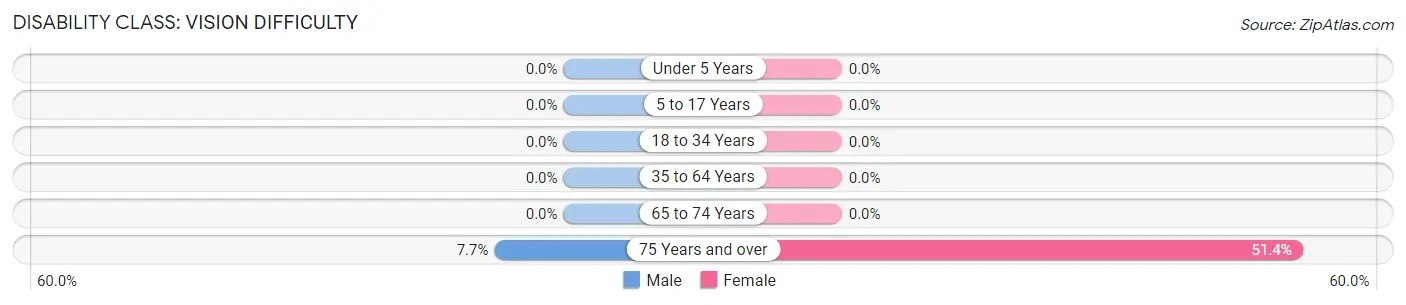
| Age Bracket | Male | Female |
| Under 5 Years | 0 (0.0%) | 0 (0.0%) |
| 5 to 17 Years | 0 (0.0%) | 0 (0.0%) |
| 18 to 34 Years | 0 (0.0%) | 0 (0.0%) |
| 35 to 64 Years | 0 (0.0%) | 0 (0.0%) |
| 65 to 74 Years | 0 (0.0%) | 0 (0.0%) |
| 75 Years and over | 3 (7.7%) | 18 (51.4%) |
Disability Class: Cognitive Difficulty
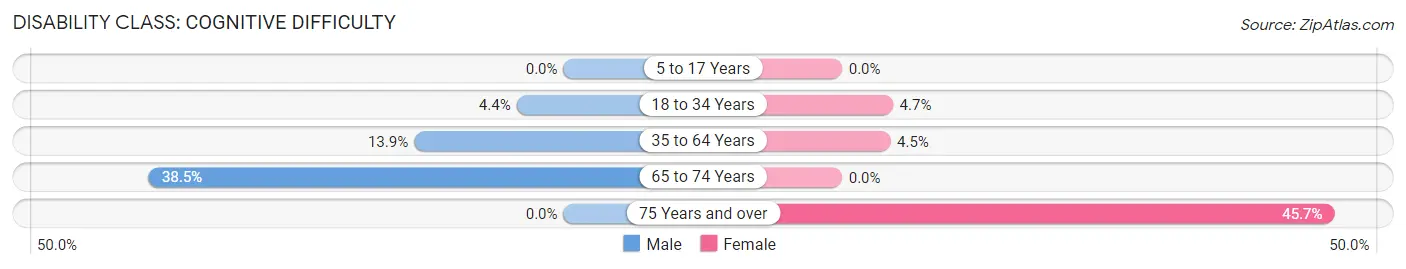
| Age Bracket | Male | Female |
| 5 to 17 Years | 0 (0.0%) | 0 (0.0%) |
| 18 to 34 Years | 5 (4.3%) | 5 (4.7%) |
| 35 to 64 Years | 14 (13.9%) | 3 (4.5%) |
| 65 to 74 Years | 10 (38.5%) | 0 (0.0%) |
| 75 Years and over | 0 (0.0%) | 16 (45.7%) |
Disability Class: Ambulatory Difficulty
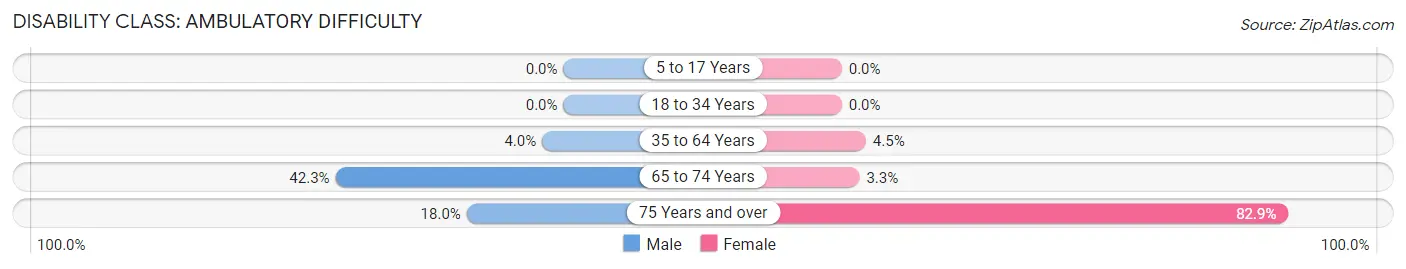
| Age Bracket | Male | Female |
| 5 to 17 Years | 0 (0.0%) | 0 (0.0%) |
| 18 to 34 Years | 0 (0.0%) | 0 (0.0%) |
| 35 to 64 Years | 4 (4.0%) | 3 (4.5%) |
| 65 to 74 Years | 11 (42.3%) | 2 (3.3%) |
| 75 Years and over | 7 (17.9%) | 29 (82.9%) |
Disability Class: Self-Care Difficulty
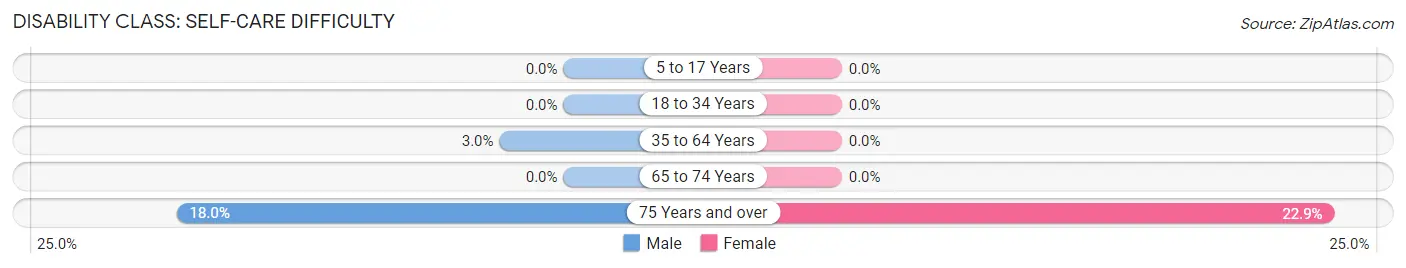
| Age Bracket | Male | Female |
| 5 to 17 Years | 0 (0.0%) | 0 (0.0%) |
| 18 to 34 Years | 0 (0.0%) | 0 (0.0%) |
| 35 to 64 Years | 3 (3.0%) | 0 (0.0%) |
| 65 to 74 Years | 0 (0.0%) | 0 (0.0%) |
| 75 Years and over | 7 (17.9%) | 8 (22.9%) |
Technology Access in Gratis
Computing Device Access in Gratis
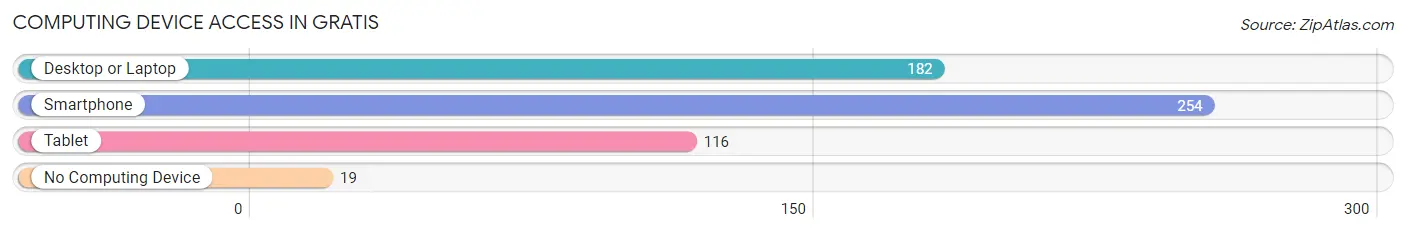
| Device Type | # Households | % Households |
| Desktop or Laptop | 182 | 63.2% |
| Smartphone | 254 | 88.2% |
| Tablet | 116 | 40.3% |
| No Computing Device | 19 | 6.6% |
| Total | 288 | 100.0% |
Internet Access in Gratis
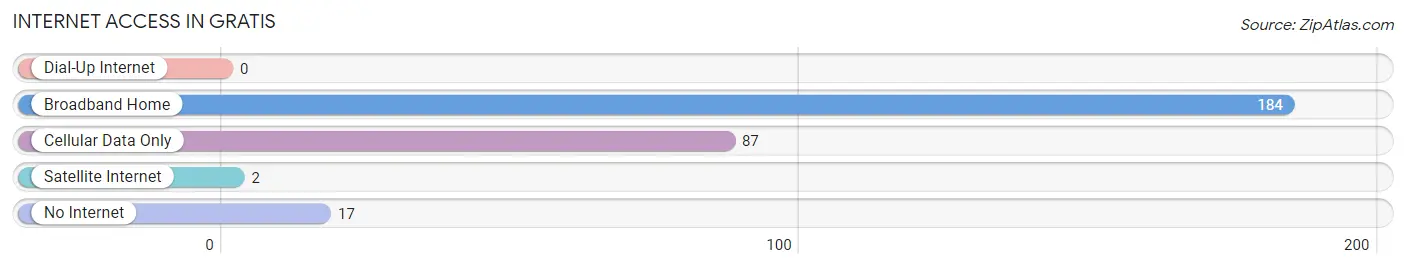
| Internet Type | # Households | % Households |
| Dial-Up Internet | 0 | 0.0% |
| Broadband Home | 184 | 63.9% |
| Cellular Data Only | 87 | 30.2% |
| Satellite Internet | 2 | 0.7% |
| No Internet | 17 | 5.9% |
| Total | 288 | 100.0% |
Gratis Summary
OH History
Ohio is a state located in the Midwestern United States. It is the 34th largest state in the country and the 7th most populous. Ohio was the 17th state to join the Union on March 1, 1803. The state was named after the Ohio River, which was named by the Iroquois word for “great river.” Ohio has a rich history that dates back to the Native American tribes that inhabited the area before European settlers arrived. The first Europeans to explore the area were French fur traders in the late 1600s. The British gained control of the area in the 1760s and the American Revolution began in 1776. Ohio was part of the Northwest Territory and was admitted to the Union in 1803.
Ohio played an important role in the Civil War. It was a major supplier of troops and supplies to the Union army. After the war, Ohio became an important industrial center. The state was home to many of the nation’s leading industrialists, including John D. Rockefeller and Andrew Carnegie. Ohio was also a major center of the labor movement in the late 19th and early 20th centuries.
Ohio has a diverse economy that includes manufacturing, agriculture, finance, and technology. The state is home to several Fortune 500 companies, including Procter & Gamble, Marathon Petroleum, and Kroger. Ohio is also home to several major universities, including Ohio State University, University of Cincinnati, and Case Western Reserve University.
OH Geography
Ohio is located in the Midwestern United States. It is bordered by Michigan to the north, Pennsylvania to the east, West Virginia to the southeast, Kentucky to the southwest, and Indiana to the west. The state has a total area of 44,825 square miles, making it the 34th largest state in the country.
Ohio is divided into 88 counties. The state is divided into five distinct geographic regions: the Great Lakes Plain, the Appalachian Plateau, the Central Lowlands, the Allegheny Plateau, and the Erie Plain. The Great Lakes Plain is located in the northern part of the state and is home to Lake Erie. The Appalachian Plateau is located in the southeastern part of the state and is home to the Appalachian Mountains. The Central Lowlands are located in the central part of the state and are home to the Ohio River. The Allegheny Plateau is located in the southwestern part of the state and is home to the Allegheny Mountains. The Erie Plain is located in the northwestern part of the state and is home to Lake Erie.
OH Economy
Ohio has a diverse economy that includes manufacturing, agriculture, finance, and technology. The state is home to several Fortune 500 companies, including Procter & Gamble, Marathon Petroleum, and Kroger. Ohio is also home to several major universities, including Ohio State University, University of Cincinnati, and Case Western Reserve University.
The state’s manufacturing sector is the largest in the country, accounting for nearly 20% of the state’s total economic output. Ohio is home to several major automotive manufacturers, including General Motors, Ford, and Honda. The state is also home to several major aerospace and defense contractors, including Boeing, Lockheed Martin, and Northrop Grumman.
Ohio’s agricultural sector is the second largest in the country, accounting for nearly 10% of the state’s total economic output. The state is a major producer of corn, soybeans, wheat, and other crops. Ohio is also home to several major food processing companies, including The J.M. Smucker Company and The H.J. Heinz Company.
The state’s finance sector is the third largest in the country, accounting for nearly 8% of the state’s total economic output. Ohio is home to several major banks, including Fifth Third Bank, KeyBank, and Huntington Bank. The state is also home to several major insurance companies, including Nationwide, Progressive, and State Farm.
OH Demographics
As of 2019, Ohio had an estimated population of 11.7 million people. The state has a population density of 282 people per square mile, making it the 7th most populous state in the country. The state’s population is fairly evenly distributed across the state, with the largest cities being Columbus, Cleveland, Cincinnati, Toledo, and Akron.
The racial makeup of Ohio is 79.2% White, 12.7% Black or African American, 2.3% Asian, 0.3% Native American, and 5.5% from other races. The state’s Hispanic or Latino population is 4.2%. The median household income in Ohio is $54,822 and the median age is 39.7 years. The state’s poverty rate is 13.2%.
Common Questions
What is Per Capita Income in Gratis?
Per Capita income in Gratis is $27,145.
What is the Median Family Income in Gratis?
Median Family Income in Gratis is $75,000.
What is the Median Household income in Gratis?
Median Household Income in Gratis is $72,647.
What is Income or Wage Gap in Gratis?
Income or Wage Gap in Gratis is 38.2%.
Women in Gratis earn 61.8 cents for every dollar earned by a man.
What is Inequality or Gini Index in Gratis?
Inequality or Gini Index in Gratis is 0.28.
What is the Total Population of Gratis?
Total Population of Gratis is 703.
What is the Total Male Population of Gratis?
Total Male Population of Gratis is 385.
What is the Total Female Population of Gratis?
Total Female Population of Gratis is 318.
What is the Ratio of Males per 100 Females in Gratis?
There are 121.07 Males per 100 Females in Gratis.
What is the Ratio of Females per 100 Males in Gratis?
There are 82.60 Females per 100 Males in Gratis.
What is the Median Population Age in Gratis?
Median Population Age in Gratis is 34.3 Years.
What is the Average Family Size in Gratis
Average Family Size in Gratis is 2.8 People.
What is the Average Household Size in Gratis
Average Household Size in Gratis is 2.4 People.
How Large is the Labor Force in Gratis?
There are 330 People in the Labor Forcein in Gratis.
What is the Percentage of People in the Labor Force in Gratis?
59.2% of People are in the Labor Force in Gratis.