Lafferty, OH Map & Demographics
Lafferty Map
Lafferty Overview
$35,010
PER CAPITA INCOME
$69,432
AVG HOUSEHOLD INCOME
0.26
INEQUALITY / GINI INDEX
99
TOTAL POPULATION
70
MALE POPULATION
29
FEMALE POPULATION
241.38
MALES / 100 FEMALES
41.43
FEMALES / 100 MALES
56.0
MEDIAN AGE
4.0
AVG FAMILY SIZE
2.8
AVG HOUSEHOLD SIZE
78
LABOR FORCE [ PEOPLE ]
82.1%
PERCENT IN LABOR FORCE
Lafferty Zip Codes
Lafferty Area Codes
Income in Lafferty
Income Overview in Lafferty
| Characteristic | Number | Measure |
| Per Capita Income | 99 | $35,010 |
| Median Family Income | 15 | $0 |
| Mean Family Income | 15 | $0 |
| Median Household Income | 35 | $69,432 |
| Mean Household Income | 35 | $68,569 |
| Income Deficit | 15 | $0 |
| Wage / Income Gap (%) | 99 | 0.00% |
| Wage / Income Gap ($) | 99 | 100.00¢ per $1 |
| Gini / Inequality Index | 99 | 0.26 |
Earnings by Sex in Lafferty
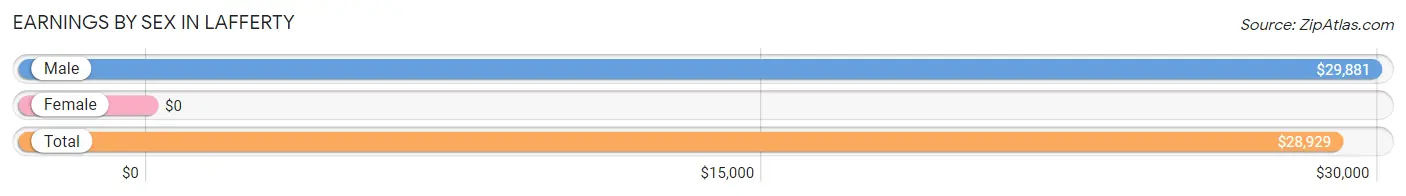
| Sex | Number | Average Earnings |
| Male | 62 (79.5%) | $29,881 |
| Female | 16 (20.5%) | $0 |
| Total | 78 (100.0%) | $28,929 |
Earnings by Sex by Income Bracket in Lafferty
The most common earnings brackets in Lafferty are $25,000 to $29,999 for men (21 | 33.9%) and $2,500 to $4,999 for women (16 | 100.0%).
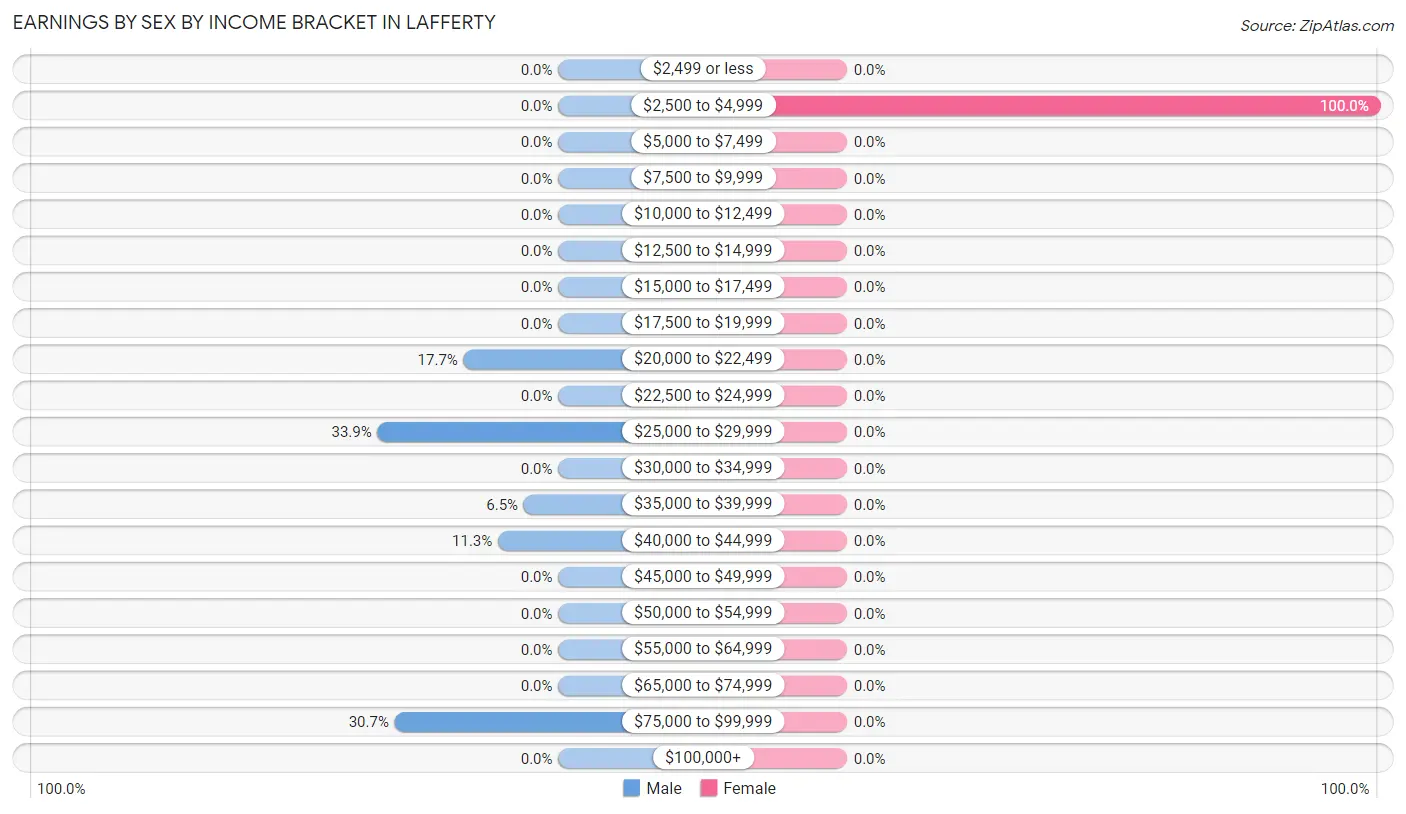
| Income | Male | Female |
| $2,499 or less | 0 (0.0%) | 0 (0.0%) |
| $2,500 to $4,999 | 0 (0.0%) | 16 (100.0%) |
| $5,000 to $7,499 | 0 (0.0%) | 0 (0.0%) |
| $7,500 to $9,999 | 0 (0.0%) | 0 (0.0%) |
| $10,000 to $12,499 | 0 (0.0%) | 0 (0.0%) |
| $12,500 to $14,999 | 0 (0.0%) | 0 (0.0%) |
| $15,000 to $17,499 | 0 (0.0%) | 0 (0.0%) |
| $17,500 to $19,999 | 0 (0.0%) | 0 (0.0%) |
| $20,000 to $22,499 | 11 (17.7%) | 0 (0.0%) |
| $22,500 to $24,999 | 0 (0.0%) | 0 (0.0%) |
| $25,000 to $29,999 | 21 (33.9%) | 0 (0.0%) |
| $30,000 to $34,999 | 0 (0.0%) | 0 (0.0%) |
| $35,000 to $39,999 | 4 (6.5%) | 0 (0.0%) |
| $40,000 to $44,999 | 7 (11.3%) | 0 (0.0%) |
| $45,000 to $49,999 | 0 (0.0%) | 0 (0.0%) |
| $50,000 to $54,999 | 0 (0.0%) | 0 (0.0%) |
| $55,000 to $64,999 | 0 (0.0%) | 0 (0.0%) |
| $65,000 to $74,999 | 0 (0.0%) | 0 (0.0%) |
| $75,000 to $99,999 | 19 (30.6%) | 0 (0.0%) |
| $100,000+ | 0 (0.0%) | 0 (0.0%) |
| Total | 62 (100.0%) | 16 (100.0%) |
Earnings by Sex by Educational Attainment in Lafferty
| Educational Attainment | Male Income | Female Income |
| Less than High School | - | - |
| High School Diploma | - | - |
| College or Associate's Degree | - | - |
| Bachelor's Degree | - | - |
| Graduate Degree | - | - |
| Total | $29,881 | $0 |
Family Income in Lafferty
Family Income Brackets in Lafferty
According to the Lafferty family income data, there are 11 families falling into the $50,000 to $74,999 income range, which is the most common income bracket and makes up 73.3% of all families.
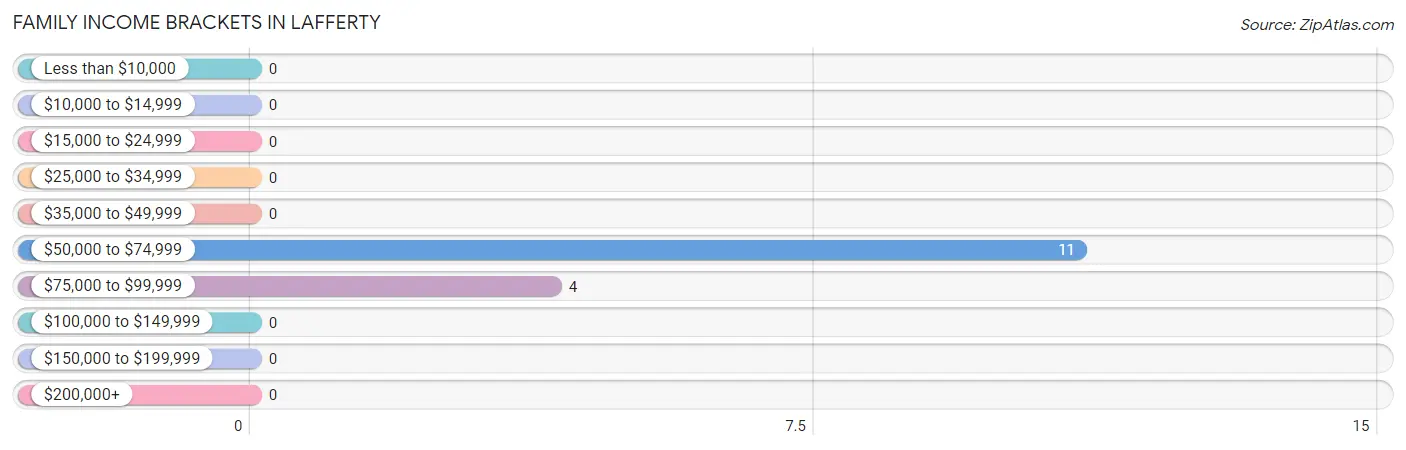
| Income Bracket | # Families | % Families |
| Less than $10,000 | 0 | 0.0% |
| $10,000 to $14,999 | 0 | 0.0% |
| $15,000 to $24,999 | 0 | 0.0% |
| $25,000 to $34,999 | 0 | 0.0% |
| $35,000 to $49,999 | 0 | 0.0% |
| $50,000 to $74,999 | 11 | 73.3% |
| $75,000 to $99,999 | 4 | 26.7% |
| $100,000 to $149,999 | 0 | 0.0% |
| $150,000 to $199,999 | 0 | 0.0% |
| $200,000+ | 0 | 0.0% |
Family Income by Famaliy Size in Lafferty
| Income Bracket | # Families | Median Income |
| 2-Person Families | 11 (73.3%) | $0 |
| 3-Person Families | 0 (0.0%) | $0 |
| 4-Person Families | 0 (0.0%) | $0 |
| 5-Person Families | 0 (0.0%) | $0 |
| 6-Person Families | 4 (26.7%) | $0 |
| 7+ Person Families | 0 (0.0%) | $0 |
| Total | 15 (100.0%) | $0 |
Family Income by Number of Earners in Lafferty
| Number of Earners | # Families | Median Income |
| No Earners | 0 (0.0%) | $0 |
| 1 Earner | 0 (0.0%) | $0 |
| 2 Earners | 11 (73.3%) | $0 |
| 3+ Earners | 4 (26.7%) | $0 |
| Total | 15 (100.0%) | $0 |
Household Income in Lafferty
Household Income Brackets in Lafferty
With 11 households falling in the category, the $50,000 to $74,999 income range is the most frequent in Lafferty, accounting for 31.4% of all households.
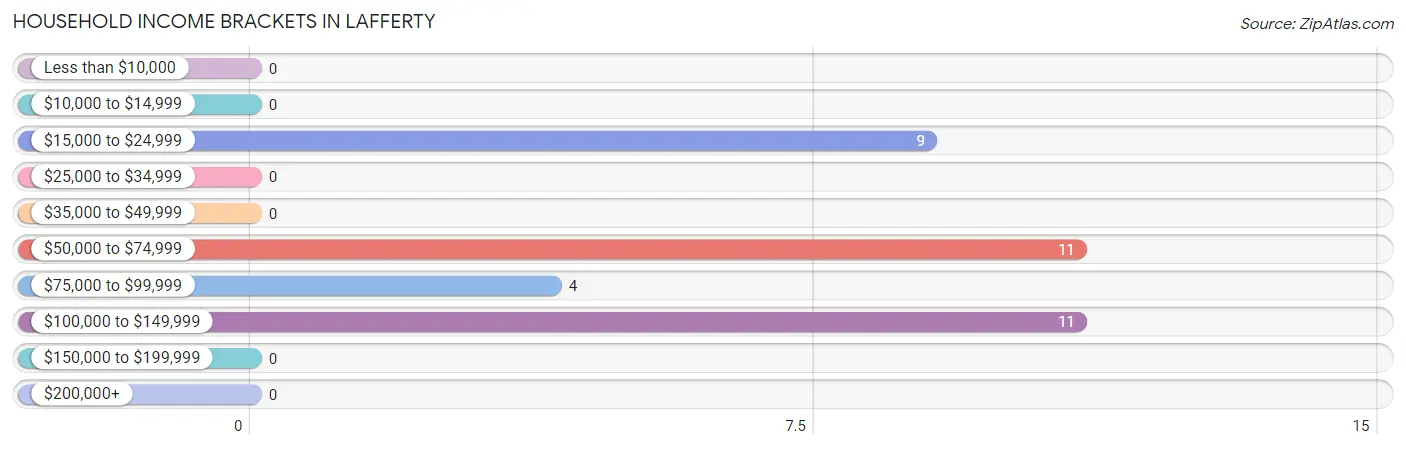
| Income Bracket | # Households | % Households |
| Less than $10,000 | 0 | 0.0% |
| $10,000 to $14,999 | 0 | 0.0% |
| $15,000 to $24,999 | 9 | 25.7% |
| $25,000 to $34,999 | 0 | 0.0% |
| $35,000 to $49,999 | 0 | 0.0% |
| $50,000 to $74,999 | 11 | 31.4% |
| $75,000 to $99,999 | 4 | 11.4% |
| $100,000 to $149,999 | 11 | 31.4% |
| $150,000 to $199,999 | 0 | 0.0% |
| $200,000+ | 0 | 0.0% |
Household Income by Householder Age in Lafferty
The median household income in Lafferty is $69,432, with the highest median household income of $86,250 found in the 45 to 64 years age bracket for the primary householder. A total of 26 households (74.3%) fall into this category.
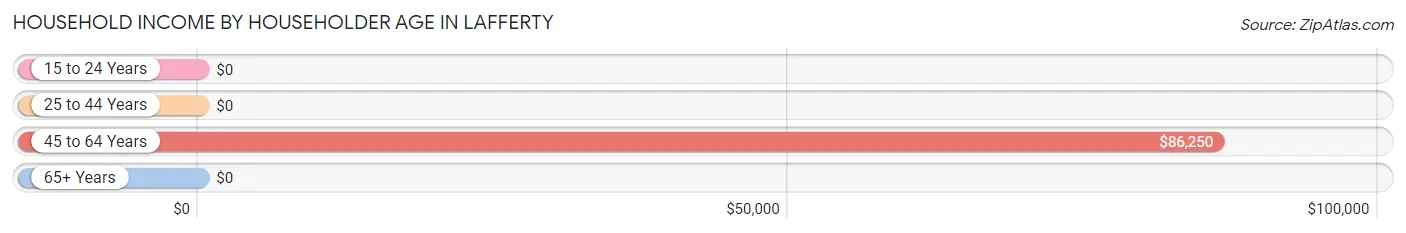
| Income Bracket | # Households | Median Income |
| 15 to 24 Years | 0 (0.0%) | $0 |
| 25 to 44 Years | 0 (0.0%) | $0 |
| 45 to 64 Years | 26 (74.3%) | $86,250 |
| 65+ Years | 9 (25.7%) | $0 |
| Total | 35 (100.0%) | $69,432 |
Poverty in Lafferty
Income Below Poverty by Sex and Age in Lafferty
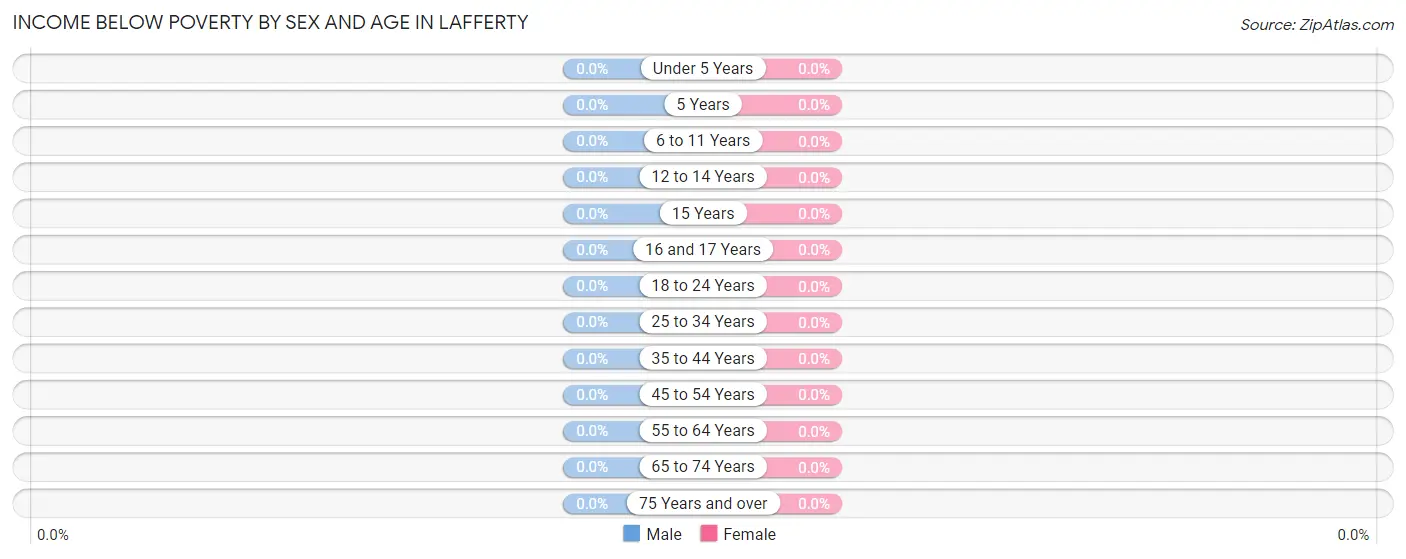
| Age Bracket | Male | Female |
| Under 5 Years | 0 (0.0%) | 0 (0.0%) |
| 5 Years | 0 (0.0%) | 0 (0.0%) |
| 6 to 11 Years | 0 (0.0%) | 0 (0.0%) |
| 12 to 14 Years | 0 (0.0%) | 0 (0.0%) |
| 15 Years | 0 (0.0%) | 0 (0.0%) |
| 16 and 17 Years | 0 (0.0%) | 0 (0.0%) |
| 18 to 24 Years | 0 (0.0%) | 0 (0.0%) |
| 25 to 34 Years | 0 (0.0%) | 0 (0.0%) |
| 35 to 44 Years | 0 (0.0%) | 0 (0.0%) |
| 45 to 54 Years | 0 (0.0%) | 0 (0.0%) |
| 55 to 64 Years | 0 (0.0%) | 0 (0.0%) |
| 65 to 74 Years | 0 (0.0%) | 0 (0.0%) |
| 75 Years and over | 0 (0.0%) | 0 (0.0%) |
| Total | 0 (0.0%) | 0 (0.0%) |
Income Above Poverty by Sex and Age in Lafferty
According to the poverty statistics in Lafferty, males aged 6 to 11 years and females aged 18 to 24 years are the age groups that are most secure financially, with 100.0% of males and 100.0% of females in these age groups living above the poverty line.
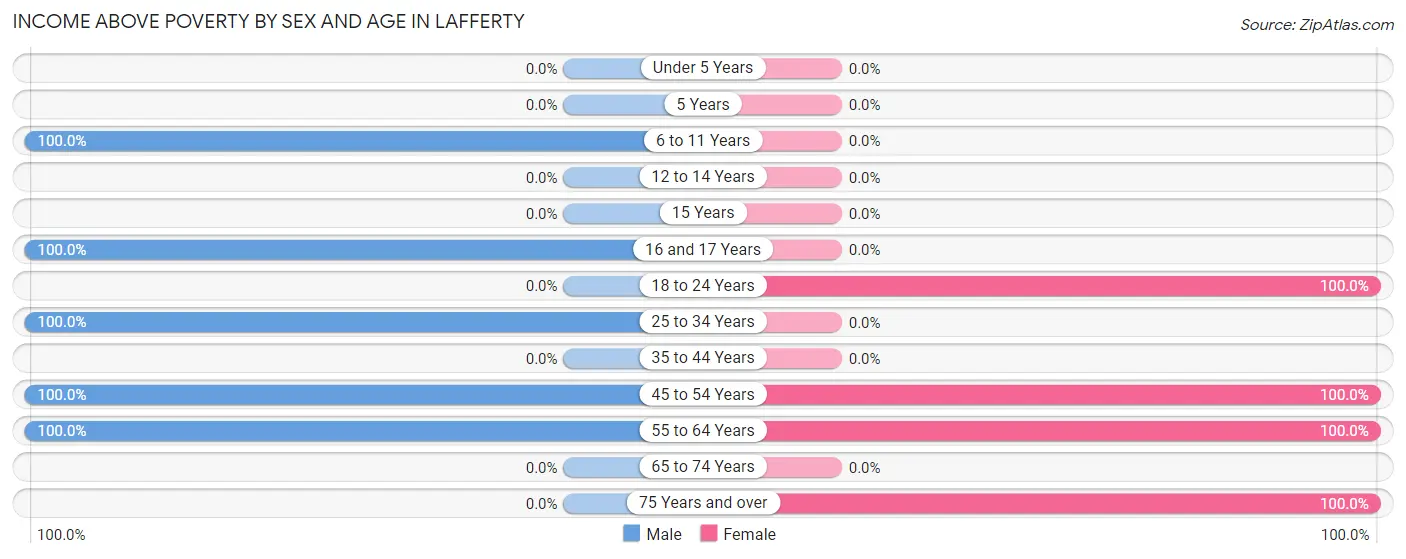
| Age Bracket | Male | Female |
| Under 5 Years | 0 (0.0%) | 0 (0.0%) |
| 5 Years | 0 (0.0%) | 0 (0.0%) |
| 6 to 11 Years | 4 (100.0%) | 0 (0.0%) |
| 12 to 14 Years | 0 (0.0%) | 0 (0.0%) |
| 15 Years | 0 (0.0%) | 0 (0.0%) |
| 16 and 17 Years | 4 (100.0%) | 0 (0.0%) |
| 18 to 24 Years | 0 (0.0%) | 5 (100.0%) |
| 25 to 34 Years | 28 (100.0%) | 0 (0.0%) |
| 35 to 44 Years | 0 (0.0%) | 0 (0.0%) |
| 45 to 54 Years | 4 (100.0%) | 4 (100.0%) |
| 55 to 64 Years | 30 (100.0%) | 11 (100.0%) |
| 65 to 74 Years | 0 (0.0%) | 0 (0.0%) |
| 75 Years and over | 0 (0.0%) | 9 (100.0%) |
| Total | 70 (100.0%) | 29 (100.0%) |
Income Below Poverty Among Married-Couple Families in Lafferty
| Children | Above Poverty | Below Poverty |
| No Children | 0 (0.0%) | 0 (0.0%) |
| 1 or 2 Children | 4 (100.0%) | 0 (0.0%) |
| 3 or 4 Children | 0 (0.0%) | 0 (0.0%) |
| 5 or more Children | 0 (0.0%) | 0 (0.0%) |
| Total | 4 (100.0%) | 0 (0.0%) |
Income Below Poverty Among Single-Parent Households in Lafferty
| Children | Single Father | Single Mother |
| No Children | 0 (0.0%) | 0 (0.0%) |
| 1 or 2 Children | 0 (0.0%) | 0 (0.0%) |
| 3 or 4 Children | 0 (0.0%) | 0 (0.0%) |
| 5 or more Children | 0 (0.0%) | 0 (0.0%) |
| Total | 0 (0.0%) | 0 (0.0%) |
Income Below Poverty Among Married-Couple vs Single-Parent Households in Lafferty
| Children | Married-Couple Families | Single-Parent Households |
| No Children | 0 (0.0%) | 0 (0.0%) |
| 1 or 2 Children | 0 (0.0%) | 0 (0.0%) |
| 3 or 4 Children | 0 (0.0%) | 0 (0.0%) |
| 5 or more Children | 0 (0.0%) | 0 (0.0%) |
| Total | 0 (0.0%) | 0 (0.0%) |
Race in Lafferty
The most populous races in Lafferty are , and White / Caucasian (99 | 100.0%).
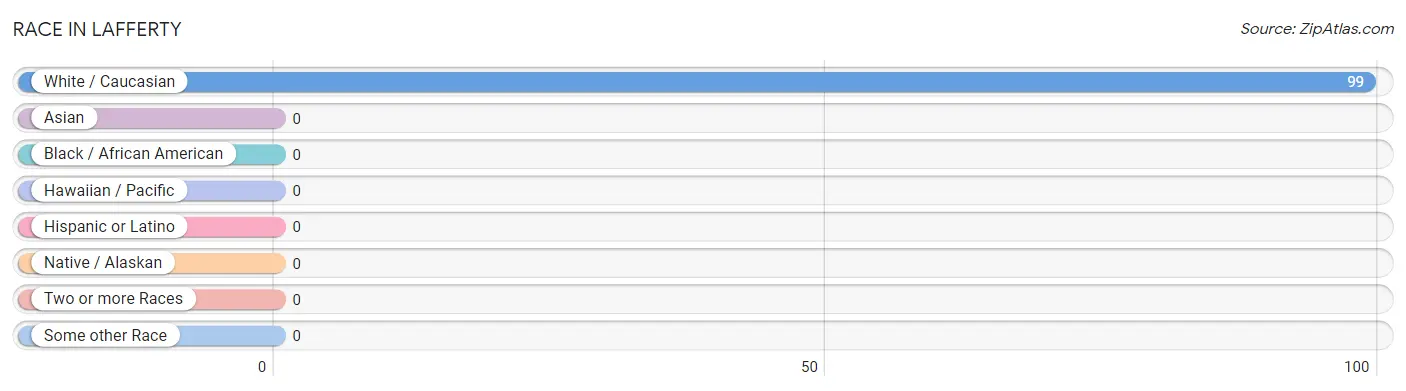
| Race | # Population | % Population |
| Asian | 0 | 0.0% |
| Black / African American | 0 | 0.0% |
| Hawaiian / Pacific | 0 | 0.0% |
| Hispanic or Latino | 0 | 0.0% |
| Native / Alaskan | 0 | 0.0% |
| White / Caucasian | 99 | 100.0% |
| Two or more Races | 0 | 0.0% |
| Some other Race | 0 | 0.0% |
| Total | 99 | 100.0% |
Ancestry in Lafferty
The most populous ancestries reported in Lafferty are Italian (32 | 32.3%), Polish (30 | 30.3%), German (21 | 21.2%), and Serbian (11 | 11.1%), together accounting for 94.9% of all Lafferty residents.
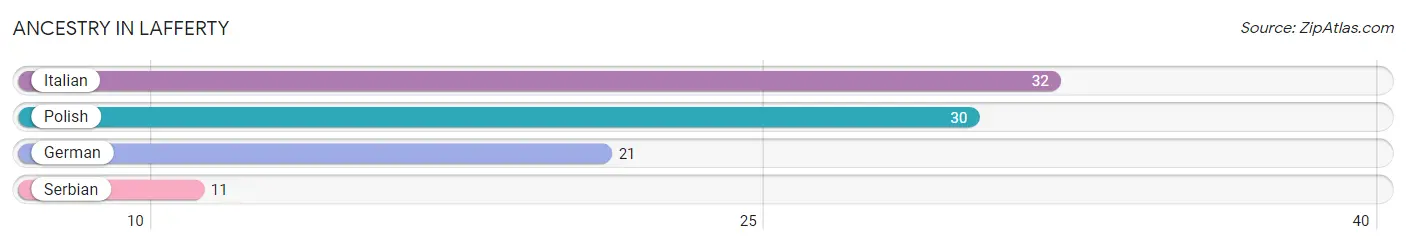
| Ancestry | # Population | % Population |
| German | 21 | 21.2% |
| Italian | 32 | 32.3% |
| Polish | 30 | 30.3% |
| Serbian | 11 | 11.1% | View All 4 Rows |
Immigrants in Lafferty

| Immigration Origin | # Population | % Population | View All 0 Rows |
Sex and Age in Lafferty
Sex and Age in Lafferty
The most populous age groups in Lafferty are 60 to 64 Years (30 | 42.9%) for men and 55 to 59 Years (11 | 37.9%) for women.
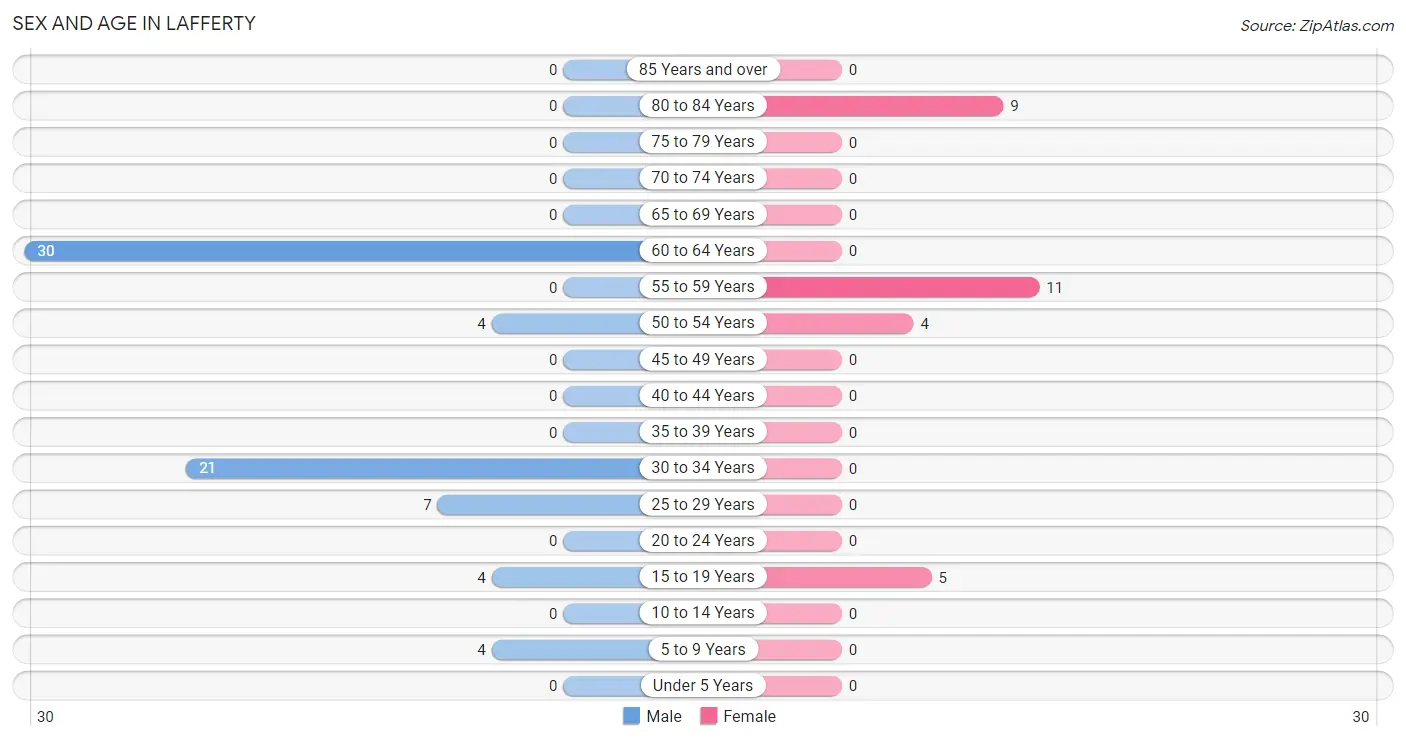
| Age Bracket | Male | Female |
| Under 5 Years | 0 (0.0%) | 0 (0.0%) |
| 5 to 9 Years | 4 (5.7%) | 0 (0.0%) |
| 10 to 14 Years | 0 (0.0%) | 0 (0.0%) |
| 15 to 19 Years | 4 (5.7%) | 5 (17.2%) |
| 20 to 24 Years | 0 (0.0%) | 0 (0.0%) |
| 25 to 29 Years | 7 (10.0%) | 0 (0.0%) |
| 30 to 34 Years | 21 (30.0%) | 0 (0.0%) |
| 35 to 39 Years | 0 (0.0%) | 0 (0.0%) |
| 40 to 44 Years | 0 (0.0%) | 0 (0.0%) |
| 45 to 49 Years | 0 (0.0%) | 0 (0.0%) |
| 50 to 54 Years | 4 (5.7%) | 4 (13.8%) |
| 55 to 59 Years | 0 (0.0%) | 11 (37.9%) |
| 60 to 64 Years | 30 (42.9%) | 0 (0.0%) |
| 65 to 69 Years | 0 (0.0%) | 0 (0.0%) |
| 70 to 74 Years | 0 (0.0%) | 0 (0.0%) |
| 75 to 79 Years | 0 (0.0%) | 0 (0.0%) |
| 80 to 84 Years | 0 (0.0%) | 9 (31.0%) |
| 85 Years and over | 0 (0.0%) | 0 (0.0%) |
| Total | 70 (100.0%) | 29 (100.0%) |
Families and Households in Lafferty
Median Family Size in Lafferty
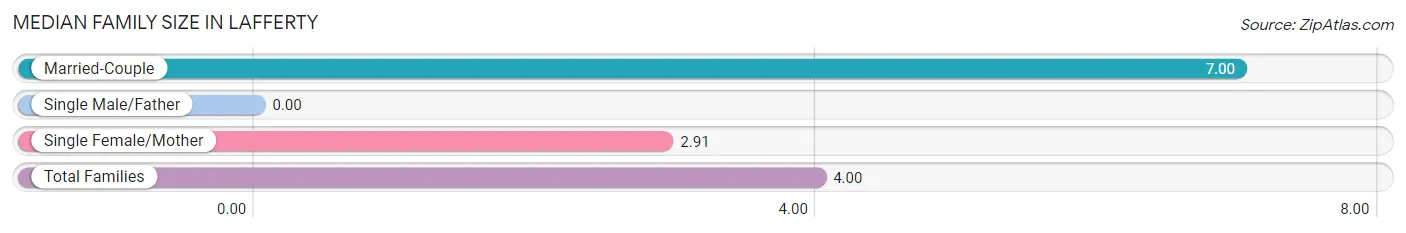
| Family Type | # Families | Family Size |
| Married-Couple | 4 (26.7%) | 7.00 |
| Single Male/Father | 0 (0.0%) | - |
| Single Female/Mother | 11 (73.3%) | 2.91 |
| Total Families | 15 (100.0%) | 4.00 |
Median Household Size in Lafferty
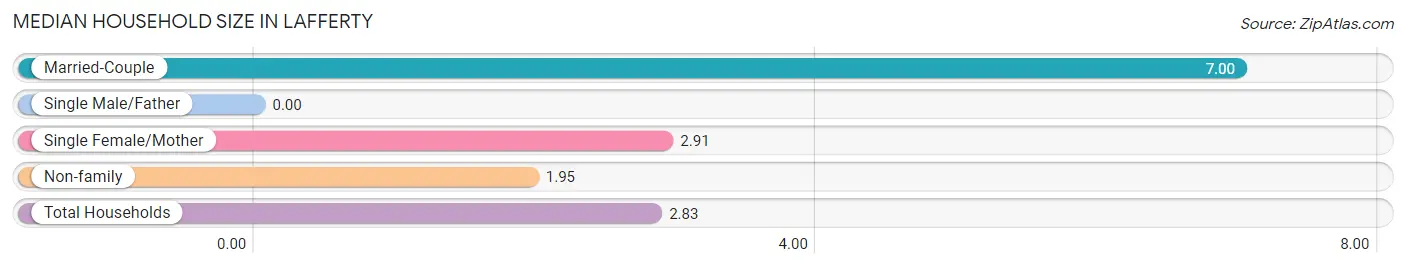
| Household Type | # Households | Household Size |
| Married-Couple | 4 (11.4%) | 7.00 |
| Single Male/Father | 0 (0.0%) | - |
| Single Female/Mother | 11 (31.4%) | 2.91 |
| Non-family | 20 (57.1%) | 1.95 |
| Total Households | 35 (100.0%) | 2.83 |
Household Size by Marriage Status in Lafferty
Out of a total of 35 households in Lafferty, 15 (42.9%) are family households, while 20 (57.1%) are nonfamily households. The most numerous type of family households are 2-person households, comprising 11, and the most common type of nonfamily households are 2-person households, comprising 11.
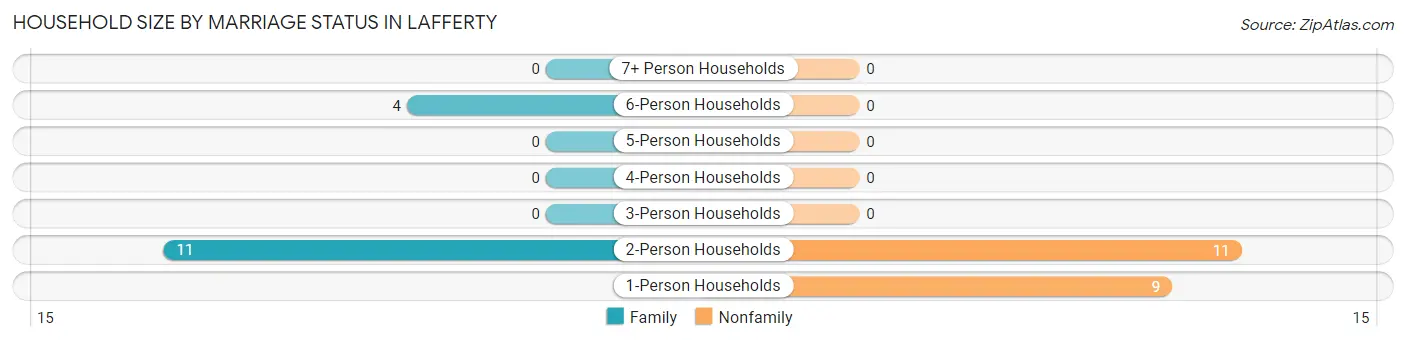
| Household Size | Family Households | Nonfamily Households |
| 1-Person Households | - | 9 (25.7%) |
| 2-Person Households | 11 (31.4%) | 11 (31.4%) |
| 3-Person Households | 0 (0.0%) | 0 (0.0%) |
| 4-Person Households | 0 (0.0%) | 0 (0.0%) |
| 5-Person Households | 0 (0.0%) | 0 (0.0%) |
| 6-Person Households | 4 (11.4%) | 0 (0.0%) |
| 7+ Person Households | 0 (0.0%) | 0 (0.0%) |
| Total | 15 (42.9%) | 20 (57.1%) |
Female Fertility in Lafferty
Fertility by Age in Lafferty
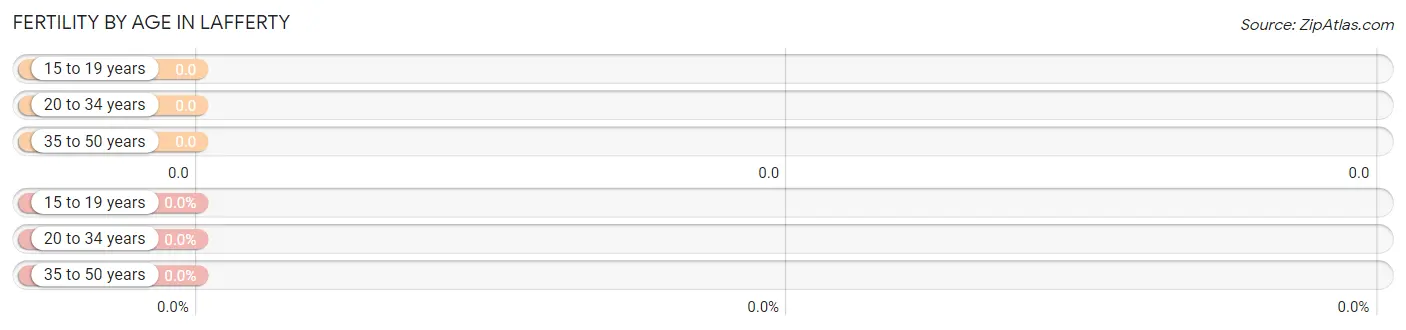
| Age Bracket | Women with Births | Births / 1,000 Women |
| 15 to 19 years | 0 (0.0%) | 0.0 |
| 20 to 34 years | 0 (0.0%) | 0.0 |
| 35 to 50 years | 0 (0.0%) | 0.0 |
| Total | 0 (0.0%) | 0.0 |
Fertility by Age by Marriage Status in Lafferty
| Age Bracket | Married | Unmarried |
| 15 to 19 years | 0 (0.0%) | 0 (0.0%) |
| 20 to 34 years | 0 (0.0%) | 0 (0.0%) |
| 35 to 50 years | 0 (0.0%) | 0 (0.0%) |
| Total | 0 (0.0%) | 0 (0.0%) |
Fertility by Education in Lafferty
| Educational Attainment | Women with Births | Births / 1,000 Women |
| Less than High School | 0 (0.0%) | 0.0 |
| High School Diploma | 0 (0.0%) | 0.0 |
| College or Associate's Degree | 0 (0.0%) | 0.0 |
| Bachelor's Degree | 0 (0.0%) | 0.0 |
| Graduate Degree | 0 (0.0%) | 0.0 |
| Total | 0 (0.0%) | 0.0 |
Fertility by Education by Marriage Status in Lafferty
| Educational Attainment | Married | Unmarried |
| Less than High School | 0 (0.0%) | 0 (0.0%) |
| High School Diploma | 0 (0.0%) | 0 (0.0%) |
| College or Associate's Degree | 0 (0.0%) | 0 (0.0%) |
| Bachelor's Degree | 0 (0.0%) | 0 (0.0%) |
| Graduate Degree | 0 (0.0%) | 0 (0.0%) |
| Total | 0 (0.0%) | 0 (0.0%) |
Employment Characteristics in Lafferty
Employment by Class of Employer in Lafferty
Among the 78 employed individuals in Lafferty, private company employees (48 | 61.5%), local government employees (19 | 24.4%), and state government employees (11 | 14.1%) make up the most common classes of employment.
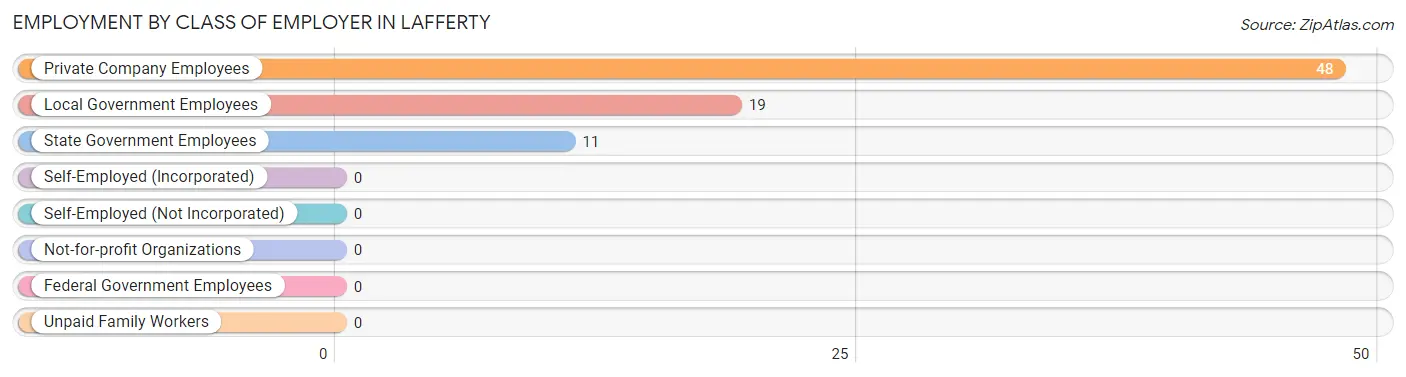
| Employer Class | # Employees | % Employees |
| Private Company Employees | 48 | 61.5% |
| Self-Employed (Incorporated) | 0 | 0.0% |
| Self-Employed (Not Incorporated) | 0 | 0.0% |
| Not-for-profit Organizations | 0 | 0.0% |
| Local Government Employees | 19 | 24.4% |
| State Government Employees | 11 | 14.1% |
| Federal Government Employees | 0 | 0.0% |
| Unpaid Family Workers | 0 | 0.0% |
| Total | 78 | 100.0% |
Employment Status by Age in Lafferty
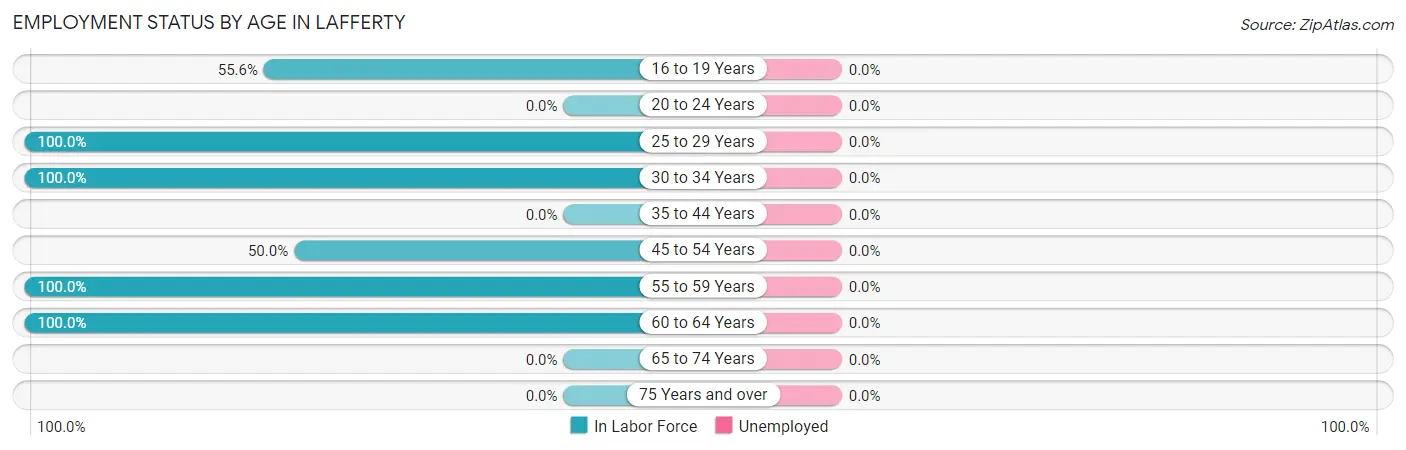
| Age Bracket | In Labor Force | Unemployed |
| 16 to 19 Years | 5 (55.6%) | 0 (0.0%) |
| 20 to 24 Years | 0 (0.0%) | 0 (0.0%) |
| 25 to 29 Years | 7 (100.0%) | 0 (0.0%) |
| 30 to 34 Years | 21 (100.0%) | 0 (0.0%) |
| 35 to 44 Years | 0 (0.0%) | 0 (0.0%) |
| 45 to 54 Years | 4 (50.0%) | 0 (0.0%) |
| 55 to 59 Years | 11 (100.0%) | 0 (0.0%) |
| 60 to 64 Years | 30 (100.0%) | 0 (0.0%) |
| 65 to 74 Years | 0 (0.0%) | 0 (0.0%) |
| 75 Years and over | 0 (0.0%) | 0 (0.0%) |
| Total | 78 (82.1%) | 0 (0.0%) |
Employment Status by Educational Attainment in Lafferty
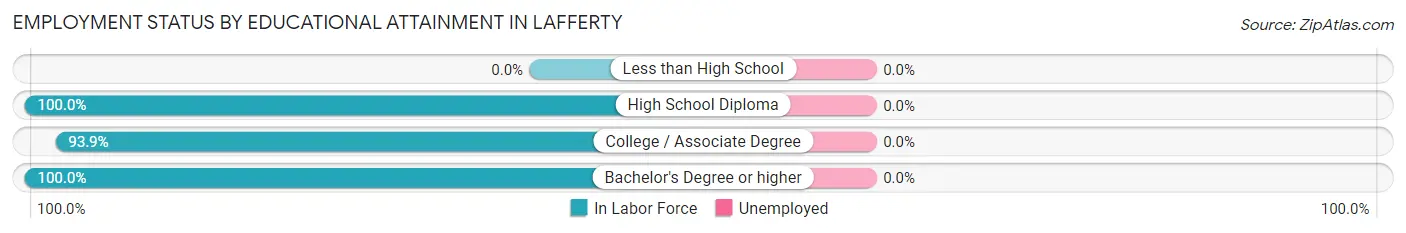
| Educational Attainment | In Labor Force | Unemployed |
| Less than High School | 0 (0.0%) | 0 (0.0%) |
| High School Diploma | 7 (100.0%) | 0 (0.0%) |
| College / Associate Degree | 62 (93.9%) | 0 (0.0%) |
| Bachelor's Degree or higher | 4 (100.0%) | 0 (0.0%) |
| Total | 73 (94.8%) | 0 (0.0%) |
Employment Occupations by Sex in Lafferty
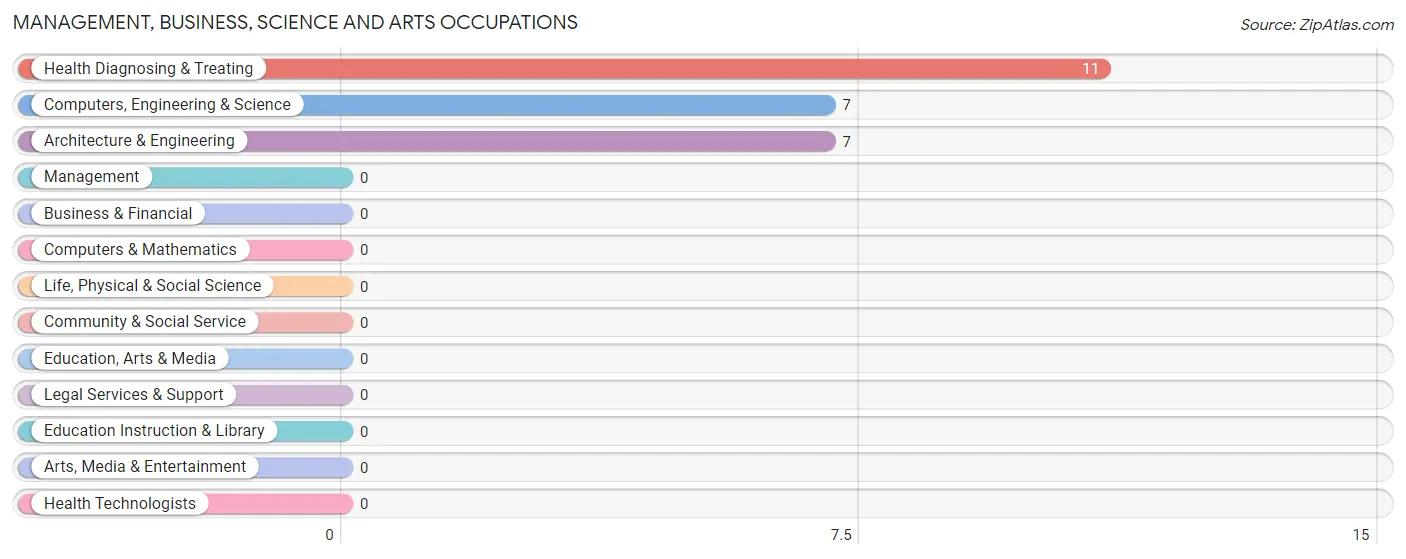
Management, Business, Science and Arts Occupations
The most common Management, Business, Science and Arts occupations in Lafferty are Health Diagnosing & Treating (11 | 14.1%), Computers, Engineering & Science (7 | 9.0%), and Architecture & Engineering (7 | 9.0%).
Management, Business, Science and Arts Occupations by Sex
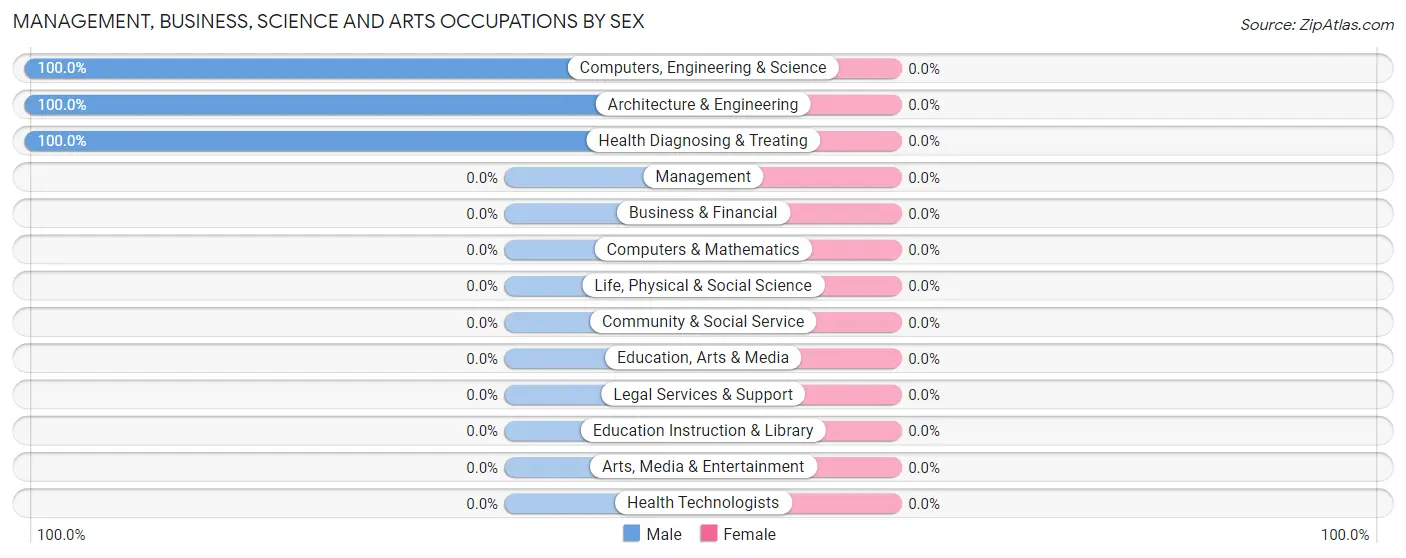
| Occupation | Male | Female |
| Management | 0 (0.0%) | 0 (0.0%) |
| Business & Financial | 0 (0.0%) | 0 (0.0%) |
| Computers, Engineering & Science | 7 (100.0%) | 0 (0.0%) |
| Computers & Mathematics | 0 (0.0%) | 0 (0.0%) |
| Architecture & Engineering | 7 (100.0%) | 0 (0.0%) |
| Life, Physical & Social Science | 0 (0.0%) | 0 (0.0%) |
| Community & Social Service | 0 (0.0%) | 0 (0.0%) |
| Education, Arts & Media | 0 (0.0%) | 0 (0.0%) |
| Legal Services & Support | 0 (0.0%) | 0 (0.0%) |
| Education Instruction & Library | 0 (0.0%) | 0 (0.0%) |
| Arts, Media & Entertainment | 0 (0.0%) | 0 (0.0%) |
| Health Diagnosing & Treating | 11 (100.0%) | 0 (0.0%) |
| Health Technologists | 0 (0.0%) | 0 (0.0%) |
| Total (Category) | 18 (100.0%) | 0 (0.0%) |
| Total (Overall) | 62 (79.5%) | 16 (20.5%) |
Services Occupations
The most common Services occupations in Lafferty are Cleaning & Maintenance (21 | 26.9%), and Food Preparation & Serving (5 | 6.4%).
Services Occupations by Sex
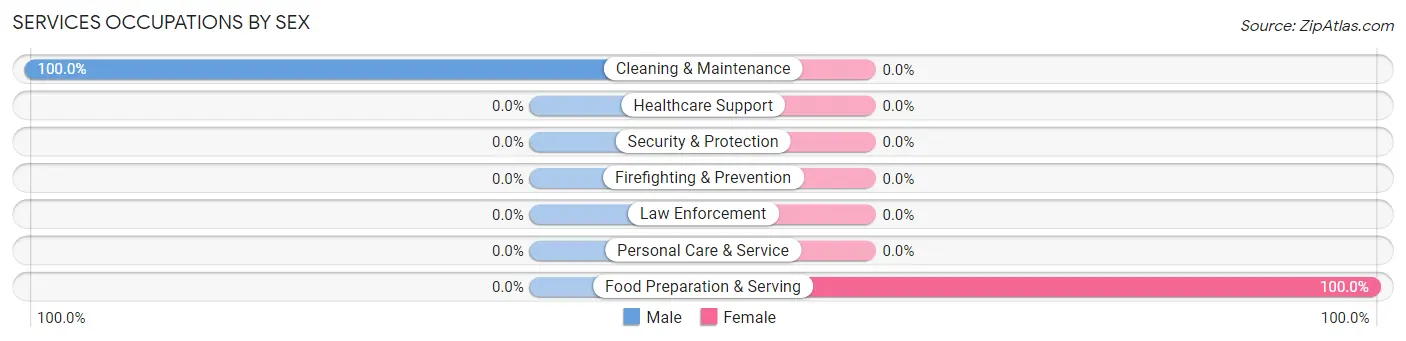
| Occupation | Male | Female |
| Healthcare Support | 0 (0.0%) | 0 (0.0%) |
| Security & Protection | 0 (0.0%) | 0 (0.0%) |
| Firefighting & Prevention | 0 (0.0%) | 0 (0.0%) |
| Law Enforcement | 0 (0.0%) | 0 (0.0%) |
| Food Preparation & Serving | 0 (0.0%) | 5 (100.0%) |
| Cleaning & Maintenance | 21 (100.0%) | 0 (0.0%) |
| Personal Care & Service | 0 (0.0%) | 0 (0.0%) |
| Total (Category) | 21 (80.8%) | 5 (19.2%) |
| Total (Overall) | 62 (79.5%) | 16 (20.5%) |
Sales and Office Occupations
The most common Sales and Office occupations in Lafferty are , and Office & Administration (15 | 19.2%).
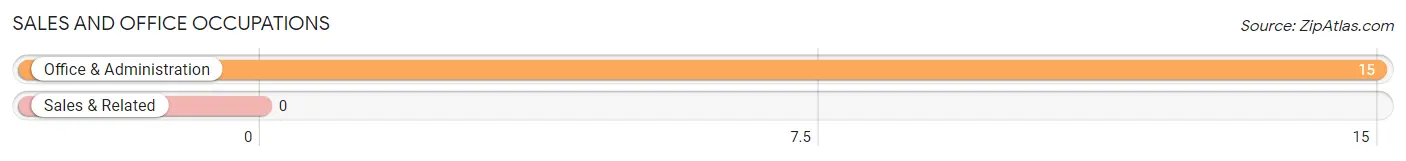
Sales and Office Occupations by Sex
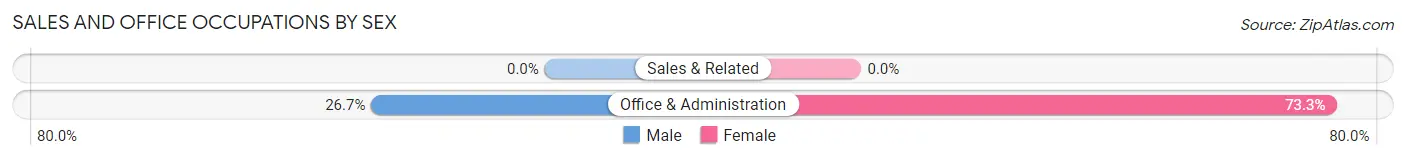
| Occupation | Male | Female |
| Sales & Related | 0 (0.0%) | 0 (0.0%) |
| Office & Administration | 4 (26.7%) | 11 (73.3%) |
| Total (Category) | 4 (26.7%) | 11 (73.3%) |
| Total (Overall) | 62 (79.5%) | 16 (20.5%) |
Natural Resources, Construction and Maintenance Occupations
Natural Resources, Construction and Maintenance Occupations by Sex
| Occupation | Male | Female |
| Farming, Fishing & Forestry | 0 (0.0%) | 0 (0.0%) |
| Construction & Extraction | 0 (0.0%) | 0 (0.0%) |
| Installation, Maintenance & Repair | 0 (0.0%) | 0 (0.0%) |
| Total (Category) | 0 (0.0%) | 0 (0.0%) |
| Total (Overall) | 62 (79.5%) | 16 (20.5%) |
Production, Transportation and Moving Occupations
The most common Production, Transportation and Moving occupations in Lafferty are , and Transportation (19 | 24.4%).
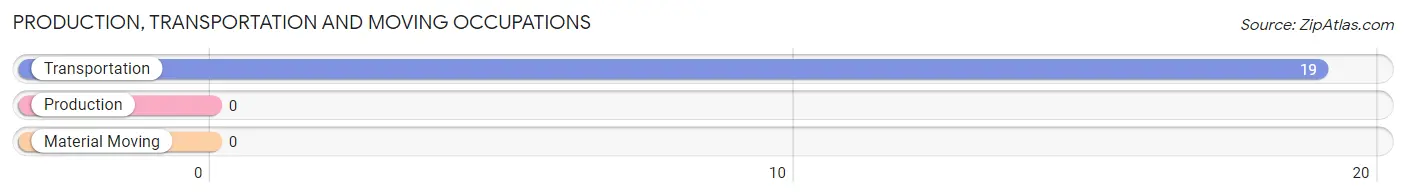
Production, Transportation and Moving Occupations by Sex
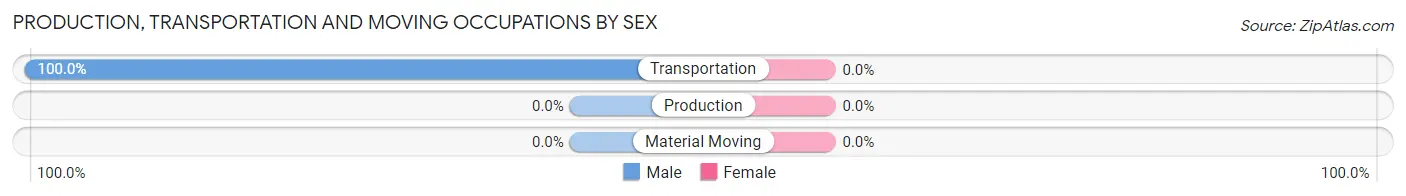
| Occupation | Male | Female |
| Production | 0 (0.0%) | 0 (0.0%) |
| Transportation | 19 (100.0%) | 0 (0.0%) |
| Material Moving | 0 (0.0%) | 0 (0.0%) |
| Total (Category) | 19 (100.0%) | 0 (0.0%) |
| Total (Overall) | 62 (79.5%) | 16 (20.5%) |
Employment Industries by Sex in Lafferty
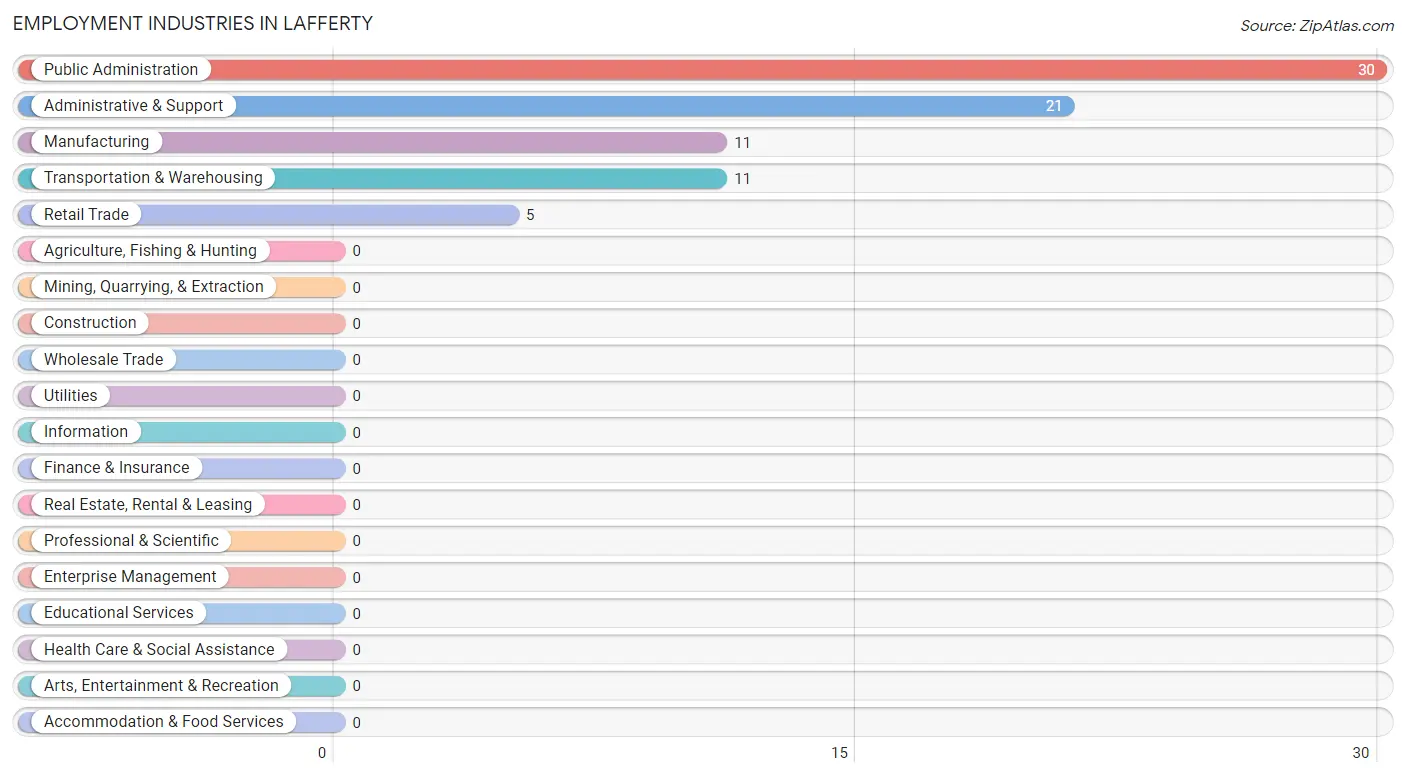
Employment Industries in Lafferty
The major employment industries in Lafferty include Public Administration (30 | 38.5%), Administrative & Support (21 | 26.9%), Manufacturing (11 | 14.1%), Transportation & Warehousing (11 | 14.1%), and Retail Trade (5 | 6.4%).
Employment Industries by Sex in Lafferty
The Lafferty industries that see more men than women are Manufacturing (100.0%), Administrative & Support (100.0%), and Public Administration (100.0%), whereas the industries that tend to have a higher number of women are Retail Trade (100.0%), and Transportation & Warehousing (100.0%).
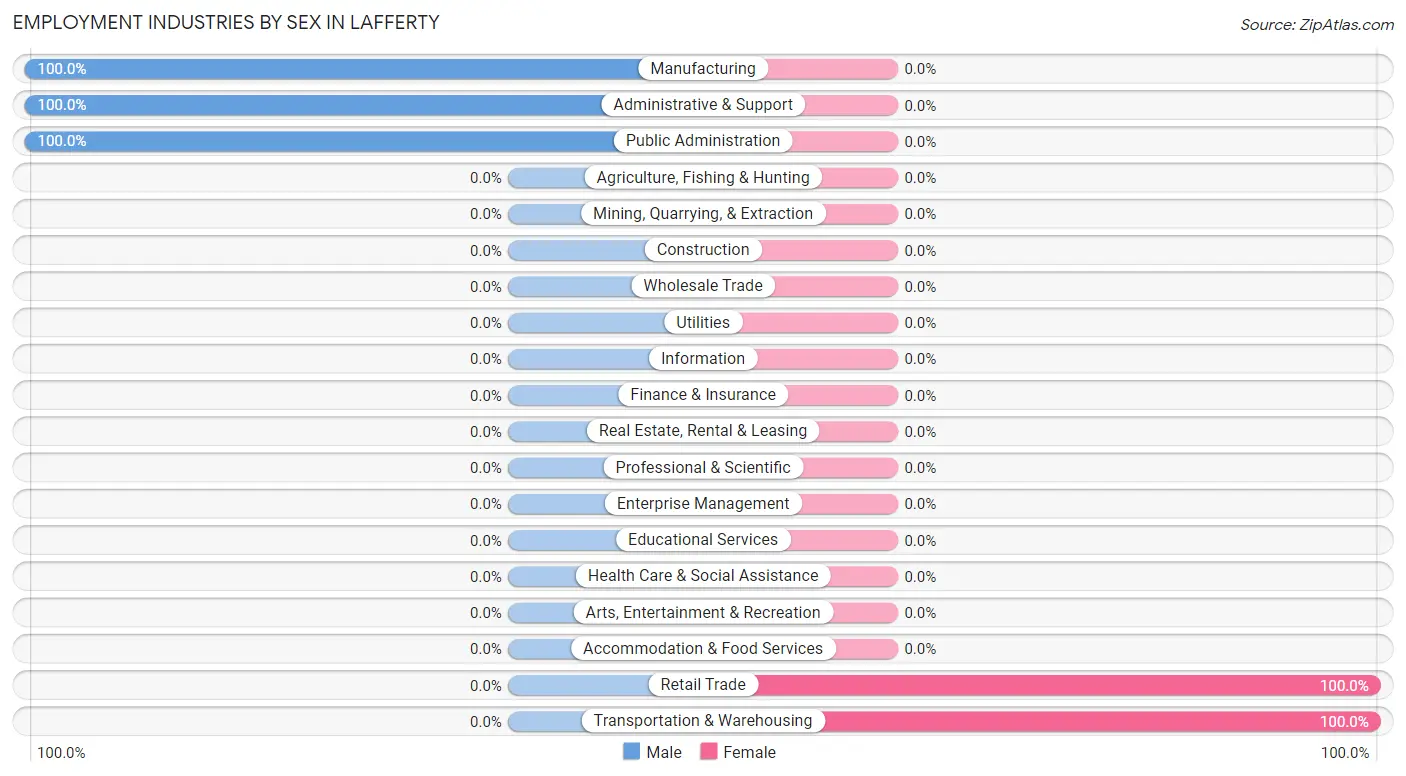
| Industry | Male | Female |
| Agriculture, Fishing & Hunting | 0 (0.0%) | 0 (0.0%) |
| Mining, Quarrying, & Extraction | 0 (0.0%) | 0 (0.0%) |
| Construction | 0 (0.0%) | 0 (0.0%) |
| Manufacturing | 11 (100.0%) | 0 (0.0%) |
| Wholesale Trade | 0 (0.0%) | 0 (0.0%) |
| Retail Trade | 0 (0.0%) | 5 (100.0%) |
| Transportation & Warehousing | 0 (0.0%) | 11 (100.0%) |
| Utilities | 0 (0.0%) | 0 (0.0%) |
| Information | 0 (0.0%) | 0 (0.0%) |
| Finance & Insurance | 0 (0.0%) | 0 (0.0%) |
| Real Estate, Rental & Leasing | 0 (0.0%) | 0 (0.0%) |
| Professional & Scientific | 0 (0.0%) | 0 (0.0%) |
| Enterprise Management | 0 (0.0%) | 0 (0.0%) |
| Administrative & Support | 21 (100.0%) | 0 (0.0%) |
| Educational Services | 0 (0.0%) | 0 (0.0%) |
| Health Care & Social Assistance | 0 (0.0%) | 0 (0.0%) |
| Arts, Entertainment & Recreation | 0 (0.0%) | 0 (0.0%) |
| Accommodation & Food Services | 0 (0.0%) | 0 (0.0%) |
| Public Administration | 30 (100.0%) | 0 (0.0%) |
| Total | 62 (79.5%) | 16 (20.5%) |
Education in Lafferty
School Enrollment in Lafferty
The most common levels of schooling among the 8 students in Lafferty are elementary school (4 | 50.0%), and high school (4 | 50.0%).
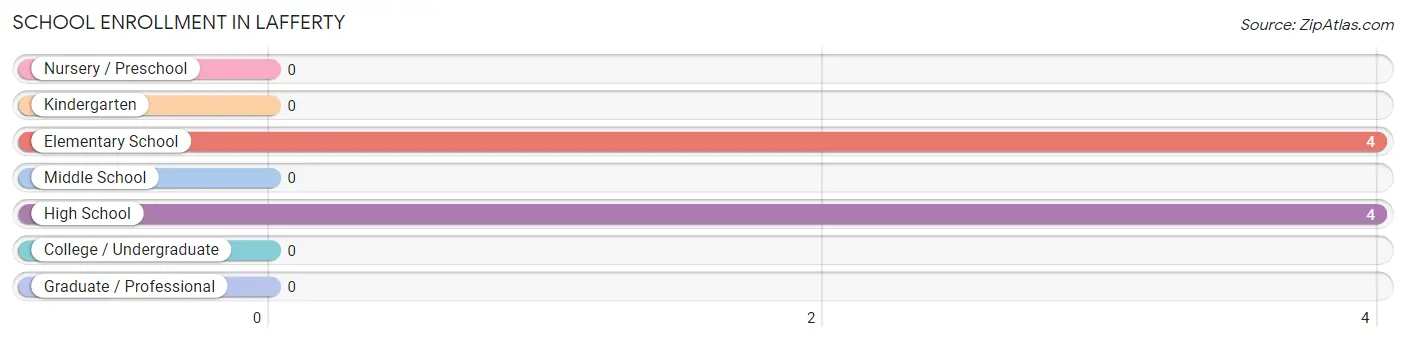
| School Level | # Students | % Students |
| Nursery / Preschool | 0 | 0.0% |
| Kindergarten | 0 | 0.0% |
| Elementary School | 4 | 50.0% |
| Middle School | 0 | 0.0% |
| High School | 4 | 50.0% |
| College / Undergraduate | 0 | 0.0% |
| Graduate / Professional | 0 | 0.0% |
| Total | 8 | 100.0% |
School Enrollment by Age by Funding Source in Lafferty
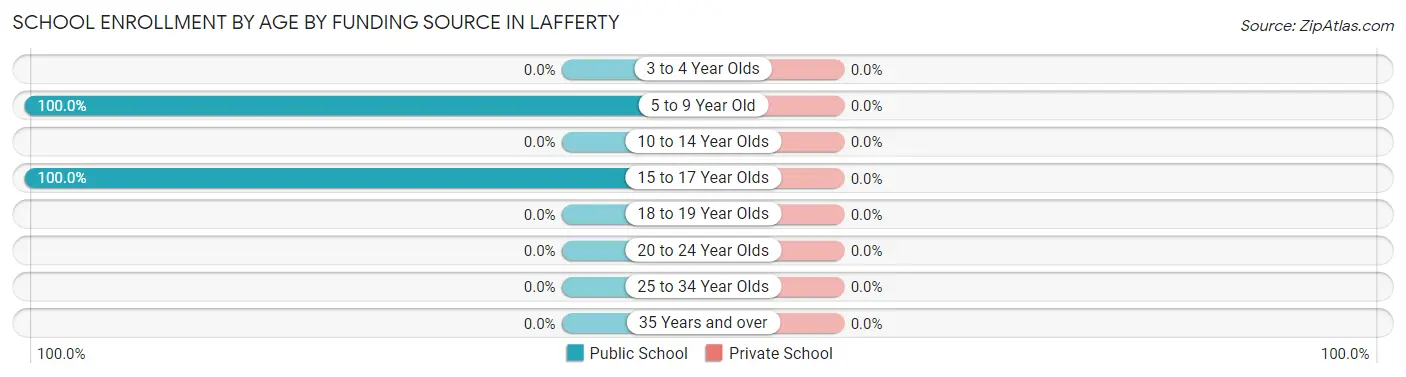
| Age Bracket | Public School | Private School |
| 3 to 4 Year Olds | 0 (0.0%) | 0 (0.0%) |
| 5 to 9 Year Old | 4 (100.0%) | 0 (0.0%) |
| 10 to 14 Year Olds | 0 (0.0%) | 0 (0.0%) |
| 15 to 17 Year Olds | 4 (100.0%) | 0 (0.0%) |
| 18 to 19 Year Olds | 0 (0.0%) | 0 (0.0%) |
| 20 to 24 Year Olds | 0 (0.0%) | 0 (0.0%) |
| 25 to 34 Year Olds | 0 (0.0%) | 0 (0.0%) |
| 35 Years and over | 0 (0.0%) | 0 (0.0%) |
| Total | 8 (100.0%) | 0 (0.0%) |
Educational Attainment by Field of Study in Lafferty
, and visual & performing arts (4 | 100.0%) are the most common fields of study among 4 individuals in Lafferty who have obtained a bachelor's degree or higher.
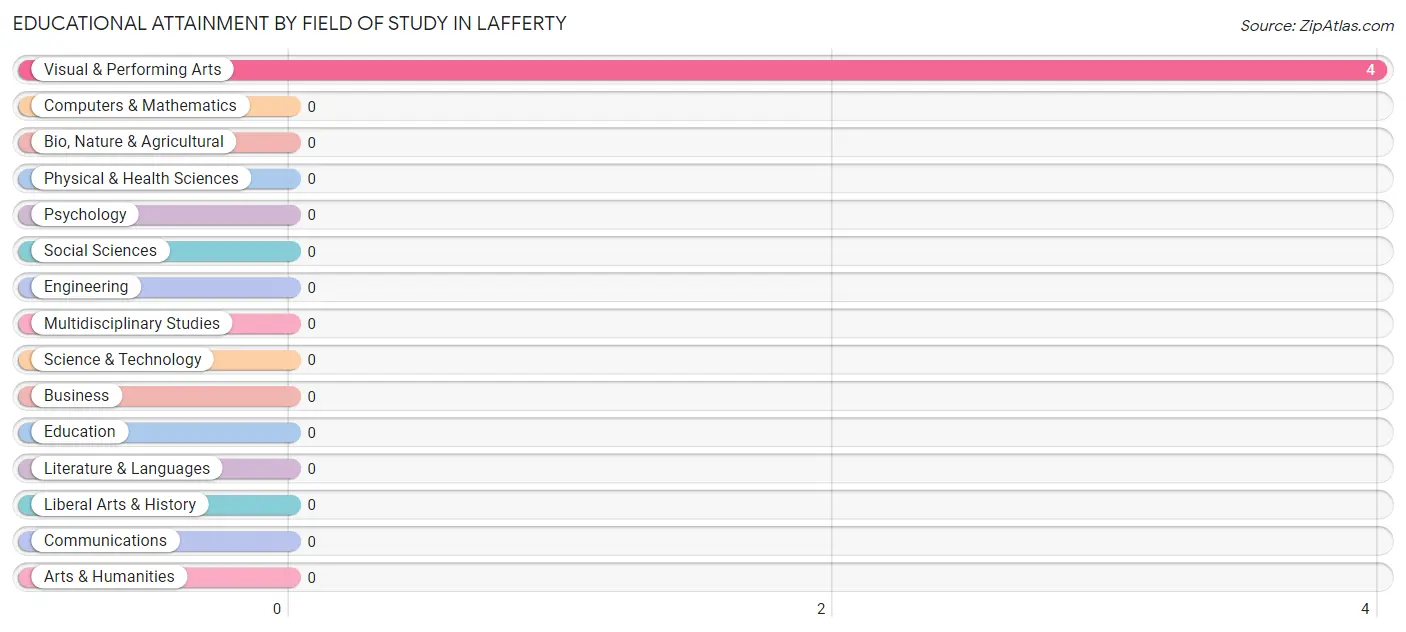
| Field of Study | # Graduates | % Graduates |
| Computers & Mathematics | 0 | 0.0% |
| Bio, Nature & Agricultural | 0 | 0.0% |
| Physical & Health Sciences | 0 | 0.0% |
| Psychology | 0 | 0.0% |
| Social Sciences | 0 | 0.0% |
| Engineering | 0 | 0.0% |
| Multidisciplinary Studies | 0 | 0.0% |
| Science & Technology | 0 | 0.0% |
| Business | 0 | 0.0% |
| Education | 0 | 0.0% |
| Literature & Languages | 0 | 0.0% |
| Liberal Arts & History | 0 | 0.0% |
| Visual & Performing Arts | 4 | 100.0% |
| Communications | 0 | 0.0% |
| Arts & Humanities | 0 | 0.0% |
| Total | 4 | 100.0% |
Transportation & Commute in Lafferty
Vehicle Availability by Sex in Lafferty
The most prevalent vehicle ownership categories in Lafferty are males with 1 vehicle (30, accounting for 48.4%) and females with 1 vehicle (0, making up 187.5%).
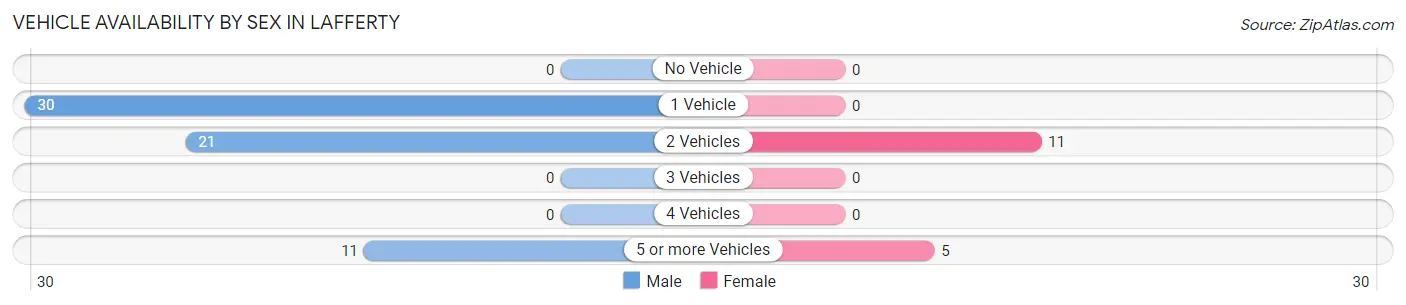
| Vehicles Available | Male | Female |
| No Vehicle | 0 (0.0%) | 0 (0.0%) |
| 1 Vehicle | 30 (48.4%) | 0 (0.0%) |
| 2 Vehicles | 21 (33.9%) | 11 (68.8%) |
| 3 Vehicles | 0 (0.0%) | 0 (0.0%) |
| 4 Vehicles | 0 (0.0%) | 0 (0.0%) |
| 5 or more Vehicles | 11 (17.7%) | 5 (31.2%) |
| Total | 62 (100.0%) | 16 (100.0%) |
Commute Time in Lafferty
The most frequently occuring commute durations in Lafferty are 20 to 24 minutes (32 commuters, 45.1%), 5 to 9 minutes (30 commuters, 42.2%), and 15 to 19 minutes (5 commuters, 7.0%).
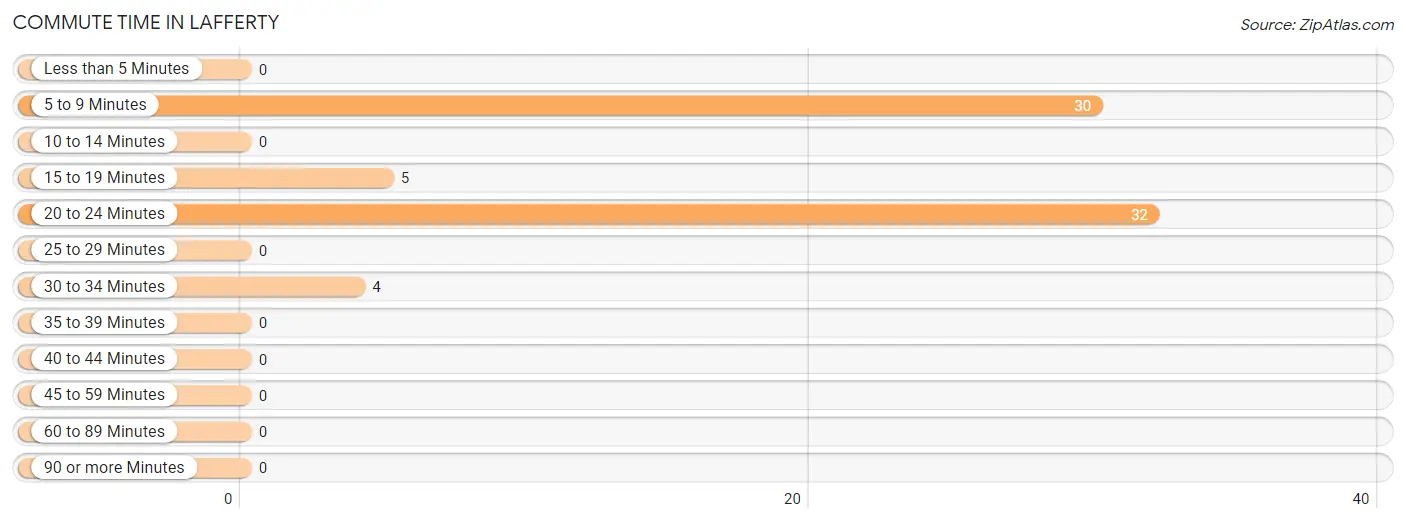
| Commute Time | # Commuters | % Commuters |
| Less than 5 Minutes | 0 | 0.0% |
| 5 to 9 Minutes | 30 | 42.2% |
| 10 to 14 Minutes | 0 | 0.0% |
| 15 to 19 Minutes | 5 | 7.0% |
| 20 to 24 Minutes | 32 | 45.1% |
| 25 to 29 Minutes | 0 | 0.0% |
| 30 to 34 Minutes | 4 | 5.6% |
| 35 to 39 Minutes | 0 | 0.0% |
| 40 to 44 Minutes | 0 | 0.0% |
| 45 to 59 Minutes | 0 | 0.0% |
| 60 to 89 Minutes | 0 | 0.0% |
| 90 or more Minutes | 0 | 0.0% |
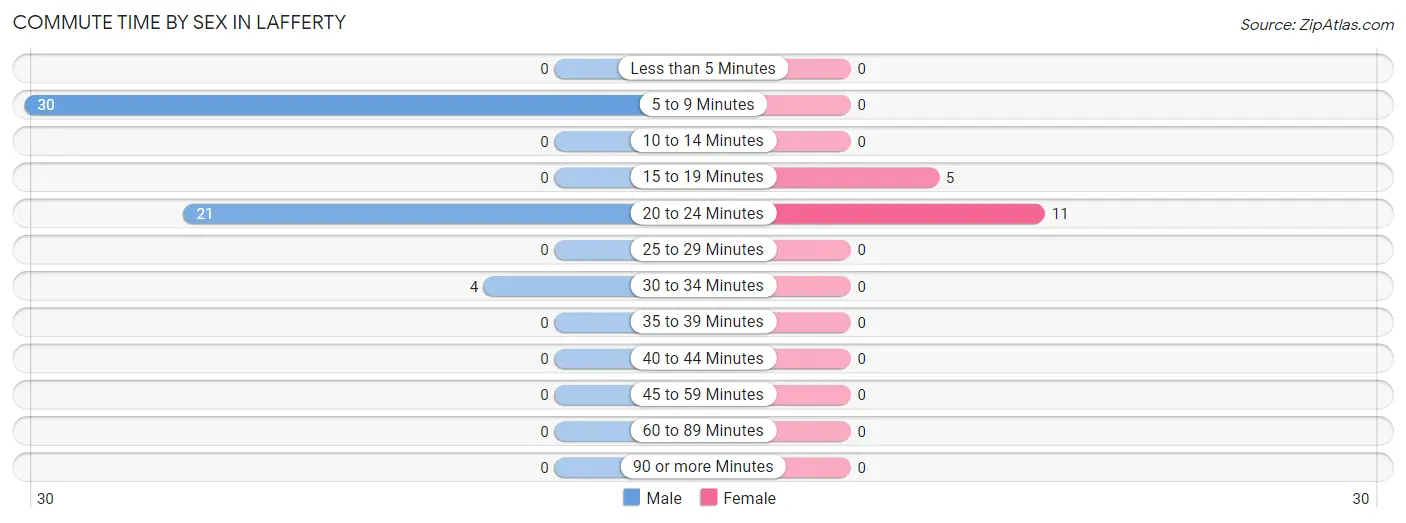
Commute Time by Sex in Lafferty
The most common commute times in Lafferty are 5 to 9 minutes (30 commuters, 54.5%) for males and 20 to 24 minutes (11 commuters, 68.8%) for females.
| Commute Time | Male | Female |
| Less than 5 Minutes | 0 (0.0%) | 0 (0.0%) |
| 5 to 9 Minutes | 30 (54.5%) | 0 (0.0%) |
| 10 to 14 Minutes | 0 (0.0%) | 0 (0.0%) |
| 15 to 19 Minutes | 0 (0.0%) | 5 (31.2%) |
| 20 to 24 Minutes | 21 (38.2%) | 11 (68.8%) |
| 25 to 29 Minutes | 0 (0.0%) | 0 (0.0%) |
| 30 to 34 Minutes | 4 (7.3%) | 0 (0.0%) |
| 35 to 39 Minutes | 0 (0.0%) | 0 (0.0%) |
| 40 to 44 Minutes | 0 (0.0%) | 0 (0.0%) |
| 45 to 59 Minutes | 0 (0.0%) | 0 (0.0%) |
| 60 to 89 Minutes | 0 (0.0%) | 0 (0.0%) |
| 90 or more Minutes | 0 (0.0%) | 0 (0.0%) |
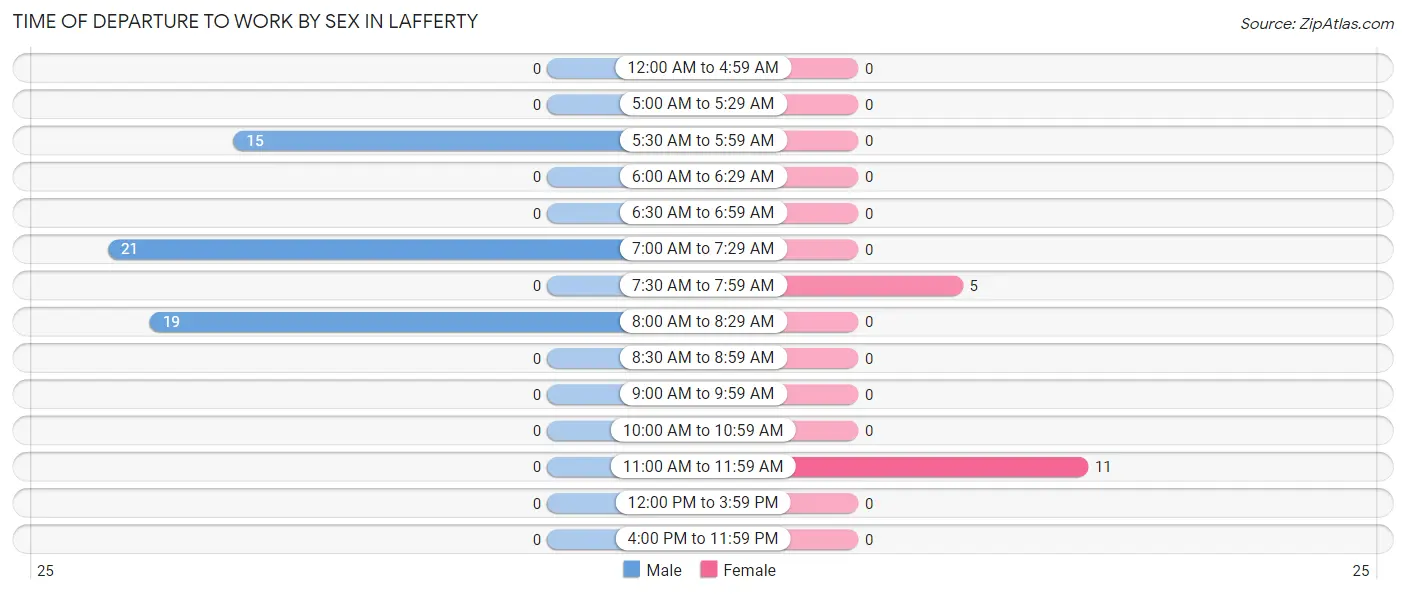
Time of Departure to Work by Sex in Lafferty
The most frequent times of departure to work in Lafferty are 7:00 AM to 7:29 AM (21, 38.2%) for males and 11:00 AM to 11:59 AM (11, 68.8%) for females.
| Time of Departure | Male | Female |
| 12:00 AM to 4:59 AM | 0 (0.0%) | 0 (0.0%) |
| 5:00 AM to 5:29 AM | 0 (0.0%) | 0 (0.0%) |
| 5:30 AM to 5:59 AM | 15 (27.3%) | 0 (0.0%) |
| 6:00 AM to 6:29 AM | 0 (0.0%) | 0 (0.0%) |
| 6:30 AM to 6:59 AM | 0 (0.0%) | 0 (0.0%) |
| 7:00 AM to 7:29 AM | 21 (38.2%) | 0 (0.0%) |
| 7:30 AM to 7:59 AM | 0 (0.0%) | 5 (31.2%) |
| 8:00 AM to 8:29 AM | 19 (34.5%) | 0 (0.0%) |
| 8:30 AM to 8:59 AM | 0 (0.0%) | 0 (0.0%) |
| 9:00 AM to 9:59 AM | 0 (0.0%) | 0 (0.0%) |
| 10:00 AM to 10:59 AM | 0 (0.0%) | 0 (0.0%) |
| 11:00 AM to 11:59 AM | 0 (0.0%) | 11 (68.8%) |
| 12:00 PM to 3:59 PM | 0 (0.0%) | 0 (0.0%) |
| 4:00 PM to 11:59 PM | 0 (0.0%) | 0 (0.0%) |
| Total | 55 (100.0%) | 16 (100.0%) |
Housing Occupancy in Lafferty
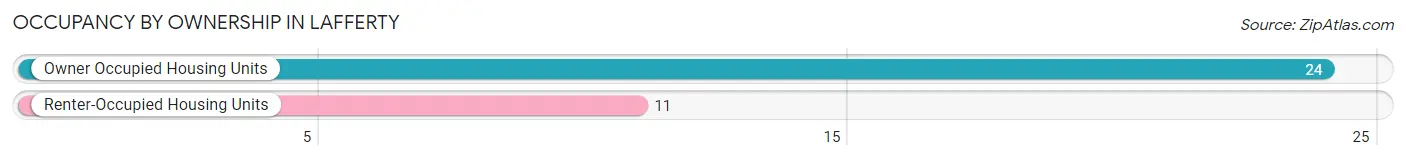
Occupancy by Ownership in Lafferty
Of the total 35 dwellings in Lafferty, owner-occupied units account for 24 (68.6%), while renter-occupied units make up 11 (31.4%).
| Occupancy | # Housing Units | % Housing Units |
| Owner Occupied Housing Units | 24 | 68.6% |
| Renter-Occupied Housing Units | 11 | 31.4% |
| Total Occupied Housing Units | 35 | 100.0% |
Occupancy by Household Size in Lafferty
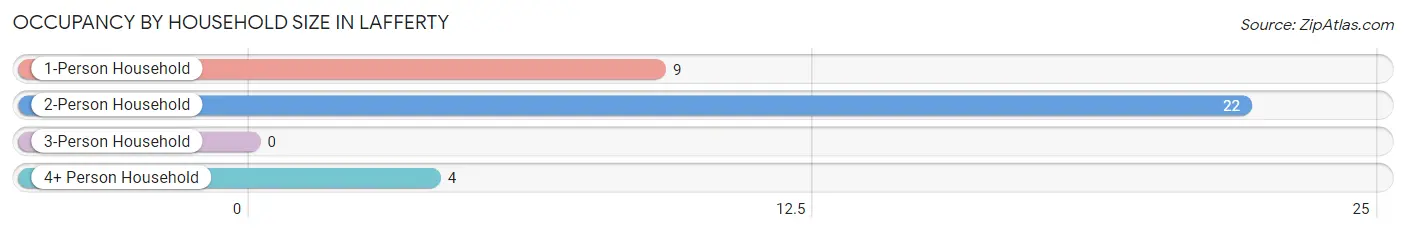
| Household Size | # Housing Units | % Housing Units |
| 1-Person Household | 9 | 25.7% |
| 2-Person Household | 22 | 62.9% |
| 3-Person Household | 0 | 0.0% |
| 4+ Person Household | 4 | 11.4% |
| Total Housing Units | 35 | 100.0% |
Occupancy by Ownership by Household Size in Lafferty
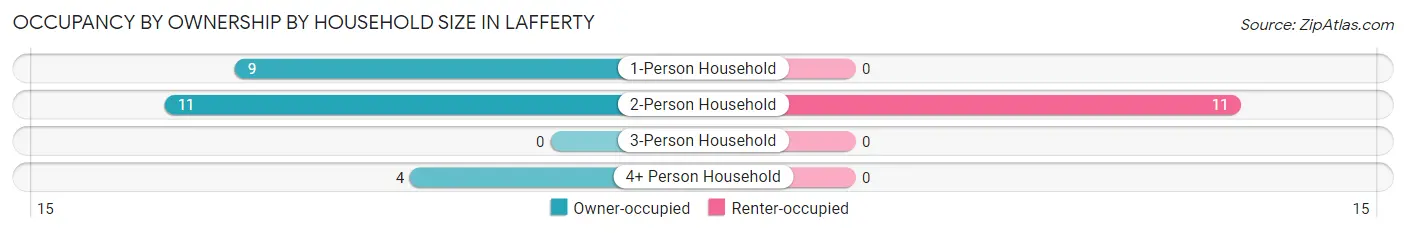
| Household Size | Owner-occupied | Renter-occupied |
| 1-Person Household | 9 (100.0%) | 0 (0.0%) |
| 2-Person Household | 11 (50.0%) | 11 (50.0%) |
| 3-Person Household | 0 (0.0%) | 0 (0.0%) |
| 4+ Person Household | 4 (100.0%) | 0 (0.0%) |
| Total Housing Units | 24 (68.6%) | 11 (31.4%) |
Occupancy by Educational Attainment in Lafferty
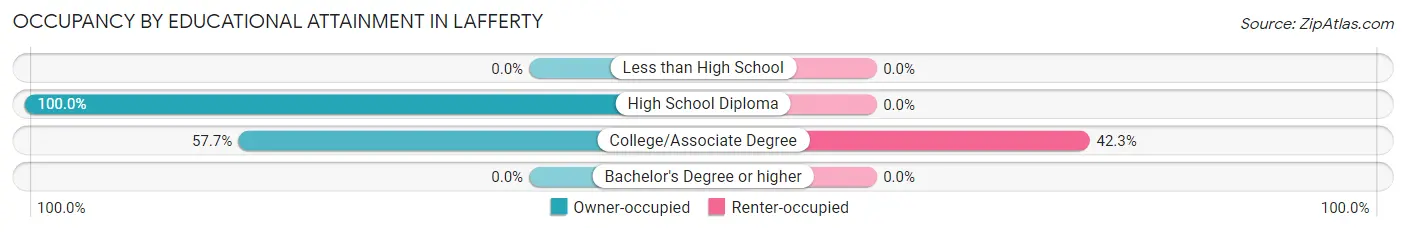
| Household Size | Owner-occupied | Renter-occupied |
| Less than High School | 0 (0.0%) | 0 (0.0%) |
| High School Diploma | 9 (100.0%) | 0 (0.0%) |
| College/Associate Degree | 15 (57.7%) | 11 (42.3%) |
| Bachelor's Degree or higher | 0 (0.0%) | 0 (0.0%) |
Occupancy by Age of Householder in Lafferty
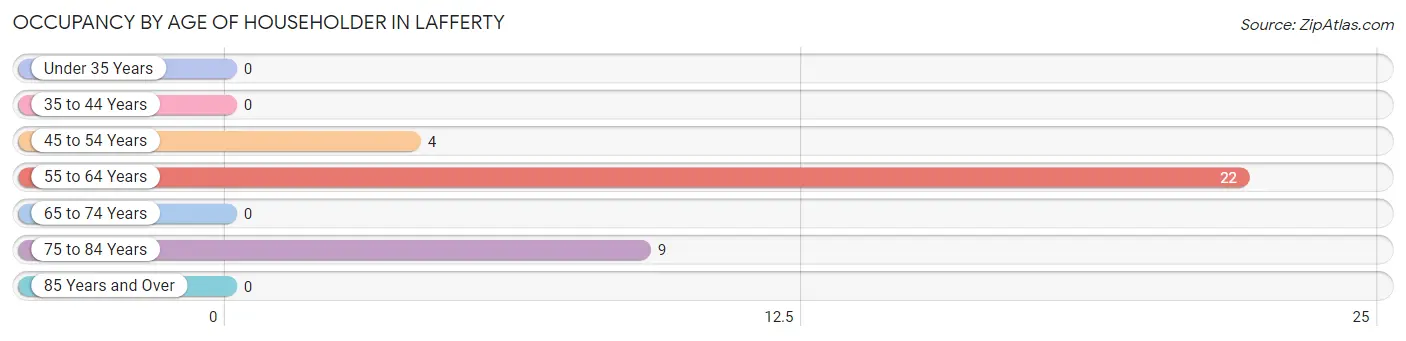
| Age Bracket | # Households | % Households |
| Under 35 Years | 0 | 0.0% |
| 35 to 44 Years | 0 | 0.0% |
| 45 to 54 Years | 4 | 11.4% |
| 55 to 64 Years | 22 | 62.9% |
| 65 to 74 Years | 0 | 0.0% |
| 75 to 84 Years | 9 | 25.7% |
| 85 Years and Over | 0 | 0.0% |
| Total | 35 | 100.0% |
Housing Finances in Lafferty
Median Income by Occupancy in Lafferty
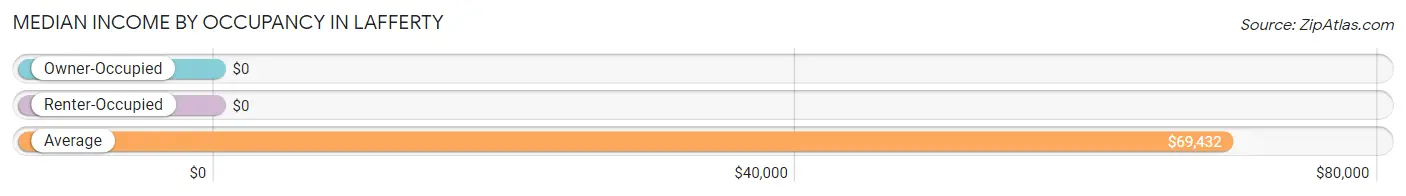
| Occupancy Type | # Households | Median Income |
| Owner-Occupied | 24 (68.6%) | $0 |
| Renter-Occupied | 11 (31.4%) | $0 |
| Average | 35 (100.0%) | $69,432 |
Occupancy by Householder Income Bracket in Lafferty
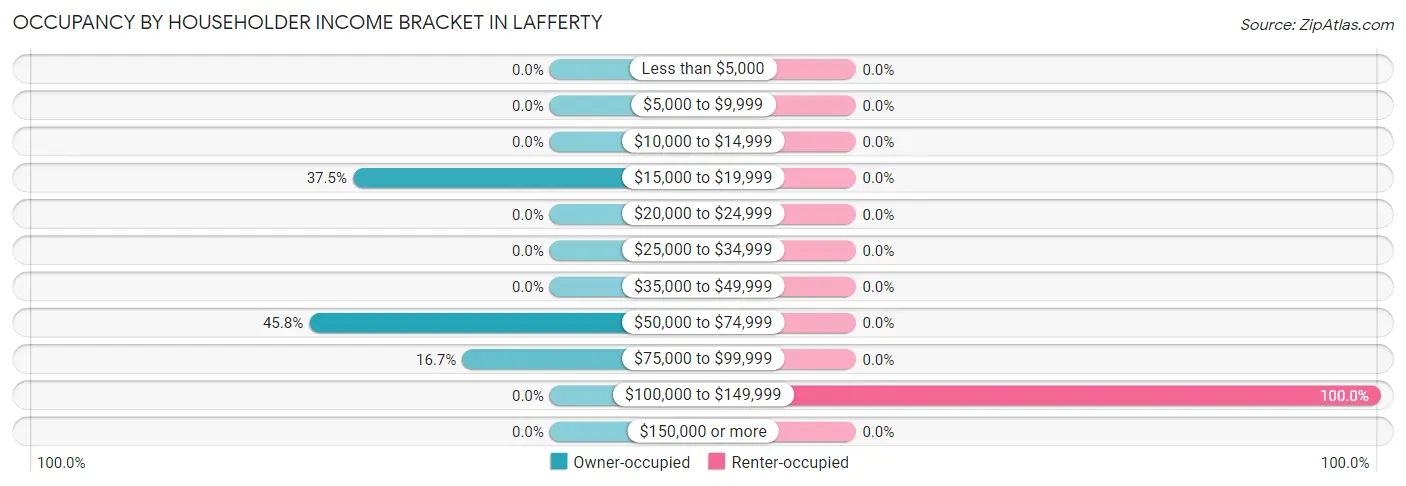
| Income Bracket | Owner-occupied | Renter-occupied |
| Less than $5,000 | 0 (0.0%) | 0 (0.0%) |
| $5,000 to $9,999 | 0 (0.0%) | 0 (0.0%) |
| $10,000 to $14,999 | 0 (0.0%) | 0 (0.0%) |
| $15,000 to $19,999 | 9 (37.5%) | 0 (0.0%) |
| $20,000 to $24,999 | 0 (0.0%) | 0 (0.0%) |
| $25,000 to $34,999 | 0 (0.0%) | 0 (0.0%) |
| $35,000 to $49,999 | 0 (0.0%) | 0 (0.0%) |
| $50,000 to $74,999 | 11 (45.8%) | 0 (0.0%) |
| $75,000 to $99,999 | 4 (16.7%) | 0 (0.0%) |
| $100,000 to $149,999 | 0 (0.0%) | 11 (100.0%) |
| $150,000 or more | 0 (0.0%) | 0 (0.0%) |
| Total | 24 (100.0%) | 11 (100.0%) |
Monthly Housing Cost Tiers in Lafferty
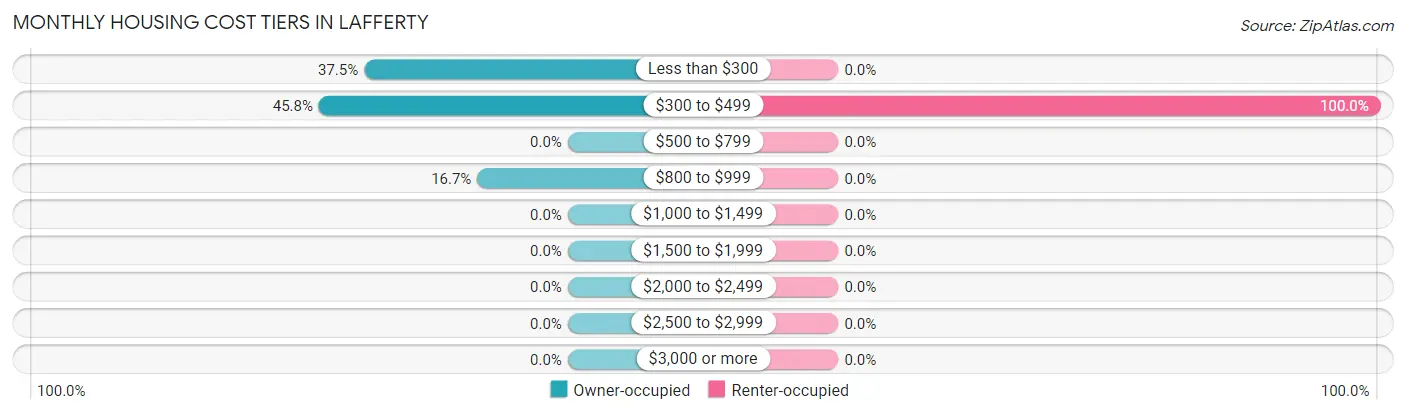
| Monthly Cost | Owner-occupied | Renter-occupied |
| Less than $300 | 9 (37.5%) | 0 (0.0%) |
| $300 to $499 | 11 (45.8%) | 11 (100.0%) |
| $500 to $799 | 0 (0.0%) | 0 (0.0%) |
| $800 to $999 | 4 (16.7%) | 0 (0.0%) |
| $1,000 to $1,499 | 0 (0.0%) | 0 (0.0%) |
| $1,500 to $1,999 | 0 (0.0%) | 0 (0.0%) |
| $2,000 to $2,499 | 0 (0.0%) | 0 (0.0%) |
| $2,500 to $2,999 | 0 (0.0%) | 0 (0.0%) |
| $3,000 or more | 0 (0.0%) | 0 (0.0%) |
| Total | 24 (100.0%) | 11 (100.0%) |
Physical Housing Characteristics in Lafferty
Housing Structures in Lafferty
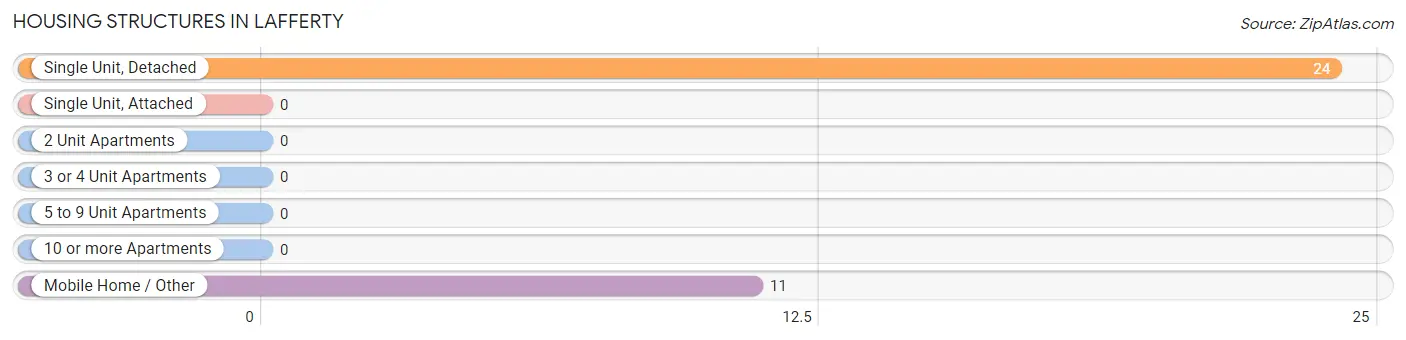
| Structure Type | # Housing Units | % Housing Units |
| Single Unit, Detached | 24 | 68.6% |
| Single Unit, Attached | 0 | 0.0% |
| 2 Unit Apartments | 0 | 0.0% |
| 3 or 4 Unit Apartments | 0 | 0.0% |
| 5 to 9 Unit Apartments | 0 | 0.0% |
| 10 or more Apartments | 0 | 0.0% |
| Mobile Home / Other | 11 | 31.4% |
| Total | 35 | 100.0% |
Housing Structures by Occupancy in Lafferty
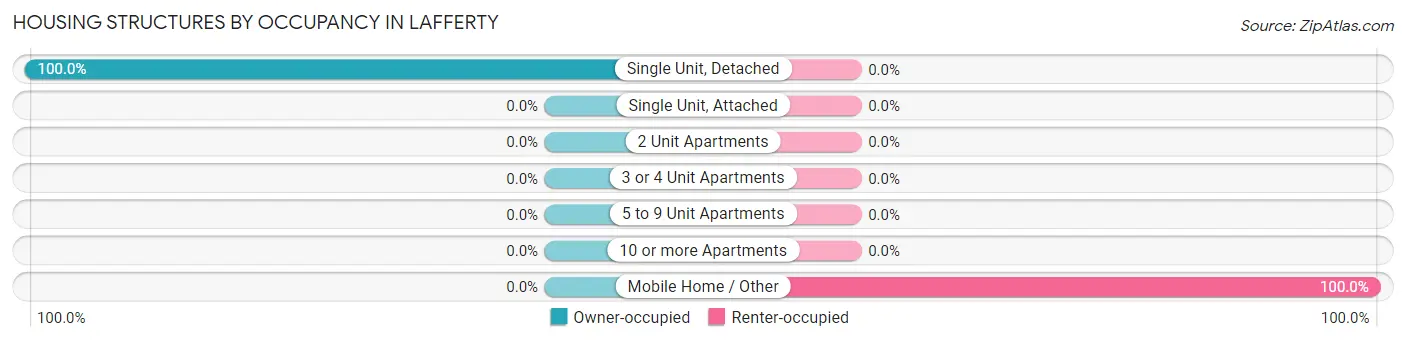
| Structure Type | Owner-occupied | Renter-occupied |
| Single Unit, Detached | 24 (100.0%) | 0 (0.0%) |
| Single Unit, Attached | 0 (0.0%) | 0 (0.0%) |
| 2 Unit Apartments | 0 (0.0%) | 0 (0.0%) |
| 3 or 4 Unit Apartments | 0 (0.0%) | 0 (0.0%) |
| 5 to 9 Unit Apartments | 0 (0.0%) | 0 (0.0%) |
| 10 or more Apartments | 0 (0.0%) | 0 (0.0%) |
| Mobile Home / Other | 0 (0.0%) | 11 (100.0%) |
| Total | 24 (68.6%) | 11 (31.4%) |
Housing Structures by Number of Rooms in Lafferty
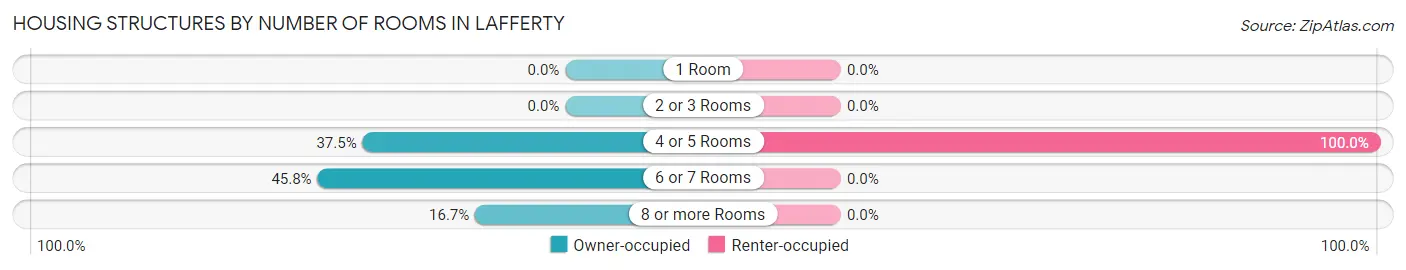
| Number of Rooms | Owner-occupied | Renter-occupied |
| 1 Room | 0 (0.0%) | 0 (0.0%) |
| 2 or 3 Rooms | 0 (0.0%) | 0 (0.0%) |
| 4 or 5 Rooms | 9 (37.5%) | 11 (100.0%) |
| 6 or 7 Rooms | 11 (45.8%) | 0 (0.0%) |
| 8 or more Rooms | 4 (16.7%) | 0 (0.0%) |
| Total | 24 (100.0%) | 11 (100.0%) |
Housing Structure by Heating Type in Lafferty
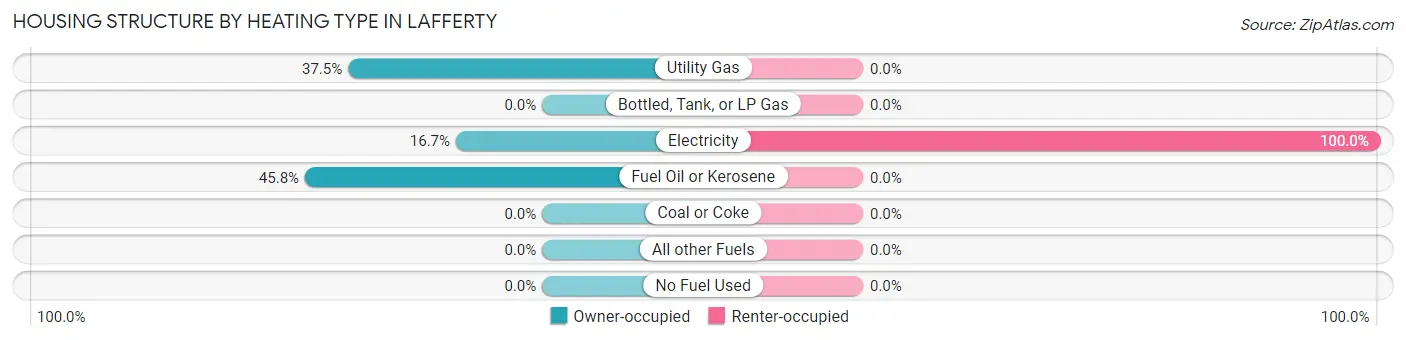
| Heating Type | Owner-occupied | Renter-occupied |
| Utility Gas | 9 (37.5%) | 0 (0.0%) |
| Bottled, Tank, or LP Gas | 0 (0.0%) | 0 (0.0%) |
| Electricity | 4 (16.7%) | 11 (100.0%) |
| Fuel Oil or Kerosene | 11 (45.8%) | 0 (0.0%) |
| Coal or Coke | 0 (0.0%) | 0 (0.0%) |
| All other Fuels | 0 (0.0%) | 0 (0.0%) |
| No Fuel Used | 0 (0.0%) | 0 (0.0%) |
| Total | 24 (100.0%) | 11 (100.0%) |
Household Vehicle Usage in Lafferty
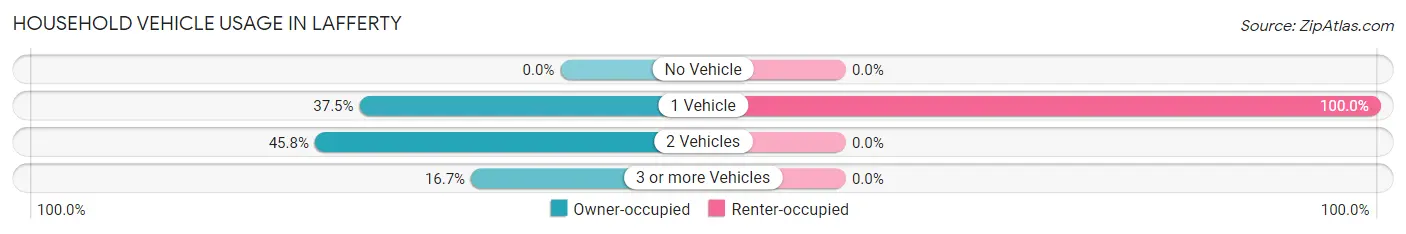
| Vehicles per Household | Owner-occupied | Renter-occupied |
| No Vehicle | 0 (0.0%) | 0 (0.0%) |
| 1 Vehicle | 9 (37.5%) | 11 (100.0%) |
| 2 Vehicles | 11 (45.8%) | 0 (0.0%) |
| 3 or more Vehicles | 4 (16.7%) | 0 (0.0%) |
| Total | 24 (100.0%) | 11 (100.0%) |
Real Estate & Mortgages in Lafferty
Real Estate and Mortgage Overview in Lafferty
| Characteristic | Without Mortgage | With Mortgage |
| Housing Units | 20 | 4 |
| Median Property Value | - | - |
| Median Household Income | - | - |
| Monthly Housing Costs | - | - |
| Real Estate Taxes | - | - |
Property Value by Mortgage Status in Lafferty
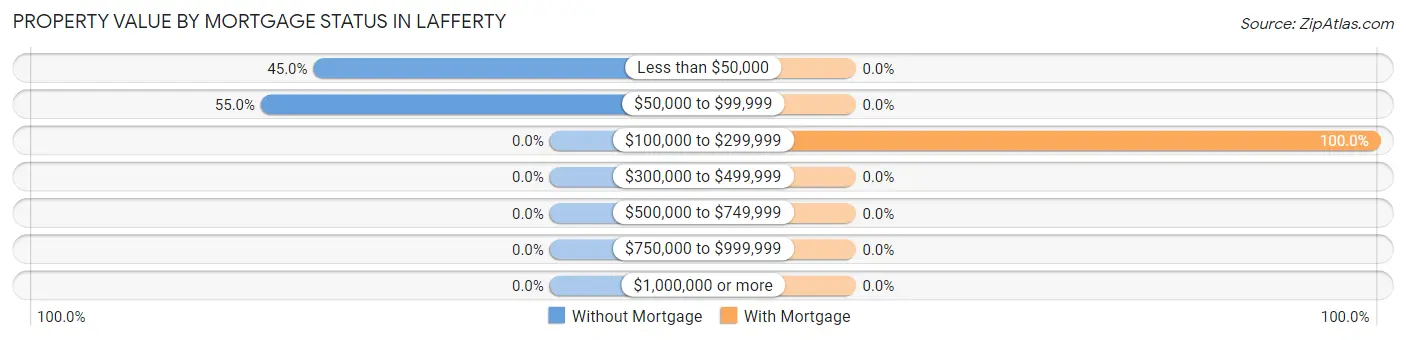
| Property Value | Without Mortgage | With Mortgage |
| Less than $50,000 | 9 (45.0%) | 0 (0.0%) |
| $50,000 to $99,999 | 11 (55.0%) | 0 (0.0%) |
| $100,000 to $299,999 | 0 (0.0%) | 4 (100.0%) |
| $300,000 to $499,999 | 0 (0.0%) | 0 (0.0%) |
| $500,000 to $749,999 | 0 (0.0%) | 0 (0.0%) |
| $750,000 to $999,999 | 0 (0.0%) | 0 (0.0%) |
| $1,000,000 or more | 0 (0.0%) | 0 (0.0%) |
| Total | 20 (100.0%) | 4 (100.0%) |
Household Income by Mortgage Status in Lafferty
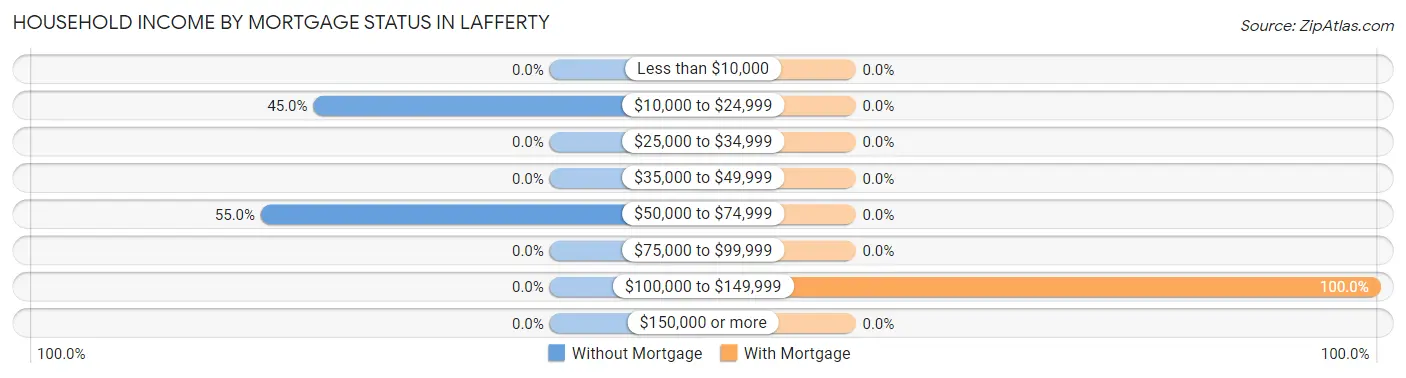
| Household Income | Without Mortgage | With Mortgage |
| Less than $10,000 | 0 (0.0%) | 0 (0.0%) |
| $10,000 to $24,999 | 9 (45.0%) | 0 (0.0%) |
| $25,000 to $34,999 | 0 (0.0%) | 0 (0.0%) |
| $35,000 to $49,999 | 0 (0.0%) | 0 (0.0%) |
| $50,000 to $74,999 | 11 (55.0%) | 0 (0.0%) |
| $75,000 to $99,999 | 0 (0.0%) | 0 (0.0%) |
| $100,000 to $149,999 | 0 (0.0%) | 4 (100.0%) |
| $150,000 or more | 0 (0.0%) | 0 (0.0%) |
| Total | 20 (100.0%) | 4 (100.0%) |
Property Value to Household Income Ratio in Lafferty
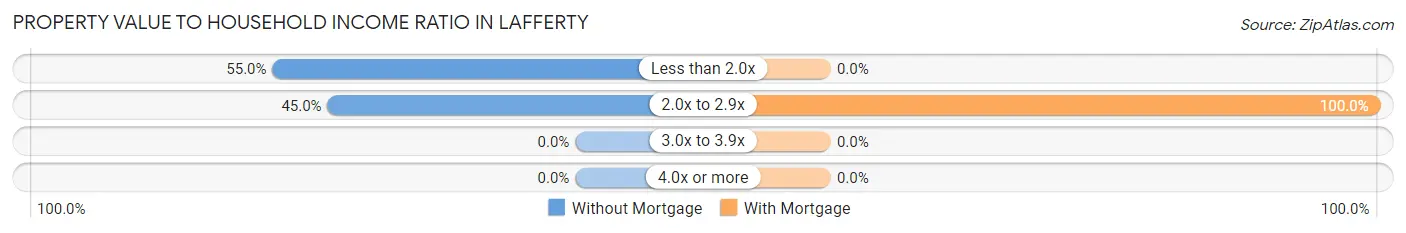
| Value-to-Income Ratio | Without Mortgage | With Mortgage |
| Less than 2.0x | 11 (55.0%) | 0 (0.0%) |
| 2.0x to 2.9x | 9 (45.0%) | 4 (100.0%) |
| 3.0x to 3.9x | 0 (0.0%) | 0 (0.0%) |
| 4.0x or more | 0 (0.0%) | 0 (0.0%) |
| Total | 20 (100.0%) | 4 (100.0%) |
Real Estate Taxes by Mortgage Status in Lafferty
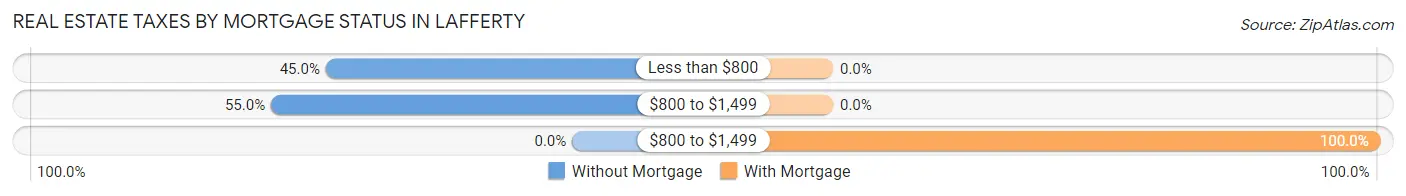
| Property Taxes | Without Mortgage | With Mortgage |
| Less than $800 | 9 (45.0%) | 0 (0.0%) |
| $800 to $1,499 | 11 (55.0%) | 0 (0.0%) |
| $800 to $1,499 | 0 (0.0%) | 4 (100.0%) |
| Total | 20 (100.0%) | 4 (100.0%) |
Health & Disability in Lafferty
Health Insurance Coverage by Age in Lafferty
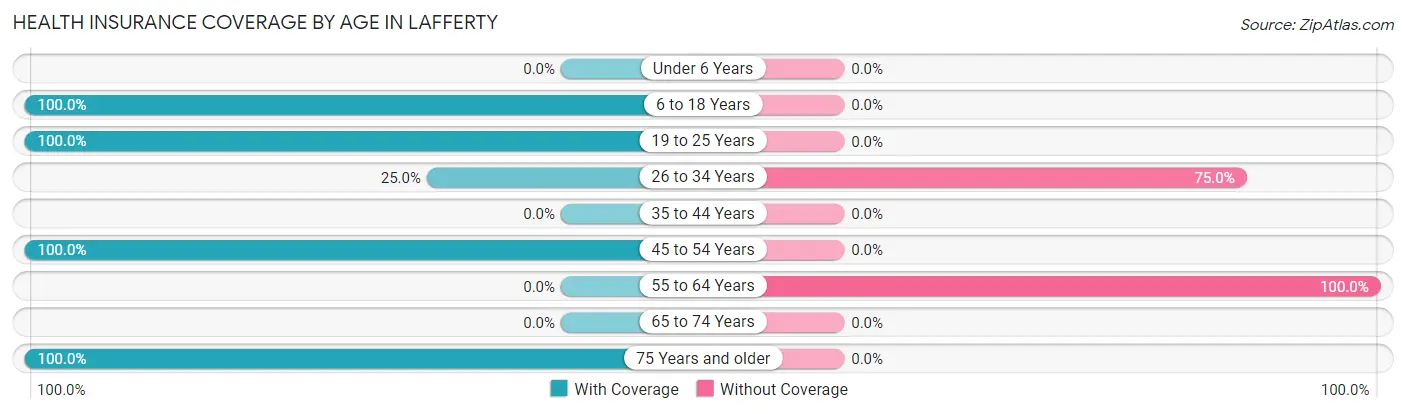
| Age Bracket | With Coverage | Without Coverage |
| Under 6 Years | 0 (0.0%) | 0 (0.0%) |
| 6 to 18 Years | 8 (100.0%) | 0 (0.0%) |
| 19 to 25 Years | 5 (100.0%) | 0 (0.0%) |
| 26 to 34 Years | 7 (25.0%) | 21 (75.0%) |
| 35 to 44 Years | 0 (0.0%) | 0 (0.0%) |
| 45 to 54 Years | 8 (100.0%) | 0 (0.0%) |
| 55 to 64 Years | 0 (0.0%) | 41 (100.0%) |
| 65 to 74 Years | 0 (0.0%) | 0 (0.0%) |
| 75 Years and older | 9 (100.0%) | 0 (0.0%) |
| Total | 37 (37.4%) | 62 (62.6%) |
Health Insurance Coverage by Citizenship Status in Lafferty
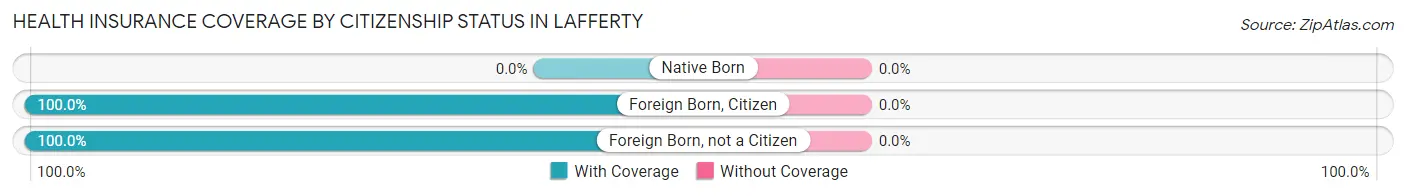
| Citizenship Status | With Coverage | Without Coverage |
| Native Born | 0 (0.0%) | 0 (0.0%) |
| Foreign Born, Citizen | 8 (100.0%) | 0 (0.0%) |
| Foreign Born, not a Citizen | 5 (100.0%) | 0 (0.0%) |
Health Insurance Coverage by Household Income in Lafferty
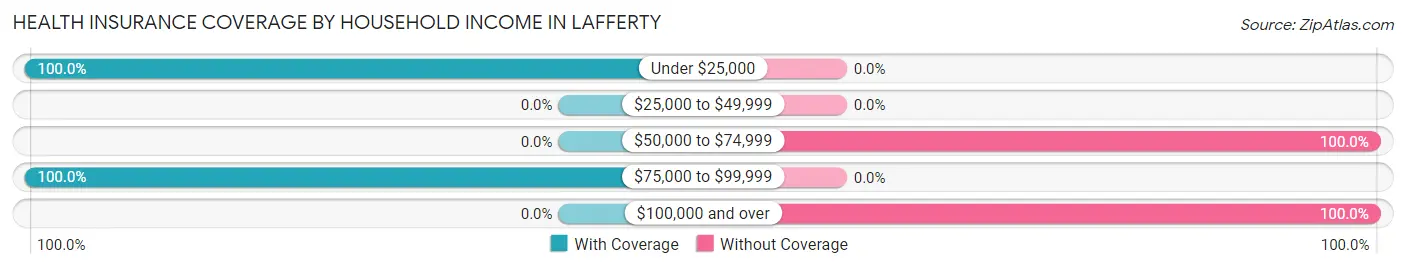
| Household Income | With Coverage | Without Coverage |
| Under $25,000 | 9 (100.0%) | 0 (0.0%) |
| $25,000 to $49,999 | 0 (0.0%) | 0 (0.0%) |
| $50,000 to $74,999 | 0 (0.0%) | 32 (100.0%) |
| $75,000 to $99,999 | 28 (100.0%) | 0 (0.0%) |
| $100,000 and over | 0 (0.0%) | 30 (100.0%) |
Public vs Private Health Insurance Coverage by Age in Lafferty
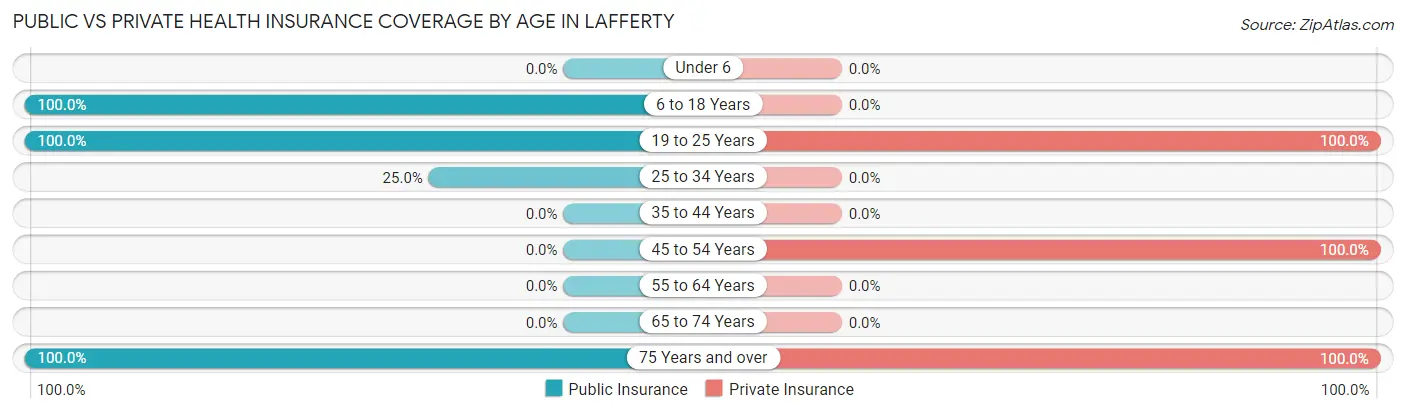
| Age Bracket | Public Insurance | Private Insurance |
| Under 6 | 0 (0.0%) | 0 (0.0%) |
| 6 to 18 Years | 8 (100.0%) | 0 (0.0%) |
| 19 to 25 Years | 5 (100.0%) | 5 (100.0%) |
| 25 to 34 Years | 7 (25.0%) | 0 (0.0%) |
| 35 to 44 Years | 0 (0.0%) | 0 (0.0%) |
| 45 to 54 Years | 0 (0.0%) | 8 (100.0%) |
| 55 to 64 Years | 0 (0.0%) | 0 (0.0%) |
| 65 to 74 Years | 0 (0.0%) | 0 (0.0%) |
| 75 Years and over | 9 (100.0%) | 9 (100.0%) |
| Total | 29 (29.3%) | 22 (22.2%) |
Disability Status by Sex by Age in Lafferty
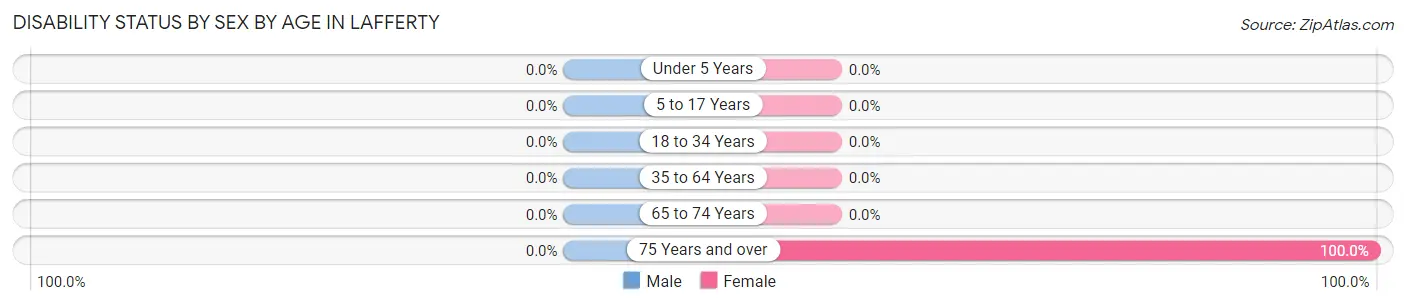
| Age Bracket | Male | Female |
| Under 5 Years | 0 (0.0%) | 0 (0.0%) |
| 5 to 17 Years | 0 (0.0%) | 0 (0.0%) |
| 18 to 34 Years | 0 (0.0%) | 0 (0.0%) |
| 35 to 64 Years | 0 (0.0%) | 0 (0.0%) |
| 65 to 74 Years | 0 (0.0%) | 0 (0.0%) |
| 75 Years and over | 0 (0.0%) | 9 (100.0%) |
Disability Class by Sex by Age in Lafferty
Disability Class: Hearing Difficulty
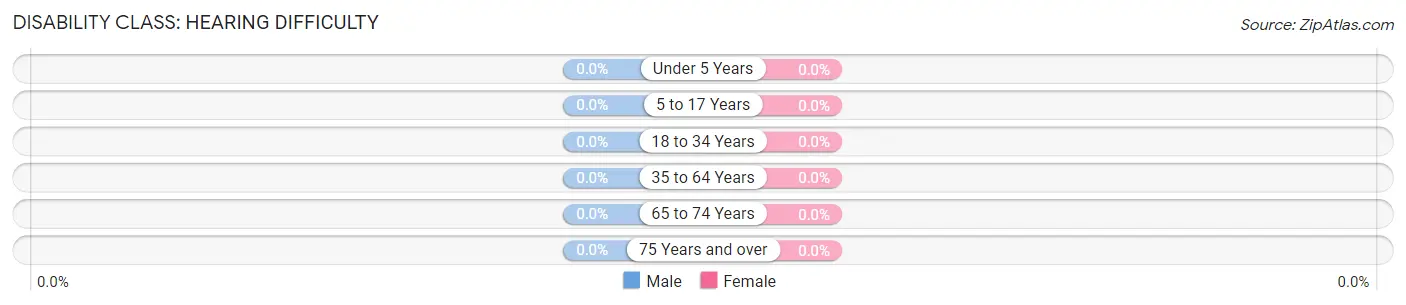
| Age Bracket | Male | Female |
| Under 5 Years | 0 (0.0%) | 0 (0.0%) |
| 5 to 17 Years | 0 (0.0%) | 0 (0.0%) |
| 18 to 34 Years | 0 (0.0%) | 0 (0.0%) |
| 35 to 64 Years | 0 (0.0%) | 0 (0.0%) |
| 65 to 74 Years | 0 (0.0%) | 0 (0.0%) |
| 75 Years and over | 0 (0.0%) | 0 (0.0%) |
Disability Class: Vision Difficulty
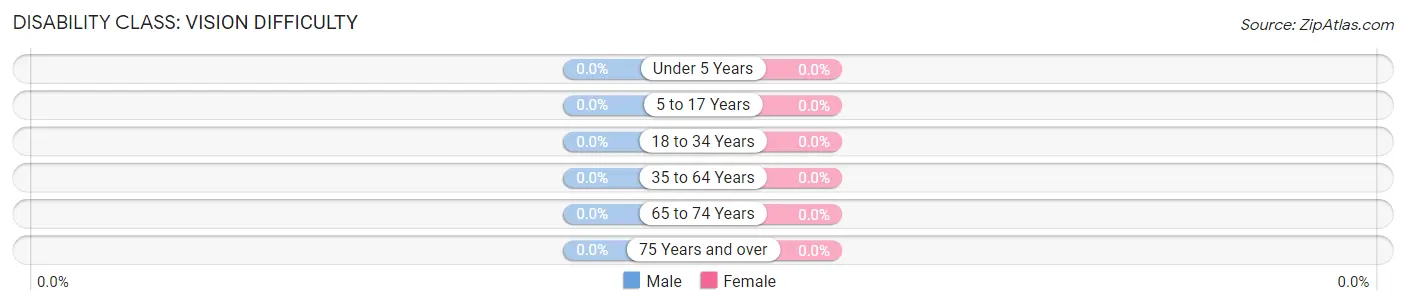
| Age Bracket | Male | Female |
| Under 5 Years | 0 (0.0%) | 0 (0.0%) |
| 5 to 17 Years | 0 (0.0%) | 0 (0.0%) |
| 18 to 34 Years | 0 (0.0%) | 0 (0.0%) |
| 35 to 64 Years | 0 (0.0%) | 0 (0.0%) |
| 65 to 74 Years | 0 (0.0%) | 0 (0.0%) |
| 75 Years and over | 0 (0.0%) | 0 (0.0%) |
Disability Class: Cognitive Difficulty
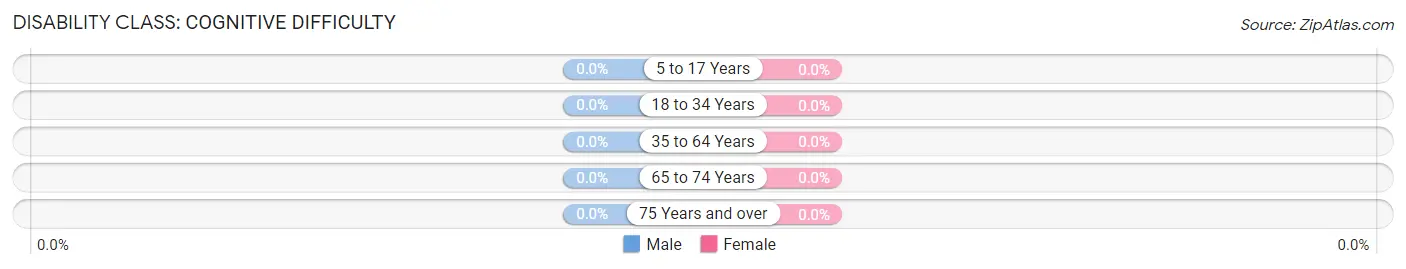
| Age Bracket | Male | Female |
| 5 to 17 Years | 0 (0.0%) | 0 (0.0%) |
| 18 to 34 Years | 0 (0.0%) | 0 (0.0%) |
| 35 to 64 Years | 0 (0.0%) | 0 (0.0%) |
| 65 to 74 Years | 0 (0.0%) | 0 (0.0%) |
| 75 Years and over | 0 (0.0%) | 0 (0.0%) |
Disability Class: Ambulatory Difficulty
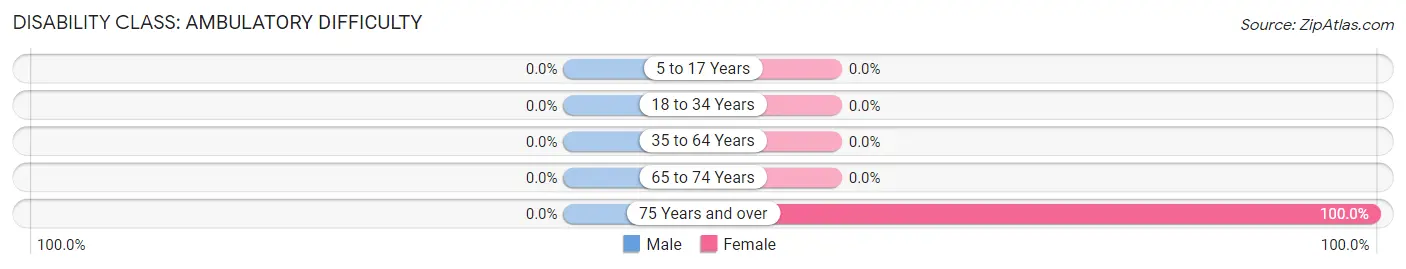
| Age Bracket | Male | Female |
| 5 to 17 Years | 0 (0.0%) | 0 (0.0%) |
| 18 to 34 Years | 0 (0.0%) | 0 (0.0%) |
| 35 to 64 Years | 0 (0.0%) | 0 (0.0%) |
| 65 to 74 Years | 0 (0.0%) | 0 (0.0%) |
| 75 Years and over | 0 (0.0%) | 9 (100.0%) |
Disability Class: Self-Care Difficulty
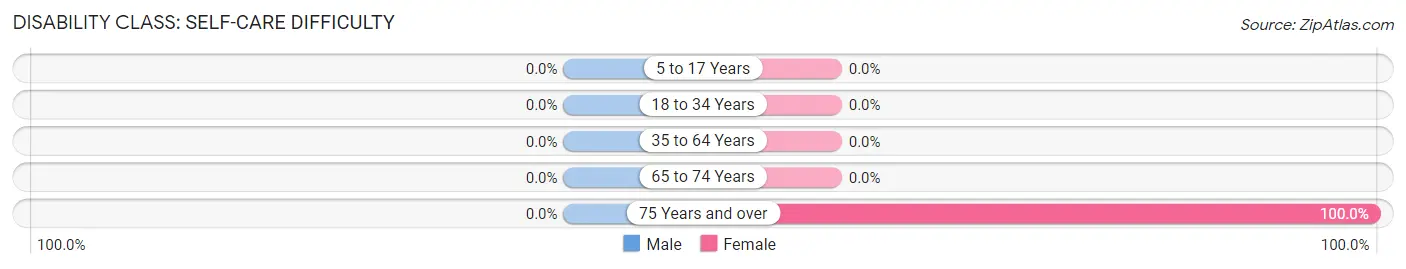
| Age Bracket | Male | Female |
| 5 to 17 Years | 0 (0.0%) | 0 (0.0%) |
| 18 to 34 Years | 0 (0.0%) | 0 (0.0%) |
| 35 to 64 Years | 0 (0.0%) | 0 (0.0%) |
| 65 to 74 Years | 0 (0.0%) | 0 (0.0%) |
| 75 Years and over | 0 (0.0%) | 9 (100.0%) |
Technology Access in Lafferty
Computing Device Access in Lafferty
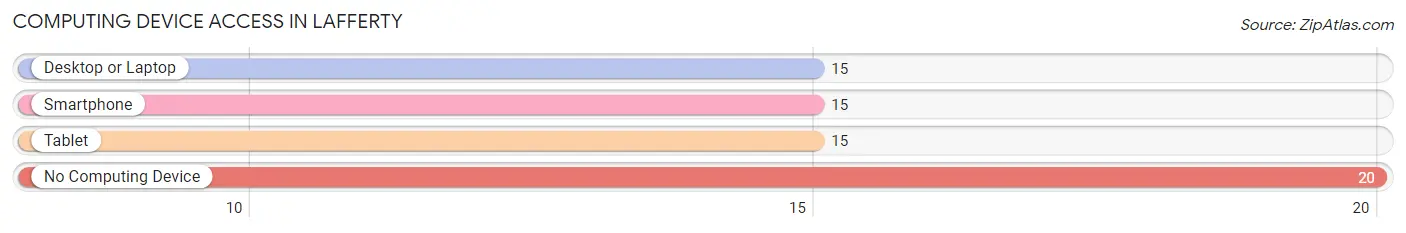
| Device Type | # Households | % Households |
| Desktop or Laptop | 15 | 42.9% |
| Smartphone | 15 | 42.9% |
| Tablet | 15 | 42.9% |
| No Computing Device | 20 | 57.1% |
| Total | 35 | 100.0% |
Internet Access in Lafferty
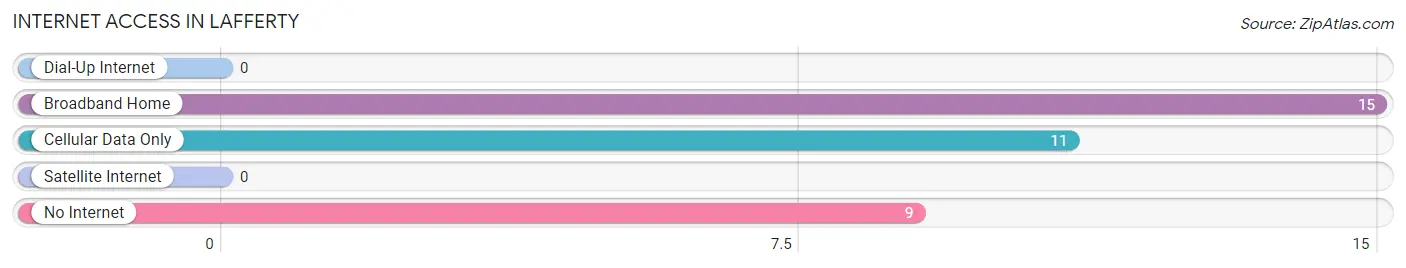
| Internet Type | # Households | % Households |
| Dial-Up Internet | 0 | 0.0% |
| Broadband Home | 15 | 42.9% |
| Cellular Data Only | 11 | 31.4% |
| Satellite Internet | 0 | 0.0% |
| No Internet | 9 | 25.7% |
| Total | 35 | 100.0% |
Lafferty Summary
Lafferty is a small village located in Belmont County, Ohio. It is situated on the Ohio River, approximately 25 miles west of Wheeling, West Virginia. The village has a population of approximately 200 people and is part of the St. Clairsville-Richland City School District.
History
Lafferty was founded in 1817 by John Lafferty, a Revolutionary War veteran. He purchased the land from the United States government and established a small settlement. The village was originally known as Lafferty’s Landing, but the name was changed to Lafferty in 1820.
The village grew slowly over the years, but it was not until the late 19th century that it began to experience significant growth. In 1876, the Wheeling and Lake Erie Railroad was built through the village, connecting it to the larger cities of Wheeling and Cleveland. This allowed for increased trade and commerce, and the village began to thrive.
In the early 20th century, the village was home to several businesses, including a general store, a blacksmith shop, a sawmill, and a gristmill. The village also had a post office, a school, and a church.
Geography
Lafferty is located in Belmont County, Ohio, on the Ohio River. It is situated approximately 25 miles west of Wheeling, West Virginia. The village is surrounded by rolling hills and farmland. The nearest major city is St. Clairsville, which is approximately 10 miles to the east.
The climate in Lafferty is humid continental, with hot summers and cold winters. The average annual temperature is around 50 degrees Fahrenheit. The average annual precipitation is around 40 inches.
Economy
The economy of Lafferty is largely based on agriculture. The village is home to several farms, which produce a variety of crops, including corn, soybeans, and wheat. The village also has a few small businesses, including a general store, a gas station, and a restaurant.
Demographics
As of the 2010 census, the population of Lafferty was approximately 200 people. The racial makeup of the village was 97.5% White, 0.5% African American, 0.5% Native American, and 1.5% from other races. The median household income was $37,500, and the median family income was $41,250. The per capita income was $17,500. Approximately 10.5% of the population was below the poverty line.
Common Questions
What is Per Capita Income in Lafferty?
Per Capita income in Lafferty is $35,010.
What is the Median Household income in Lafferty?
Median Household Income in Lafferty is $69,432.
What is Inequality or Gini Index in Lafferty?
Inequality or Gini Index in Lafferty is 0.26.
What is the Total Population of Lafferty?
Total Population of Lafferty is 99.
What is the Total Male Population of Lafferty?
Total Male Population of Lafferty is 70.
What is the Total Female Population of Lafferty?
Total Female Population of Lafferty is 29.
What is the Ratio of Males per 100 Females in Lafferty?
There are 241.38 Males per 100 Females in Lafferty.
What is the Ratio of Females per 100 Males in Lafferty?
There are 41.43 Females per 100 Males in Lafferty.
What is the Median Population Age in Lafferty?
Median Population Age in Lafferty is 56.0 Years.
What is the Average Family Size in Lafferty
Average Family Size in Lafferty is 4.0 People.
What is the Average Household Size in Lafferty
Average Household Size in Lafferty is 2.8 People.
How Large is the Labor Force in Lafferty?
There are 78 People in the Labor Forcein in Lafferty.
What is the Percentage of People in the Labor Force in Lafferty?
82.1% of People are in the Labor Force in Lafferty.