Hanging Rock, OH Map & Demographics
Hanging Rock Map
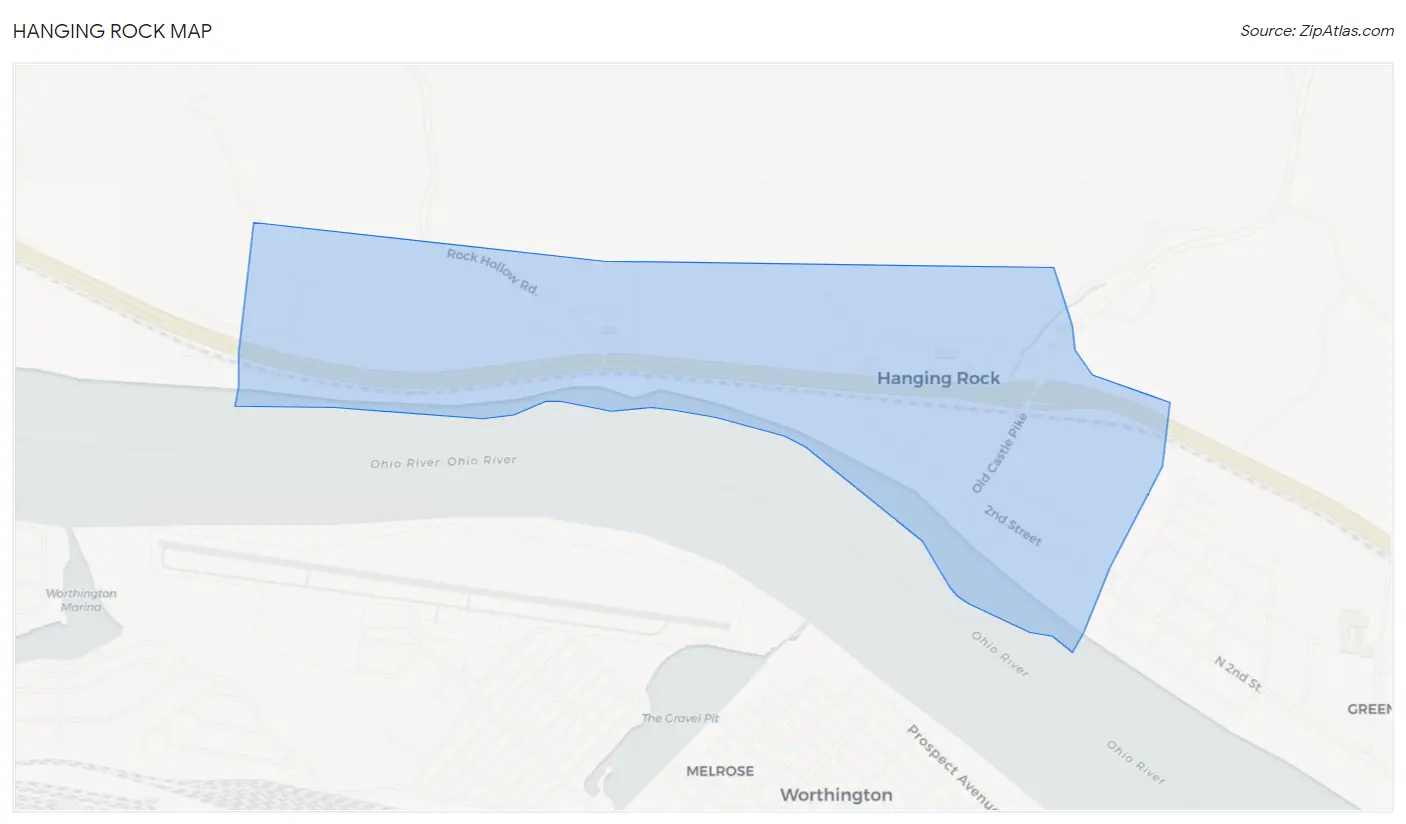
Hanging Rock Overview
$29,801
PER CAPITA INCOME
$82,750
AVG FAMILY INCOME
$54,750
AVG HOUSEHOLD INCOME
51.2%
WAGE / INCOME GAP [ % ]
48.8¢/ $1
WAGE / INCOME GAP [ $ ]
0.37
INEQUALITY / GINI INDEX
145
TOTAL POPULATION
76
MALE POPULATION
69
FEMALE POPULATION
110.14
MALES / 100 FEMALES
90.79
FEMALES / 100 MALES
60.9
MEDIAN AGE
2.9
AVG FAMILY SIZE
2.3
AVG HOUSEHOLD SIZE
77
LABOR FORCE [ PEOPLE ]
56.6%
PERCENT IN LABOR FORCE
2.6%
UNEMPLOYMENT RATE
Hanging Rock Area Codes
Income in Hanging Rock
Income Overview in Hanging Rock
Per Capita Income in Hanging Rock is $29,801, while median incomes of families and households are $82,750 and $54,750 respectively.
| Characteristic | Number | Measure |
| Per Capita Income | 145 | $29,801 |
| Median Family Income | 39 | $82,750 |
| Mean Family Income | 39 | $80,333 |
| Median Household Income | 63 | $54,750 |
| Mean Household Income | 63 | $64,086 |
| Income Deficit | 39 | $0 |
| Wage / Income Gap (%) | 145 | 51.19% |
| Wage / Income Gap ($) | 145 | 48.81¢ per $1 |
| Gini / Inequality Index | 145 | 0.37 |
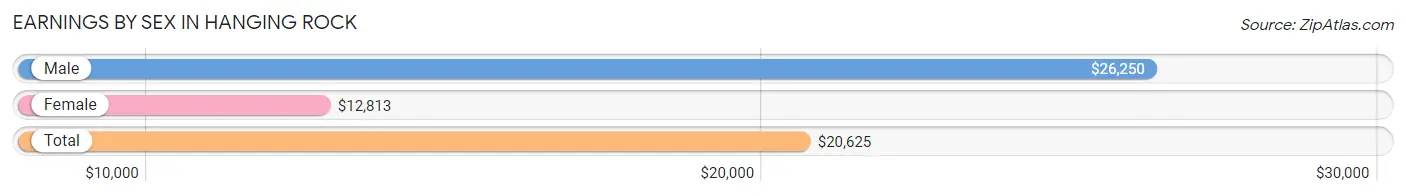
Earnings by Sex in Hanging Rock
Average Earnings in Hanging Rock are $20,625, $26,250 for men and $12,813 for women, a difference of 51.2%.
| Sex | Number | Average Earnings |
| Male | 42 (53.2%) | $26,250 |
| Female | 37 (46.8%) | $12,813 |
| Total | 79 (100.0%) | $20,625 |
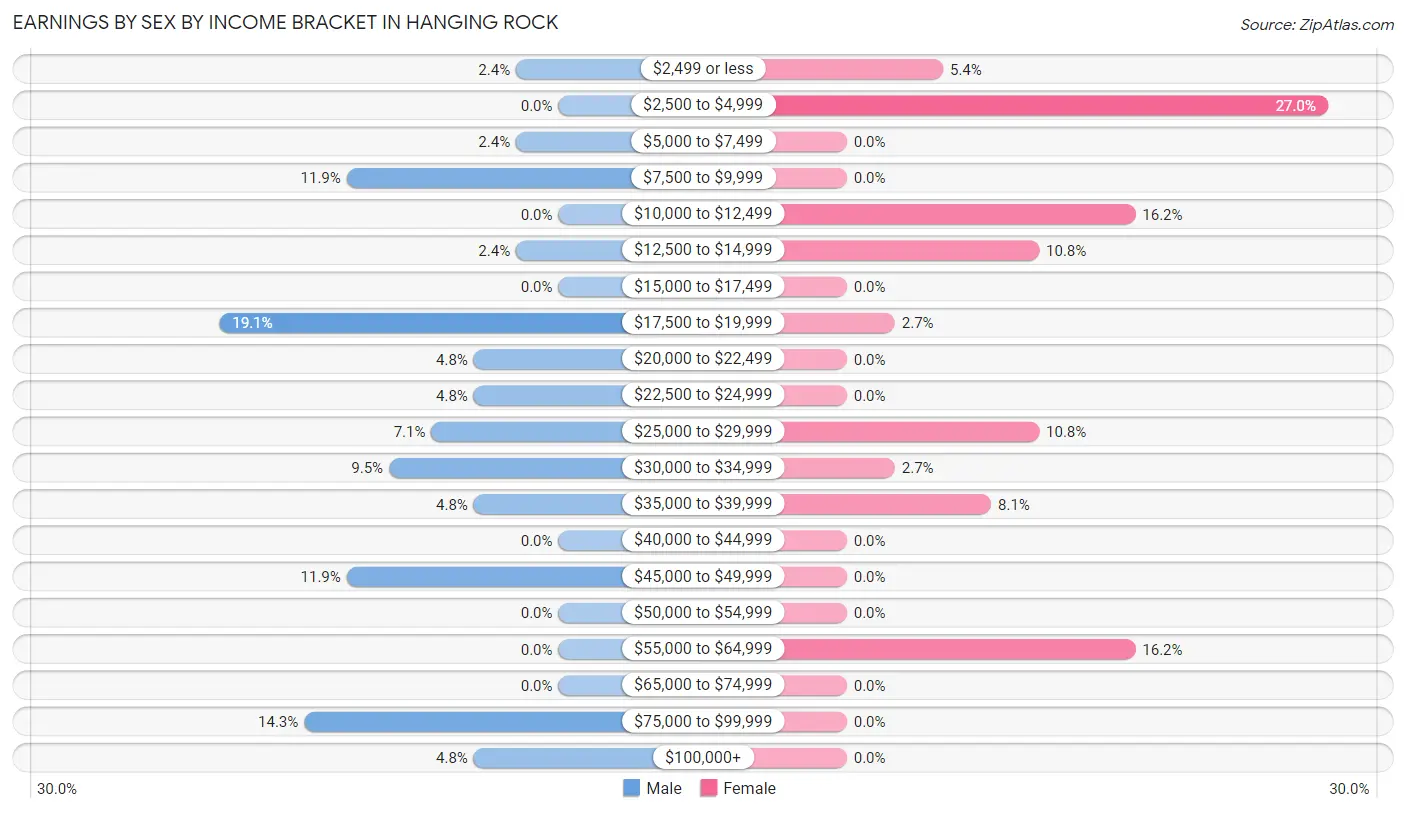
Earnings by Sex by Income Bracket in Hanging Rock
The most common earnings brackets in Hanging Rock are $17,500 to $19,999 for men (8 | 19.1%) and $2,500 to $4,999 for women (10 | 27.0%).
| Income | Male | Female |
| $2,499 or less | 1 (2.4%) | 2 (5.4%) |
| $2,500 to $4,999 | 0 (0.0%) | 10 (27.0%) |
| $5,000 to $7,499 | 1 (2.4%) | 0 (0.0%) |
| $7,500 to $9,999 | 5 (11.9%) | 0 (0.0%) |
| $10,000 to $12,499 | 0 (0.0%) | 6 (16.2%) |
| $12,500 to $14,999 | 1 (2.4%) | 4 (10.8%) |
| $15,000 to $17,499 | 0 (0.0%) | 0 (0.0%) |
| $17,500 to $19,999 | 8 (19.1%) | 1 (2.7%) |
| $20,000 to $22,499 | 2 (4.8%) | 0 (0.0%) |
| $22,500 to $24,999 | 2 (4.8%) | 0 (0.0%) |
| $25,000 to $29,999 | 3 (7.1%) | 4 (10.8%) |
| $30,000 to $34,999 | 4 (9.5%) | 1 (2.7%) |
| $35,000 to $39,999 | 2 (4.8%) | 3 (8.1%) |
| $40,000 to $44,999 | 0 (0.0%) | 0 (0.0%) |
| $45,000 to $49,999 | 5 (11.9%) | 0 (0.0%) |
| $50,000 to $54,999 | 0 (0.0%) | 0 (0.0%) |
| $55,000 to $64,999 | 0 (0.0%) | 6 (16.2%) |
| $65,000 to $74,999 | 0 (0.0%) | 0 (0.0%) |
| $75,000 to $99,999 | 6 (14.3%) | 0 (0.0%) |
| $100,000+ | 2 (4.8%) | 0 (0.0%) |
| Total | 42 (100.0%) | 37 (100.0%) |
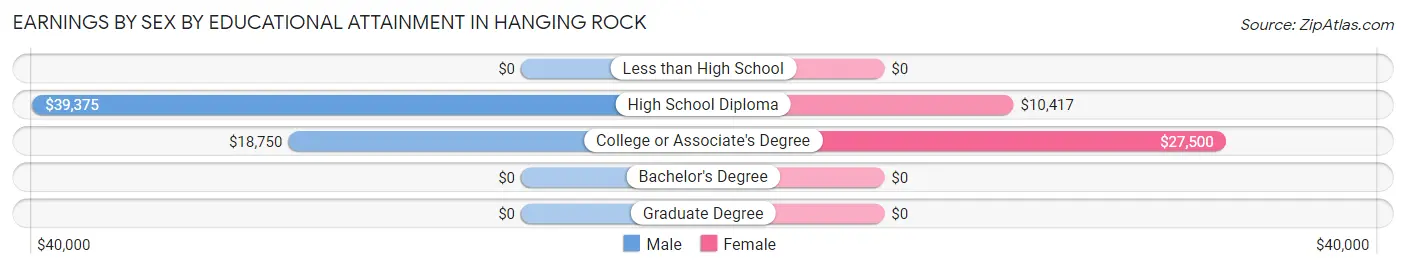
Earnings by Sex by Educational Attainment in Hanging Rock
Average earnings in Hanging Rock are $32,813 for men and $12,813 for women, a difference of 61.0%. Men with an educational attainment of high school diploma enjoy the highest average annual earnings of $39,375, while those with college or associate's degree education earn the least with $18,750. Women with an educational attainment of college or associate's degree earn the most with the average annual earnings of $27,500, while those with high school diploma education have the smallest earnings of $10,417.
| Educational Attainment | Male Income | Female Income |
| Less than High School | - | - |
| High School Diploma | $39,375 | $10,417 |
| College or Associate's Degree | $18,750 | $27,500 |
| Bachelor's Degree | - | - |
| Graduate Degree | - | - |
| Total | $32,813 | $12,813 |
Family Income in Hanging Rock
Family Income Brackets in Hanging Rock
According to the Hanging Rock family income data, there are 12 families falling into the $100,000 to $149,999 income range, which is the most common income bracket and makes up 30.8% of all families.
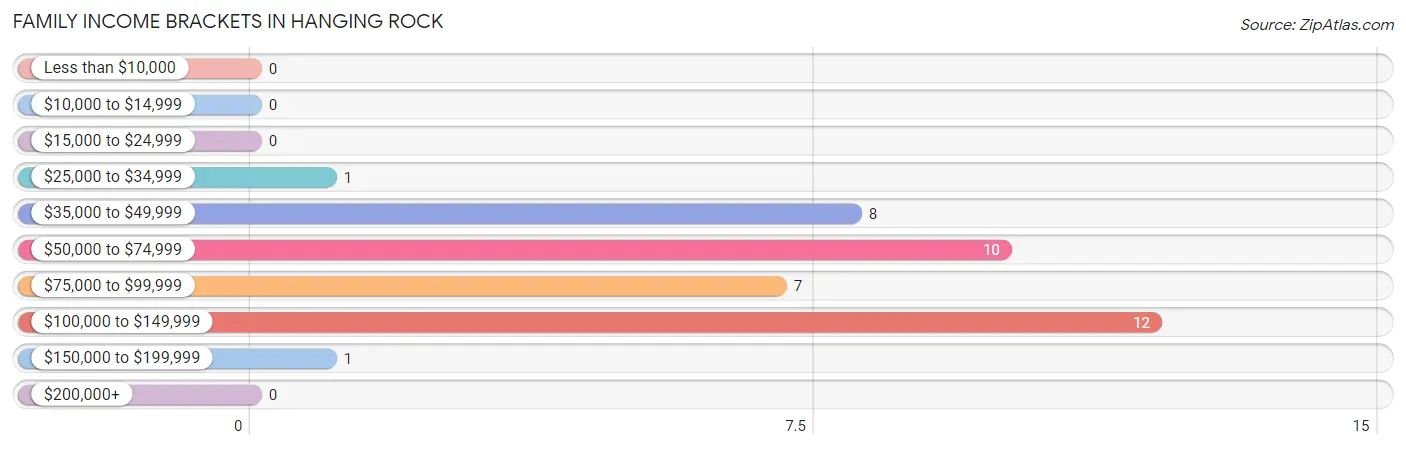
| Income Bracket | # Families | % Families |
| Less than $10,000 | 0 | 0.0% |
| $10,000 to $14,999 | 0 | 0.0% |
| $15,000 to $24,999 | 0 | 0.0% |
| $25,000 to $34,999 | 1 | 2.6% |
| $35,000 to $49,999 | 8 | 20.5% |
| $50,000 to $74,999 | 10 | 25.6% |
| $75,000 to $99,999 | 7 | 17.9% |
| $100,000 to $149,999 | 12 | 30.8% |
| $150,000 to $199,999 | 1 | 2.6% |
| $200,000+ | 0 | 0.0% |
Family Income by Famaliy Size in Hanging Rock
3-person families (11 | 28.2%) account for the highest median family income in Hanging Rock with $108,542 per family, while 3-person families (11 | 28.2%) have the highest median income of $36,181 per family member.
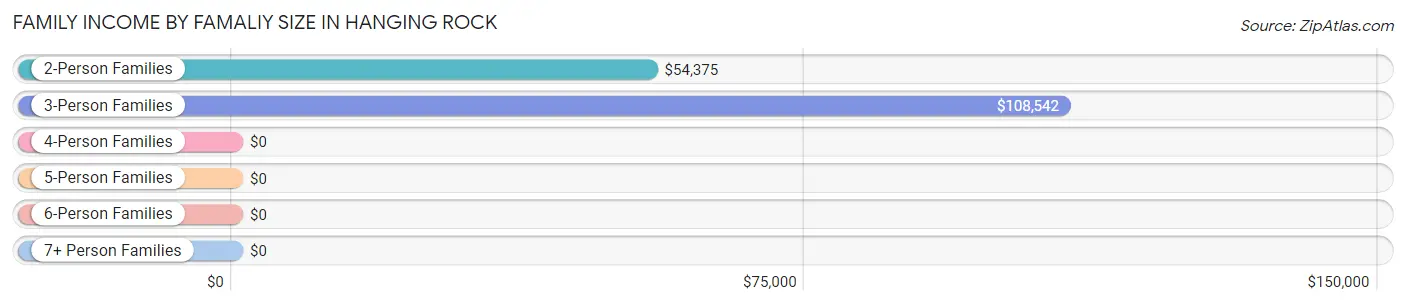
| Income Bracket | # Families | Median Income |
| 2-Person Families | 22 (56.4%) | $54,375 |
| 3-Person Families | 11 (28.2%) | $108,542 |
| 4-Person Families | 4 (10.3%) | $0 |
| 5-Person Families | 1 (2.6%) | $0 |
| 6-Person Families | 1 (2.6%) | $0 |
| 7+ Person Families | 0 (0.0%) | $0 |
| Total | 39 (100.0%) | $82,750 |
Family Income by Number of Earners in Hanging Rock
The median family income in Hanging Rock is $82,750, with families comprising 2 earners (23) having the highest median family income of $84,375, while families with no earners (5) have the lowest median family income of $46,875, accounting for 59.0% and 12.8% of families, respectively.
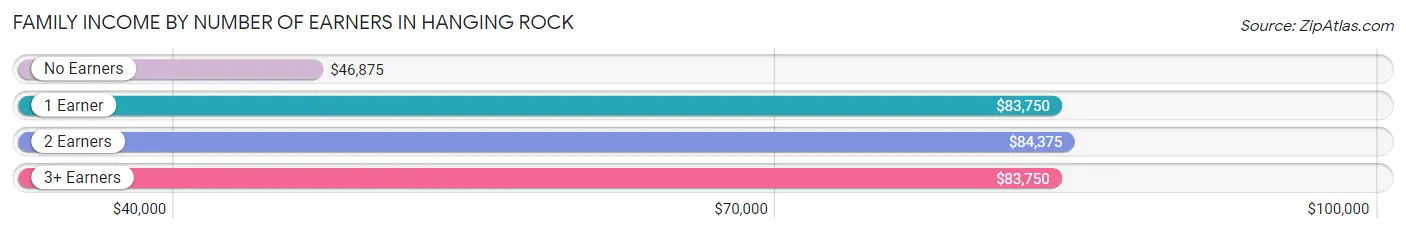
| Number of Earners | # Families | Median Income |
| No Earners | 5 (12.8%) | $46,875 |
| 1 Earner | 6 (15.4%) | $83,750 |
| 2 Earners | 23 (59.0%) | $84,375 |
| 3+ Earners | 5 (12.8%) | $83,750 |
| Total | 39 (100.0%) | $82,750 |
Household Income in Hanging Rock
Household Income Brackets in Hanging Rock
With 14 households falling in the category, the $100,000 to $149,999 income range is the most frequent in Hanging Rock, accounting for 22.2% of all households.
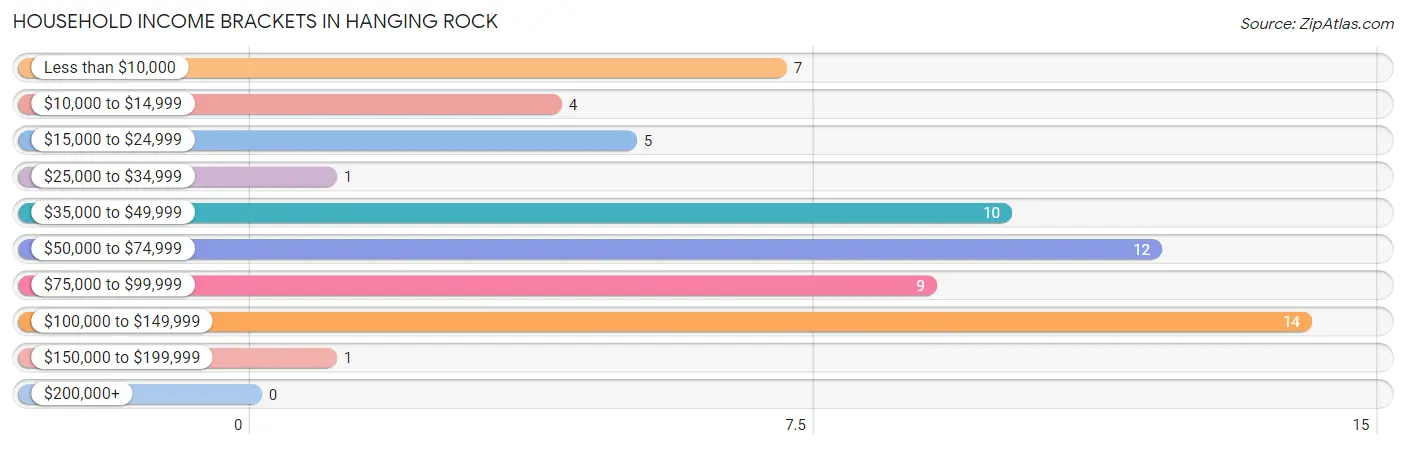
| Income Bracket | # Households | % Households |
| Less than $10,000 | 7 | 11.1% |
| $10,000 to $14,999 | 4 | 6.3% |
| $15,000 to $24,999 | 5 | 7.9% |
| $25,000 to $34,999 | 1 | 1.6% |
| $35,000 to $49,999 | 10 | 15.9% |
| $50,000 to $74,999 | 12 | 19.0% |
| $75,000 to $99,999 | 9 | 14.3% |
| $100,000 to $149,999 | 14 | 22.2% |
| $150,000 to $199,999 | 1 | 1.6% |
| $200,000+ | 0 | 0.0% |
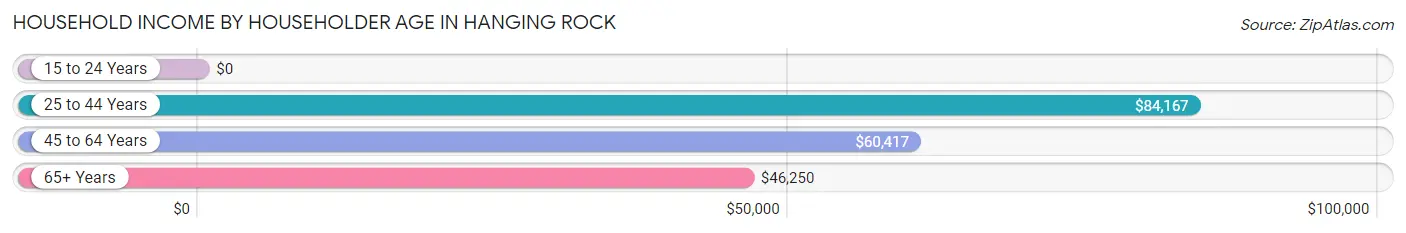
Household Income by Householder Age in Hanging Rock
The median household income in Hanging Rock is $54,750, with the highest median household income of $84,167 found in the 25 to 44 years age bracket for the primary householder. A total of 10 households (15.9%) fall into this category.
| Income Bracket | # Households | Median Income |
| 15 to 24 Years | 0 (0.0%) | $0 |
| 25 to 44 Years | 10 (15.9%) | $84,167 |
| 45 to 64 Years | 39 (61.9%) | $60,417 |
| 65+ Years | 14 (22.2%) | $46,250 |
| Total | 63 (100.0%) | $54,750 |
Poverty in Hanging Rock
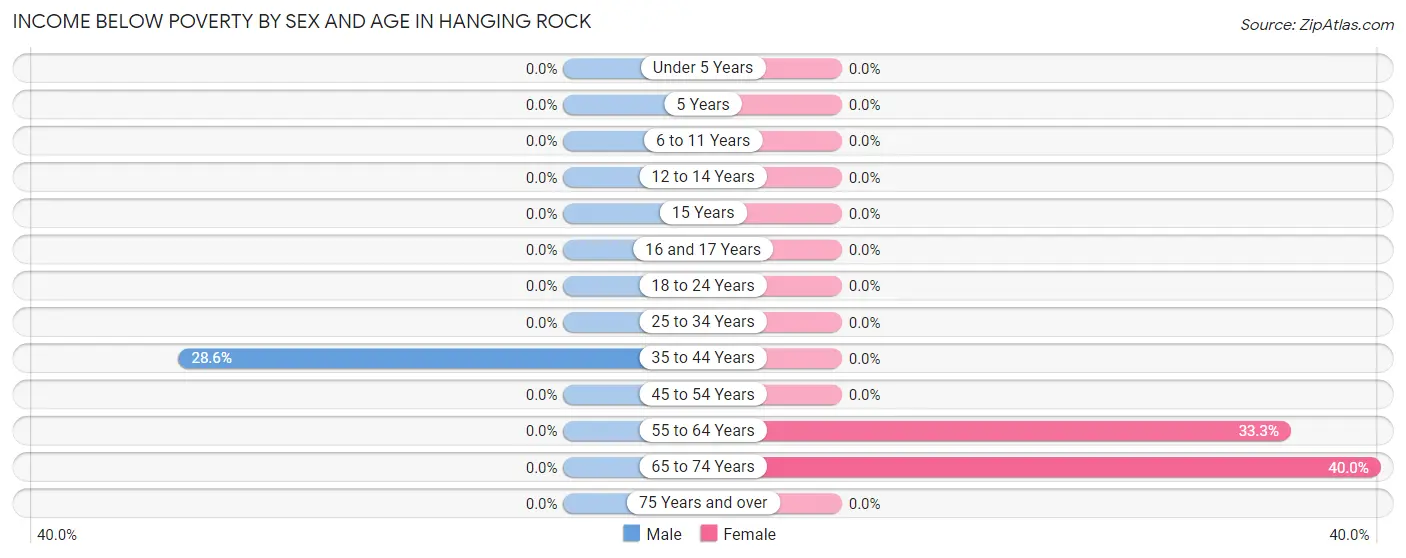
Income Below Poverty by Sex and Age in Hanging Rock
With 2.6% poverty level for males and 18.8% for females among the residents of Hanging Rock, 35 to 44 year old males and 65 to 74 year old females are the most vulnerable to poverty, with 2 males (28.6%) and 4 females (40.0%) in their respective age groups living below the poverty level.
| Age Bracket | Male | Female |
| Under 5 Years | 0 (0.0%) | 0 (0.0%) |
| 5 Years | 0 (0.0%) | 0 (0.0%) |
| 6 to 11 Years | 0 (0.0%) | 0 (0.0%) |
| 12 to 14 Years | 0 (0.0%) | 0 (0.0%) |
| 15 Years | 0 (0.0%) | 0 (0.0%) |
| 16 and 17 Years | 0 (0.0%) | 0 (0.0%) |
| 18 to 24 Years | 0 (0.0%) | 0 (0.0%) |
| 25 to 34 Years | 0 (0.0%) | 0 (0.0%) |
| 35 to 44 Years | 2 (28.6%) | 0 (0.0%) |
| 45 to 54 Years | 0 (0.0%) | 0 (0.0%) |
| 55 to 64 Years | 0 (0.0%) | 9 (33.3%) |
| 65 to 74 Years | 0 (0.0%) | 4 (40.0%) |
| 75 Years and over | 0 (0.0%) | 0 (0.0%) |
| Total | 2 (2.6%) | 13 (18.8%) |
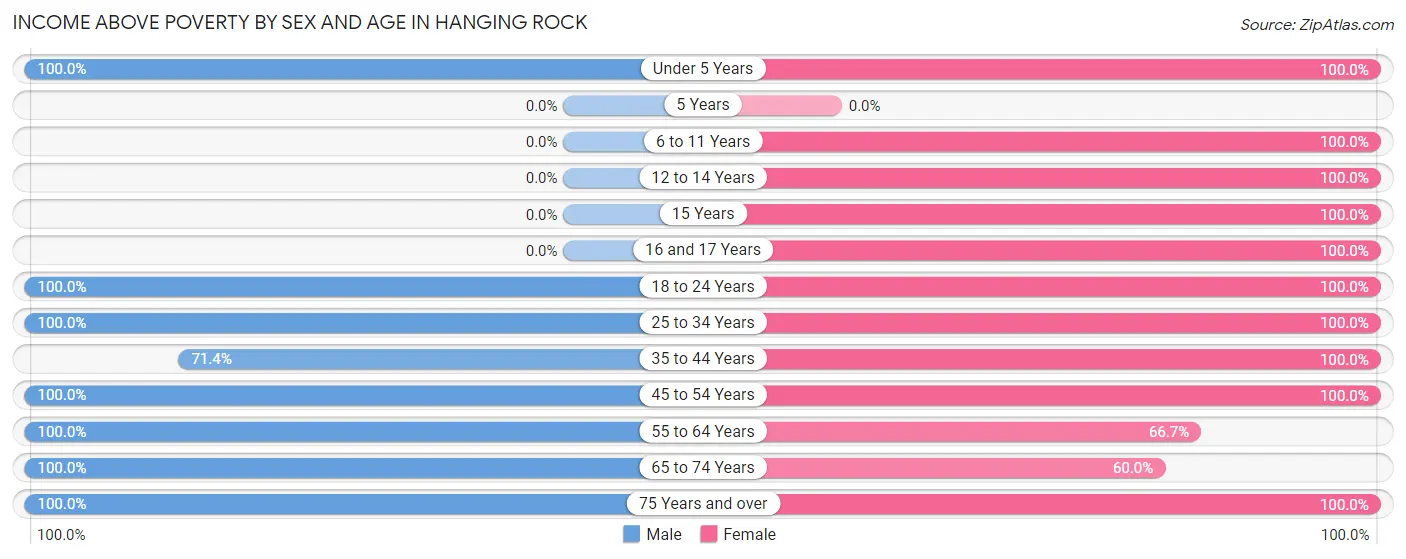
Income Above Poverty by Sex and Age in Hanging Rock
According to the poverty statistics in Hanging Rock, males aged under 5 years and females aged under 5 years are the age groups that are most secure financially, with 100.0% of males and 100.0% of females in these age groups living above the poverty line.
| Age Bracket | Male | Female |
| Under 5 Years | 4 (100.0%) | 1 (100.0%) |
| 5 Years | 0 (0.0%) | 0 (0.0%) |
| 6 to 11 Years | 0 (0.0%) | 2 (100.0%) |
| 12 to 14 Years | 0 (0.0%) | 1 (100.0%) |
| 15 Years | 0 (0.0%) | 1 (100.0%) |
| 16 and 17 Years | 0 (0.0%) | 1 (100.0%) |
| 18 to 24 Years | 6 (100.0%) | 1 (100.0%) |
| 25 to 34 Years | 6 (100.0%) | 2 (100.0%) |
| 35 to 44 Years | 5 (71.4%) | 13 (100.0%) |
| 45 to 54 Years | 5 (100.0%) | 4 (100.0%) |
| 55 to 64 Years | 42 (100.0%) | 18 (66.7%) |
| 65 to 74 Years | 4 (100.0%) | 6 (60.0%) |
| 75 Years and over | 2 (100.0%) | 6 (100.0%) |
| Total | 74 (97.4%) | 56 (81.2%) |
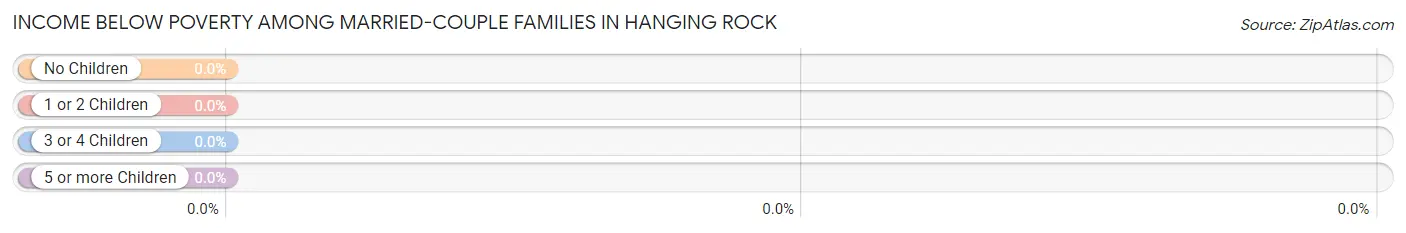
Income Below Poverty Among Married-Couple Families in Hanging Rock
| Children | Above Poverty | Below Poverty |
| No Children | 28 (100.0%) | 0 (0.0%) |
| 1 or 2 Children | 9 (100.0%) | 0 (0.0%) |
| 3 or 4 Children | 0 (0.0%) | 0 (0.0%) |
| 5 or more Children | 0 (0.0%) | 0 (0.0%) |
| Total | 37 (100.0%) | 0 (0.0%) |
Income Below Poverty Among Single-Parent Households in Hanging Rock
| Children | Single Father | Single Mother |
| No Children | 0 (0.0%) | 0 (0.0%) |
| 1 or 2 Children | 0 (0.0%) | 0 (0.0%) |
| 3 or 4 Children | 0 (0.0%) | 0 (0.0%) |
| 5 or more Children | 0 (0.0%) | 0 (0.0%) |
| Total | 0 (0.0%) | 0 (0.0%) |
Income Below Poverty Among Married-Couple vs Single-Parent Households in Hanging Rock
| Children | Married-Couple Families | Single-Parent Households |
| No Children | 0 (0.0%) | 0 (0.0%) |
| 1 or 2 Children | 0 (0.0%) | 0 (0.0%) |
| 3 or 4 Children | 0 (0.0%) | 0 (0.0%) |
| 5 or more Children | 0 (0.0%) | 0 (0.0%) |
| Total | 0 (0.0%) | 0 (0.0%) |
Race in Hanging Rock
The most populous races in Hanging Rock are White / Caucasian (142 | 97.9%), and Two or more Races (3 | 2.1%).
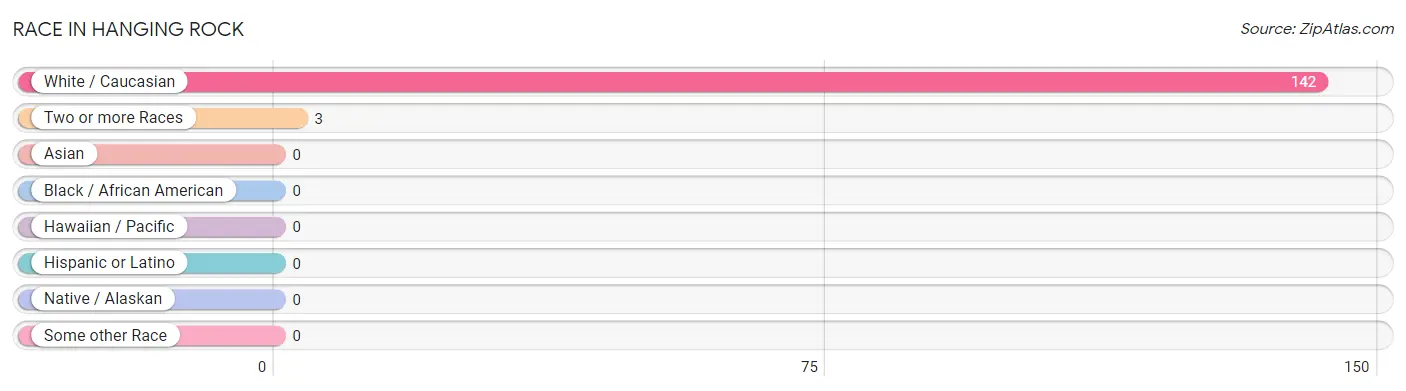
| Race | # Population | % Population |
| Asian | 0 | 0.0% |
| Black / African American | 0 | 0.0% |
| Hawaiian / Pacific | 0 | 0.0% |
| Hispanic or Latino | 0 | 0.0% |
| Native / Alaskan | 0 | 0.0% |
| White / Caucasian | 142 | 97.9% |
| Two or more Races | 3 | 2.1% |
| Some other Race | 0 | 0.0% |
| Total | 145 | 100.0% |
Ancestry in Hanging Rock
The most populous ancestries reported in Hanging Rock are American (32 | 22.1%), German (23 | 15.9%), Irish (20 | 13.8%), English (10 | 6.9%), and European (6 | 4.1%), together accounting for 62.8% of all Hanging Rock residents.
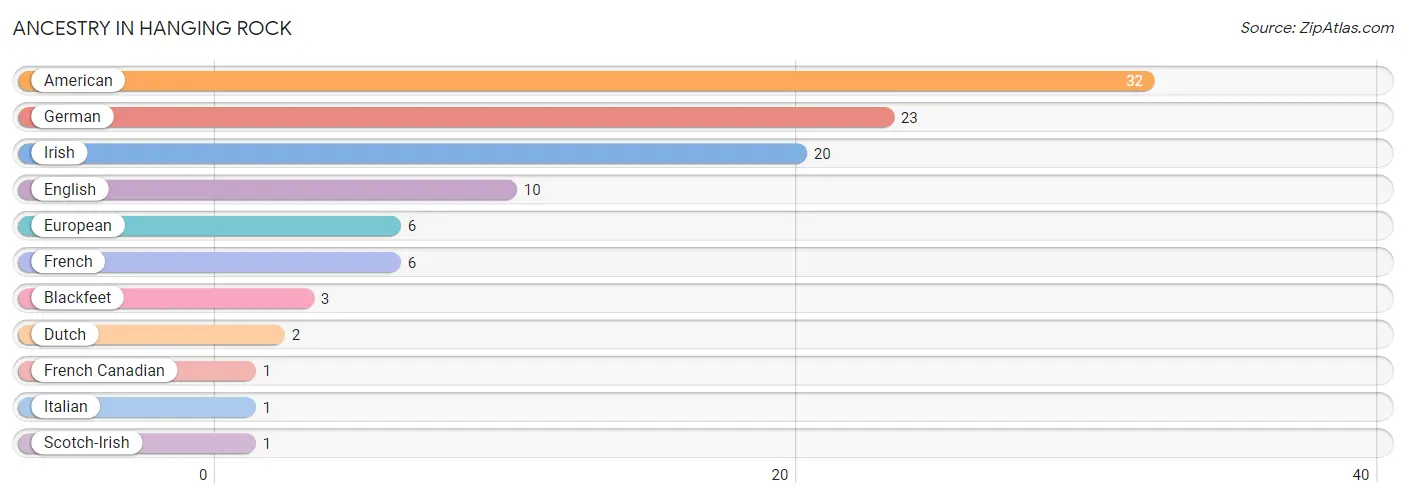
| Ancestry | # Population | % Population |
| American | 32 | 22.1% |
| Blackfeet | 3 | 2.1% |
| Dutch | 2 | 1.4% |
| English | 10 | 6.9% |
| European | 6 | 4.1% |
| French | 6 | 4.1% |
| French Canadian | 1 | 0.7% |
| German | 23 | 15.9% |
| Irish | 20 | 13.8% |
| Italian | 1 | 0.7% |
| Scotch-Irish | 1 | 0.7% | View All 11 Rows |
Immigrants in Hanging Rock

| Immigration Origin | # Population | % Population | View All 0 Rows |
Sex and Age in Hanging Rock
Sex and Age in Hanging Rock
The most populous age groups in Hanging Rock are 60 to 64 Years (32 | 42.1%) for men and 60 to 64 Years (26 | 37.7%) for women.
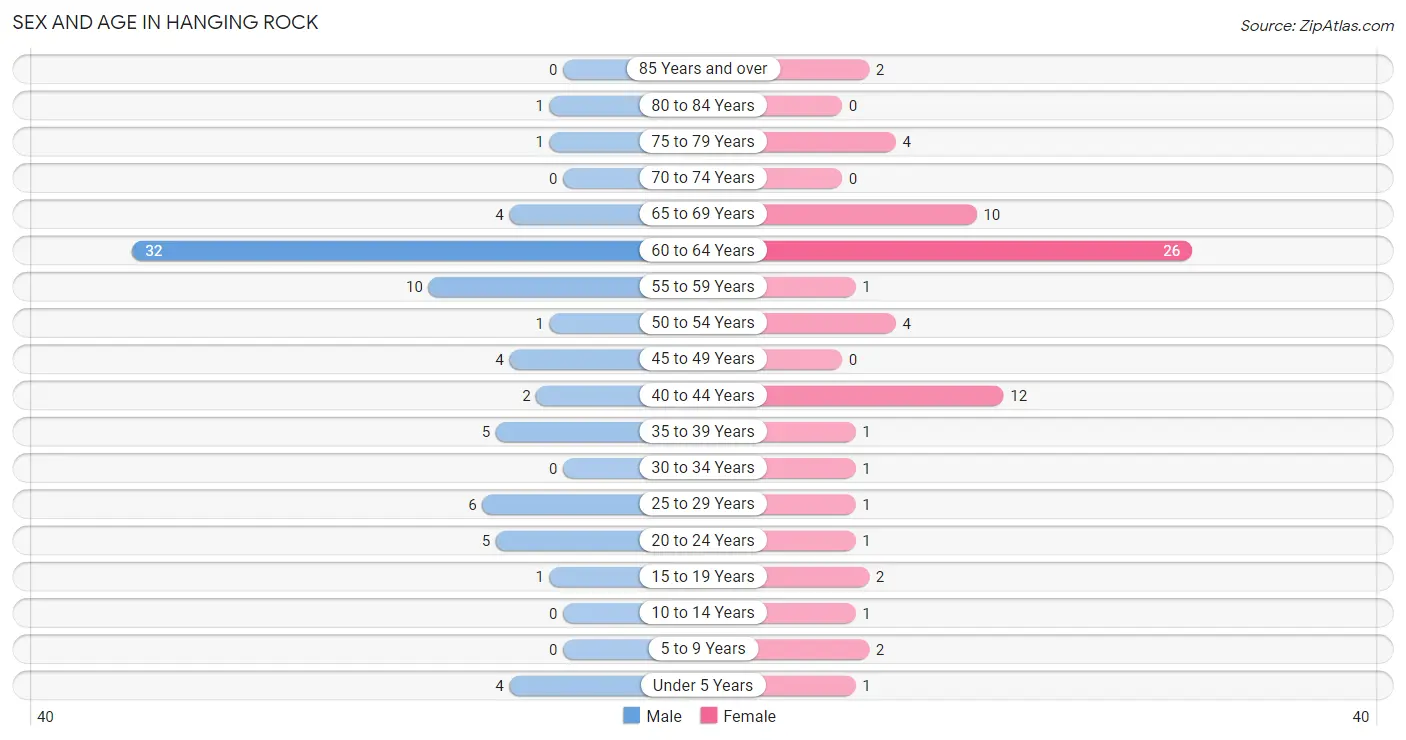
| Age Bracket | Male | Female |
| Under 5 Years | 4 (5.3%) | 1 (1.5%) |
| 5 to 9 Years | 0 (0.0%) | 2 (2.9%) |
| 10 to 14 Years | 0 (0.0%) | 1 (1.5%) |
| 15 to 19 Years | 1 (1.3%) | 2 (2.9%) |
| 20 to 24 Years | 5 (6.6%) | 1 (1.5%) |
| 25 to 29 Years | 6 (7.9%) | 1 (1.5%) |
| 30 to 34 Years | 0 (0.0%) | 1 (1.5%) |
| 35 to 39 Years | 5 (6.6%) | 1 (1.5%) |
| 40 to 44 Years | 2 (2.6%) | 12 (17.4%) |
| 45 to 49 Years | 4 (5.3%) | 0 (0.0%) |
| 50 to 54 Years | 1 (1.3%) | 4 (5.8%) |
| 55 to 59 Years | 10 (13.2%) | 1 (1.5%) |
| 60 to 64 Years | 32 (42.1%) | 26 (37.7%) |
| 65 to 69 Years | 4 (5.3%) | 10 (14.5%) |
| 70 to 74 Years | 0 (0.0%) | 0 (0.0%) |
| 75 to 79 Years | 1 (1.3%) | 4 (5.8%) |
| 80 to 84 Years | 1 (1.3%) | 0 (0.0%) |
| 85 Years and over | 0 (0.0%) | 2 (2.9%) |
| Total | 76 (100.0%) | 69 (100.0%) |
Families and Households in Hanging Rock
Median Family Size in Hanging Rock
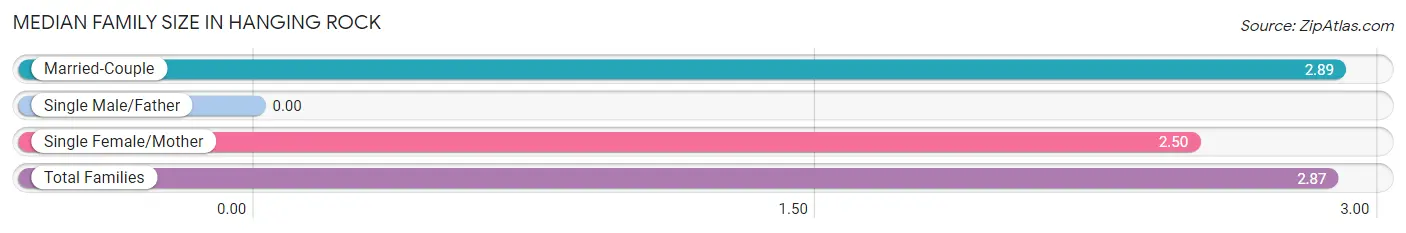
| Family Type | # Families | Family Size |
| Married-Couple | 37 (94.9%) | 2.89 |
| Single Male/Father | 0 (0.0%) | - |
| Single Female/Mother | 2 (5.1%) | 2.50 |
| Total Families | 39 (100.0%) | 2.87 |
Median Household Size in Hanging Rock
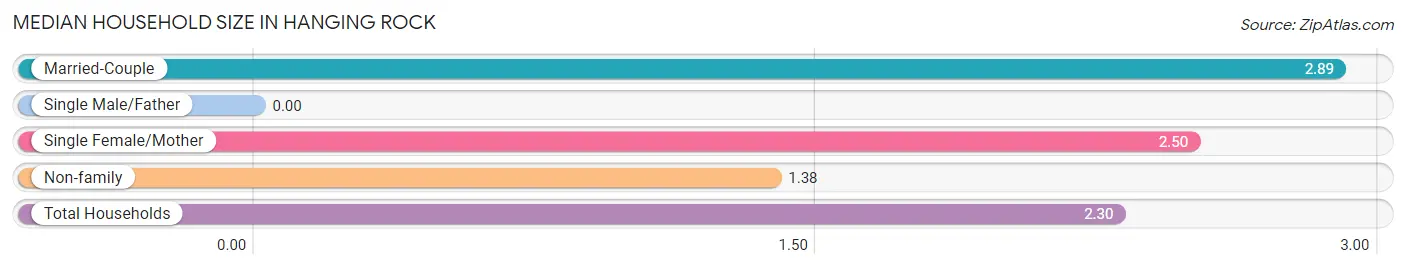
| Household Type | # Households | Household Size |
| Married-Couple | 37 (58.7%) | 2.89 |
| Single Male/Father | 0 (0.0%) | - |
| Single Female/Mother | 2 (3.2%) | 2.50 |
| Non-family | 24 (38.1%) | 1.38 |
| Total Households | 63 (100.0%) | 2.30 |
Household Size by Marriage Status in Hanging Rock
Out of a total of 63 households in Hanging Rock, 39 (61.9%) are family households, while 24 (38.1%) are nonfamily households. The most numerous type of family households are 2-person households, comprising 22, and the most common type of nonfamily households are 1-person households, comprising 19.
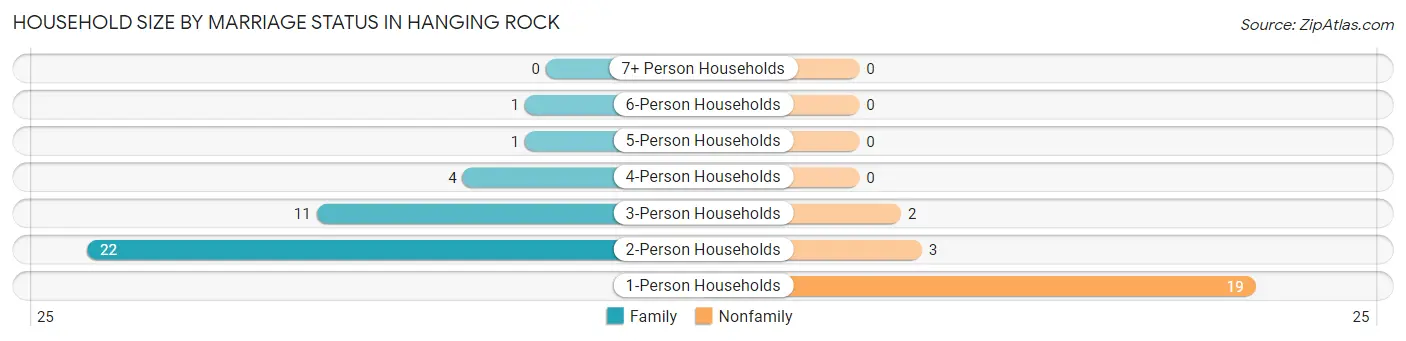
| Household Size | Family Households | Nonfamily Households |
| 1-Person Households | - | 19 (30.2%) |
| 2-Person Households | 22 (34.9%) | 3 (4.8%) |
| 3-Person Households | 11 (17.5%) | 2 (3.2%) |
| 4-Person Households | 4 (6.4%) | 0 (0.0%) |
| 5-Person Households | 1 (1.6%) | 0 (0.0%) |
| 6-Person Households | 1 (1.6%) | 0 (0.0%) |
| 7+ Person Households | 0 (0.0%) | 0 (0.0%) |
| Total | 39 (61.9%) | 24 (38.1%) |
Female Fertility in Hanging Rock
Fertility by Age in Hanging Rock
Average fertility rate in Hanging Rock is 111.0 births per 1,000 women. Women in the age bracket of 15 to 19 years have the highest fertility rate with 500.0 births per 1,000 women. Women in the age bracket of 15 to 19 years acount for 50.0% of all women with births.
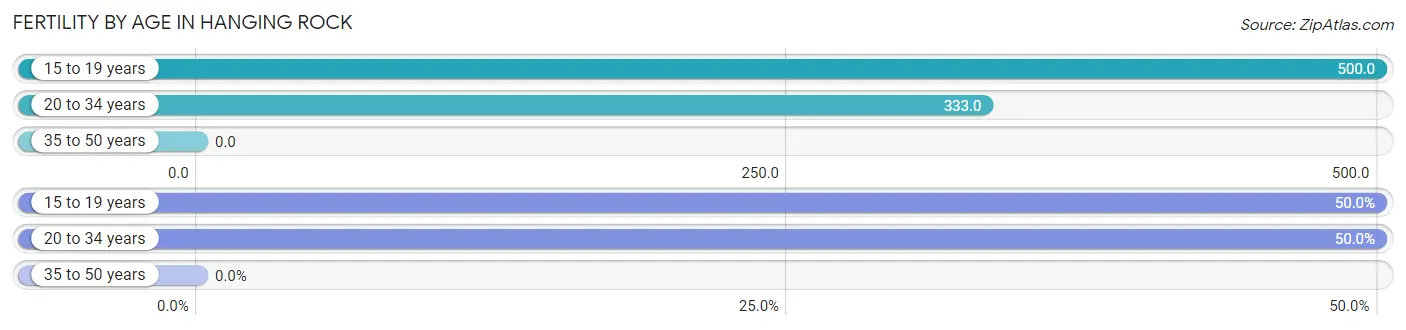
| Age Bracket | Women with Births | Births / 1,000 Women |
| 15 to 19 years | 1 (50.0%) | 500.0 |
| 20 to 34 years | 1 (50.0%) | 333.0 |
| 35 to 50 years | 0 (0.0%) | 0.0 |
| Total | 2 (100.0%) | 111.0 |
Fertility by Age by Marriage Status in Hanging Rock
50.0% of women with births (2) in Hanging Rock are married. The highest percentage of unmarried women with births falls into 15 to 19 years age bracket with 100.0% of them unmarried at the time of birth, while the lowest percentage of unmarried women with births belong to 20 to 34 years age bracket with 0.0% of them unmarried.
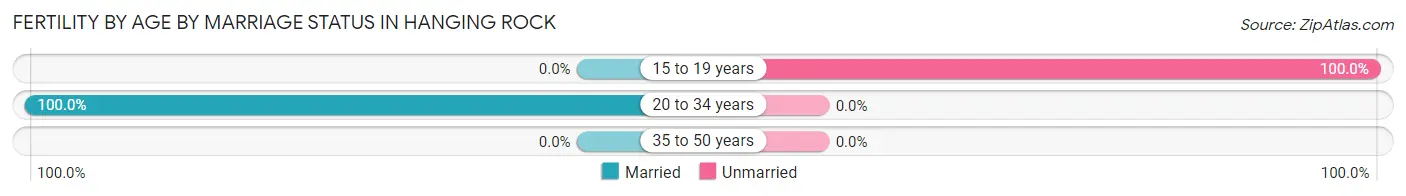
| Age Bracket | Married | Unmarried |
| 15 to 19 years | 0 (0.0%) | 1 (100.0%) |
| 20 to 34 years | 1 (100.0%) | 0 (0.0%) |
| 35 to 50 years | 0 (0.0%) | 0 (0.0%) |
| Total | 1 (50.0%) | 1 (50.0%) |
Fertility by Education in Hanging Rock
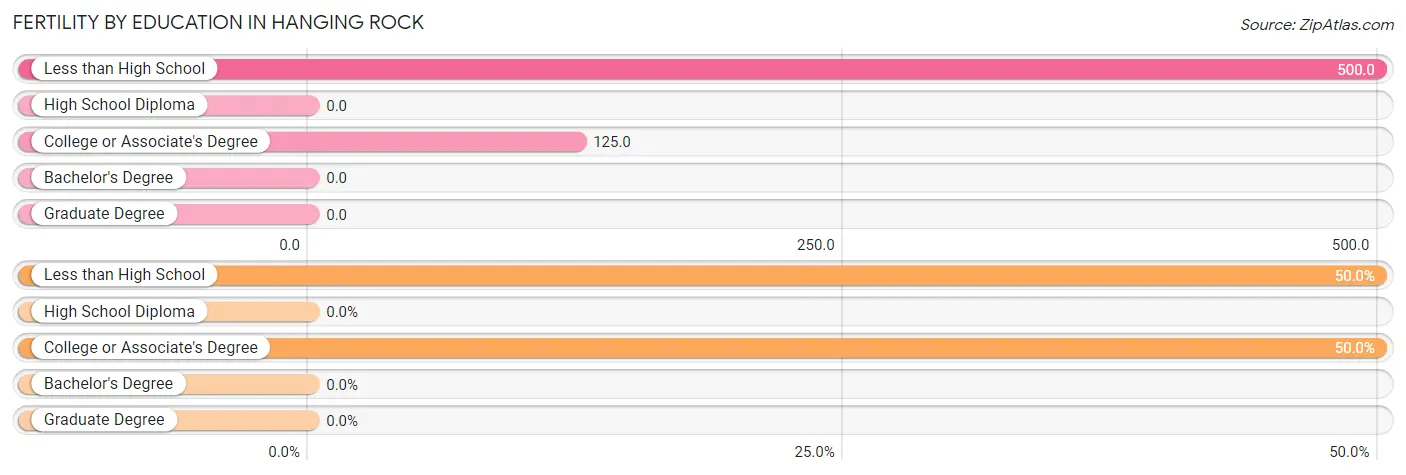
| Educational Attainment | Women with Births | Births / 1,000 Women |
| Less than High School | 1 (50.0%) | 500.0 |
| High School Diploma | 0 (0.0%) | 0.0 |
| College or Associate's Degree | 1 (50.0%) | 125.0 |
| Bachelor's Degree | 0 (0.0%) | 0.0 |
| Graduate Degree | 0 (0.0%) | 0.0 |
| Total | 2 (100.0%) | 111.0 |
Fertility by Education by Marriage Status in Hanging Rock
50.0% of women with births in Hanging Rock are unmarried. Women with the educational attainment of college or associate's degree are most likely to be married with 100.0% of them married at childbirth, while women with the educational attainment of less than high school are least likely to be married with 100.0% of them unmarried at childbirth.
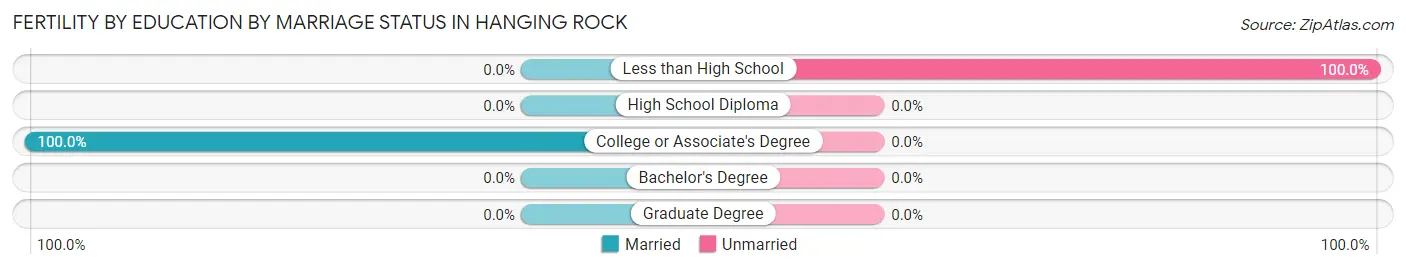
| Educational Attainment | Married | Unmarried |
| Less than High School | 0 (0.0%) | 1 (100.0%) |
| High School Diploma | 0 (0.0%) | 0 (0.0%) |
| College or Associate's Degree | 1 (100.0%) | 0 (0.0%) |
| Bachelor's Degree | 0 (0.0%) | 0 (0.0%) |
| Graduate Degree | 0 (0.0%) | 0 (0.0%) |
| Total | 1 (50.0%) | 1 (50.0%) |
Employment Characteristics in Hanging Rock
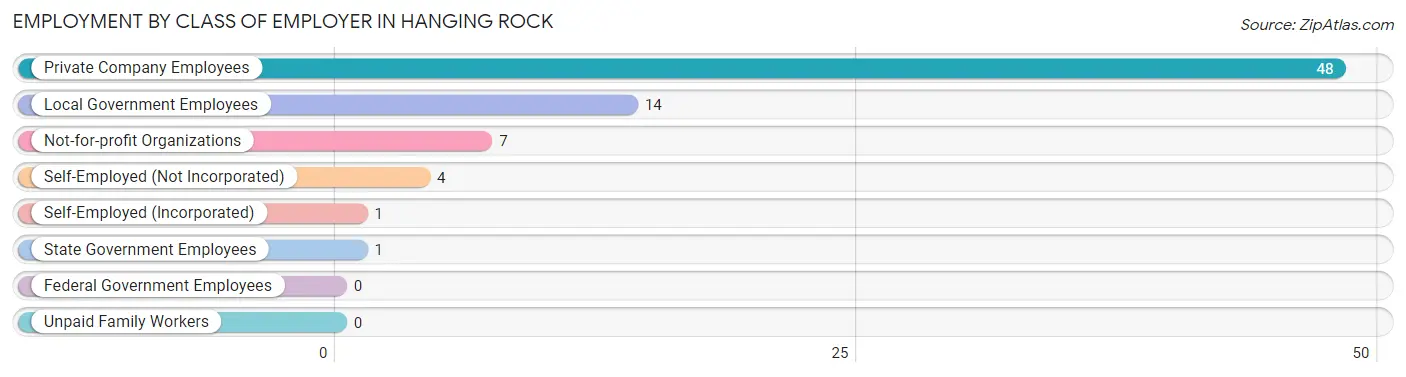
Employment by Class of Employer in Hanging Rock
Among the 75 employed individuals in Hanging Rock, private company employees (48 | 64.0%), local government employees (14 | 18.7%), and not-for-profit organizations (7 | 9.3%) make up the most common classes of employment.
| Employer Class | # Employees | % Employees |
| Private Company Employees | 48 | 64.0% |
| Self-Employed (Incorporated) | 1 | 1.3% |
| Self-Employed (Not Incorporated) | 4 | 5.3% |
| Not-for-profit Organizations | 7 | 9.3% |
| Local Government Employees | 14 | 18.7% |
| State Government Employees | 1 | 1.3% |
| Federal Government Employees | 0 | 0.0% |
| Unpaid Family Workers | 0 | 0.0% |
| Total | 75 | 100.0% |
Employment Status by Age in Hanging Rock
According to the labor force statistics for Hanging Rock, out of the total population over 16 years of age (136), 56.6% or 77 individuals are in the labor force, with 2.6% or 2 of them unemployed. The age group with the highest labor force participation rate is 25 to 29 years, with 100.0% or 7 individuals in the labor force. Within the labor force, the 75 years and over age range has the highest percentage of unemployed individuals, with 100.0% or 2 of them being unemployed.
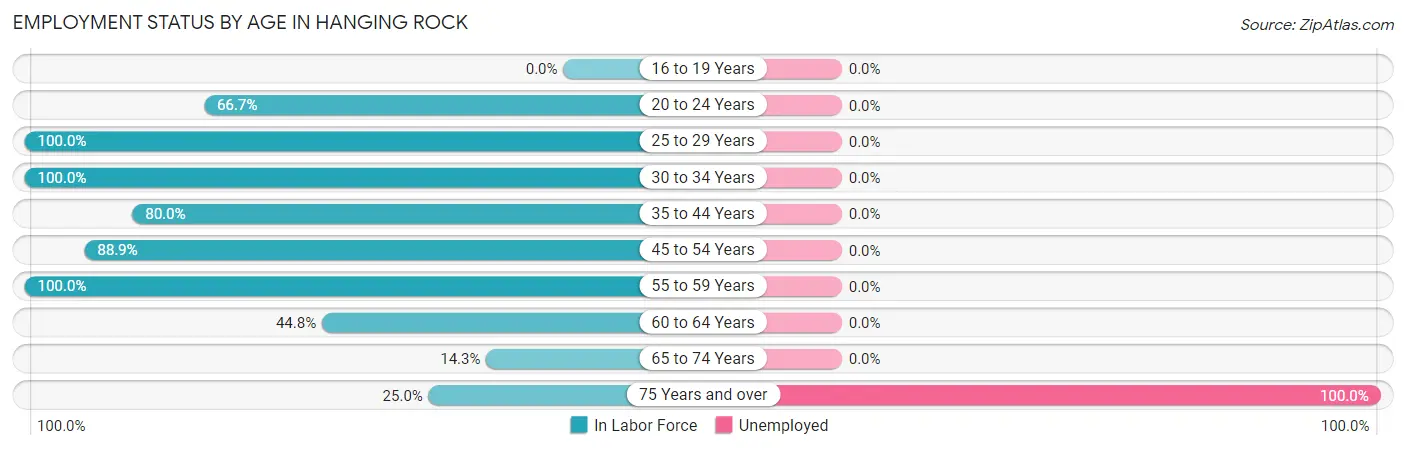
| Age Bracket | In Labor Force | Unemployed |
| 16 to 19 Years | 0 (0.0%) | 0 (0.0%) |
| 20 to 24 Years | 4 (66.7%) | 0 (0.0%) |
| 25 to 29 Years | 7 (100.0%) | 0 (0.0%) |
| 30 to 34 Years | 1 (100.0%) | 0 (0.0%) |
| 35 to 44 Years | 16 (80.0%) | 0 (0.0%) |
| 45 to 54 Years | 8 (88.9%) | 0 (0.0%) |
| 55 to 59 Years | 11 (100.0%) | 0 (0.0%) |
| 60 to 64 Years | 26 (44.8%) | 0 (0.0%) |
| 65 to 74 Years | 2 (14.3%) | 0 (0.0%) |
| 75 Years and over | 2 (25.0%) | 2 (100.0%) |
| Total | 77 (56.6%) | 2 (2.6%) |
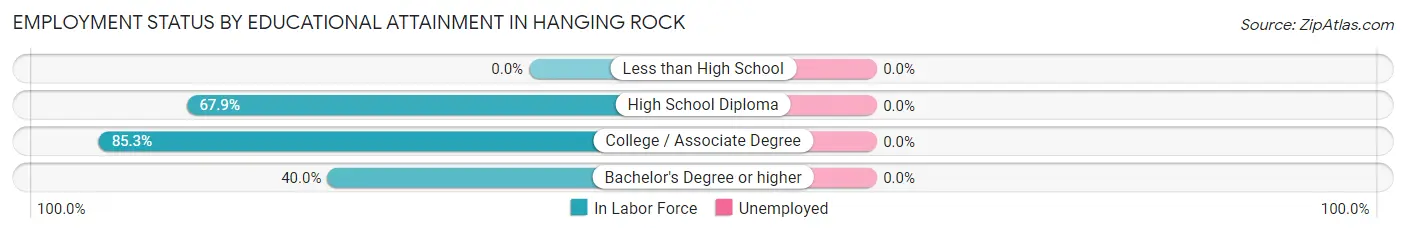
Employment Status by Educational Attainment in Hanging Rock
| Educational Attainment | In Labor Force | Unemployed |
| Less than High School | 0 (0.0%) | 0 (0.0%) |
| High School Diploma | 38 (67.9%) | 0 (0.0%) |
| College / Associate Degree | 29 (85.3%) | 0 (0.0%) |
| Bachelor's Degree or higher | 2 (40.0%) | 0 (0.0%) |
| Total | 69 (65.1%) | 0 (0.0%) |
Employment Occupations by Sex in Hanging Rock
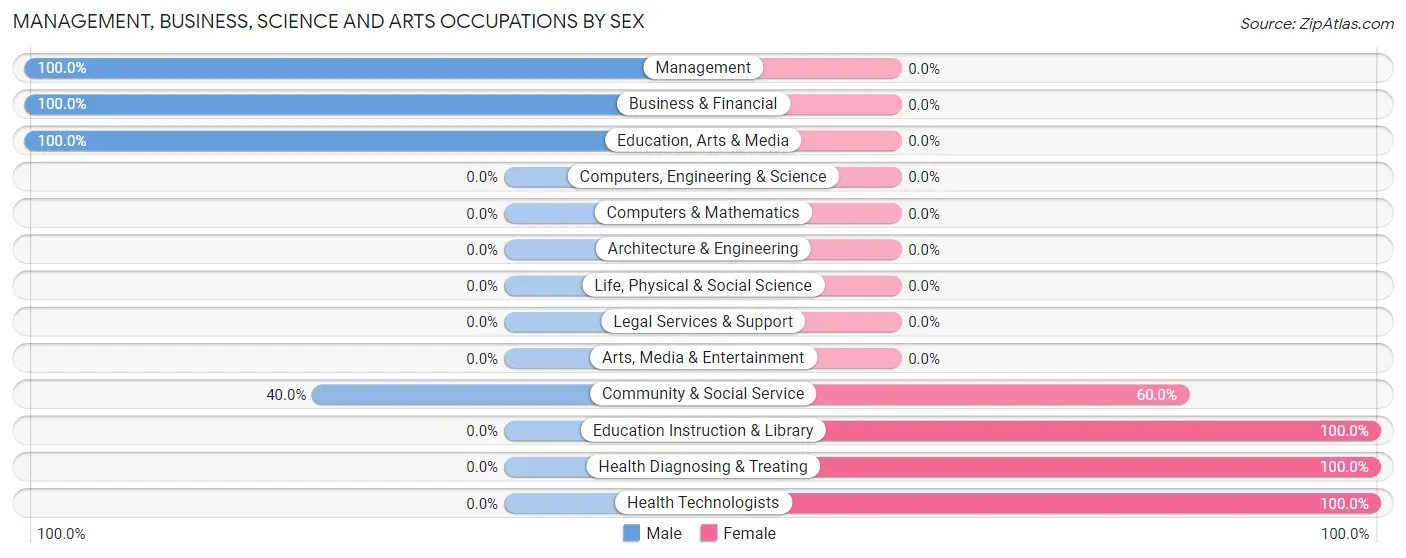
Management, Business, Science and Arts Occupations
The most common Management, Business, Science and Arts occupations in Hanging Rock are Business & Financial (5 | 6.7%), Community & Social Service (5 | 6.7%), Management (3 | 4.0%), Education Instruction & Library (3 | 4.0%), and Education, Arts & Media (2 | 2.7%).
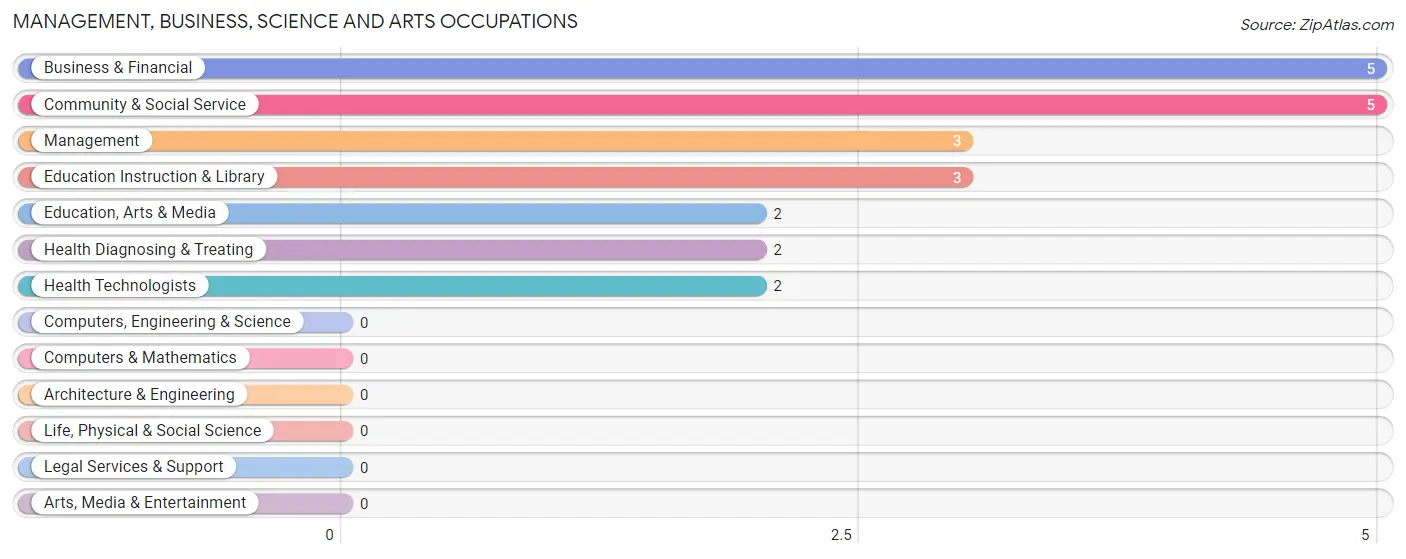
Management, Business, Science and Arts Occupations by Sex
Within the Management, Business, Science and Arts occupations in Hanging Rock, the most male-oriented occupations are Management (100.0%), Business & Financial (100.0%), and Education, Arts & Media (100.0%), while the most female-oriented occupations are Education Instruction & Library (100.0%), Health Diagnosing & Treating (100.0%), and Health Technologists (100.0%).
| Occupation | Male | Female |
| Management | 3 (100.0%) | 0 (0.0%) |
| Business & Financial | 5 (100.0%) | 0 (0.0%) |
| Computers, Engineering & Science | 0 (0.0%) | 0 (0.0%) |
| Computers & Mathematics | 0 (0.0%) | 0 (0.0%) |
| Architecture & Engineering | 0 (0.0%) | 0 (0.0%) |
| Life, Physical & Social Science | 0 (0.0%) | 0 (0.0%) |
| Community & Social Service | 2 (40.0%) | 3 (60.0%) |
| Education, Arts & Media | 2 (100.0%) | 0 (0.0%) |
| Legal Services & Support | 0 (0.0%) | 0 (0.0%) |
| Education Instruction & Library | 0 (0.0%) | 3 (100.0%) |
| Arts, Media & Entertainment | 0 (0.0%) | 0 (0.0%) |
| Health Diagnosing & Treating | 0 (0.0%) | 2 (100.0%) |
| Health Technologists | 0 (0.0%) | 2 (100.0%) |
| Total (Category) | 10 (66.7%) | 5 (33.3%) |
| Total (Overall) | 40 (53.3%) | 35 (46.7%) |
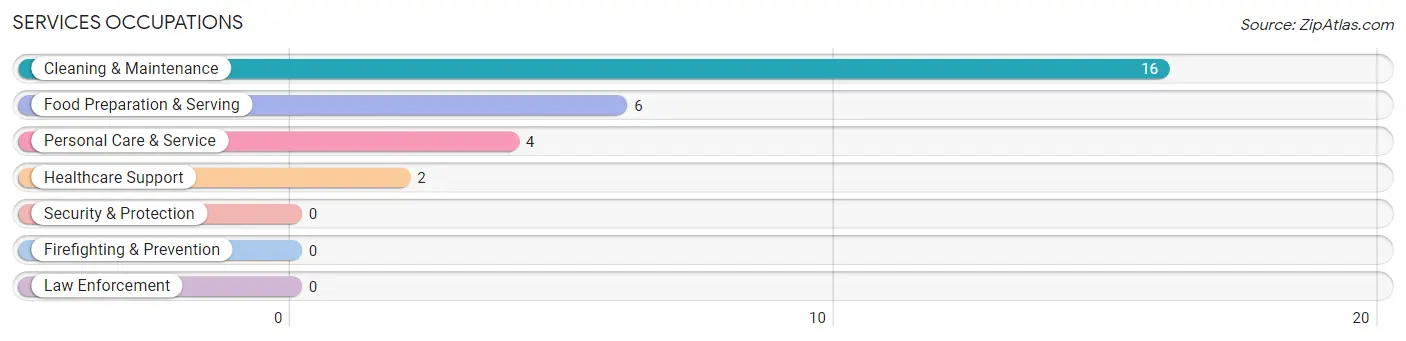
Services Occupations
The most common Services occupations in Hanging Rock are Cleaning & Maintenance (16 | 21.3%), Food Preparation & Serving (6 | 8.0%), Personal Care & Service (4 | 5.3%), and Healthcare Support (2 | 2.7%).
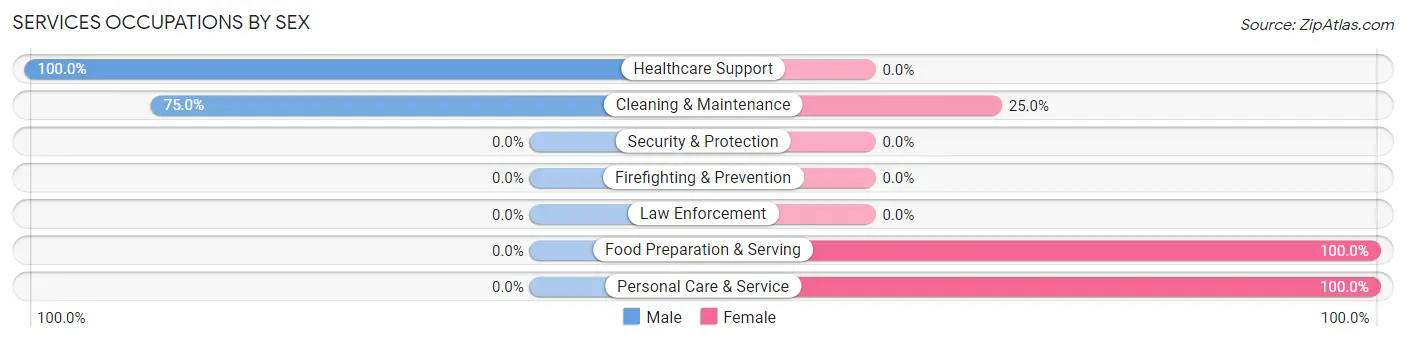
Services Occupations by Sex
Within the Services occupations in Hanging Rock, the most male-oriented occupations are Healthcare Support (100.0%), and Cleaning & Maintenance (75.0%), while the most female-oriented occupations are Food Preparation & Serving (100.0%), Personal Care & Service (100.0%), and Cleaning & Maintenance (25.0%).
| Occupation | Male | Female |
| Healthcare Support | 2 (100.0%) | 0 (0.0%) |
| Security & Protection | 0 (0.0%) | 0 (0.0%) |
| Firefighting & Prevention | 0 (0.0%) | 0 (0.0%) |
| Law Enforcement | 0 (0.0%) | 0 (0.0%) |
| Food Preparation & Serving | 0 (0.0%) | 6 (100.0%) |
| Cleaning & Maintenance | 12 (75.0%) | 4 (25.0%) |
| Personal Care & Service | 0 (0.0%) | 4 (100.0%) |
| Total (Category) | 14 (50.0%) | 14 (50.0%) |
| Total (Overall) | 40 (53.3%) | 35 (46.7%) |
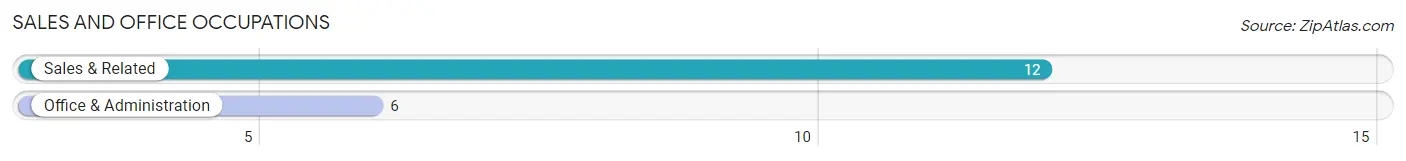
Sales and Office Occupations
The most common Sales and Office occupations in Hanging Rock are Sales & Related (12 | 16.0%), and Office & Administration (6 | 8.0%).
Sales and Office Occupations by Sex
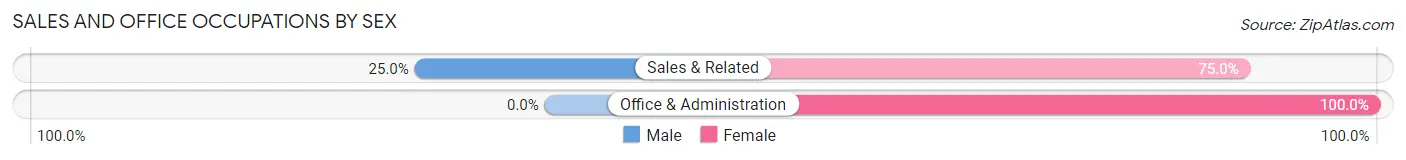
| Occupation | Male | Female |
| Sales & Related | 3 (25.0%) | 9 (75.0%) |
| Office & Administration | 0 (0.0%) | 6 (100.0%) |
| Total (Category) | 3 (16.7%) | 15 (83.3%) |
| Total (Overall) | 40 (53.3%) | 35 (46.7%) |
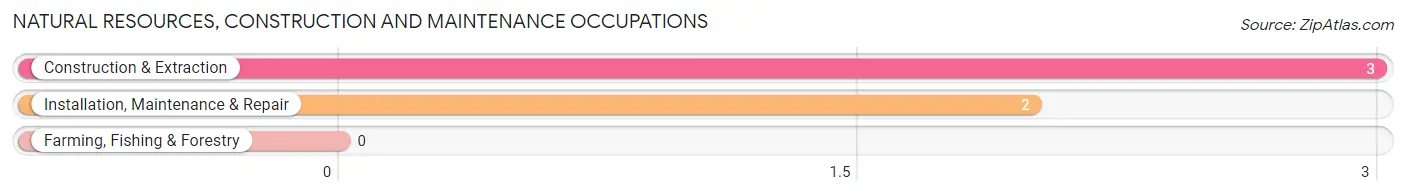
Natural Resources, Construction and Maintenance Occupations
The most common Natural Resources, Construction and Maintenance occupations in Hanging Rock are Construction & Extraction (3 | 4.0%), and Installation, Maintenance & Repair (2 | 2.7%).
Natural Resources, Construction and Maintenance Occupations by Sex
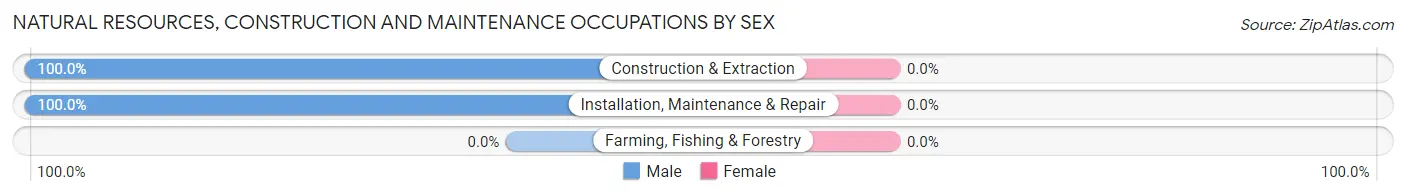
| Occupation | Male | Female |
| Farming, Fishing & Forestry | 0 (0.0%) | 0 (0.0%) |
| Construction & Extraction | 3 (100.0%) | 0 (0.0%) |
| Installation, Maintenance & Repair | 2 (100.0%) | 0 (0.0%) |
| Total (Category) | 5 (100.0%) | 0 (0.0%) |
| Total (Overall) | 40 (53.3%) | 35 (46.7%) |
Production, Transportation and Moving Occupations
The most common Production, Transportation and Moving occupations in Hanging Rock are Production (4 | 5.3%), Material Moving (3 | 4.0%), and Transportation (2 | 2.7%).
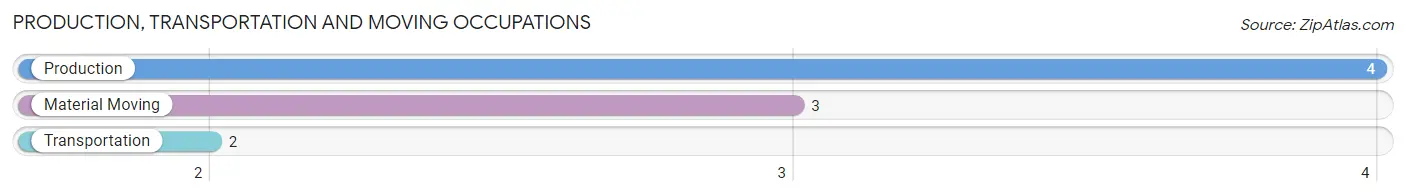
Production, Transportation and Moving Occupations by Sex
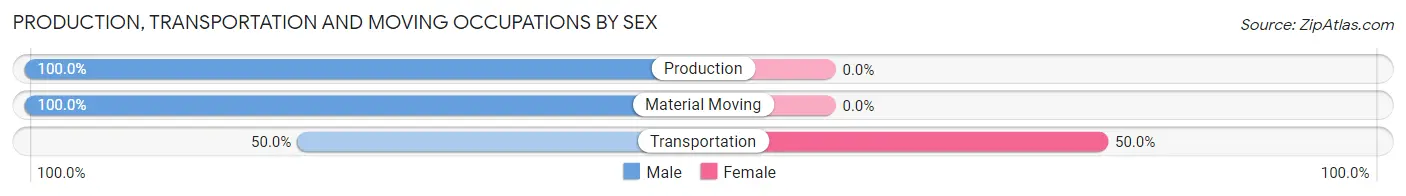
| Occupation | Male | Female |
| Production | 4 (100.0%) | 0 (0.0%) |
| Transportation | 1 (50.0%) | 1 (50.0%) |
| Material Moving | 3 (100.0%) | 0 (0.0%) |
| Total (Category) | 8 (88.9%) | 1 (11.1%) |
| Total (Overall) | 40 (53.3%) | 35 (46.7%) |
Employment Industries by Sex in Hanging Rock
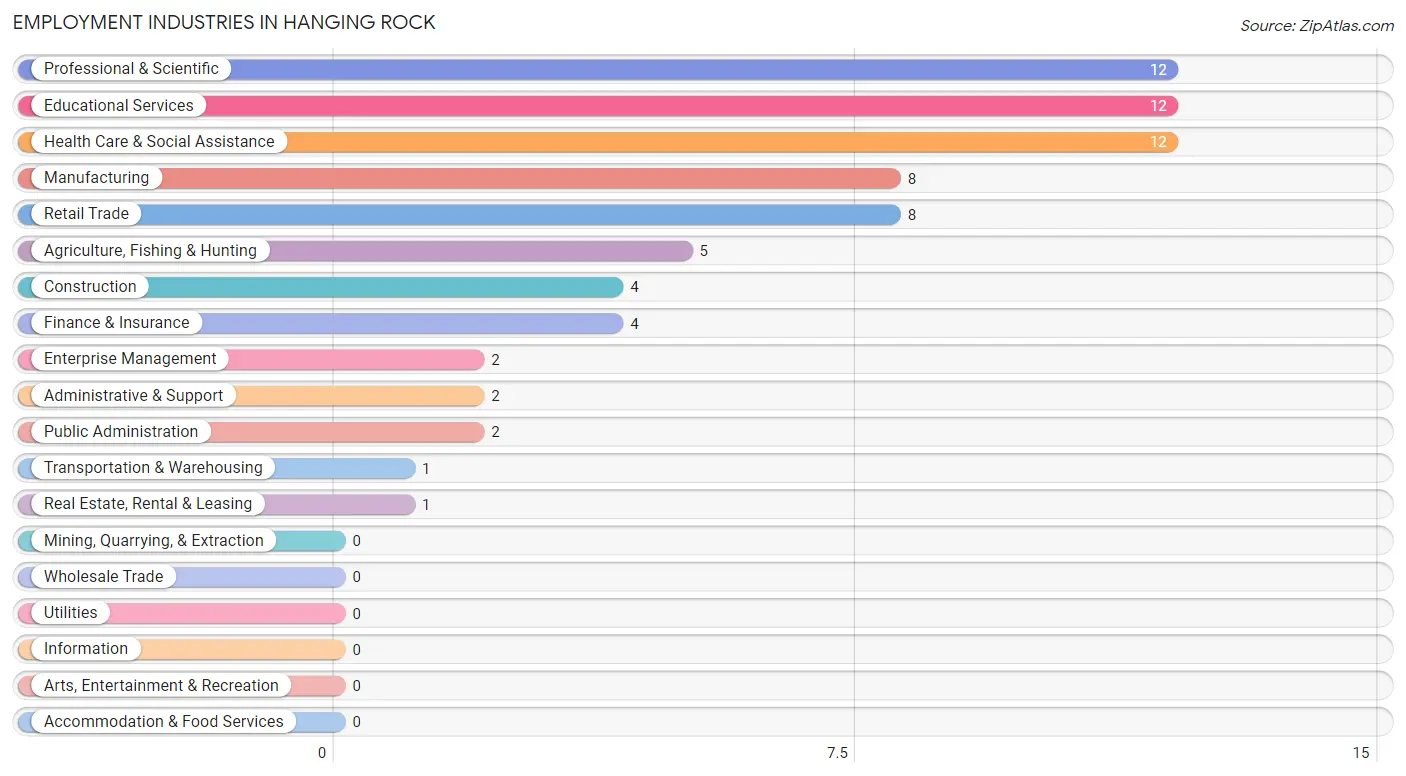
Employment Industries in Hanging Rock
The major employment industries in Hanging Rock include Professional & Scientific (12 | 16.0%), Educational Services (12 | 16.0%), Health Care & Social Assistance (12 | 16.0%), Manufacturing (8 | 10.7%), and Retail Trade (8 | 10.7%).
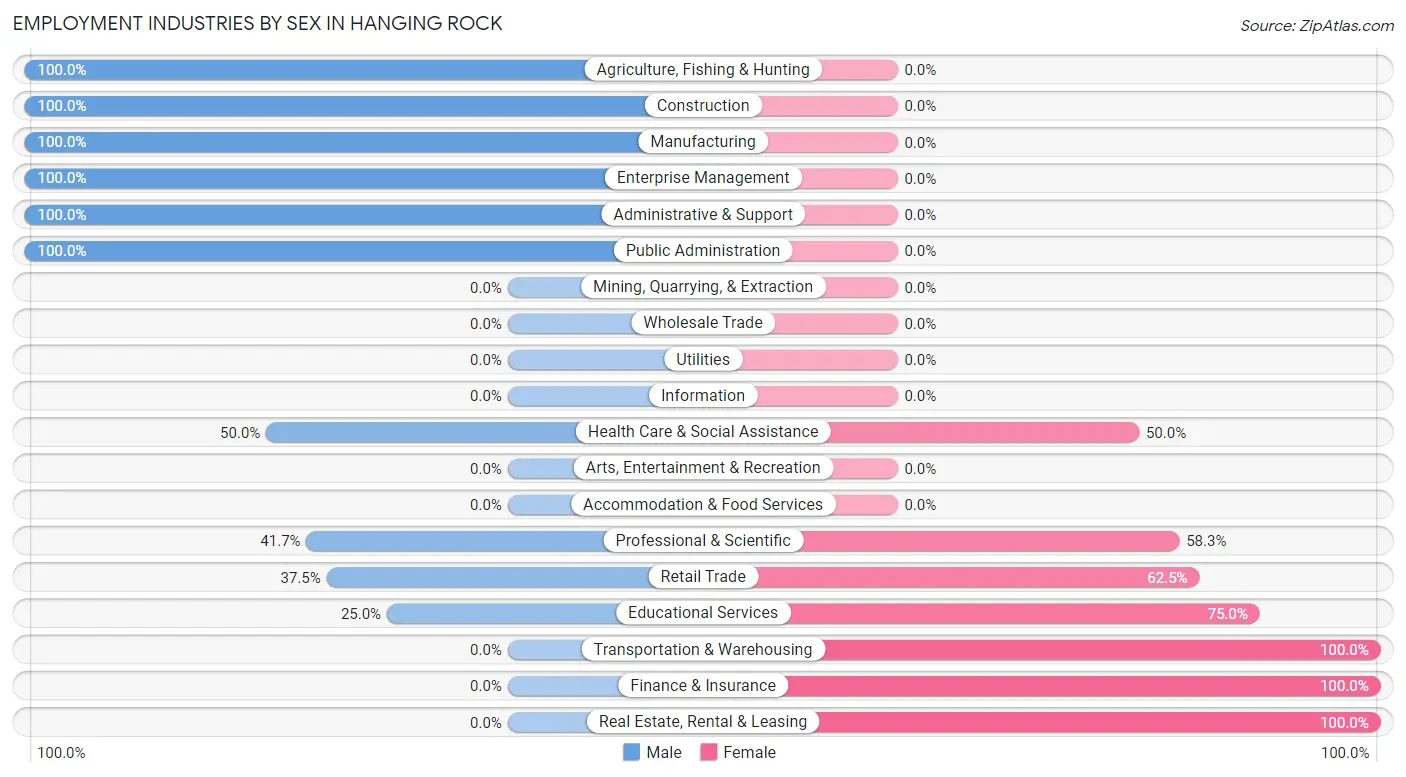
Employment Industries by Sex in Hanging Rock
The Hanging Rock industries that see more men than women are Agriculture, Fishing & Hunting (100.0%), Construction (100.0%), and Manufacturing (100.0%), whereas the industries that tend to have a higher number of women are Transportation & Warehousing (100.0%), Finance & Insurance (100.0%), and Real Estate, Rental & Leasing (100.0%).
| Industry | Male | Female |
| Agriculture, Fishing & Hunting | 5 (100.0%) | 0 (0.0%) |
| Mining, Quarrying, & Extraction | 0 (0.0%) | 0 (0.0%) |
| Construction | 4 (100.0%) | 0 (0.0%) |
| Manufacturing | 8 (100.0%) | 0 (0.0%) |
| Wholesale Trade | 0 (0.0%) | 0 (0.0%) |
| Retail Trade | 3 (37.5%) | 5 (62.5%) |
| Transportation & Warehousing | 0 (0.0%) | 1 (100.0%) |
| Utilities | 0 (0.0%) | 0 (0.0%) |
| Information | 0 (0.0%) | 0 (0.0%) |
| Finance & Insurance | 0 (0.0%) | 4 (100.0%) |
| Real Estate, Rental & Leasing | 0 (0.0%) | 1 (100.0%) |
| Professional & Scientific | 5 (41.7%) | 7 (58.3%) |
| Enterprise Management | 2 (100.0%) | 0 (0.0%) |
| Administrative & Support | 2 (100.0%) | 0 (0.0%) |
| Educational Services | 3 (25.0%) | 9 (75.0%) |
| Health Care & Social Assistance | 6 (50.0%) | 6 (50.0%) |
| Arts, Entertainment & Recreation | 0 (0.0%) | 0 (0.0%) |
| Accommodation & Food Services | 0 (0.0%) | 0 (0.0%) |
| Public Administration | 2 (100.0%) | 0 (0.0%) |
| Total | 40 (53.3%) | 35 (46.7%) |
Education in Hanging Rock
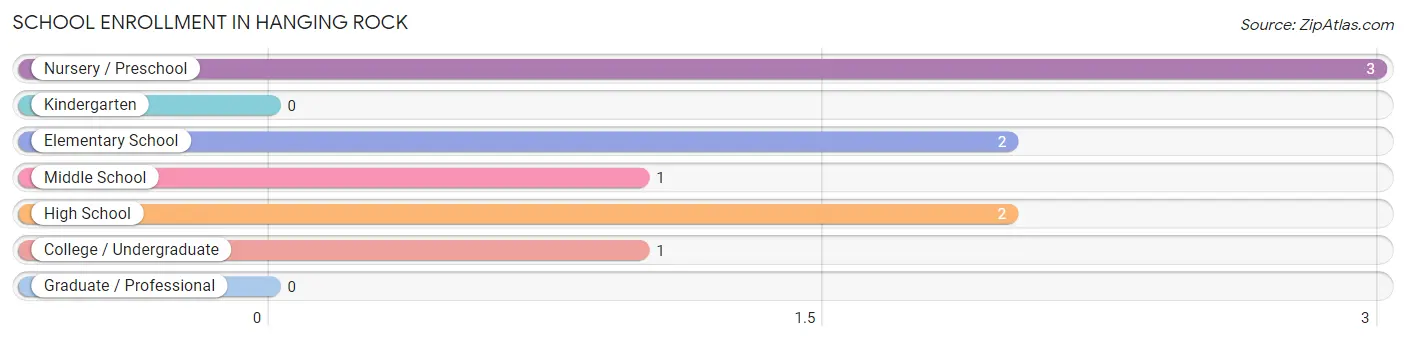
School Enrollment in Hanging Rock
The most common levels of schooling among the 9 students in Hanging Rock are nursery / preschool (3 | 33.3%), elementary school (2 | 22.2%), and high school (2 | 22.2%).
| School Level | # Students | % Students |
| Nursery / Preschool | 3 | 33.3% |
| Kindergarten | 0 | 0.0% |
| Elementary School | 2 | 22.2% |
| Middle School | 1 | 11.1% |
| High School | 2 | 22.2% |
| College / Undergraduate | 1 | 11.1% |
| Graduate / Professional | 0 | 0.0% |
| Total | 9 | 100.0% |
School Enrollment by Age by Funding Source in Hanging Rock
Out of a total of 9 students who are enrolled in schools in Hanging Rock, 1 (11.1%) attend a private institution, while the remaining 8 (88.9%) are enrolled in public schools. The age group of 20 to 24 year olds has the highest likelihood of being enrolled in private schools, with 1 (100.0% in the age bracket) enrolled. Conversely, the age group of 3 to 4 year olds has the lowest likelihood of being enrolled in a private school, with 3 (100.0% in the age bracket) attending a public institution.
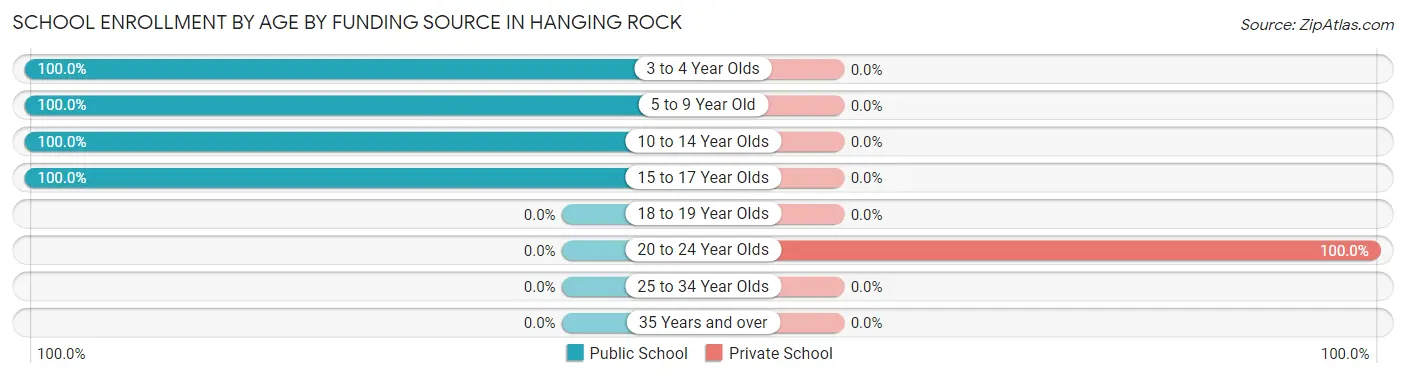
| Age Bracket | Public School | Private School |
| 3 to 4 Year Olds | 3 (100.0%) | 0 (0.0%) |
| 5 to 9 Year Old | 2 (100.0%) | 0 (0.0%) |
| 10 to 14 Year Olds | 1 (100.0%) | 0 (0.0%) |
| 15 to 17 Year Olds | 2 (100.0%) | 0 (0.0%) |
| 18 to 19 Year Olds | 0 (0.0%) | 0 (0.0%) |
| 20 to 24 Year Olds | 0 (0.0%) | 1 (100.0%) |
| 25 to 34 Year Olds | 0 (0.0%) | 0 (0.0%) |
| 35 Years and over | 0 (0.0%) | 0 (0.0%) |
| Total | 8 (88.9%) | 1 (11.1%) |
Educational Attainment by Field of Study in Hanging Rock
Business (4 | 66.7%), science & technology (1 | 16.7%), and visual & performing arts (1 | 16.7%) are the most common fields of study among 6 individuals in Hanging Rock who have obtained a bachelor's degree or higher.
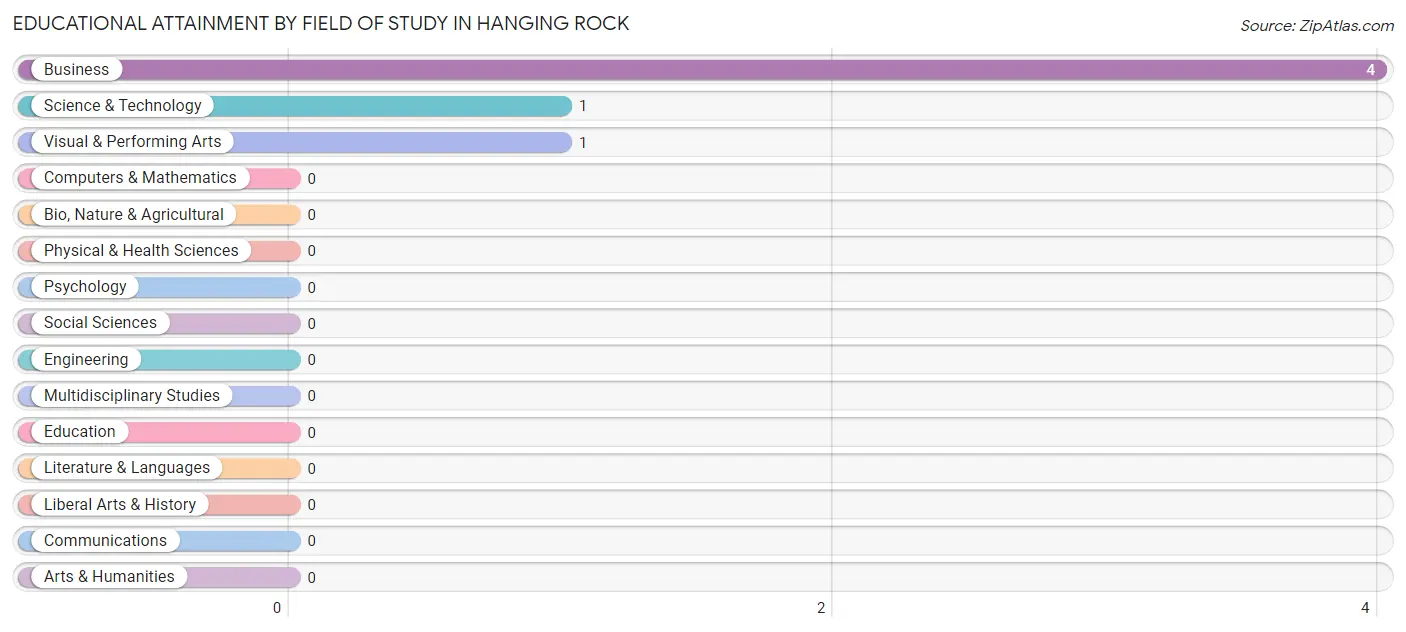
| Field of Study | # Graduates | % Graduates |
| Computers & Mathematics | 0 | 0.0% |
| Bio, Nature & Agricultural | 0 | 0.0% |
| Physical & Health Sciences | 0 | 0.0% |
| Psychology | 0 | 0.0% |
| Social Sciences | 0 | 0.0% |
| Engineering | 0 | 0.0% |
| Multidisciplinary Studies | 0 | 0.0% |
| Science & Technology | 1 | 16.7% |
| Business | 4 | 66.7% |
| Education | 0 | 0.0% |
| Literature & Languages | 0 | 0.0% |
| Liberal Arts & History | 0 | 0.0% |
| Visual & Performing Arts | 1 | 16.7% |
| Communications | 0 | 0.0% |
| Arts & Humanities | 0 | 0.0% |
| Total | 6 | 100.0% |
Transportation & Commute in Hanging Rock
Vehicle Availability by Sex in Hanging Rock
The most prevalent vehicle ownership categories in Hanging Rock are males with 3 vehicles (19, accounting for 47.5%) and females with 3 vehicles (22, making up 54.3%).
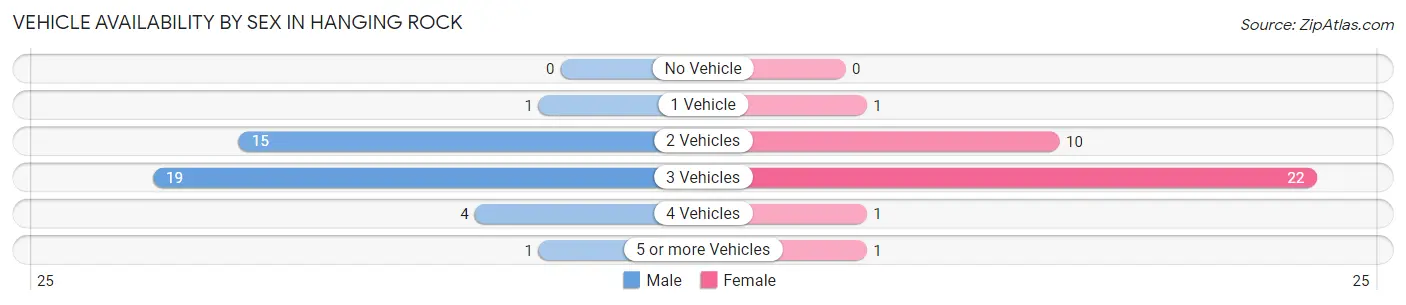
| Vehicles Available | Male | Female |
| No Vehicle | 0 (0.0%) | 0 (0.0%) |
| 1 Vehicle | 1 (2.5%) | 1 (2.9%) |
| 2 Vehicles | 15 (37.5%) | 10 (28.6%) |
| 3 Vehicles | 19 (47.5%) | 22 (62.9%) |
| 4 Vehicles | 4 (10.0%) | 1 (2.9%) |
| 5 or more Vehicles | 1 (2.5%) | 1 (2.9%) |
| Total | 40 (100.0%) | 35 (100.0%) |
Commute Time in Hanging Rock
The most frequently occuring commute durations in Hanging Rock are 15 to 19 minutes (19 commuters, 26.0%), 10 to 14 minutes (15 commuters, 20.5%), and 20 to 24 minutes (10 commuters, 13.7%).
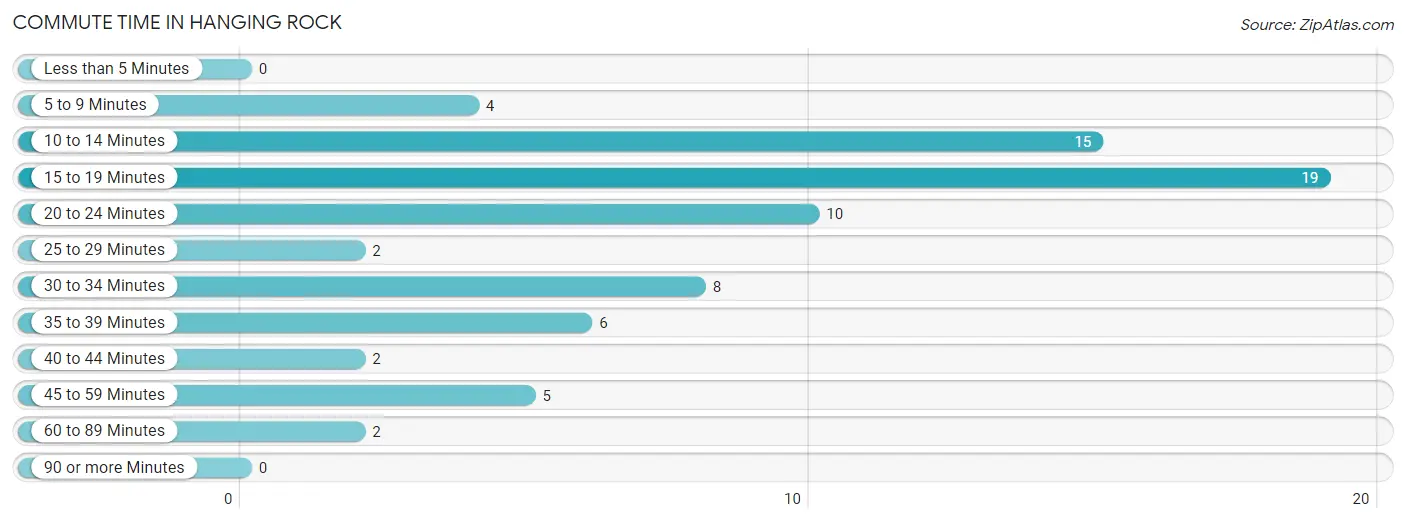
| Commute Time | # Commuters | % Commuters |
| Less than 5 Minutes | 0 | 0.0% |
| 5 to 9 Minutes | 4 | 5.5% |
| 10 to 14 Minutes | 15 | 20.5% |
| 15 to 19 Minutes | 19 | 26.0% |
| 20 to 24 Minutes | 10 | 13.7% |
| 25 to 29 Minutes | 2 | 2.7% |
| 30 to 34 Minutes | 8 | 11.0% |
| 35 to 39 Minutes | 6 | 8.2% |
| 40 to 44 Minutes | 2 | 2.7% |
| 45 to 59 Minutes | 5 | 6.9% |
| 60 to 89 Minutes | 2 | 2.7% |
| 90 or more Minutes | 0 | 0.0% |
Commute Time by Sex in Hanging Rock
The most common commute times in Hanging Rock are 10 to 14 minutes (10 commuters, 25.0%) for males and 15 to 19 minutes (10 commuters, 30.3%) for females.
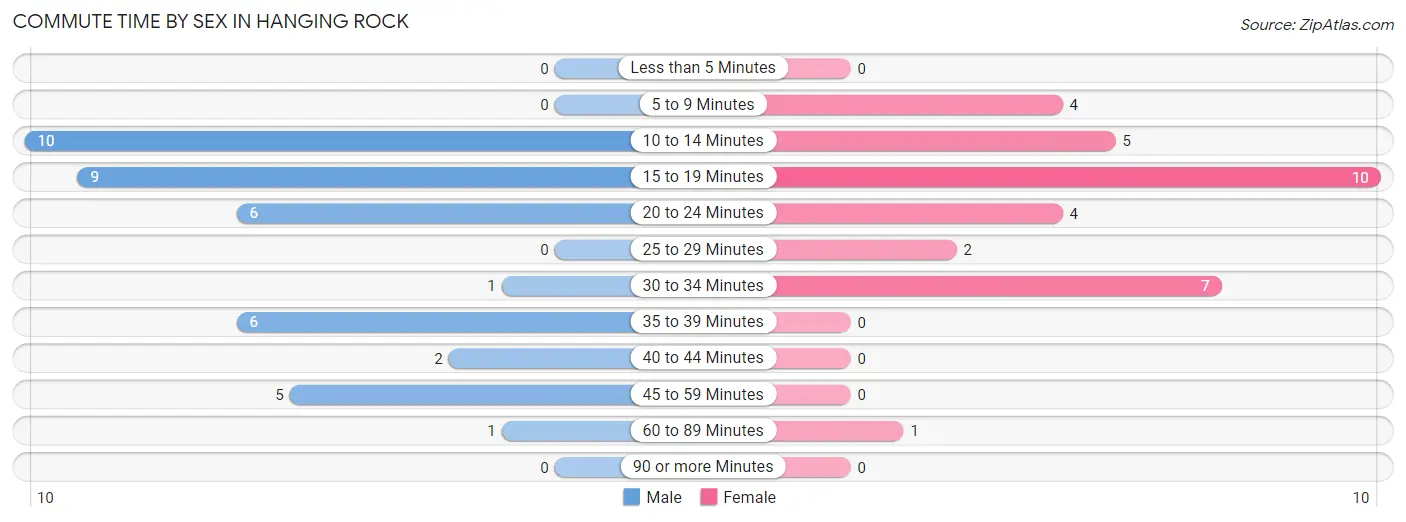
| Commute Time | Male | Female |
| Less than 5 Minutes | 0 (0.0%) | 0 (0.0%) |
| 5 to 9 Minutes | 0 (0.0%) | 4 (12.1%) |
| 10 to 14 Minutes | 10 (25.0%) | 5 (15.1%) |
| 15 to 19 Minutes | 9 (22.5%) | 10 (30.3%) |
| 20 to 24 Minutes | 6 (15.0%) | 4 (12.1%) |
| 25 to 29 Minutes | 0 (0.0%) | 2 (6.1%) |
| 30 to 34 Minutes | 1 (2.5%) | 7 (21.2%) |
| 35 to 39 Minutes | 6 (15.0%) | 0 (0.0%) |
| 40 to 44 Minutes | 2 (5.0%) | 0 (0.0%) |
| 45 to 59 Minutes | 5 (12.5%) | 0 (0.0%) |
| 60 to 89 Minutes | 1 (2.5%) | 1 (3.0%) |
| 90 or more Minutes | 0 (0.0%) | 0 (0.0%) |
Time of Departure to Work by Sex in Hanging Rock
The most frequent times of departure to work in Hanging Rock are 7:00 AM to 7:29 AM (15, 37.5%) for males and 6:00 AM to 6:29 AM (7, 21.2%) for females.
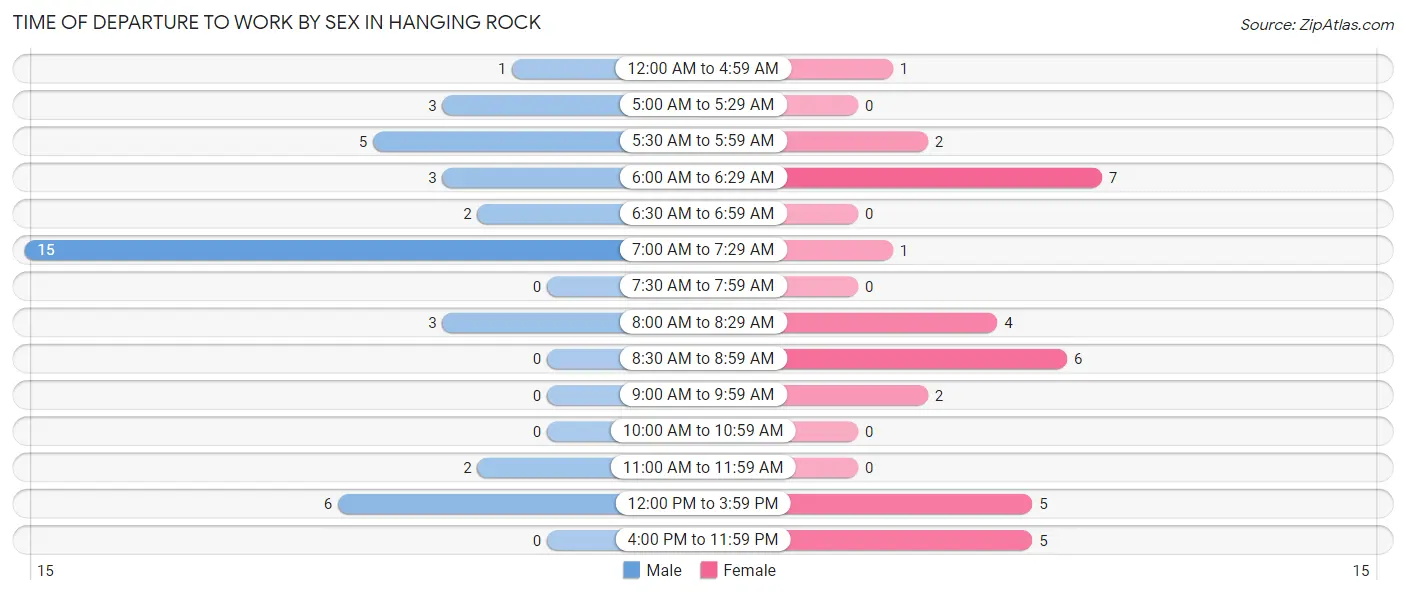
| Time of Departure | Male | Female |
| 12:00 AM to 4:59 AM | 1 (2.5%) | 1 (3.0%) |
| 5:00 AM to 5:29 AM | 3 (7.5%) | 0 (0.0%) |
| 5:30 AM to 5:59 AM | 5 (12.5%) | 2 (6.1%) |
| 6:00 AM to 6:29 AM | 3 (7.5%) | 7 (21.2%) |
| 6:30 AM to 6:59 AM | 2 (5.0%) | 0 (0.0%) |
| 7:00 AM to 7:29 AM | 15 (37.5%) | 1 (3.0%) |
| 7:30 AM to 7:59 AM | 0 (0.0%) | 0 (0.0%) |
| 8:00 AM to 8:29 AM | 3 (7.5%) | 4 (12.1%) |
| 8:30 AM to 8:59 AM | 0 (0.0%) | 6 (18.2%) |
| 9:00 AM to 9:59 AM | 0 (0.0%) | 2 (6.1%) |
| 10:00 AM to 10:59 AM | 0 (0.0%) | 0 (0.0%) |
| 11:00 AM to 11:59 AM | 2 (5.0%) | 0 (0.0%) |
| 12:00 PM to 3:59 PM | 6 (15.0%) | 5 (15.1%) |
| 4:00 PM to 11:59 PM | 0 (0.0%) | 5 (15.1%) |
| Total | 40 (100.0%) | 33 (100.0%) |
Housing Occupancy in Hanging Rock
Occupancy by Ownership in Hanging Rock
Of the total 63 dwellings in Hanging Rock, owner-occupied units account for 50 (79.4%), while renter-occupied units make up 13 (20.6%).
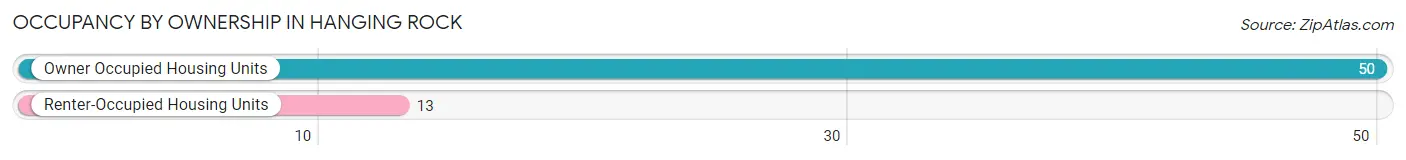
| Occupancy | # Housing Units | % Housing Units |
| Owner Occupied Housing Units | 50 | 79.4% |
| Renter-Occupied Housing Units | 13 | 20.6% |
| Total Occupied Housing Units | 63 | 100.0% |
Occupancy by Household Size in Hanging Rock
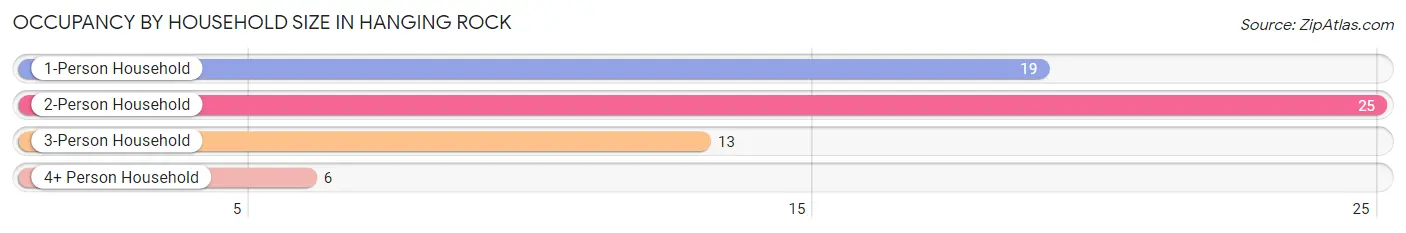
| Household Size | # Housing Units | % Housing Units |
| 1-Person Household | 19 | 30.2% |
| 2-Person Household | 25 | 39.7% |
| 3-Person Household | 13 | 20.6% |
| 4+ Person Household | 6 | 9.5% |
| Total Housing Units | 63 | 100.0% |
Occupancy by Ownership by Household Size in Hanging Rock
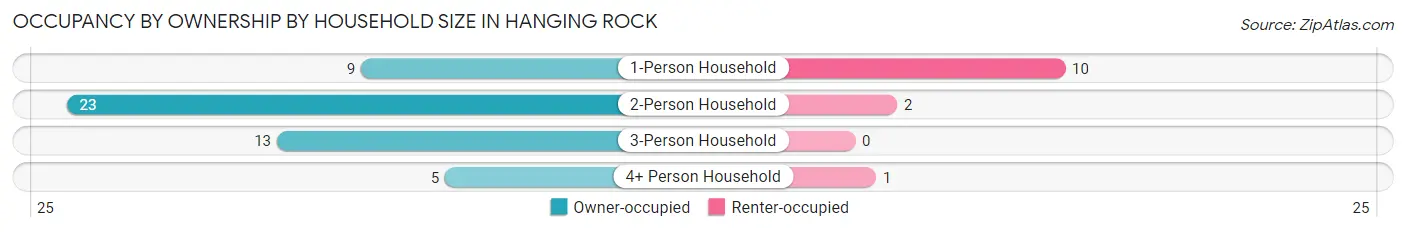
| Household Size | Owner-occupied | Renter-occupied |
| 1-Person Household | 9 (47.4%) | 10 (52.6%) |
| 2-Person Household | 23 (92.0%) | 2 (8.0%) |
| 3-Person Household | 13 (100.0%) | 0 (0.0%) |
| 4+ Person Household | 5 (83.3%) | 1 (16.7%) |
| Total Housing Units | 50 (79.4%) | 13 (20.6%) |
Occupancy by Educational Attainment in Hanging Rock
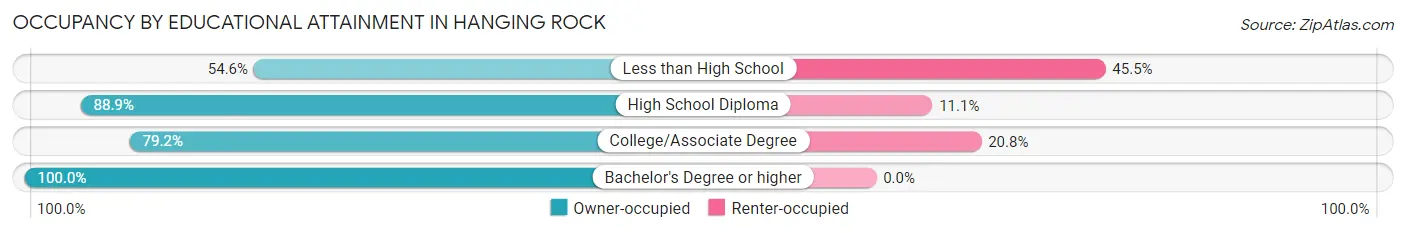
| Household Size | Owner-occupied | Renter-occupied |
| Less than High School | 6 (54.5%) | 5 (45.5%) |
| High School Diploma | 24 (88.9%) | 3 (11.1%) |
| College/Associate Degree | 19 (79.2%) | 5 (20.8%) |
| Bachelor's Degree or higher | 1 (100.0%) | 0 (0.0%) |
Occupancy by Age of Householder in Hanging Rock
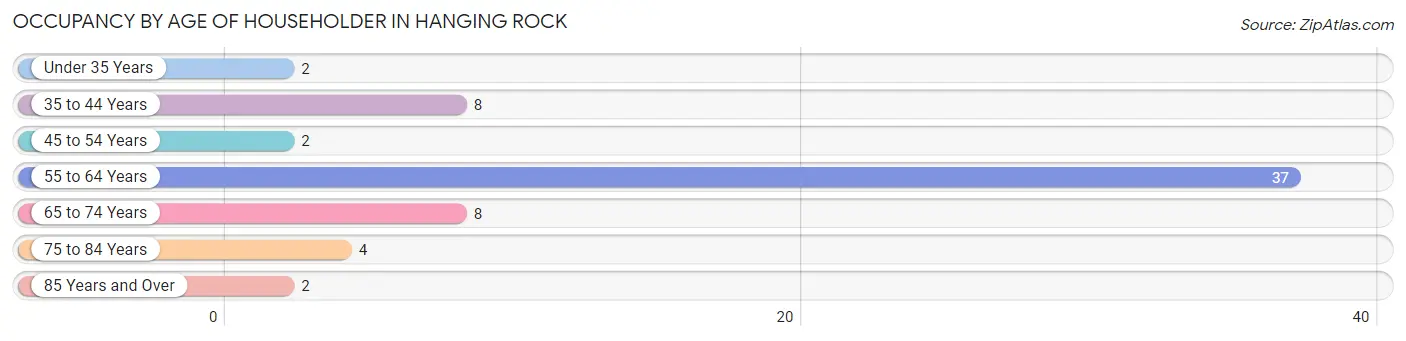
| Age Bracket | # Households | % Households |
| Under 35 Years | 2 | 3.2% |
| 35 to 44 Years | 8 | 12.7% |
| 45 to 54 Years | 2 | 3.2% |
| 55 to 64 Years | 37 | 58.7% |
| 65 to 74 Years | 8 | 12.7% |
| 75 to 84 Years | 4 | 6.4% |
| 85 Years and Over | 2 | 3.2% |
| Total | 63 | 100.0% |
Housing Finances in Hanging Rock
Median Income by Occupancy in Hanging Rock
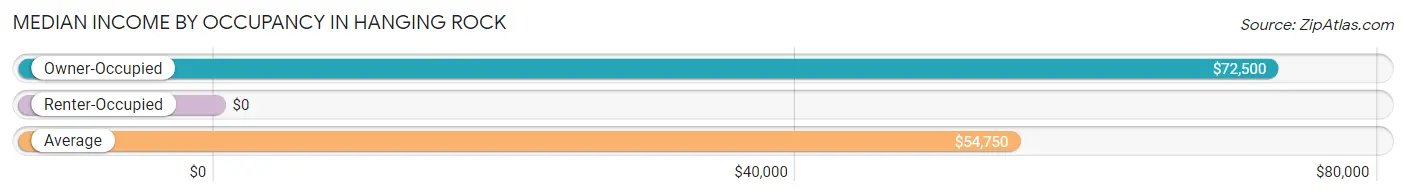
| Occupancy Type | # Households | Median Income |
| Owner-Occupied | 50 (79.4%) | $72,500 |
| Renter-Occupied | 13 (20.6%) | $0 |
| Average | 63 (100.0%) | $54,750 |
Occupancy by Householder Income Bracket in Hanging Rock
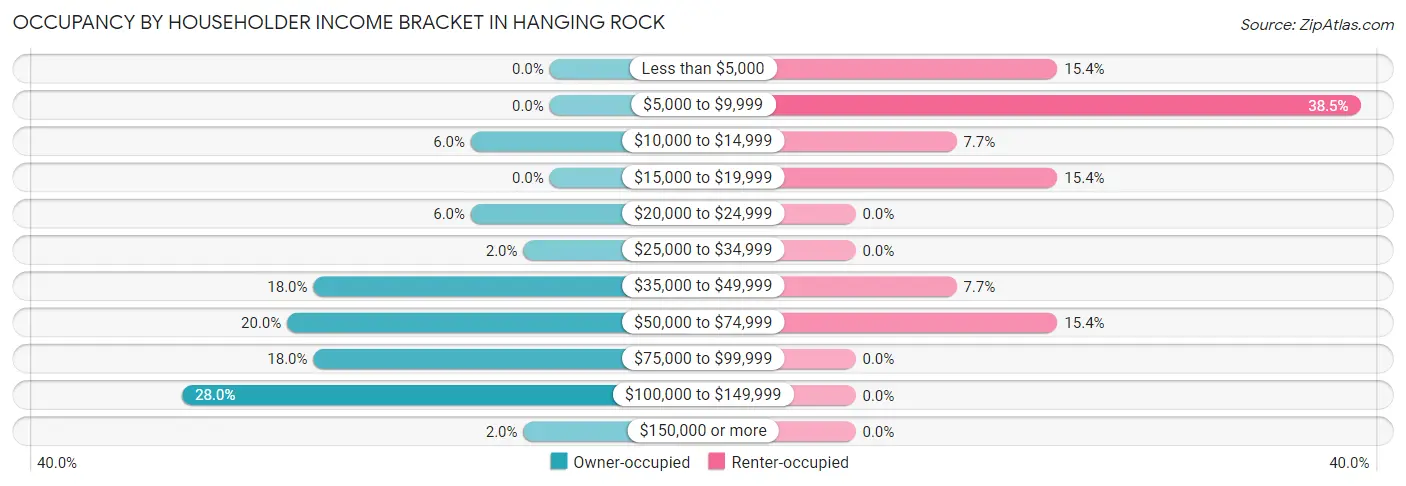
| Income Bracket | Owner-occupied | Renter-occupied |
| Less than $5,000 | 0 (0.0%) | 2 (15.4%) |
| $5,000 to $9,999 | 0 (0.0%) | 5 (38.5%) |
| $10,000 to $14,999 | 3 (6.0%) | 1 (7.7%) |
| $15,000 to $19,999 | 0 (0.0%) | 2 (15.4%) |
| $20,000 to $24,999 | 3 (6.0%) | 0 (0.0%) |
| $25,000 to $34,999 | 1 (2.0%) | 0 (0.0%) |
| $35,000 to $49,999 | 9 (18.0%) | 1 (7.7%) |
| $50,000 to $74,999 | 10 (20.0%) | 2 (15.4%) |
| $75,000 to $99,999 | 9 (18.0%) | 0 (0.0%) |
| $100,000 to $149,999 | 14 (28.0%) | 0 (0.0%) |
| $150,000 or more | 1 (2.0%) | 0 (0.0%) |
| Total | 50 (100.0%) | 13 (100.0%) |
Monthly Housing Cost Tiers in Hanging Rock
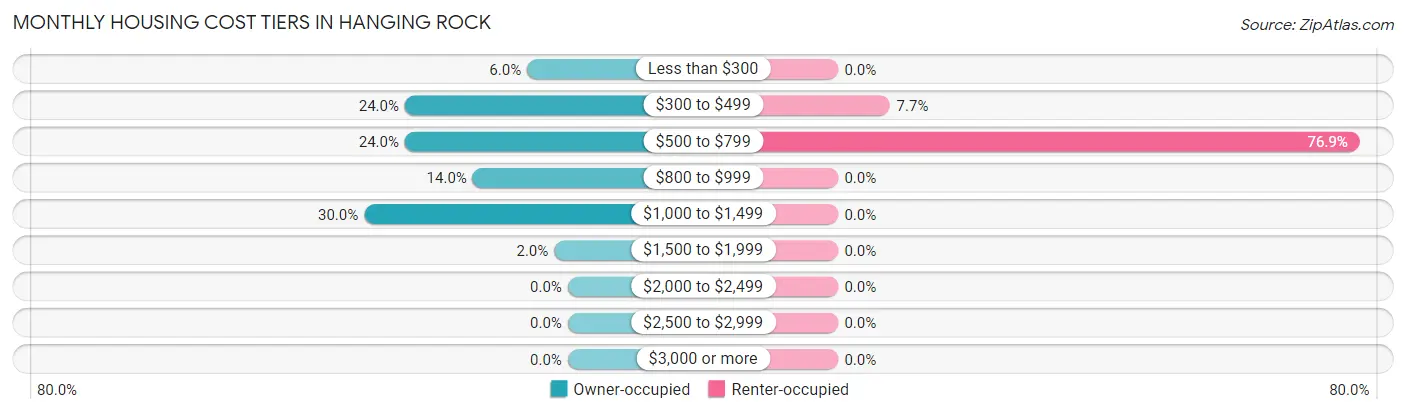
| Monthly Cost | Owner-occupied | Renter-occupied |
| Less than $300 | 3 (6.0%) | 0 (0.0%) |
| $300 to $499 | 12 (24.0%) | 1 (7.7%) |
| $500 to $799 | 12 (24.0%) | 10 (76.9%) |
| $800 to $999 | 7 (14.0%) | 0 (0.0%) |
| $1,000 to $1,499 | 15 (30.0%) | 0 (0.0%) |
| $1,500 to $1,999 | 1 (2.0%) | 0 (0.0%) |
| $2,000 to $2,499 | 0 (0.0%) | 0 (0.0%) |
| $2,500 to $2,999 | 0 (0.0%) | 0 (0.0%) |
| $3,000 or more | 0 (0.0%) | 0 (0.0%) |
| Total | 50 (100.0%) | 13 (100.0%) |
Physical Housing Characteristics in Hanging Rock
Housing Structures in Hanging Rock
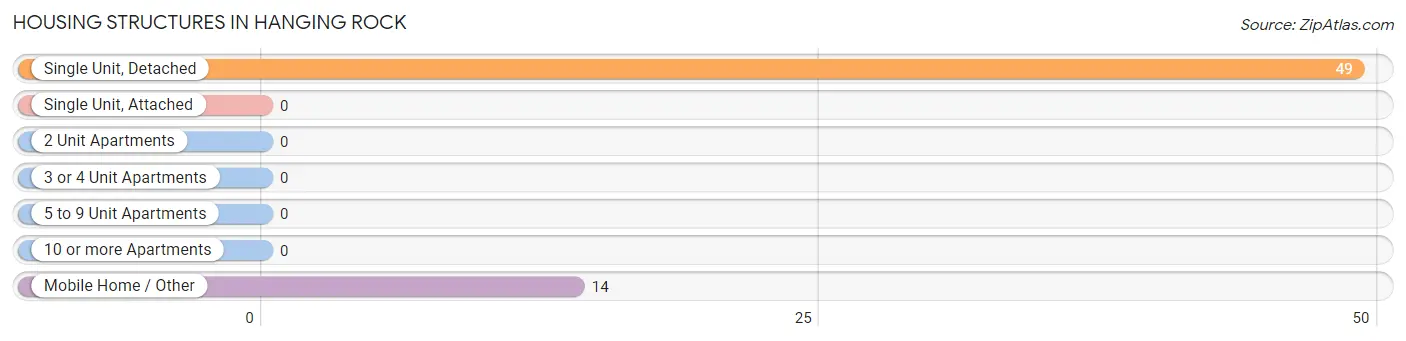
| Structure Type | # Housing Units | % Housing Units |
| Single Unit, Detached | 49 | 77.8% |
| Single Unit, Attached | 0 | 0.0% |
| 2 Unit Apartments | 0 | 0.0% |
| 3 or 4 Unit Apartments | 0 | 0.0% |
| 5 to 9 Unit Apartments | 0 | 0.0% |
| 10 or more Apartments | 0 | 0.0% |
| Mobile Home / Other | 14 | 22.2% |
| Total | 63 | 100.0% |
Housing Structures by Occupancy in Hanging Rock
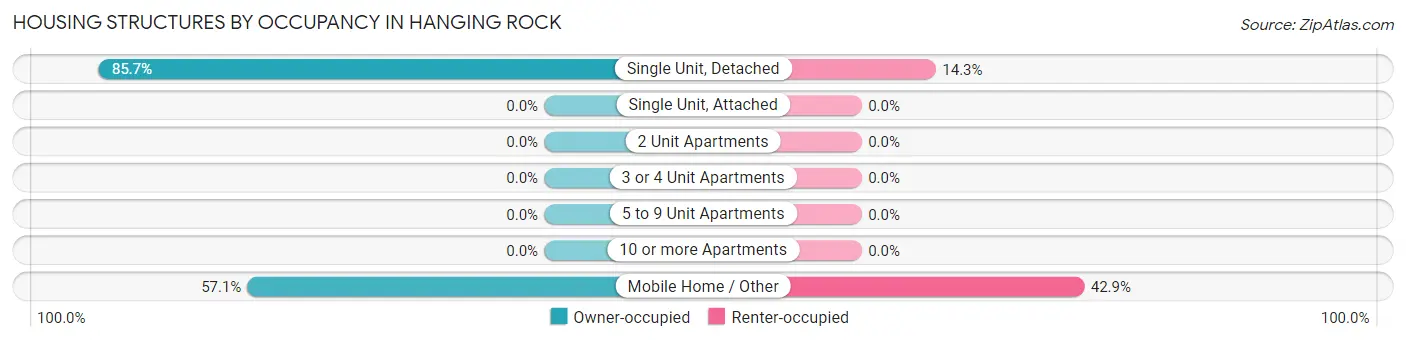
| Structure Type | Owner-occupied | Renter-occupied |
| Single Unit, Detached | 42 (85.7%) | 7 (14.3%) |
| Single Unit, Attached | 0 (0.0%) | 0 (0.0%) |
| 2 Unit Apartments | 0 (0.0%) | 0 (0.0%) |
| 3 or 4 Unit Apartments | 0 (0.0%) | 0 (0.0%) |
| 5 to 9 Unit Apartments | 0 (0.0%) | 0 (0.0%) |
| 10 or more Apartments | 0 (0.0%) | 0 (0.0%) |
| Mobile Home / Other | 8 (57.1%) | 6 (42.9%) |
| Total | 50 (79.4%) | 13 (20.6%) |
Housing Structures by Number of Rooms in Hanging Rock
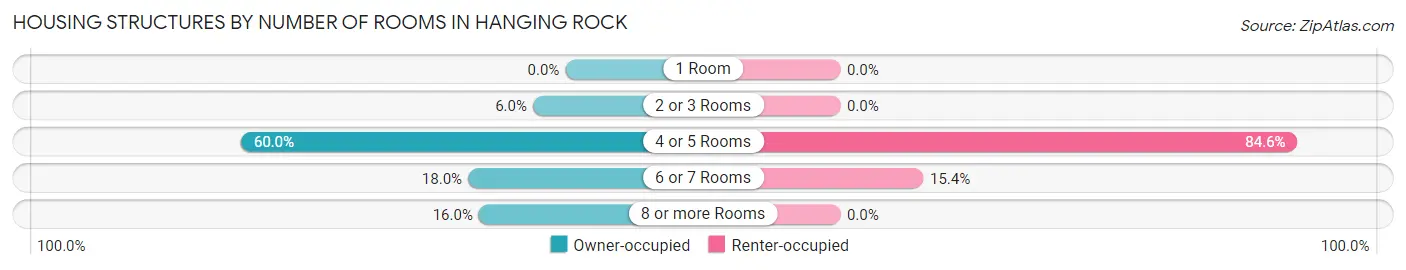
| Number of Rooms | Owner-occupied | Renter-occupied |
| 1 Room | 0 (0.0%) | 0 (0.0%) |
| 2 or 3 Rooms | 3 (6.0%) | 0 (0.0%) |
| 4 or 5 Rooms | 30 (60.0%) | 11 (84.6%) |
| 6 or 7 Rooms | 9 (18.0%) | 2 (15.4%) |
| 8 or more Rooms | 8 (16.0%) | 0 (0.0%) |
| Total | 50 (100.0%) | 13 (100.0%) |
Housing Structure by Heating Type in Hanging Rock
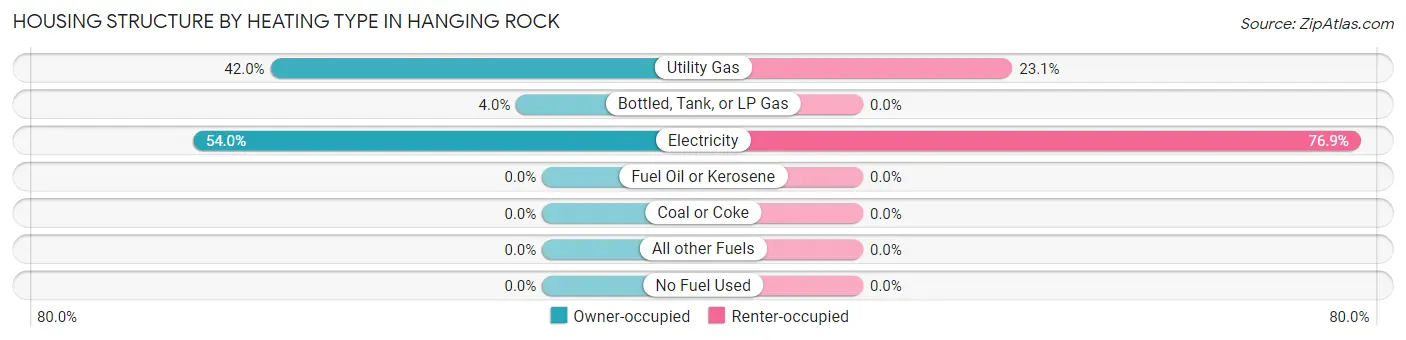
| Heating Type | Owner-occupied | Renter-occupied |
| Utility Gas | 21 (42.0%) | 3 (23.1%) |
| Bottled, Tank, or LP Gas | 2 (4.0%) | 0 (0.0%) |
| Electricity | 27 (54.0%) | 10 (76.9%) |
| Fuel Oil or Kerosene | 0 (0.0%) | 0 (0.0%) |
| Coal or Coke | 0 (0.0%) | 0 (0.0%) |
| All other Fuels | 0 (0.0%) | 0 (0.0%) |
| No Fuel Used | 0 (0.0%) | 0 (0.0%) |
| Total | 50 (100.0%) | 13 (100.0%) |
Household Vehicle Usage in Hanging Rock
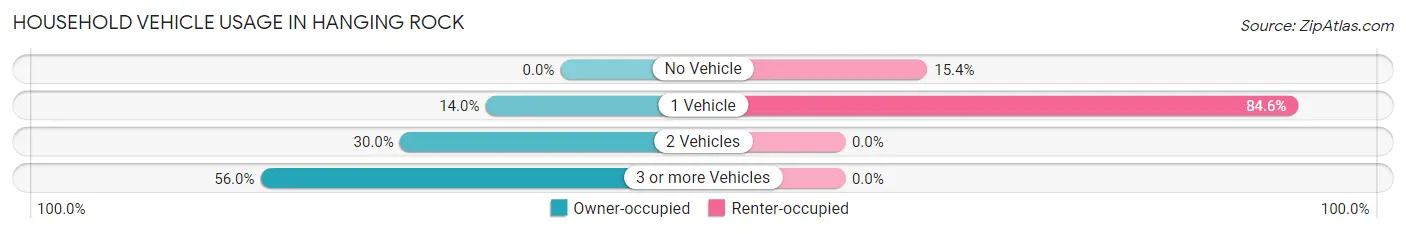
| Vehicles per Household | Owner-occupied | Renter-occupied |
| No Vehicle | 0 (0.0%) | 2 (15.4%) |
| 1 Vehicle | 7 (14.0%) | 11 (84.6%) |
| 2 Vehicles | 15 (30.0%) | 0 (0.0%) |
| 3 or more Vehicles | 28 (56.0%) | 0 (0.0%) |
| Total | 50 (100.0%) | 13 (100.0%) |
Real Estate & Mortgages in Hanging Rock
Real Estate and Mortgage Overview in Hanging Rock
| Characteristic | Without Mortgage | With Mortgage |
| Housing Units | 18 | 32 |
| Median Property Value | $114,300 | $95,000 |
| Median Household Income | $60,625 | $1 |
| Monthly Housing Costs | $467 | $0 |
| Real Estate Taxes | $767 | $0 |
Property Value by Mortgage Status in Hanging Rock
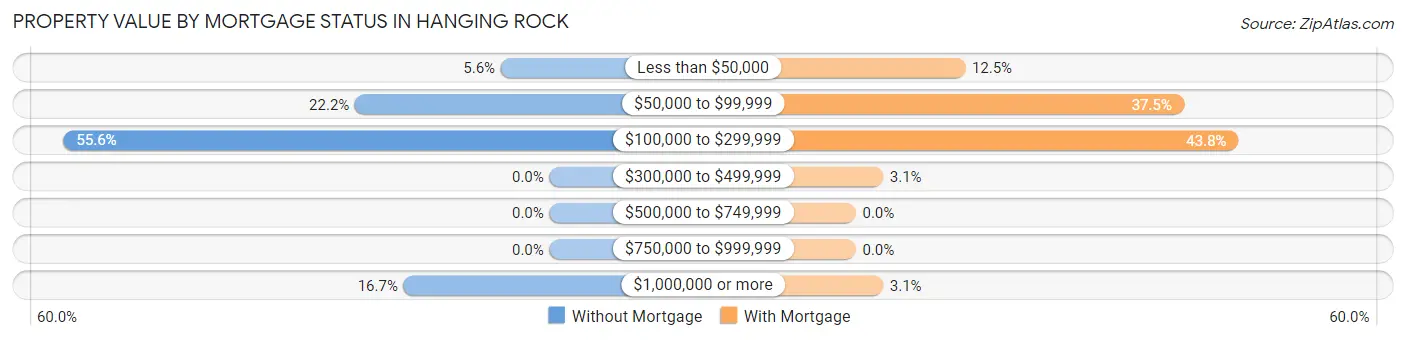
| Property Value | Without Mortgage | With Mortgage |
| Less than $50,000 | 1 (5.6%) | 4 (12.5%) |
| $50,000 to $99,999 | 4 (22.2%) | 12 (37.5%) |
| $100,000 to $299,999 | 10 (55.6%) | 14 (43.8%) |
| $300,000 to $499,999 | 0 (0.0%) | 1 (3.1%) |
| $500,000 to $749,999 | 0 (0.0%) | 0 (0.0%) |
| $750,000 to $999,999 | 0 (0.0%) | 0 (0.0%) |
| $1,000,000 or more | 3 (16.7%) | 1 (3.1%) |
| Total | 18 (100.0%) | 32 (100.0%) |
Household Income by Mortgage Status in Hanging Rock
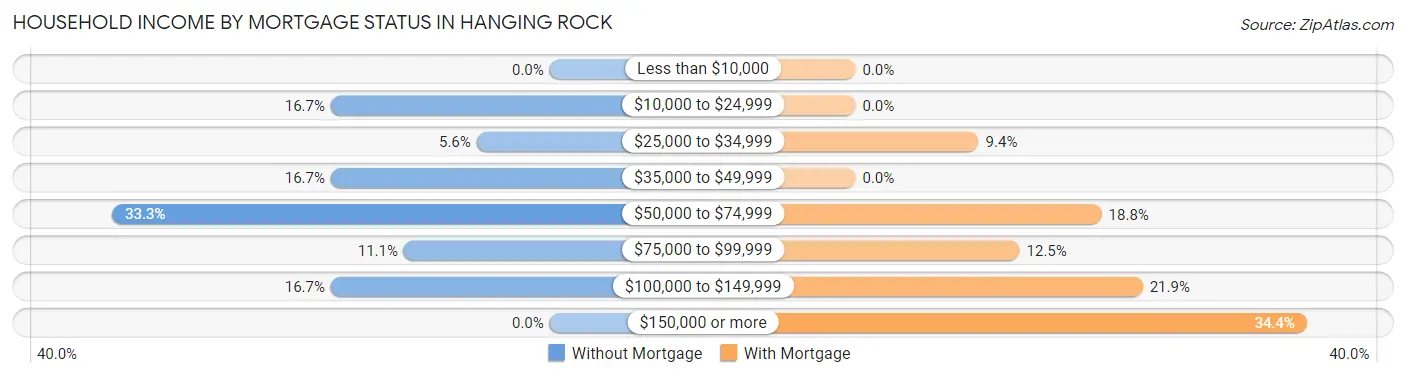
| Household Income | Without Mortgage | With Mortgage |
| Less than $10,000 | 0 (0.0%) | 0 (0.0%) |
| $10,000 to $24,999 | 3 (16.7%) | 0 (0.0%) |
| $25,000 to $34,999 | 1 (5.6%) | 3 (9.4%) |
| $35,000 to $49,999 | 3 (16.7%) | 0 (0.0%) |
| $50,000 to $74,999 | 6 (33.3%) | 6 (18.8%) |
| $75,000 to $99,999 | 2 (11.1%) | 4 (12.5%) |
| $100,000 to $149,999 | 3 (16.7%) | 7 (21.9%) |
| $150,000 or more | 0 (0.0%) | 11 (34.4%) |
| Total | 18 (100.0%) | 32 (100.0%) |
Property Value to Household Income Ratio in Hanging Rock
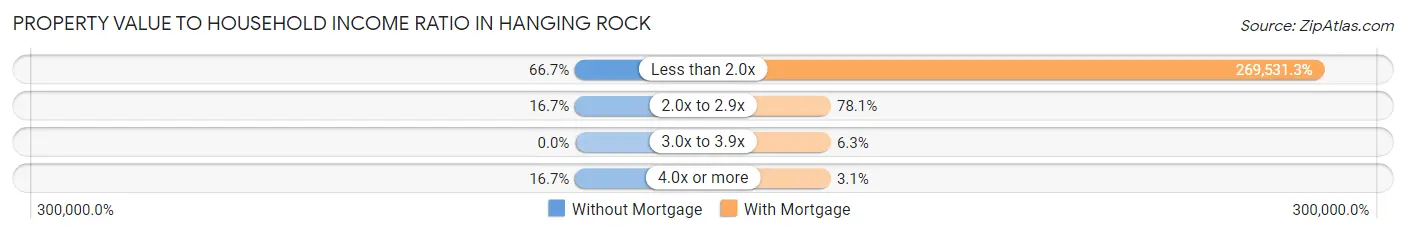
| Value-to-Income Ratio | Without Mortgage | With Mortgage |
| Less than 2.0x | 12 (66.7%) | 86,250 (269,531.2%) |
| 2.0x to 2.9x | 3 (16.7%) | 25 (78.1%) |
| 3.0x to 3.9x | 0 (0.0%) | 2 (6.2%) |
| 4.0x or more | 3 (16.7%) | 1 (3.1%) |
| Total | 18 (100.0%) | 32 (100.0%) |
Real Estate Taxes by Mortgage Status in Hanging Rock
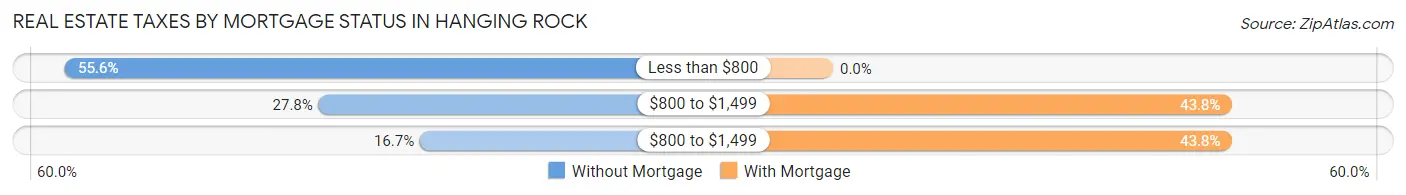
| Property Taxes | Without Mortgage | With Mortgage |
| Less than $800 | 10 (55.6%) | 0 (0.0%) |
| $800 to $1,499 | 5 (27.8%) | 14 (43.8%) |
| $800 to $1,499 | 3 (16.7%) | 14 (43.8%) |
| Total | 18 (100.0%) | 32 (100.0%) |
Health & Disability in Hanging Rock
Health Insurance Coverage by Age in Hanging Rock
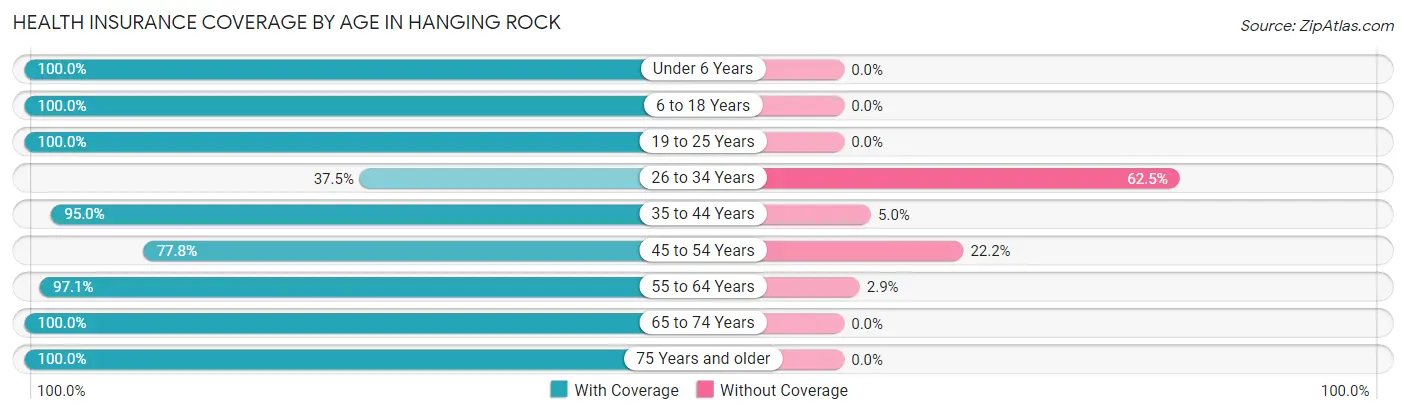
| Age Bracket | With Coverage | Without Coverage |
| Under 6 Years | 5 (100.0%) | 0 (0.0%) |
| 6 to 18 Years | 6 (100.0%) | 0 (0.0%) |
| 19 to 25 Years | 6 (100.0%) | 0 (0.0%) |
| 26 to 34 Years | 3 (37.5%) | 5 (62.5%) |
| 35 to 44 Years | 19 (95.0%) | 1 (5.0%) |
| 45 to 54 Years | 7 (77.8%) | 2 (22.2%) |
| 55 to 64 Years | 67 (97.1%) | 2 (2.9%) |
| 65 to 74 Years | 14 (100.0%) | 0 (0.0%) |
| 75 Years and older | 8 (100.0%) | 0 (0.0%) |
| Total | 135 (93.1%) | 10 (6.9%) |
Health Insurance Coverage by Citizenship Status in Hanging Rock
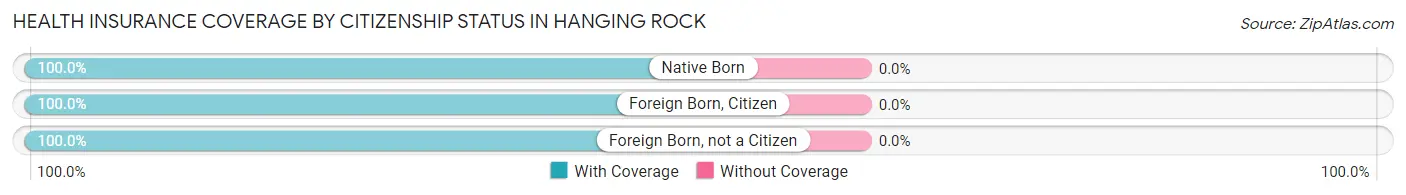
| Citizenship Status | With Coverage | Without Coverage |
| Native Born | 5 (100.0%) | 0 (0.0%) |
| Foreign Born, Citizen | 6 (100.0%) | 0 (0.0%) |
| Foreign Born, not a Citizen | 6 (100.0%) | 0 (0.0%) |
Health Insurance Coverage by Household Income in Hanging Rock
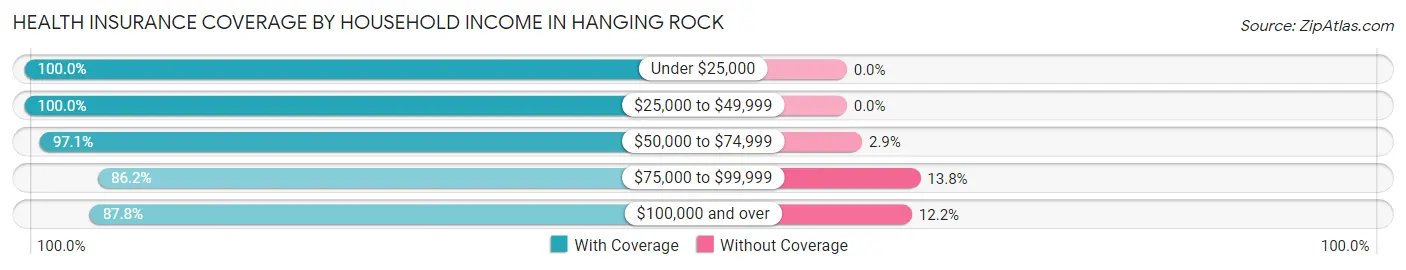
| Household Income | With Coverage | Without Coverage |
| Under $25,000 | 16 (100.0%) | 0 (0.0%) |
| $25,000 to $49,999 | 24 (100.0%) | 0 (0.0%) |
| $50,000 to $74,999 | 34 (97.1%) | 1 (2.9%) |
| $75,000 to $99,999 | 25 (86.2%) | 4 (13.8%) |
| $100,000 and over | 36 (87.8%) | 5 (12.2%) |
Public vs Private Health Insurance Coverage by Age in Hanging Rock
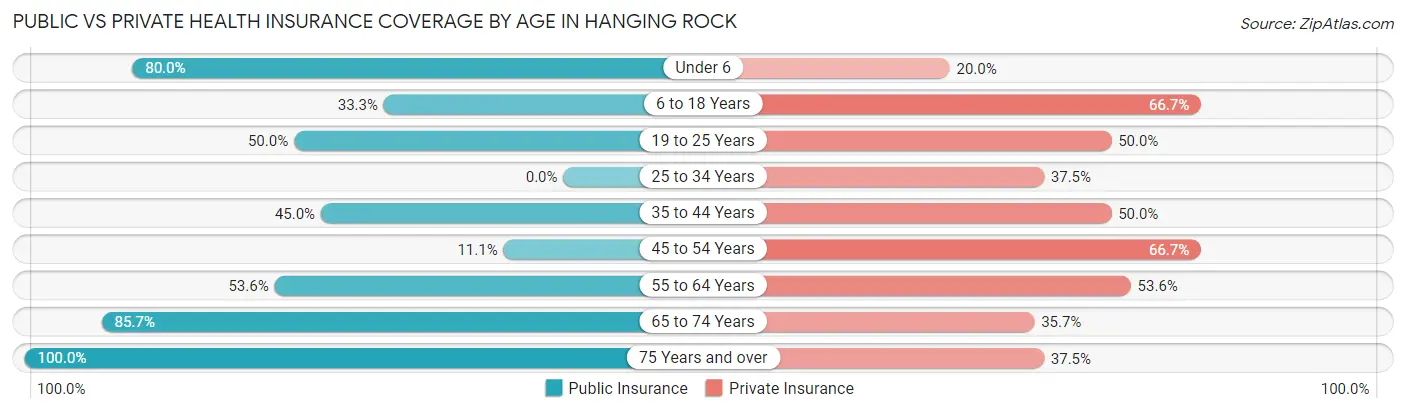
| Age Bracket | Public Insurance | Private Insurance |
| Under 6 | 4 (80.0%) | 1 (20.0%) |
| 6 to 18 Years | 2 (33.3%) | 4 (66.7%) |
| 19 to 25 Years | 3 (50.0%) | 3 (50.0%) |
| 25 to 34 Years | 0 (0.0%) | 3 (37.5%) |
| 35 to 44 Years | 9 (45.0%) | 10 (50.0%) |
| 45 to 54 Years | 1 (11.1%) | 6 (66.7%) |
| 55 to 64 Years | 37 (53.6%) | 37 (53.6%) |
| 65 to 74 Years | 12 (85.7%) | 5 (35.7%) |
| 75 Years and over | 8 (100.0%) | 3 (37.5%) |
| Total | 76 (52.4%) | 72 (49.7%) |
Disability Status by Sex by Age in Hanging Rock
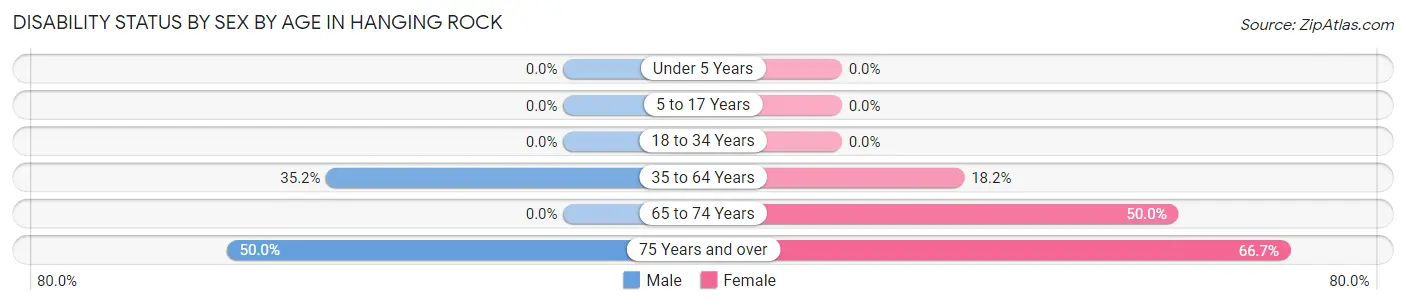
| Age Bracket | Male | Female |
| Under 5 Years | 0 (0.0%) | 0 (0.0%) |
| 5 to 17 Years | 0 (0.0%) | 0 (0.0%) |
| 18 to 34 Years | 0 (0.0%) | 0 (0.0%) |
| 35 to 64 Years | 19 (35.2%) | 8 (18.2%) |
| 65 to 74 Years | 0 (0.0%) | 5 (50.0%) |
| 75 Years and over | 1 (50.0%) | 4 (66.7%) |
Disability Class by Sex by Age in Hanging Rock
Disability Class: Hearing Difficulty
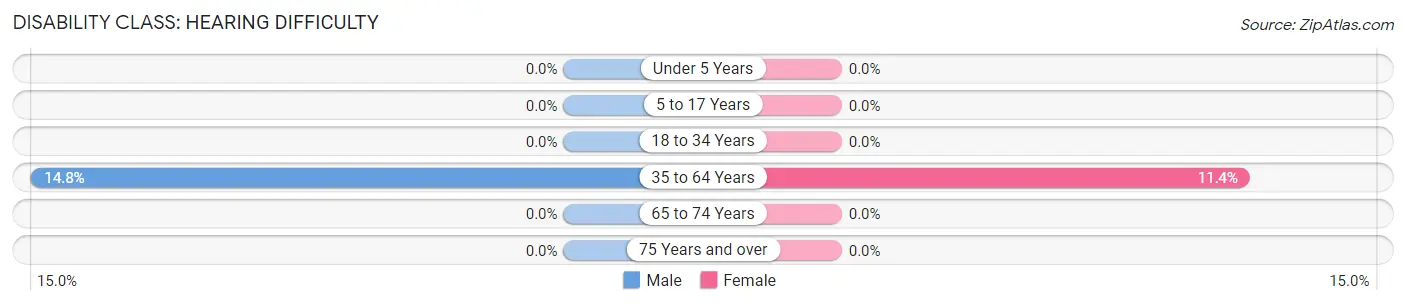
| Age Bracket | Male | Female |
| Under 5 Years | 0 (0.0%) | 0 (0.0%) |
| 5 to 17 Years | 0 (0.0%) | 0 (0.0%) |
| 18 to 34 Years | 0 (0.0%) | 0 (0.0%) |
| 35 to 64 Years | 8 (14.8%) | 5 (11.4%) |
| 65 to 74 Years | 0 (0.0%) | 0 (0.0%) |
| 75 Years and over | 0 (0.0%) | 0 (0.0%) |
Disability Class: Vision Difficulty
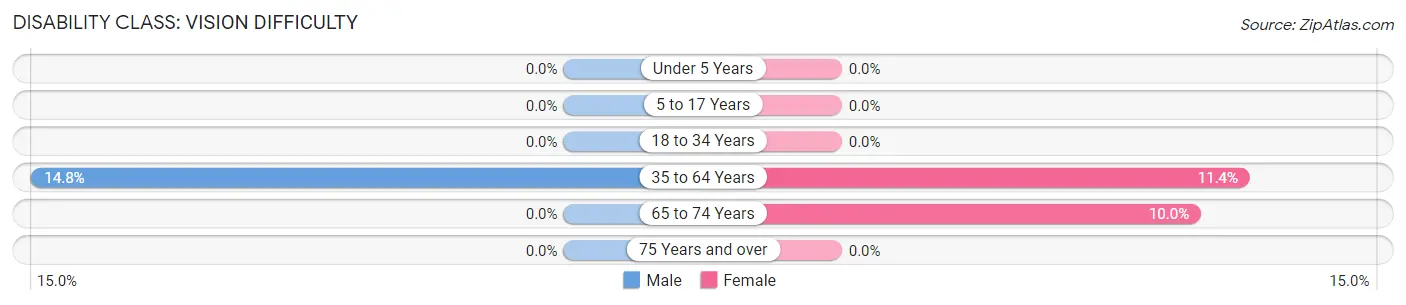
| Age Bracket | Male | Female |
| Under 5 Years | 0 (0.0%) | 0 (0.0%) |
| 5 to 17 Years | 0 (0.0%) | 0 (0.0%) |
| 18 to 34 Years | 0 (0.0%) | 0 (0.0%) |
| 35 to 64 Years | 8 (14.8%) | 5 (11.4%) |
| 65 to 74 Years | 0 (0.0%) | 1 (10.0%) |
| 75 Years and over | 0 (0.0%) | 0 (0.0%) |
Disability Class: Cognitive Difficulty
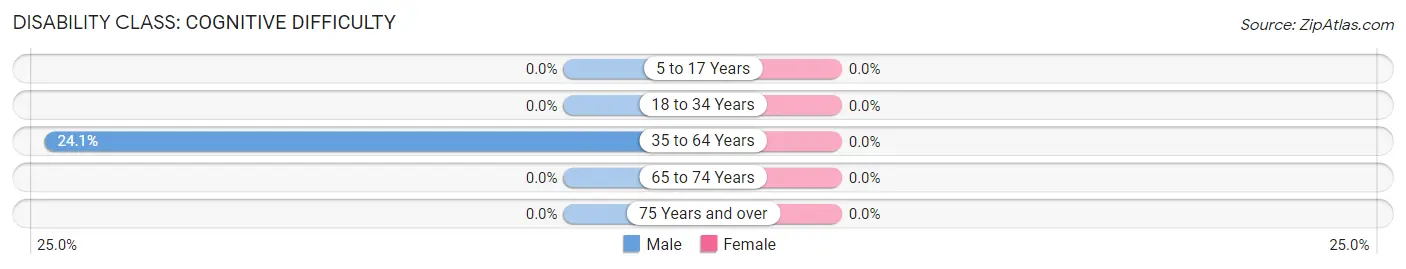
| Age Bracket | Male | Female |
| 5 to 17 Years | 0 (0.0%) | 0 (0.0%) |
| 18 to 34 Years | 0 (0.0%) | 0 (0.0%) |
| 35 to 64 Years | 13 (24.1%) | 0 (0.0%) |
| 65 to 74 Years | 0 (0.0%) | 0 (0.0%) |
| 75 Years and over | 0 (0.0%) | 0 (0.0%) |
Disability Class: Ambulatory Difficulty
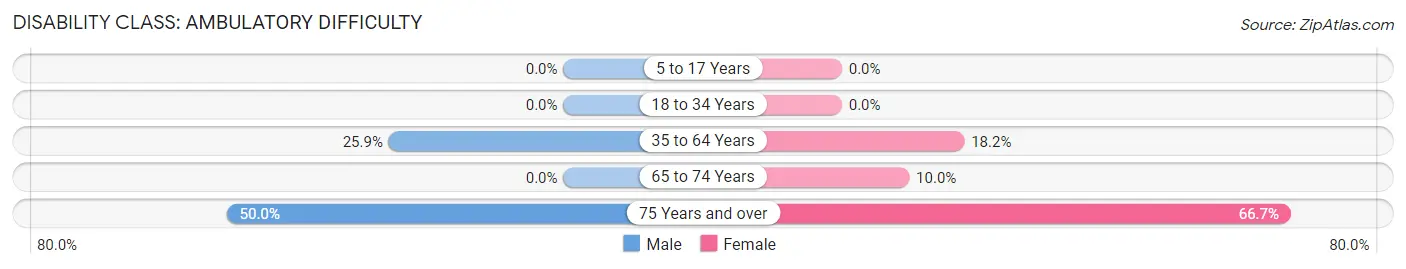
| Age Bracket | Male | Female |
| 5 to 17 Years | 0 (0.0%) | 0 (0.0%) |
| 18 to 34 Years | 0 (0.0%) | 0 (0.0%) |
| 35 to 64 Years | 14 (25.9%) | 8 (18.2%) |
| 65 to 74 Years | 0 (0.0%) | 1 (10.0%) |
| 75 Years and over | 1 (50.0%) | 4 (66.7%) |
Disability Class: Self-Care Difficulty
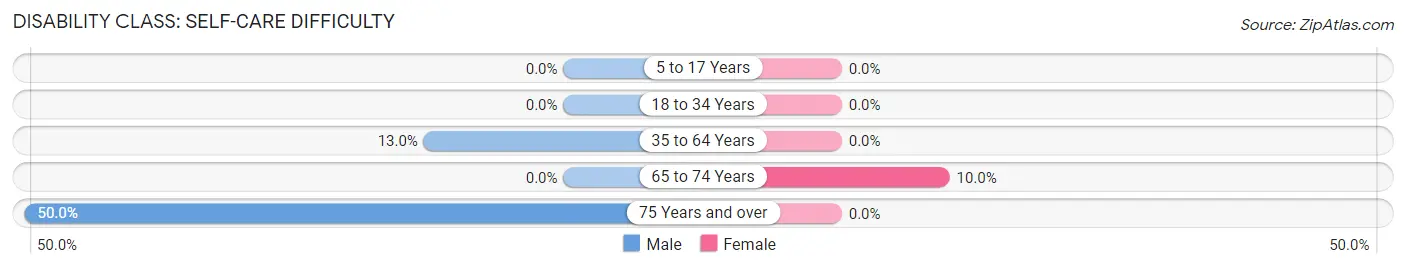
| Age Bracket | Male | Female |
| 5 to 17 Years | 0 (0.0%) | 0 (0.0%) |
| 18 to 34 Years | 0 (0.0%) | 0 (0.0%) |
| 35 to 64 Years | 7 (13.0%) | 0 (0.0%) |
| 65 to 74 Years | 0 (0.0%) | 1 (10.0%) |
| 75 Years and over | 1 (50.0%) | 0 (0.0%) |
Technology Access in Hanging Rock
Computing Device Access in Hanging Rock
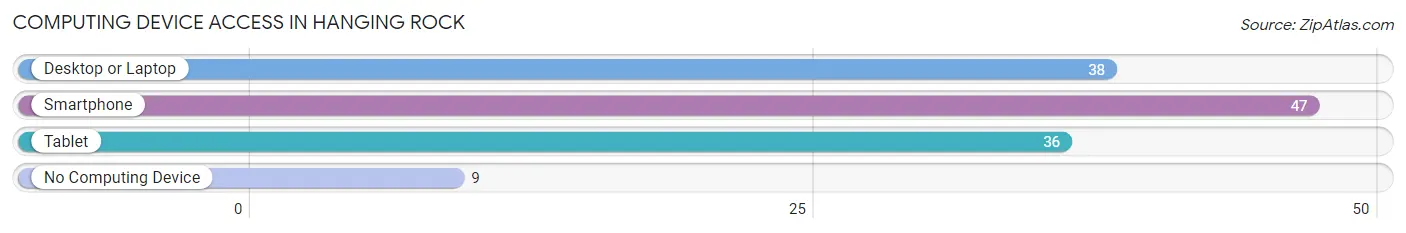
| Device Type | # Households | % Households |
| Desktop or Laptop | 38 | 60.3% |
| Smartphone | 47 | 74.6% |
| Tablet | 36 | 57.1% |
| No Computing Device | 9 | 14.3% |
| Total | 63 | 100.0% |
Internet Access in Hanging Rock
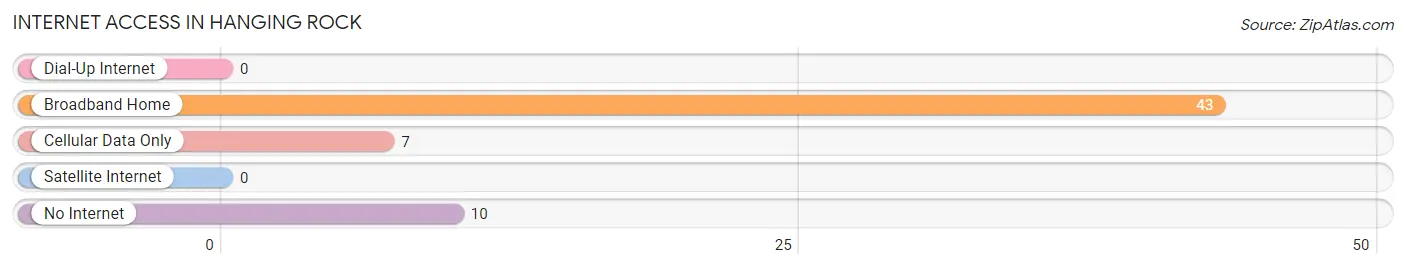
| Internet Type | # Households | % Households |
| Dial-Up Internet | 0 | 0.0% |
| Broadband Home | 43 | 68.2% |
| Cellular Data Only | 7 | 11.1% |
| Satellite Internet | 0 | 0.0% |
| No Internet | 10 | 15.9% |
| Total | 63 | 100.0% |
Hanging Rock Summary
Hanging Rock is a small village located in Lawrence County, Ohio. It is situated on the banks of the Ohio River, approximately 20 miles south of the city of Ironton. The village has a population of approximately 1,000 people and is part of the Huntington-Ashland Metropolitan Statistical Area.
History
Hanging Rock was first settled in the early 1800s by a group of settlers from Virginia. The village was named after a large rock formation located nearby, which was said to resemble a hanging rock. The village was incorporated in 1837 and was home to a variety of industries, including a sawmill, a gristmill, and a tannery.
In the late 1800s, the village was home to a large number of coal mines, which provided employment for many of the residents. The coal industry declined in the early 1900s, and the village began to decline as well. In the 1950s, the village was revitalized with the construction of a new bridge across the Ohio River. This bridge allowed for increased access to the village and helped to spur economic growth.
Geography
Hanging Rock is located in the Appalachian Plateau region of Ohio. The village is situated on the banks of the Ohio River, approximately 20 miles south of the city of Ironton. The village is surrounded by rolling hills and forests, and is home to a variety of wildlife. The climate in the area is generally mild, with temperatures ranging from the mid-30s in the winter to the mid-80s in the summer.
Economy
The economy of Hanging Rock is largely based on agriculture and tourism. The village is home to a number of farms, which produce a variety of crops, including corn, soybeans, and wheat. The village is also home to a number of tourist attractions, including the Hanging Rock State Park, which offers a variety of outdoor activities, such as hiking, camping, and fishing.
Demographics
As of the 2010 census, the population of Hanging Rock was 1,000 people. The racial makeup of the village was 97.2% White, 0.7% African American, 0.2% Native American, 0.2% Asian, and 1.7% from other races. The median household income in the village was $31,250, and the median family income was $37,500. The per capita income in the village was $15,945.
Conclusion
Hanging Rock is a small village located in Lawrence County, Ohio. It is situated on the banks of the Ohio River, approximately 20 miles south of the city of Ironton. The village has a population of approximately 1,000 people and is part of the Huntington-Ashland Metropolitan Statistical Area. The economy of Hanging Rock is largely based on agriculture and tourism, and the village is home to a variety of farms and tourist attractions. The racial makeup of the village is predominantly White, with a small percentage of African American, Native American, and Asian residents. The median household income in the village is $31,250, and the per capita income is $15,945.
Common Questions
What is Per Capita Income in Hanging Rock?
Per Capita income in Hanging Rock is $29,801.
What is the Median Family Income in Hanging Rock?
Median Family Income in Hanging Rock is $82,750.
What is the Median Household income in Hanging Rock?
Median Household Income in Hanging Rock is $54,750.
What is Income or Wage Gap in Hanging Rock?
Income or Wage Gap in Hanging Rock is 51.2%.
Women in Hanging Rock earn 48.8 cents for every dollar earned by a man.
What is Inequality or Gini Index in Hanging Rock?
Inequality or Gini Index in Hanging Rock is 0.37.
What is the Total Population of Hanging Rock?
Total Population of Hanging Rock is 145.
What is the Total Male Population of Hanging Rock?
Total Male Population of Hanging Rock is 76.
What is the Total Female Population of Hanging Rock?
Total Female Population of Hanging Rock is 69.
What is the Ratio of Males per 100 Females in Hanging Rock?
There are 110.14 Males per 100 Females in Hanging Rock.
What is the Ratio of Females per 100 Males in Hanging Rock?
There are 90.79 Females per 100 Males in Hanging Rock.
What is the Median Population Age in Hanging Rock?
Median Population Age in Hanging Rock is 60.9 Years.
What is the Average Family Size in Hanging Rock
Average Family Size in Hanging Rock is 2.9 People.
What is the Average Household Size in Hanging Rock
Average Household Size in Hanging Rock is 2.3 People.
How Large is the Labor Force in Hanging Rock?
There are 77 People in the Labor Forcein in Hanging Rock.
What is the Percentage of People in the Labor Force in Hanging Rock?
56.6% of People are in the Labor Force in Hanging Rock.
What is the Unemployment Rate in Hanging Rock?
Unemployment Rate in Hanging Rock is 2.6%.