Lockbourne, OH Map & Demographics
Lockbourne Map
Lockbourne Overview
$17,607
PER CAPITA INCOME
$40,500
AVG FAMILY INCOME
$42,500
AVG HOUSEHOLD INCOME
16.8%
WAGE / INCOME GAP [ % ]
83.2¢/ $1
WAGE / INCOME GAP [ $ ]
0.33
INEQUALITY / GINI INDEX
255
TOTAL POPULATION
129
MALE POPULATION
126
FEMALE POPULATION
102.38
MALES / 100 FEMALES
97.67
FEMALES / 100 MALES
38.1
MEDIAN AGE
3.3
AVG FAMILY SIZE
2.9
AVG HOUSEHOLD SIZE
88
LABOR FORCE [ PEOPLE ]
50.3%
PERCENT IN LABOR FORCE
18.2%
UNEMPLOYMENT RATE
Lockbourne Zip Codes
Lockbourne Area Codes
Income in Lockbourne
Income Overview in Lockbourne
Per Capita Income in Lockbourne is $17,607, while median incomes of families and households are $40,500 and $42,500 respectively.
| Characteristic | Number | Measure |
| Per Capita Income | 255 | $17,607 |
| Median Family Income | 68 | $40,500 |
| Mean Family Income | 68 | $48,191 |
| Median Household Income | 88 | $42,500 |
| Mean Household Income | 88 | $49,809 |
| Income Deficit | 68 | $0 |
| Wage / Income Gap (%) | 255 | 16.81% |
| Wage / Income Gap ($) | 255 | 83.19¢ per $1 |
| Gini / Inequality Index | 255 | 0.33 |
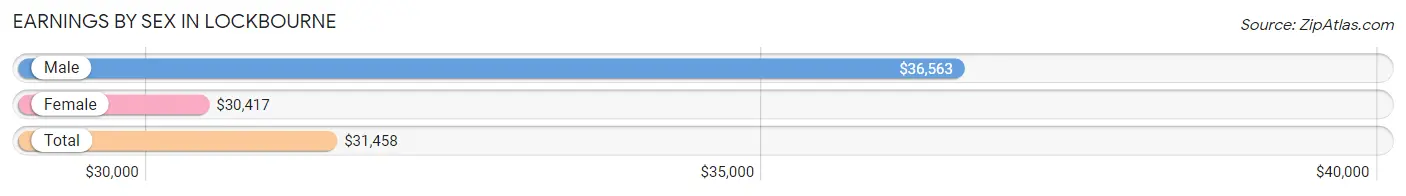
Earnings by Sex in Lockbourne
Average Earnings in Lockbourne are $31,458, $36,563 for men and $30,417 for women, a difference of 16.8%.
| Sex | Number | Average Earnings |
| Male | 47 (56.6%) | $36,563 |
| Female | 36 (43.4%) | $30,417 |
| Total | 83 (100.0%) | $31,458 |
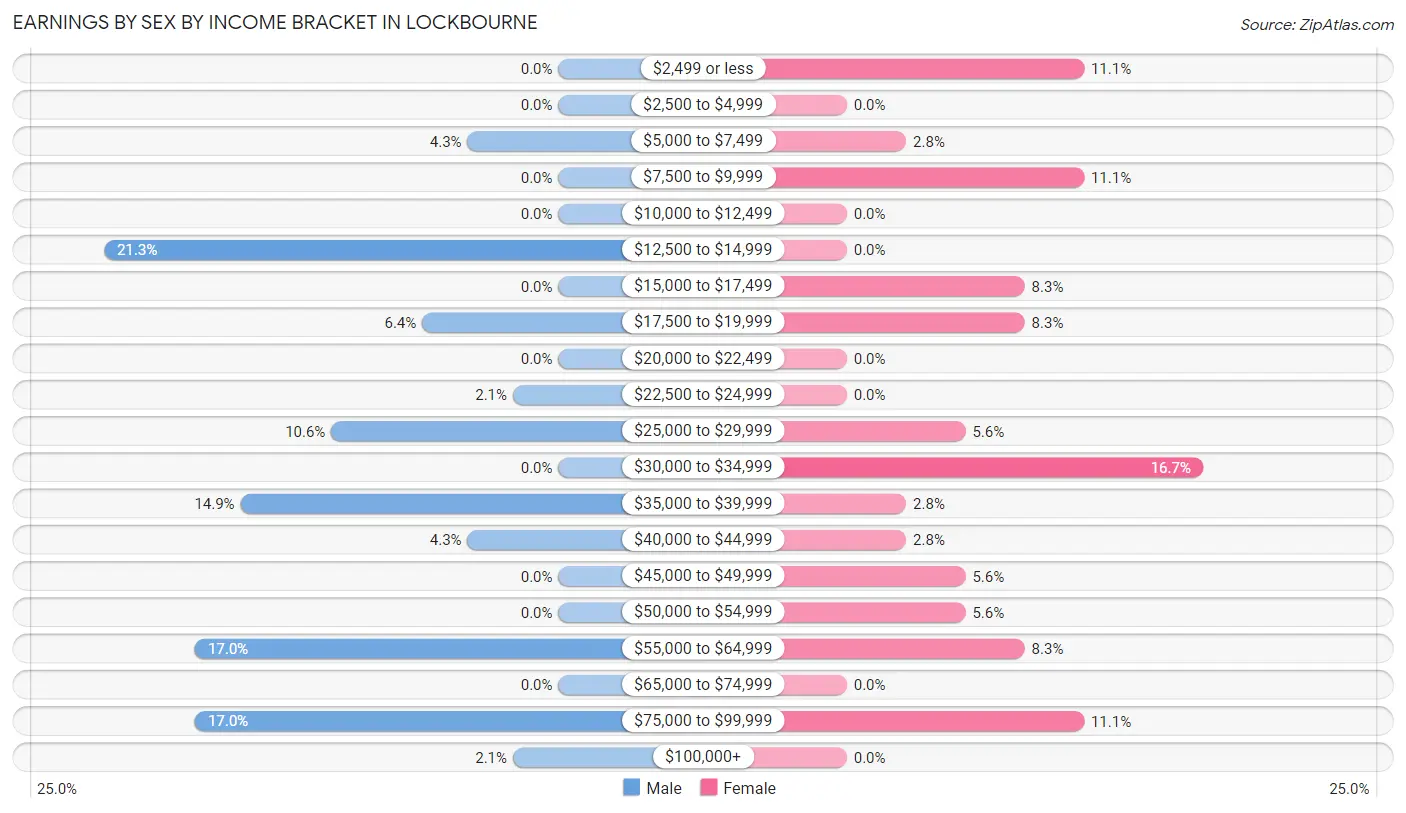
Earnings by Sex by Income Bracket in Lockbourne
The most common earnings brackets in Lockbourne are $12,500 to $14,999 for men (10 | 21.3%) and $30,000 to $34,999 for women (6 | 16.7%).
| Income | Male | Female |
| $2,499 or less | 0 (0.0%) | 4 (11.1%) |
| $2,500 to $4,999 | 0 (0.0%) | 0 (0.0%) |
| $5,000 to $7,499 | 2 (4.3%) | 1 (2.8%) |
| $7,500 to $9,999 | 0 (0.0%) | 4 (11.1%) |
| $10,000 to $12,499 | 0 (0.0%) | 0 (0.0%) |
| $12,500 to $14,999 | 10 (21.3%) | 0 (0.0%) |
| $15,000 to $17,499 | 0 (0.0%) | 3 (8.3%) |
| $17,500 to $19,999 | 3 (6.4%) | 3 (8.3%) |
| $20,000 to $22,499 | 0 (0.0%) | 0 (0.0%) |
| $22,500 to $24,999 | 1 (2.1%) | 0 (0.0%) |
| $25,000 to $29,999 | 5 (10.6%) | 2 (5.6%) |
| $30,000 to $34,999 | 0 (0.0%) | 6 (16.7%) |
| $35,000 to $39,999 | 7 (14.9%) | 1 (2.8%) |
| $40,000 to $44,999 | 2 (4.3%) | 1 (2.8%) |
| $45,000 to $49,999 | 0 (0.0%) | 2 (5.6%) |
| $50,000 to $54,999 | 0 (0.0%) | 2 (5.6%) |
| $55,000 to $64,999 | 8 (17.0%) | 3 (8.3%) |
| $65,000 to $74,999 | 0 (0.0%) | 0 (0.0%) |
| $75,000 to $99,999 | 8 (17.0%) | 4 (11.1%) |
| $100,000+ | 1 (2.1%) | 0 (0.0%) |
| Total | 47 (100.0%) | 36 (100.0%) |
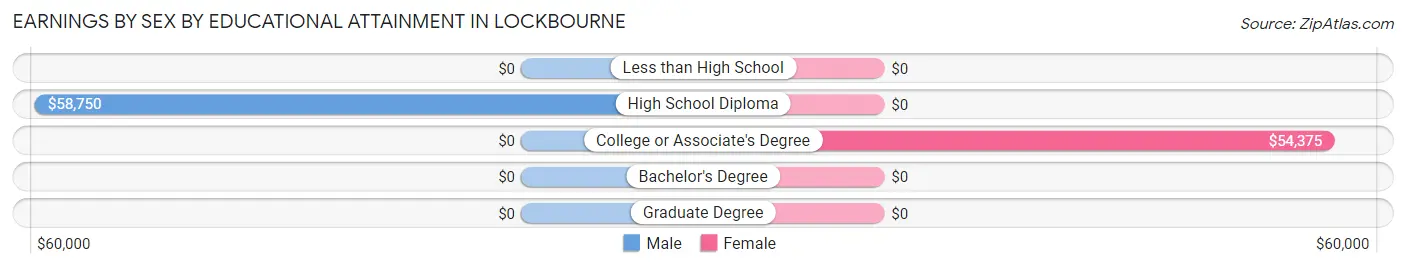
Earnings by Sex by Educational Attainment in Lockbourne
Average earnings in Lockbourne are $37,188 for men and $35,000 for women, a difference of 5.9%. Men with an educational attainment of high school diploma enjoy the highest average annual earnings of $58,750, while those with high school diploma education earn the least with $58,750. Women with an educational attainment of college or associate's degree earn the most with the average annual earnings of $54,375, while those with college or associate's degree education have the smallest earnings of $54,375.
| Educational Attainment | Male Income | Female Income |
| Less than High School | - | - |
| High School Diploma | $58,750 | $0 |
| College or Associate's Degree | - | - |
| Bachelor's Degree | - | - |
| Graduate Degree | - | - |
| Total | $37,188 | $35,000 |
Family Income in Lockbourne
Family Income Brackets in Lockbourne
According to the Lockbourne family income data, there are 19 families falling into the $35,000 to $49,999 income range, which is the most common income bracket and makes up 27.9% of all families.
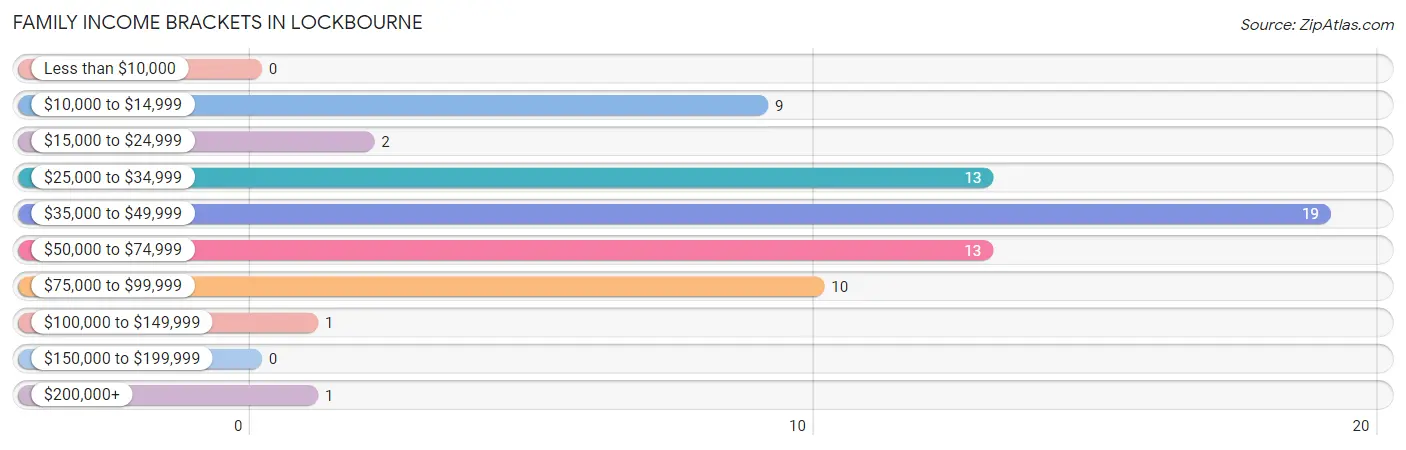
| Income Bracket | # Families | % Families |
| Less than $10,000 | 0 | 0.0% |
| $10,000 to $14,999 | 9 | 13.2% |
| $15,000 to $24,999 | 2 | 2.9% |
| $25,000 to $34,999 | 13 | 19.1% |
| $35,000 to $49,999 | 19 | 27.9% |
| $50,000 to $74,999 | 13 | 19.1% |
| $75,000 to $99,999 | 10 | 14.7% |
| $100,000 to $149,999 | 1 | 1.5% |
| $150,000 to $199,999 | 0 | 0.0% |
| $200,000+ | 1 | 1.5% |
Family Income by Famaliy Size in Lockbourne
3-person families (13 | 19.1%) account for the highest median family income in Lockbourne with $77,813 per family, while 3-person families (13 | 19.1%) have the highest median income of $25,938 per family member.
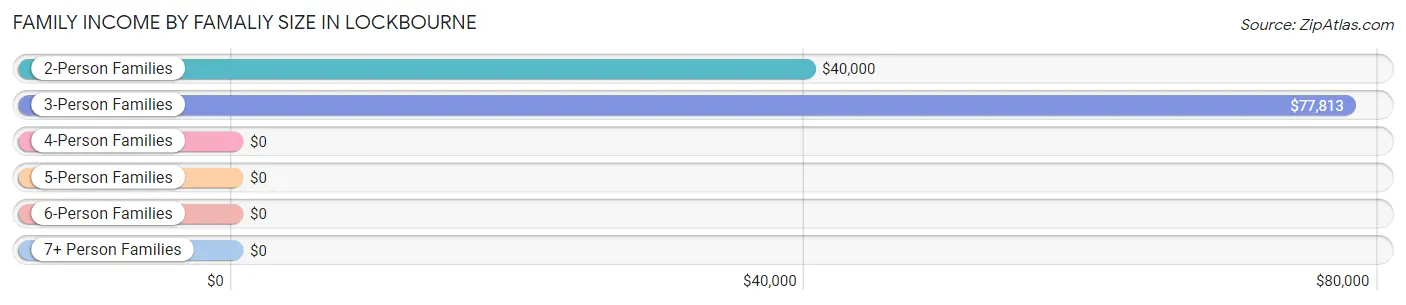
| Income Bracket | # Families | Median Income |
| 2-Person Families | 32 (47.1%) | $40,000 |
| 3-Person Families | 13 (19.1%) | $77,813 |
| 4-Person Families | 14 (20.6%) | $0 |
| 5-Person Families | 6 (8.8%) | $0 |
| 6-Person Families | 0 (0.0%) | $0 |
| 7+ Person Families | 3 (4.4%) | $0 |
| Total | 68 (100.0%) | $40,500 |
Family Income by Number of Earners in Lockbourne
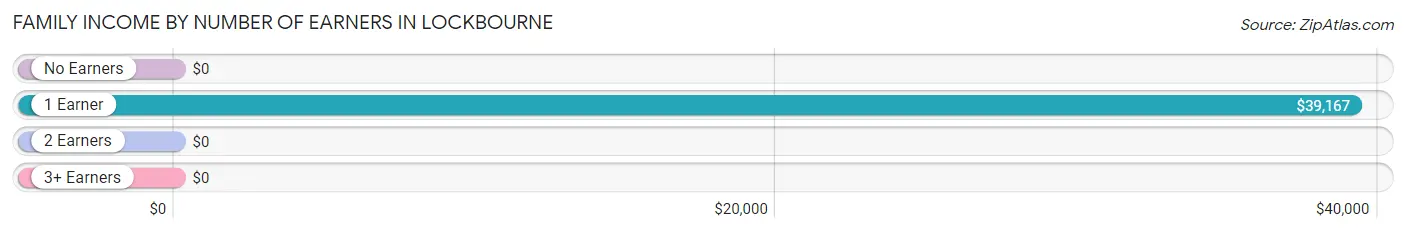
| Number of Earners | # Families | Median Income |
| No Earners | 11 (16.2%) | $0 |
| 1 Earner | 44 (64.7%) | $39,167 |
| 2 Earners | 13 (19.1%) | $0 |
| 3+ Earners | 0 (0.0%) | $0 |
| Total | 68 (100.0%) | $40,500 |
Household Income in Lockbourne
Household Income Brackets in Lockbourne
With 19 households falling in the category, the $50,000 to $74,999 income range is the most frequent in Lockbourne, accounting for 21.6% of all households.
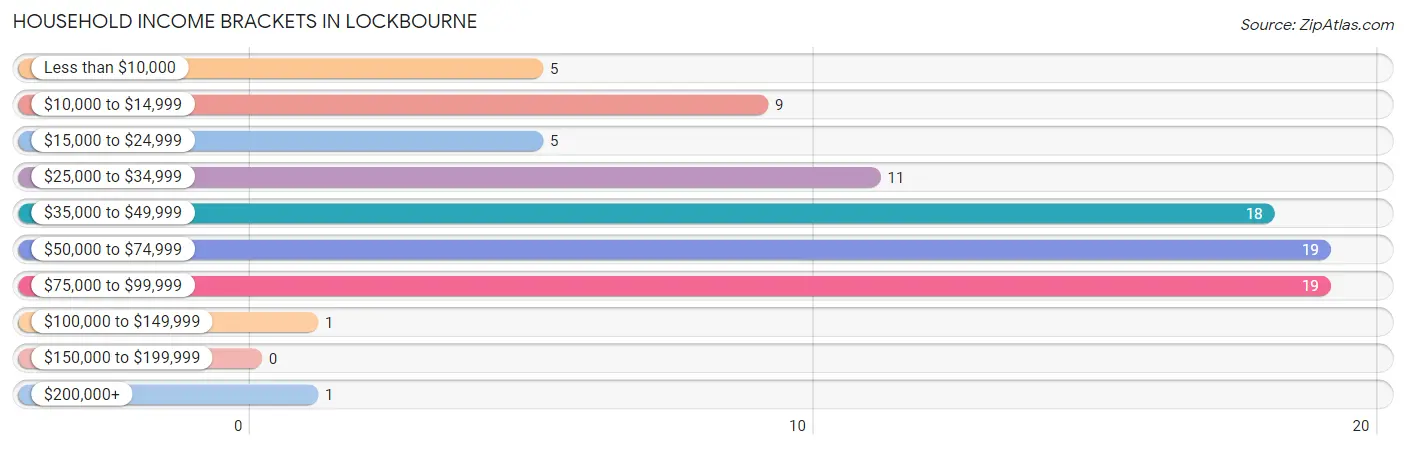
| Income Bracket | # Households | % Households |
| Less than $10,000 | 5 | 5.7% |
| $10,000 to $14,999 | 9 | 10.2% |
| $15,000 to $24,999 | 5 | 5.7% |
| $25,000 to $34,999 | 11 | 12.5% |
| $35,000 to $49,999 | 18 | 20.5% |
| $50,000 to $74,999 | 19 | 21.6% |
| $75,000 to $99,999 | 19 | 21.6% |
| $100,000 to $149,999 | 1 | 1.1% |
| $150,000 to $199,999 | 0 | 0.0% |
| $200,000+ | 1 | 1.1% |
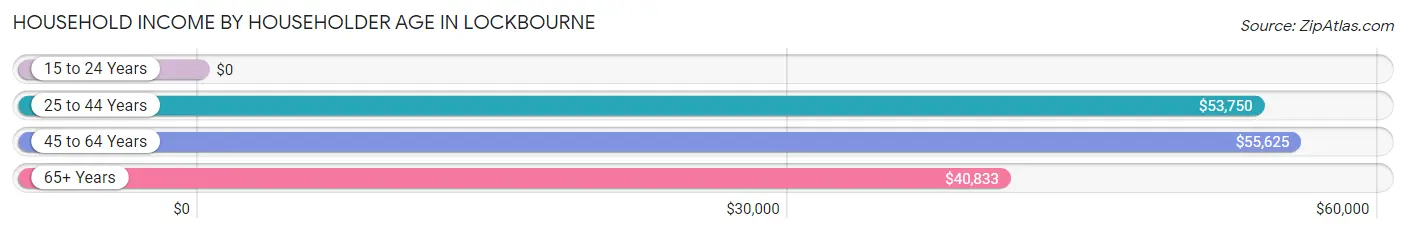
Household Income by Householder Age in Lockbourne
The median household income in Lockbourne is $42,500, with the highest median household income of $55,625 found in the 45 to 64 years age bracket for the primary householder. A total of 47 households (53.4%) fall into this category. Meanwhile, the 15 to 24 years age bracket for the primary householder has the lowest median household income of $0, with 5 households (5.7%) in this group.
| Income Bracket | # Households | Median Income |
| 15 to 24 Years | 5 (5.7%) | $0 |
| 25 to 44 Years | 18 (20.4%) | $53,750 |
| 45 to 64 Years | 47 (53.4%) | $55,625 |
| 65+ Years | 18 (20.4%) | $40,833 |
| Total | 88 (100.0%) | $42,500 |
Poverty in Lockbourne
Income Below Poverty by Sex and Age in Lockbourne
With 30.2% poverty level for males and 26.2% for females among the residents of Lockbourne, under 5 year old males and 5 year old females are the most vulnerable to poverty, with 23 males (76.7%) and 3 females (100.0%) in their respective age groups living below the poverty level.
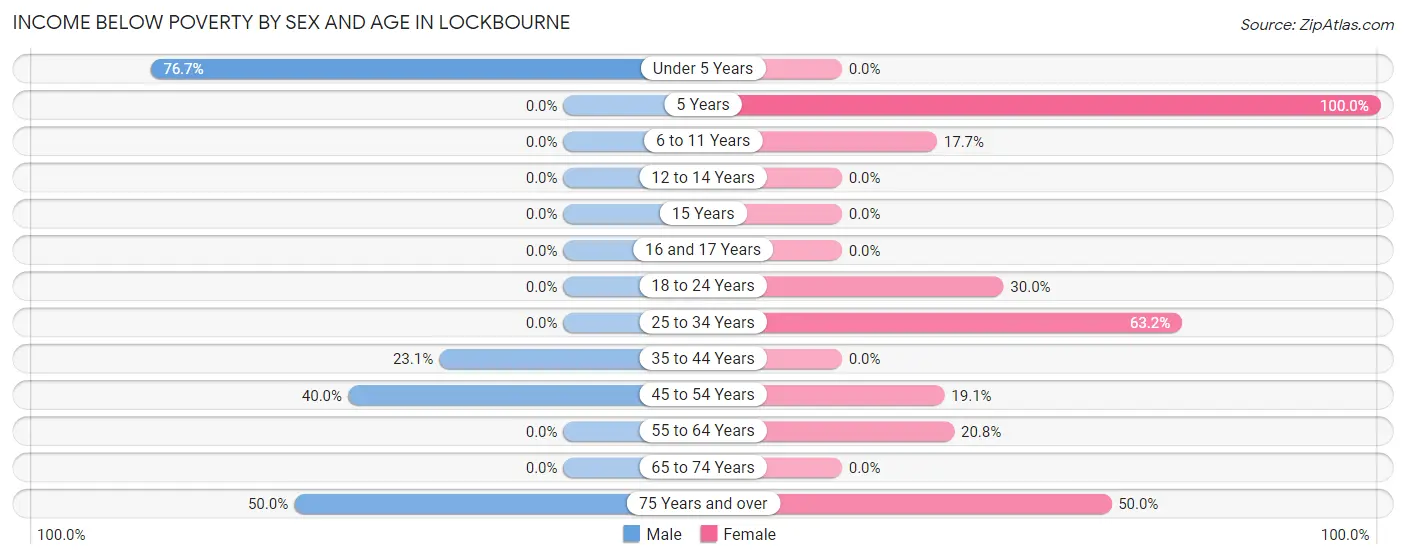
| Age Bracket | Male | Female |
| Under 5 Years | 23 (76.7%) | 0 (0.0%) |
| 5 Years | 0 (0.0%) | 3 (100.0%) |
| 6 to 11 Years | 0 (0.0%) | 3 (17.6%) |
| 12 to 14 Years | 0 (0.0%) | 0 (0.0%) |
| 15 Years | 0 (0.0%) | 0 (0.0%) |
| 16 and 17 Years | 0 (0.0%) | 0 (0.0%) |
| 18 to 24 Years | 0 (0.0%) | 3 (30.0%) |
| 25 to 34 Years | 0 (0.0%) | 12 (63.2%) |
| 35 to 44 Years | 3 (23.1%) | 0 (0.0%) |
| 45 to 54 Years | 12 (40.0%) | 4 (19.1%) |
| 55 to 64 Years | 0 (0.0%) | 5 (20.8%) |
| 65 to 74 Years | 0 (0.0%) | 0 (0.0%) |
| 75 Years and over | 1 (50.0%) | 3 (50.0%) |
| Total | 39 (30.2%) | 33 (26.2%) |
Income Above Poverty by Sex and Age in Lockbourne
According to the poverty statistics in Lockbourne, males aged 6 to 11 years and females aged under 5 years are the age groups that are most secure financially, with 100.0% of males and 100.0% of females in these age groups living above the poverty line.
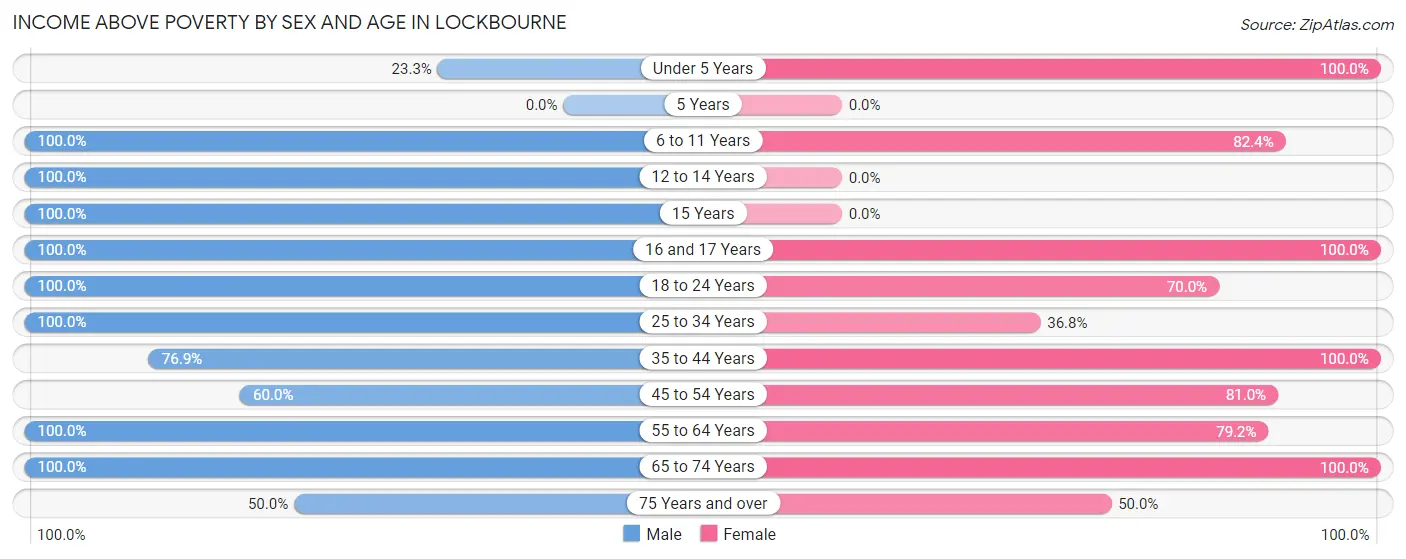
| Age Bracket | Male | Female |
| Under 5 Years | 7 (23.3%) | 15 (100.0%) |
| 5 Years | 0 (0.0%) | 0 (0.0%) |
| 6 to 11 Years | 6 (100.0%) | 14 (82.4%) |
| 12 to 14 Years | 5 (100.0%) | 0 (0.0%) |
| 15 Years | 4 (100.0%) | 0 (0.0%) |
| 16 and 17 Years | 3 (100.0%) | 2 (100.0%) |
| 18 to 24 Years | 2 (100.0%) | 7 (70.0%) |
| 25 to 34 Years | 5 (100.0%) | 7 (36.8%) |
| 35 to 44 Years | 10 (76.9%) | 8 (100.0%) |
| 45 to 54 Years | 18 (60.0%) | 17 (80.9%) |
| 55 to 64 Years | 19 (100.0%) | 19 (79.2%) |
| 65 to 74 Years | 10 (100.0%) | 1 (100.0%) |
| 75 Years and over | 1 (50.0%) | 3 (50.0%) |
| Total | 90 (69.8%) | 93 (73.8%) |
Income Below Poverty Among Married-Couple Families in Lockbourne
The poverty statistics for married-couple families in Lockbourne show that 23.7% or 9 of the total 38 families live below the poverty line. Families with 1 or 2 children have the highest poverty rate of 69.2%, comprising of 9 families. On the other hand, families with no children have the lowest poverty rate of 0.0%, which includes 0 families.

| Children | Above Poverty | Below Poverty |
| No Children | 21 (100.0%) | 0 (0.0%) |
| 1 or 2 Children | 4 (30.8%) | 9 (69.2%) |
| 3 or 4 Children | 3 (100.0%) | 0 (0.0%) |
| 5 or more Children | 1 (100.0%) | 0 (0.0%) |
| Total | 29 (76.3%) | 9 (23.7%) |
Income Below Poverty Among Single-Parent Households in Lockbourne
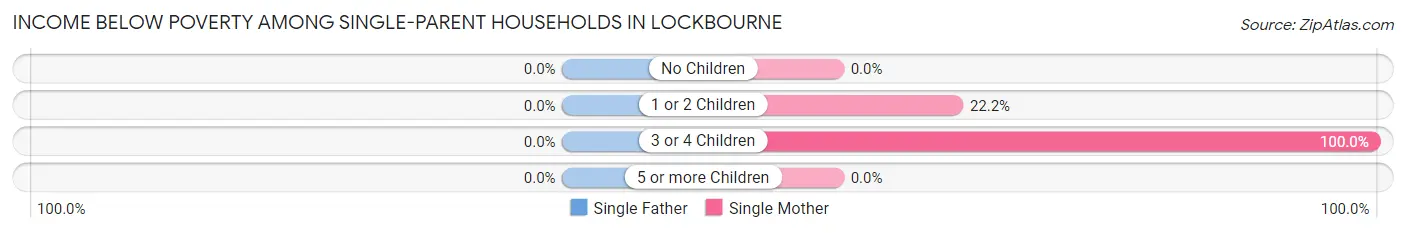
| Children | Single Father | Single Mother |
| No Children | 0 (0.0%) | 0 (0.0%) |
| 1 or 2 Children | 0 (0.0%) | 2 (22.2%) |
| 3 or 4 Children | 0 (0.0%) | 2 (100.0%) |
| 5 or more Children | 0 (0.0%) | 0 (0.0%) |
| Total | 0 (0.0%) | 4 (16.7%) |
Income Below Poverty Among Married-Couple vs Single-Parent Households in Lockbourne
The poverty data for Lockbourne shows that 9 of the married-couple family households (23.7%) and 4 of the single-parent households (13.3%) are living below the poverty level. Within the married-couple family households, those with 1 or 2 children have the highest poverty rate, with 9 households (69.2%) falling below the poverty line. Among the single-parent households, those with 3 or 4 children have the highest poverty rate, with 2 household (33.3%) living below poverty.
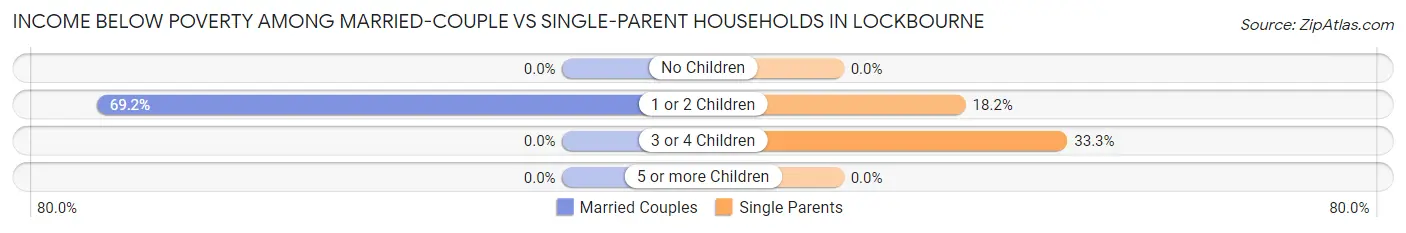
| Children | Married-Couple Families | Single-Parent Households |
| No Children | 0 (0.0%) | 0 (0.0%) |
| 1 or 2 Children | 9 (69.2%) | 2 (18.2%) |
| 3 or 4 Children | 0 (0.0%) | 2 (33.3%) |
| 5 or more Children | 0 (0.0%) | 0 (0.0%) |
| Total | 9 (23.7%) | 4 (13.3%) |
Race in Lockbourne
The most populous races in Lockbourne are White / Caucasian (241 | 94.5%), Two or more Races (14 | 5.5%), and Hispanic or Latino (2 | 0.8%).
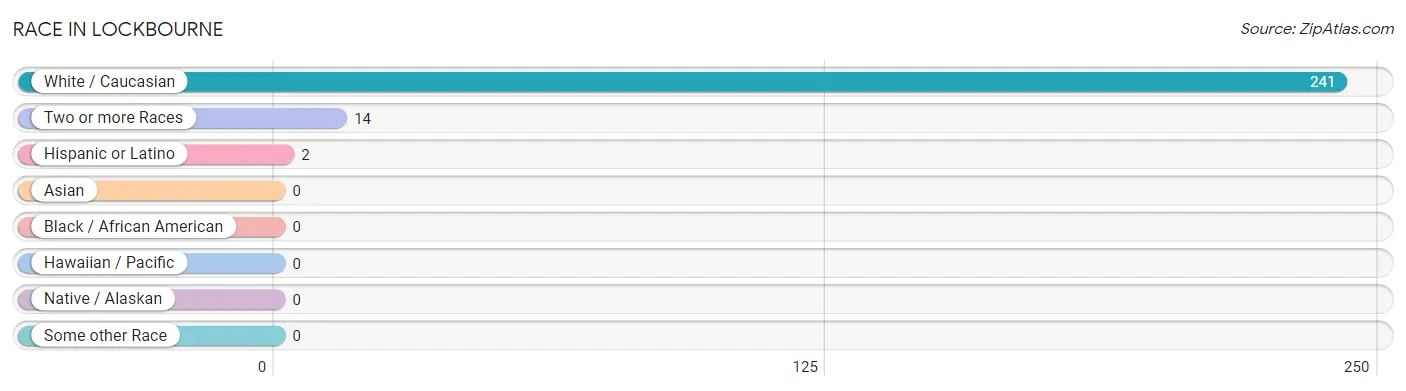
| Race | # Population | % Population |
| Asian | 0 | 0.0% |
| Black / African American | 0 | 0.0% |
| Hawaiian / Pacific | 0 | 0.0% |
| Hispanic or Latino | 2 | 0.8% |
| Native / Alaskan | 0 | 0.0% |
| White / Caucasian | 241 | 94.5% |
| Two or more Races | 14 | 5.5% |
| Some other Race | 0 | 0.0% |
| Total | 255 | 100.0% |
Ancestry in Lockbourne
The most populous ancestries reported in Lockbourne are German (73 | 28.6%), Irish (68 | 26.7%), American (43 | 16.9%), Scottish (12 | 4.7%), and English (11 | 4.3%), together accounting for 81.2% of all Lockbourne residents.
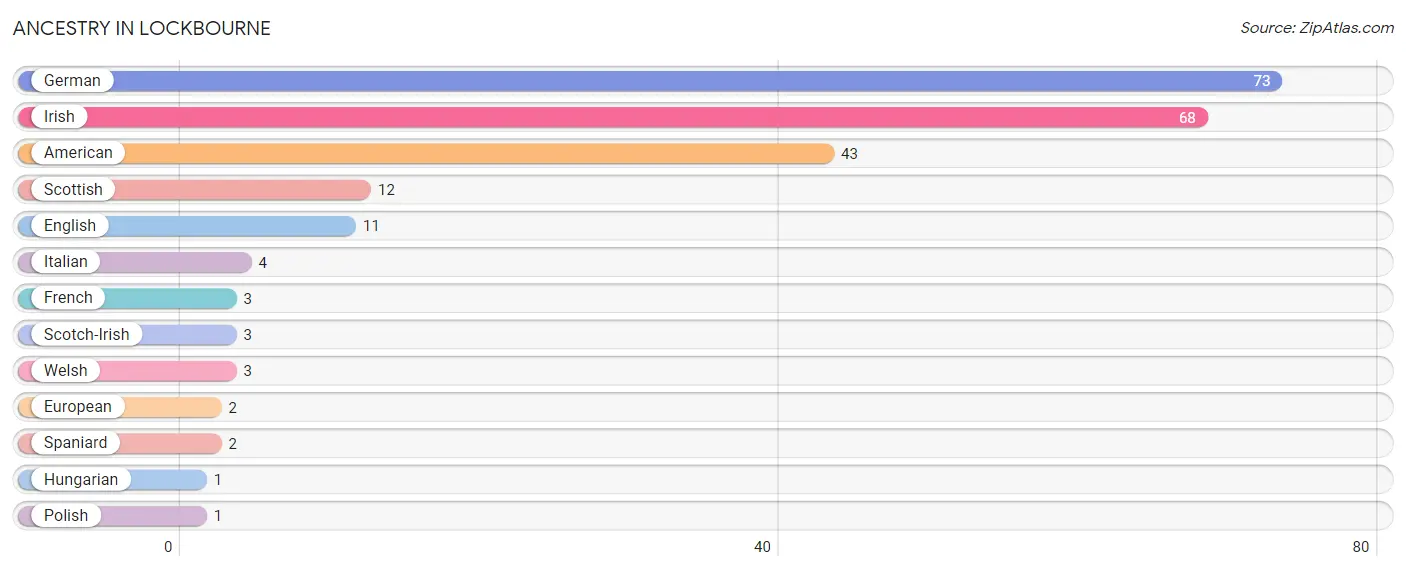
| Ancestry | # Population | % Population |
| American | 43 | 16.9% |
| English | 11 | 4.3% |
| European | 2 | 0.8% |
| French | 3 | 1.2% |
| German | 73 | 28.6% |
| Hungarian | 1 | 0.4% |
| Irish | 68 | 26.7% |
| Italian | 4 | 1.6% |
| Polish | 1 | 0.4% |
| Scotch-Irish | 3 | 1.2% |
| Scottish | 12 | 4.7% |
| Spaniard | 2 | 0.8% |
| Welsh | 3 | 1.2% | View All 13 Rows |
Immigrants in Lockbourne

| Immigration Origin | # Population | % Population | View All 0 Rows |
Sex and Age in Lockbourne
Sex and Age in Lockbourne
The most populous age groups in Lockbourne are Under 5 Years (30 | 23.3%) for men and 60 to 64 Years (19 | 15.1%) for women.
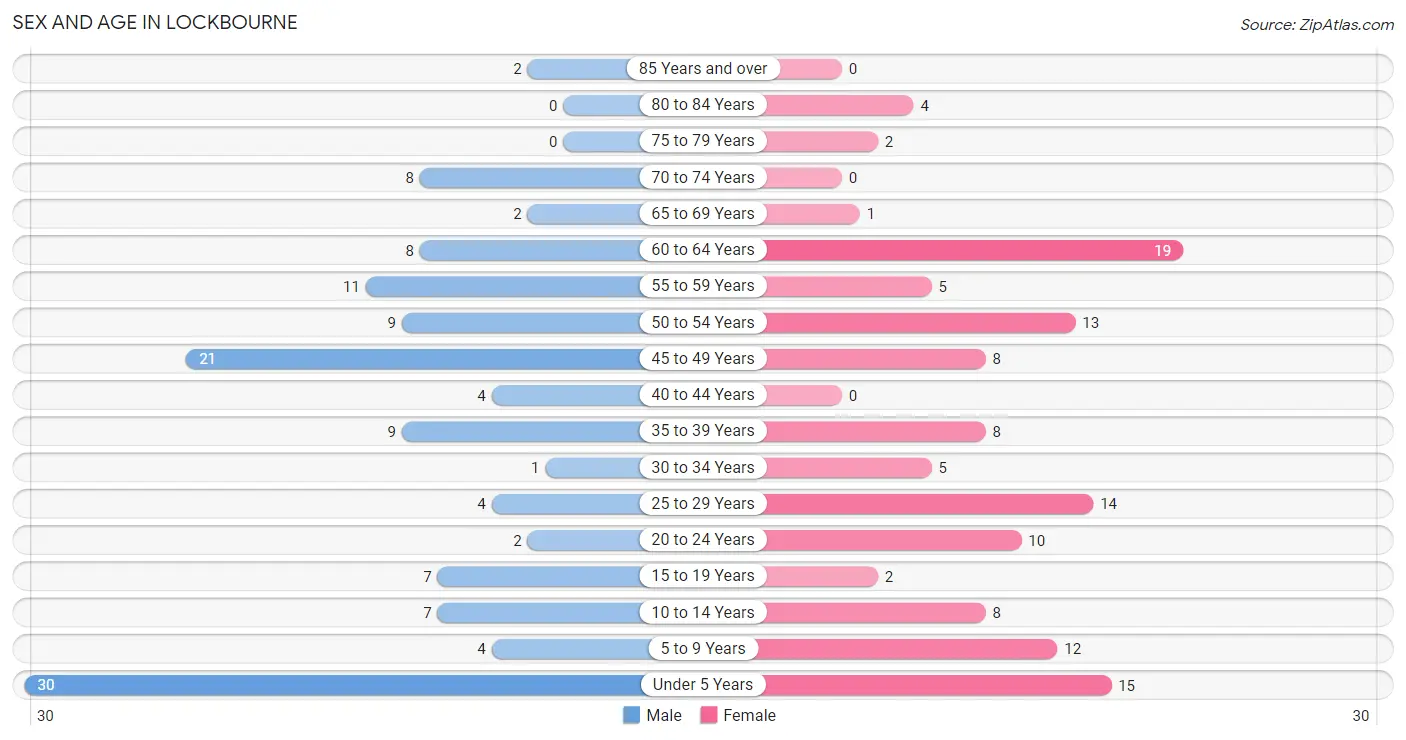
| Age Bracket | Male | Female |
| Under 5 Years | 30 (23.3%) | 15 (11.9%) |
| 5 to 9 Years | 4 (3.1%) | 12 (9.5%) |
| 10 to 14 Years | 7 (5.4%) | 8 (6.4%) |
| 15 to 19 Years | 7 (5.4%) | 2 (1.6%) |
| 20 to 24 Years | 2 (1.5%) | 10 (7.9%) |
| 25 to 29 Years | 4 (3.1%) | 14 (11.1%) |
| 30 to 34 Years | 1 (0.8%) | 5 (4.0%) |
| 35 to 39 Years | 9 (7.0%) | 8 (6.4%) |
| 40 to 44 Years | 4 (3.1%) | 0 (0.0%) |
| 45 to 49 Years | 21 (16.3%) | 8 (6.4%) |
| 50 to 54 Years | 9 (7.0%) | 13 (10.3%) |
| 55 to 59 Years | 11 (8.5%) | 5 (4.0%) |
| 60 to 64 Years | 8 (6.2%) | 19 (15.1%) |
| 65 to 69 Years | 2 (1.5%) | 1 (0.8%) |
| 70 to 74 Years | 8 (6.2%) | 0 (0.0%) |
| 75 to 79 Years | 0 (0.0%) | 2 (1.6%) |
| 80 to 84 Years | 0 (0.0%) | 4 (3.2%) |
| 85 Years and over | 2 (1.5%) | 0 (0.0%) |
| Total | 129 (100.0%) | 126 (100.0%) |
Families and Households in Lockbourne
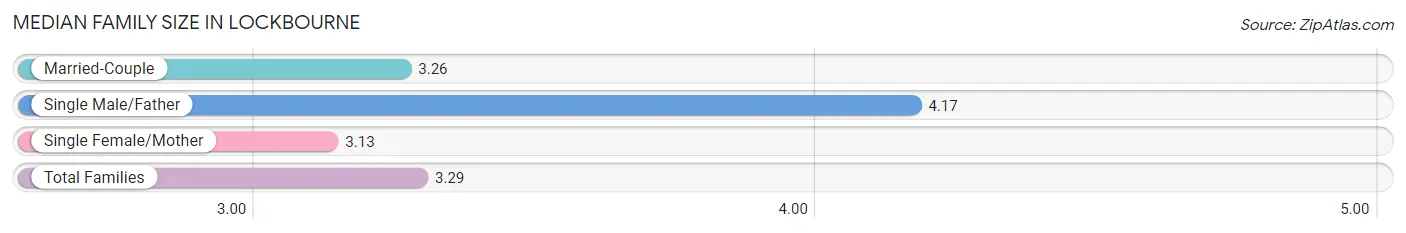
Median Family Size in Lockbourne
The median family size in Lockbourne is 3.29 persons per family, with single male/father families (6 | 8.8%) accounting for the largest median family size of 4.17 persons per family. On the other hand, single female/mother families (24 | 35.3%) represent the smallest median family size with 3.13 persons per family.
| Family Type | # Families | Family Size |
| Married-Couple | 38 (55.9%) | 3.26 |
| Single Male/Father | 6 (8.8%) | 4.17 |
| Single Female/Mother | 24 (35.3%) | 3.13 |
| Total Families | 68 (100.0%) | 3.29 |
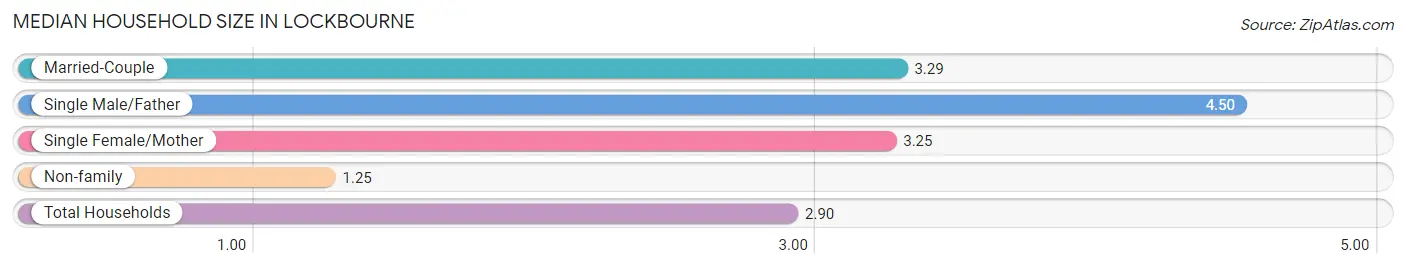
Median Household Size in Lockbourne
The median household size in Lockbourne is 2.90 persons per household, with single male/father households (6 | 6.8%) accounting for the largest median household size of 4.5 persons per household. non-family households (20 | 22.7%) represent the smallest median household size with 1.25 persons per household.
| Household Type | # Households | Household Size |
| Married-Couple | 38 (43.2%) | 3.29 |
| Single Male/Father | 6 (6.8%) | 4.50 |
| Single Female/Mother | 24 (27.3%) | 3.25 |
| Non-family | 20 (22.7%) | 1.25 |
| Total Households | 88 (100.0%) | 2.90 |
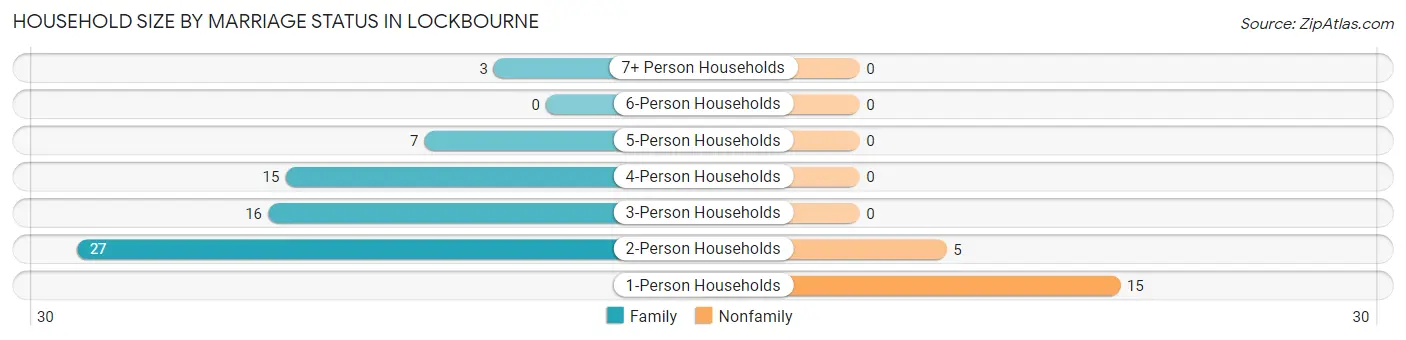
Household Size by Marriage Status in Lockbourne
Out of a total of 88 households in Lockbourne, 68 (77.3%) are family households, while 20 (22.7%) are nonfamily households. The most numerous type of family households are 2-person households, comprising 27, and the most common type of nonfamily households are 1-person households, comprising 15.
| Household Size | Family Households | Nonfamily Households |
| 1-Person Households | - | 15 (17.1%) |
| 2-Person Households | 27 (30.7%) | 5 (5.7%) |
| 3-Person Households | 16 (18.2%) | 0 (0.0%) |
| 4-Person Households | 15 (17.1%) | 0 (0.0%) |
| 5-Person Households | 7 (8.0%) | 0 (0.0%) |
| 6-Person Households | 0 (0.0%) | 0 (0.0%) |
| 7+ Person Households | 3 (3.4%) | 0 (0.0%) |
| Total | 68 (77.3%) | 20 (22.7%) |
Female Fertility in Lockbourne
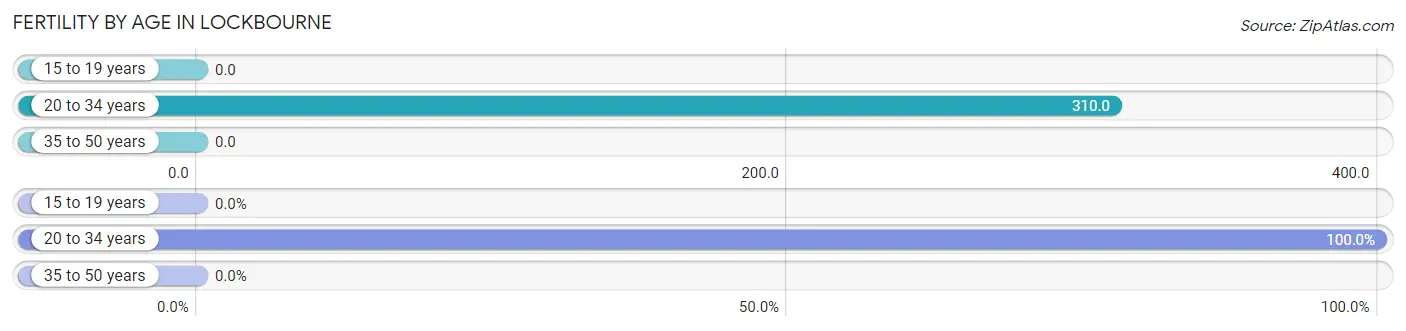
Fertility by Age in Lockbourne
Average fertility rate in Lockbourne is 188.0 births per 1,000 women. Women in the age bracket of 20 to 34 years have the highest fertility rate with 310.0 births per 1,000 women. Women in the age bracket of 20 to 34 years acount for 100.0% of all women with births.
| Age Bracket | Women with Births | Births / 1,000 Women |
| 15 to 19 years | 0 (0.0%) | 0.0 |
| 20 to 34 years | 9 (100.0%) | 310.0 |
| 35 to 50 years | 0 (0.0%) | 0.0 |
| Total | 9 (100.0%) | 188.0 |
Fertility by Age by Marriage Status in Lockbourne
22.2% of women with births (9) in Lockbourne are married. The highest percentage of unmarried women with births falls into 20 to 34 years age bracket with 77.8% of them unmarried at the time of birth, while the lowest percentage of unmarried women with births belong to 20 to 34 years age bracket with 77.8% of them unmarried.
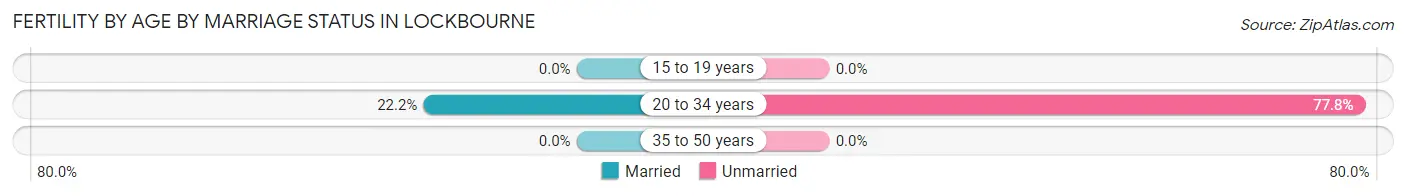
| Age Bracket | Married | Unmarried |
| 15 to 19 years | 0 (0.0%) | 0 (0.0%) |
| 20 to 34 years | 2 (22.2%) | 7 (77.8%) |
| 35 to 50 years | 0 (0.0%) | 0 (0.0%) |
| Total | 2 (22.2%) | 7 (77.8%) |
Fertility by Education in Lockbourne
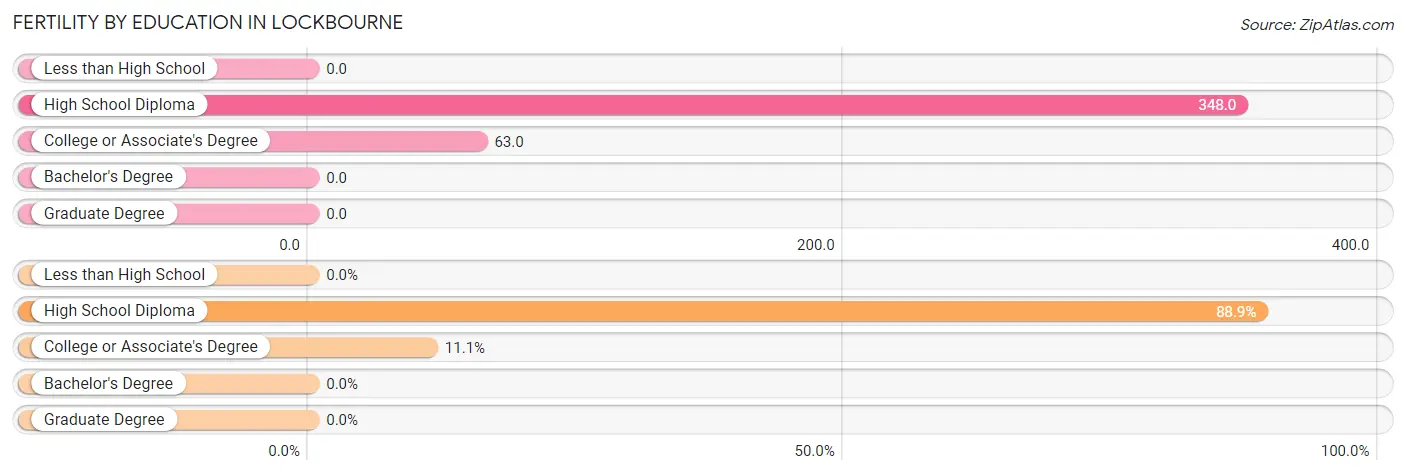
| Educational Attainment | Women with Births | Births / 1,000 Women |
| Less than High School | 0 (0.0%) | 0.0 |
| High School Diploma | 8 (88.9%) | 348.0 |
| College or Associate's Degree | 1 (11.1%) | 63.0 |
| Bachelor's Degree | 0 (0.0%) | 0.0 |
| Graduate Degree | 0 (0.0%) | 0.0 |
| Total | 9 (100.0%) | 188.0 |
Fertility by Education by Marriage Status in Lockbourne
77.8% of women with births in Lockbourne are unmarried. Women with the educational attainment of high school diploma are most likely to be married with 25.0% of them married at childbirth, while women with the educational attainment of college or associate's degree are least likely to be married with 100.0% of them unmarried at childbirth.
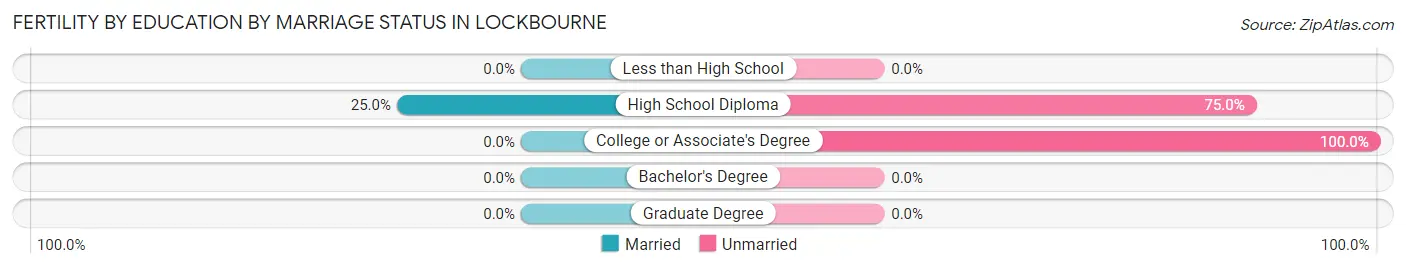
| Educational Attainment | Married | Unmarried |
| Less than High School | 0 (0.0%) | 0 (0.0%) |
| High School Diploma | 2 (25.0%) | 6 (75.0%) |
| College or Associate's Degree | 0 (0.0%) | 1 (100.0%) |
| Bachelor's Degree | 0 (0.0%) | 0 (0.0%) |
| Graduate Degree | 0 (0.0%) | 0 (0.0%) |
| Total | 2 (22.2%) | 7 (77.8%) |
Employment Characteristics in Lockbourne
Employment by Class of Employer in Lockbourne
Among the 72 employed individuals in Lockbourne, private company employees (45 | 62.5%), self-employed (incorporated) (6 | 8.3%), and self-employed (not incorporated) (5 | 6.9%) make up the most common classes of employment.
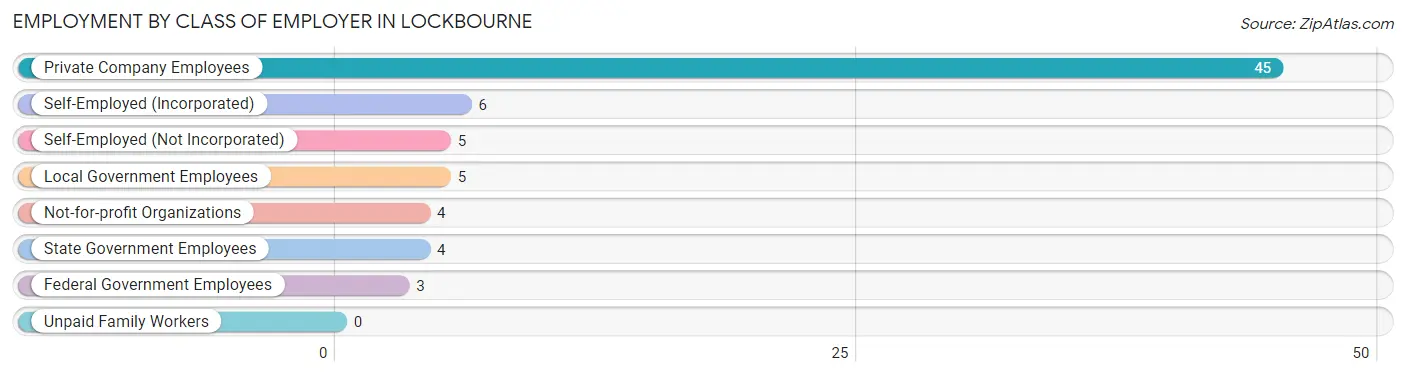
| Employer Class | # Employees | % Employees |
| Private Company Employees | 45 | 62.5% |
| Self-Employed (Incorporated) | 6 | 8.3% |
| Self-Employed (Not Incorporated) | 5 | 6.9% |
| Not-for-profit Organizations | 4 | 5.6% |
| Local Government Employees | 5 | 6.9% |
| State Government Employees | 4 | 5.6% |
| Federal Government Employees | 3 | 4.2% |
| Unpaid Family Workers | 0 | 0.0% |
| Total | 72 | 100.0% |
Employment Status by Age in Lockbourne
According to the labor force statistics for Lockbourne, out of the total population over 16 years of age (175), 50.3% or 88 individuals are in the labor force, with 18.2% or 16 of them unemployed. The age group with the highest labor force participation rate is 20 to 24 years, with 66.7% or 8 individuals in the labor force. Within the labor force, the 30 to 34 years age range has the highest percentage of unemployed individuals, with 75.0% or 3 of them being unemployed.
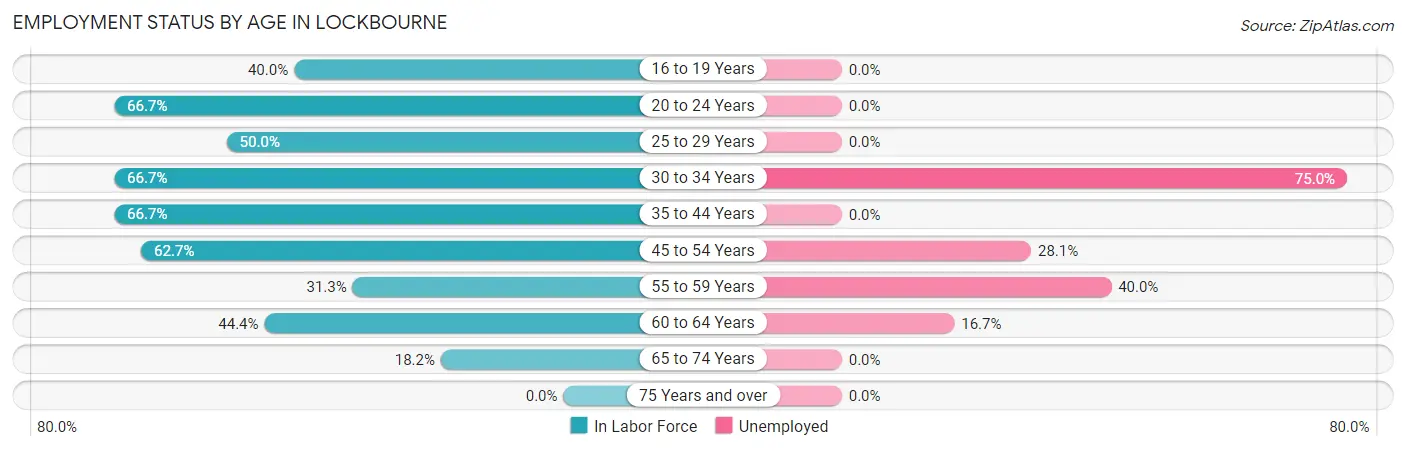
| Age Bracket | In Labor Force | Unemployed |
| 16 to 19 Years | 2 (40.0%) | 0 (0.0%) |
| 20 to 24 Years | 8 (66.7%) | 0 (0.0%) |
| 25 to 29 Years | 9 (50.0%) | 0 (0.0%) |
| 30 to 34 Years | 4 (66.7%) | 3 (75.0%) |
| 35 to 44 Years | 14 (66.7%) | 0 (0.0%) |
| 45 to 54 Years | 32 (62.7%) | 9 (28.1%) |
| 55 to 59 Years | 5 (31.3%) | 2 (40.0%) |
| 60 to 64 Years | 12 (44.4%) | 2 (16.7%) |
| 65 to 74 Years | 2 (18.2%) | 0 (0.0%) |
| 75 Years and over | 0 (0.0%) | 0 (0.0%) |
| Total | 88 (50.3%) | 16 (18.2%) |
Employment Status by Educational Attainment in Lockbourne
According to labor force statistics for Lockbourne, 54.7% of individuals (76) out of the total population between 25 and 64 years of age (139) are in the labor force, with 21.1% or 16 of them being unemployed. The group with the highest labor force participation rate are those with the educational attainment of bachelor's degree or higher, with 100.0% or 9 individuals in the labor force. Within the labor force, individuals with less than high school education have the highest percentage of unemployment, with 32.1% or 9 of them being unemployed.
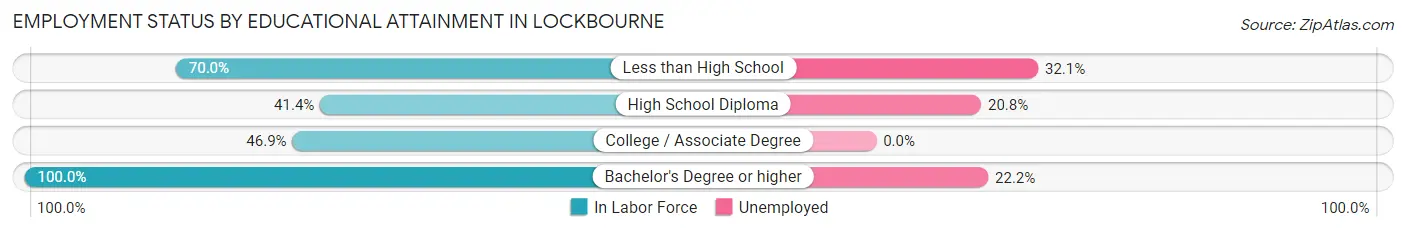
| Educational Attainment | In Labor Force | Unemployed |
| Less than High School | 28 (70.0%) | 13 (32.1%) |
| High School Diploma | 24 (41.4%) | 12 (20.8%) |
| College / Associate Degree | 15 (46.9%) | 0 (0.0%) |
| Bachelor's Degree or higher | 9 (100.0%) | 2 (22.2%) |
| Total | 76 (54.7%) | 29 (21.1%) |
Employment Occupations by Sex in Lockbourne
Management, Business, Science and Arts Occupations
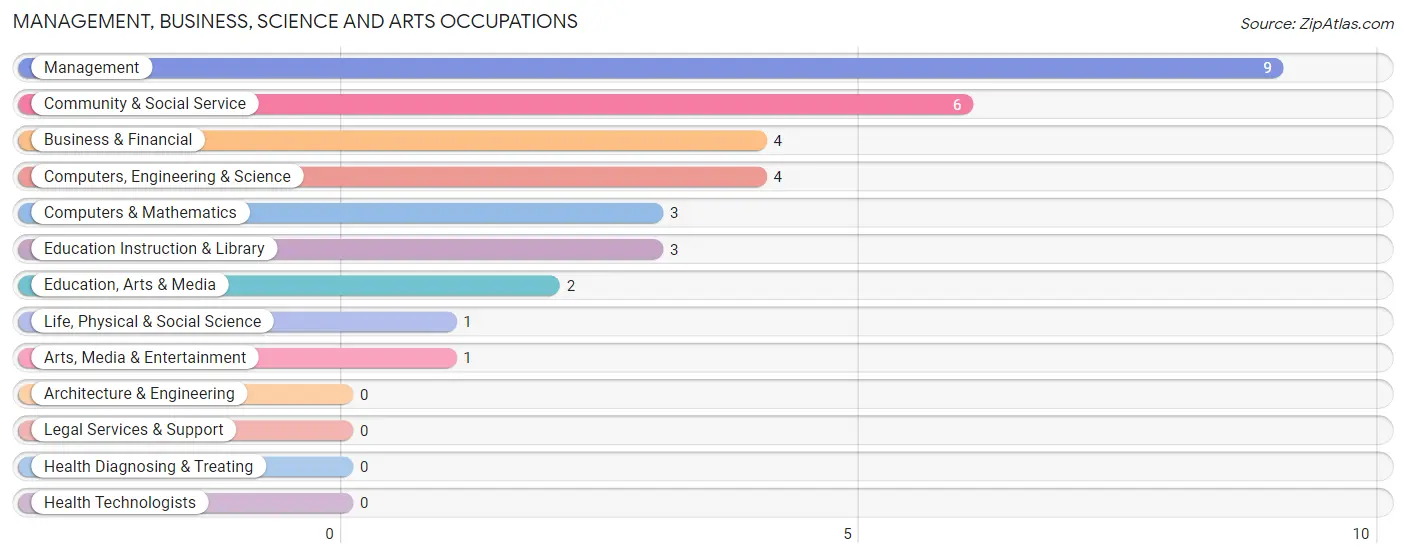
The most common Management, Business, Science and Arts occupations in Lockbourne are Management (9 | 12.5%), Community & Social Service (6 | 8.3%), Business & Financial (4 | 5.6%), Computers, Engineering & Science (4 | 5.6%), and Computers & Mathematics (3 | 4.2%).
Management, Business, Science and Arts Occupations by Sex
Within the Management, Business, Science and Arts occupations in Lockbourne, the most male-oriented occupations are Computers & Mathematics (100.0%), Education, Arts & Media (100.0%), and Arts, Media & Entertainment (100.0%), while the most female-oriented occupations are Business & Financial (100.0%), Life, Physical & Social Science (100.0%), and Education Instruction & Library (100.0%).
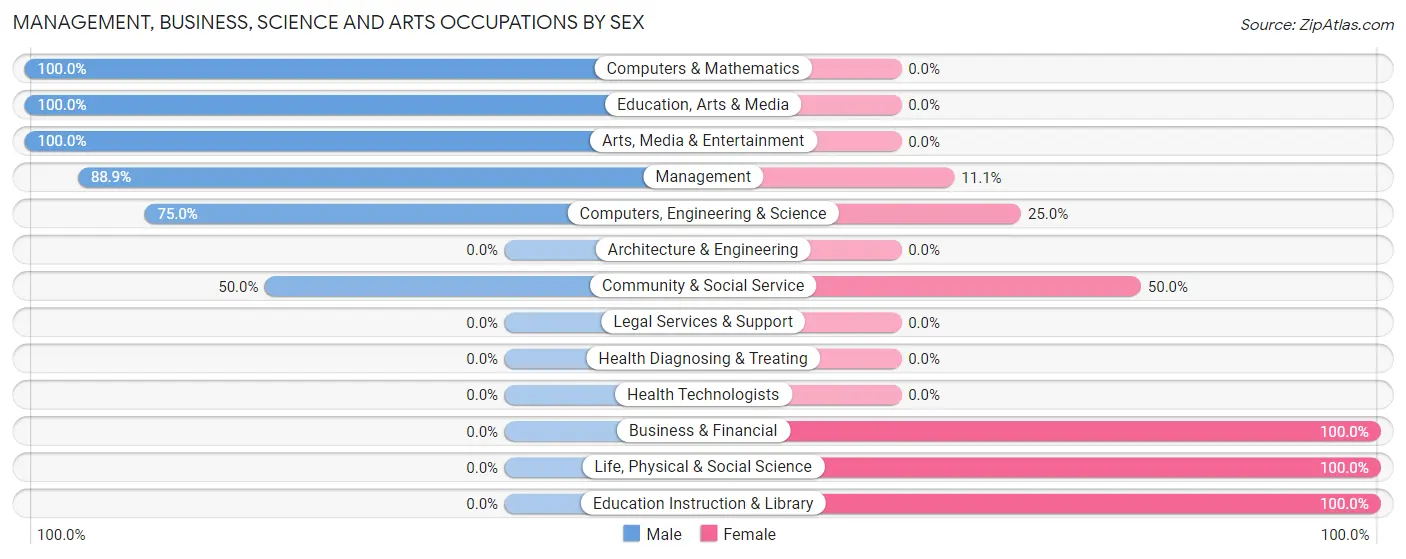
| Occupation | Male | Female |
| Management | 8 (88.9%) | 1 (11.1%) |
| Business & Financial | 0 (0.0%) | 4 (100.0%) |
| Computers, Engineering & Science | 3 (75.0%) | 1 (25.0%) |
| Computers & Mathematics | 3 (100.0%) | 0 (0.0%) |
| Architecture & Engineering | 0 (0.0%) | 0 (0.0%) |
| Life, Physical & Social Science | 0 (0.0%) | 1 (100.0%) |
| Community & Social Service | 3 (50.0%) | 3 (50.0%) |
| Education, Arts & Media | 2 (100.0%) | 0 (0.0%) |
| Legal Services & Support | 0 (0.0%) | 0 (0.0%) |
| Education Instruction & Library | 0 (0.0%) | 3 (100.0%) |
| Arts, Media & Entertainment | 1 (100.0%) | 0 (0.0%) |
| Health Diagnosing & Treating | 0 (0.0%) | 0 (0.0%) |
| Health Technologists | 0 (0.0%) | 0 (0.0%) |
| Total (Category) | 14 (60.9%) | 9 (39.1%) |
| Total (Overall) | 38 (52.8%) | 34 (47.2%) |
Services Occupations
The most common Services occupations in Lockbourne are Healthcare Support (5 | 6.9%), Food Preparation & Serving (4 | 5.6%), Cleaning & Maintenance (4 | 5.6%), and Personal Care & Service (1 | 1.4%).
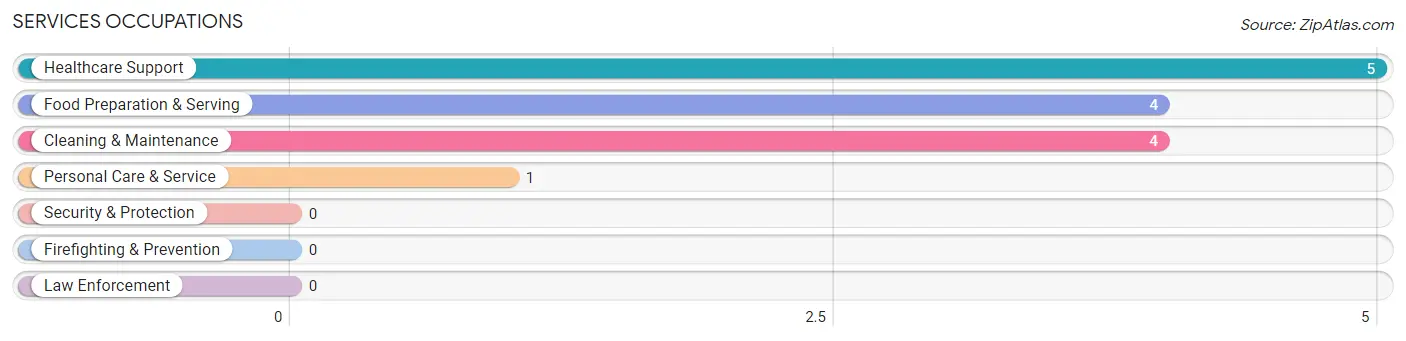
Services Occupations by Sex
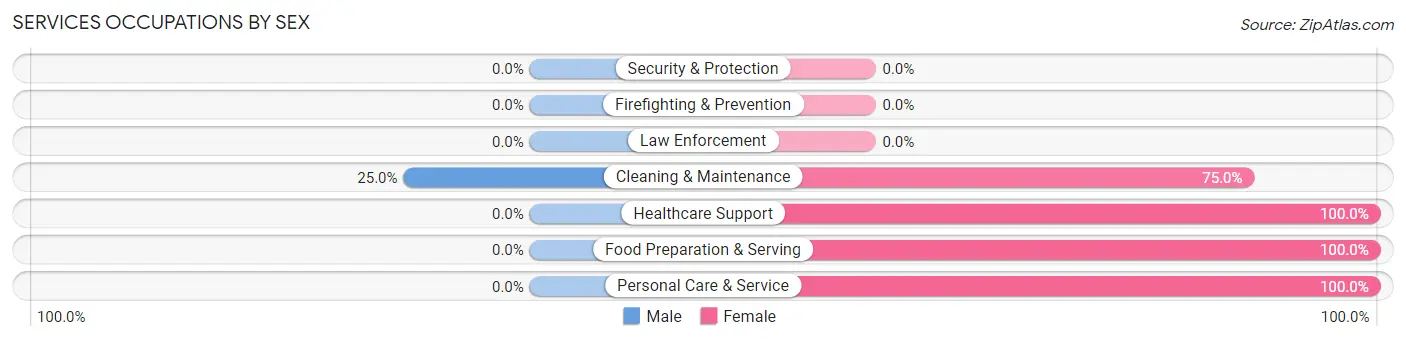
| Occupation | Male | Female |
| Healthcare Support | 0 (0.0%) | 5 (100.0%) |
| Security & Protection | 0 (0.0%) | 0 (0.0%) |
| Firefighting & Prevention | 0 (0.0%) | 0 (0.0%) |
| Law Enforcement | 0 (0.0%) | 0 (0.0%) |
| Food Preparation & Serving | 0 (0.0%) | 4 (100.0%) |
| Cleaning & Maintenance | 1 (25.0%) | 3 (75.0%) |
| Personal Care & Service | 0 (0.0%) | 1 (100.0%) |
| Total (Category) | 1 (7.1%) | 13 (92.9%) |
| Total (Overall) | 38 (52.8%) | 34 (47.2%) |
Sales and Office Occupations
The most common Sales and Office occupations in Lockbourne are Office & Administration (9 | 12.5%), and Sales & Related (1 | 1.4%).
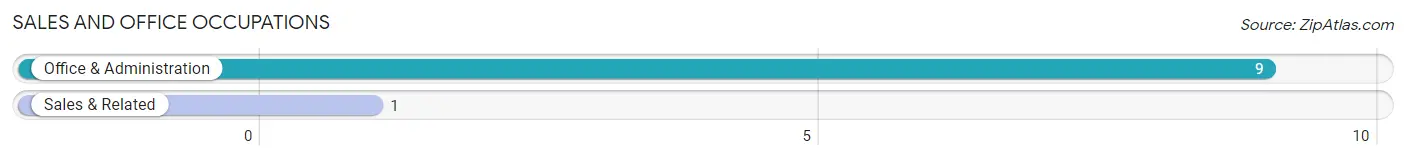
Sales and Office Occupations by Sex
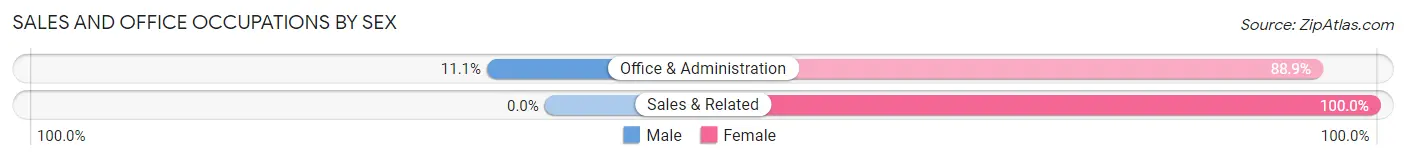
| Occupation | Male | Female |
| Sales & Related | 0 (0.0%) | 1 (100.0%) |
| Office & Administration | 1 (11.1%) | 8 (88.9%) |
| Total (Category) | 1 (10.0%) | 9 (90.0%) |
| Total (Overall) | 38 (52.8%) | 34 (47.2%) |
Natural Resources, Construction and Maintenance Occupations
The most common Natural Resources, Construction and Maintenance occupations in Lockbourne are Installation, Maintenance & Repair (4 | 5.6%), and Construction & Extraction (3 | 4.2%).
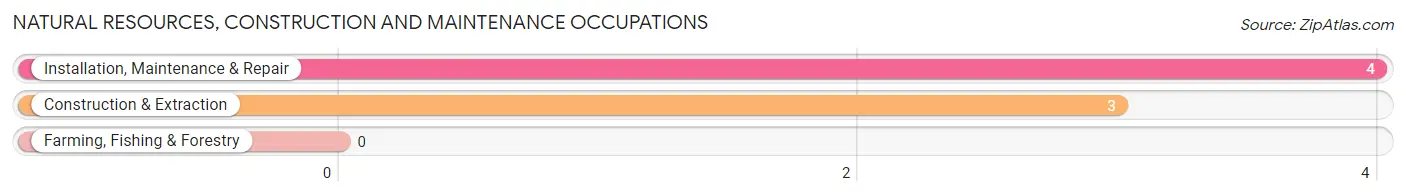
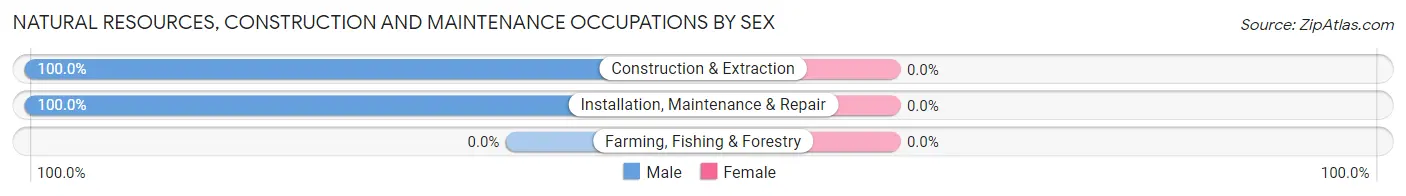
Natural Resources, Construction and Maintenance Occupations by Sex
| Occupation | Male | Female |
| Farming, Fishing & Forestry | 0 (0.0%) | 0 (0.0%) |
| Construction & Extraction | 3 (100.0%) | 0 (0.0%) |
| Installation, Maintenance & Repair | 4 (100.0%) | 0 (0.0%) |
| Total (Category) | 7 (100.0%) | 0 (0.0%) |
| Total (Overall) | 38 (52.8%) | 34 (47.2%) |
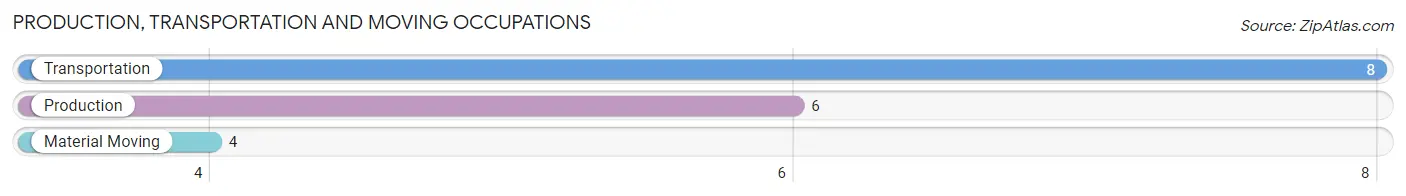
Production, Transportation and Moving Occupations
The most common Production, Transportation and Moving occupations in Lockbourne are Transportation (8 | 11.1%), Production (6 | 8.3%), and Material Moving (4 | 5.6%).
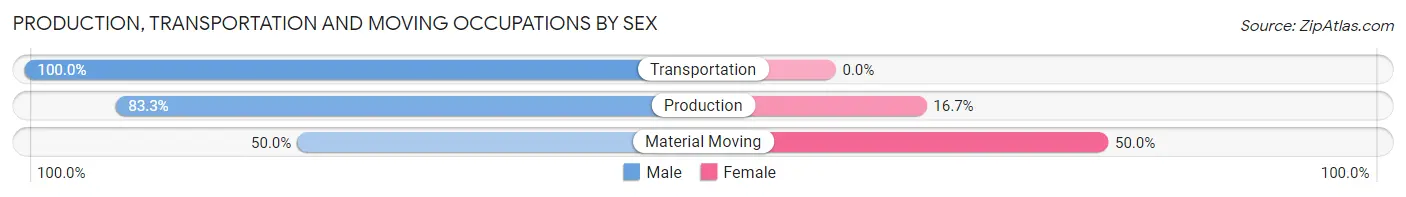
Production, Transportation and Moving Occupations by Sex
| Occupation | Male | Female |
| Production | 5 (83.3%) | 1 (16.7%) |
| Transportation | 8 (100.0%) | 0 (0.0%) |
| Material Moving | 2 (50.0%) | 2 (50.0%) |
| Total (Category) | 15 (83.3%) | 3 (16.7%) |
| Total (Overall) | 38 (52.8%) | 34 (47.2%) |
Employment Industries by Sex in Lockbourne
Employment Industries in Lockbourne
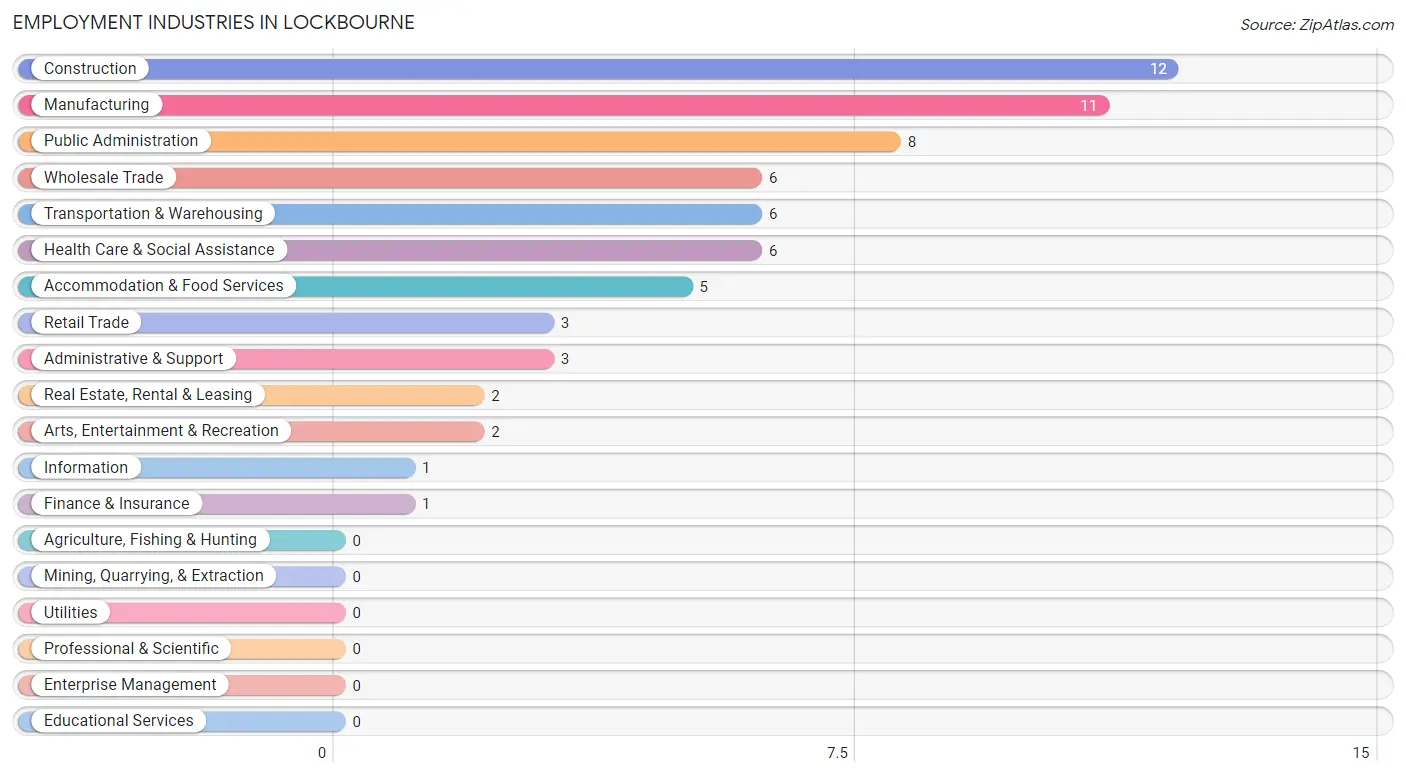
The major employment industries in Lockbourne include Construction (12 | 16.7%), Manufacturing (11 | 15.3%), Public Administration (8 | 11.1%), Wholesale Trade (6 | 8.3%), and Transportation & Warehousing (6 | 8.3%).
Employment Industries by Sex in Lockbourne
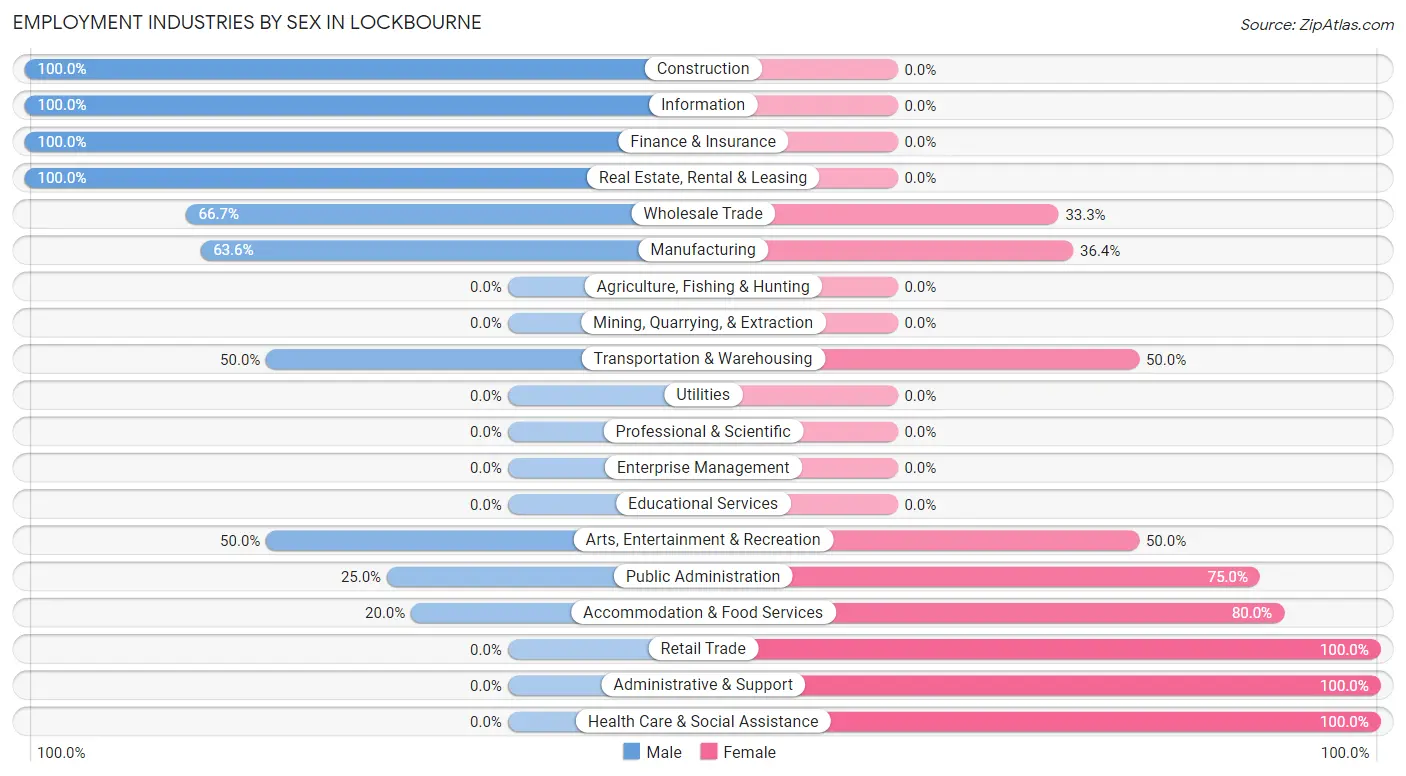
The Lockbourne industries that see more men than women are Construction (100.0%), Information (100.0%), and Finance & Insurance (100.0%), whereas the industries that tend to have a higher number of women are Retail Trade (100.0%), Administrative & Support (100.0%), and Health Care & Social Assistance (100.0%).
| Industry | Male | Female |
| Agriculture, Fishing & Hunting | 0 (0.0%) | 0 (0.0%) |
| Mining, Quarrying, & Extraction | 0 (0.0%) | 0 (0.0%) |
| Construction | 12 (100.0%) | 0 (0.0%) |
| Manufacturing | 7 (63.6%) | 4 (36.4%) |
| Wholesale Trade | 4 (66.7%) | 2 (33.3%) |
| Retail Trade | 0 (0.0%) | 3 (100.0%) |
| Transportation & Warehousing | 3 (50.0%) | 3 (50.0%) |
| Utilities | 0 (0.0%) | 0 (0.0%) |
| Information | 1 (100.0%) | 0 (0.0%) |
| Finance & Insurance | 1 (100.0%) | 0 (0.0%) |
| Real Estate, Rental & Leasing | 2 (100.0%) | 0 (0.0%) |
| Professional & Scientific | 0 (0.0%) | 0 (0.0%) |
| Enterprise Management | 0 (0.0%) | 0 (0.0%) |
| Administrative & Support | 0 (0.0%) | 3 (100.0%) |
| Educational Services | 0 (0.0%) | 0 (0.0%) |
| Health Care & Social Assistance | 0 (0.0%) | 6 (100.0%) |
| Arts, Entertainment & Recreation | 1 (50.0%) | 1 (50.0%) |
| Accommodation & Food Services | 1 (20.0%) | 4 (80.0%) |
| Public Administration | 2 (25.0%) | 6 (75.0%) |
| Total | 38 (52.8%) | 34 (47.2%) |
Education in Lockbourne
School Enrollment in Lockbourne
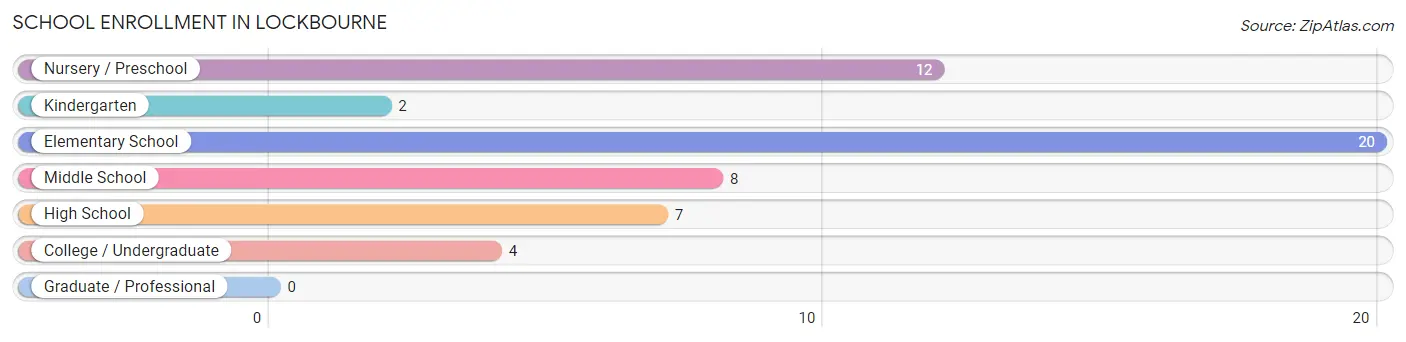
The most common levels of schooling among the 53 students in Lockbourne are elementary school (20 | 37.7%), nursery / preschool (12 | 22.6%), and middle school (8 | 15.1%).
| School Level | # Students | % Students |
| Nursery / Preschool | 12 | 22.6% |
| Kindergarten | 2 | 3.8% |
| Elementary School | 20 | 37.7% |
| Middle School | 8 | 15.1% |
| High School | 7 | 13.2% |
| College / Undergraduate | 4 | 7.5% |
| Graduate / Professional | 0 | 0.0% |
| Total | 53 | 100.0% |
School Enrollment by Age by Funding Source in Lockbourne
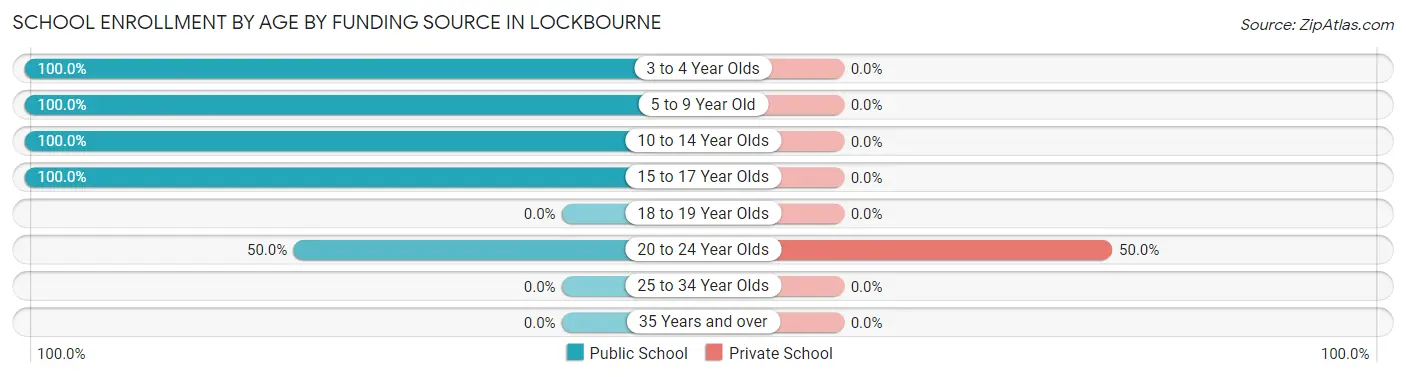
Out of a total of 53 students who are enrolled in schools in Lockbourne, 2 (3.8%) attend a private institution, while the remaining 51 (96.2%) are enrolled in public schools. The age group of 20 to 24 year olds has the highest likelihood of being enrolled in private schools, with 2 (50.0% in the age bracket) enrolled. Conversely, the age group of 3 to 4 year olds has the lowest likelihood of being enrolled in a private school, with 12 (100.0% in the age bracket) attending a public institution.
| Age Bracket | Public School | Private School |
| 3 to 4 Year Olds | 12 (100.0%) | 0 (0.0%) |
| 5 to 9 Year Old | 13 (100.0%) | 0 (0.0%) |
| 10 to 14 Year Olds | 15 (100.0%) | 0 (0.0%) |
| 15 to 17 Year Olds | 9 (100.0%) | 0 (0.0%) |
| 18 to 19 Year Olds | 0 (0.0%) | 0 (0.0%) |
| 20 to 24 Year Olds | 2 (50.0%) | 2 (50.0%) |
| 25 to 34 Year Olds | 0 (0.0%) | 0 (0.0%) |
| 35 Years and over | 0 (0.0%) | 0 (0.0%) |
| Total | 51 (96.2%) | 2 (3.8%) |
Educational Attainment by Field of Study in Lockbourne
Business (4 | 40.0%), bio, nature & agricultural (3 | 30.0%), engineering (2 | 20.0%), and visual & performing arts (1 | 10.0%) are the most common fields of study among 10 individuals in Lockbourne who have obtained a bachelor's degree or higher.
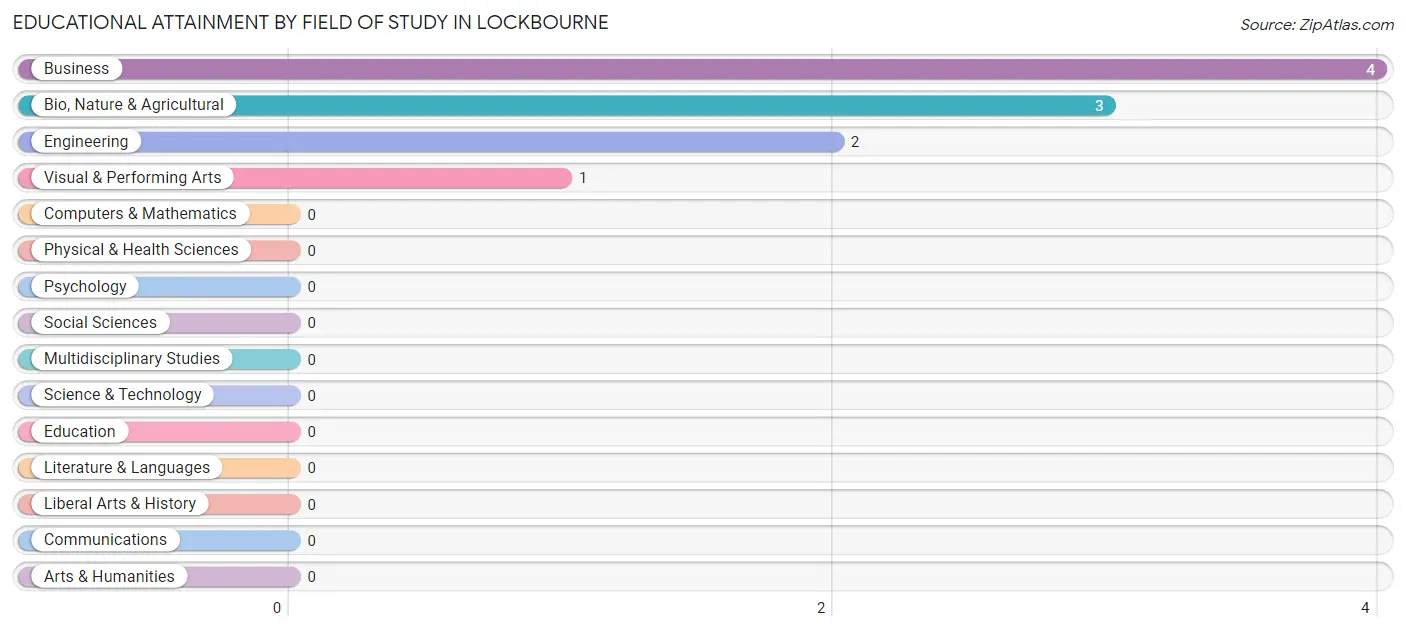
| Field of Study | # Graduates | % Graduates |
| Computers & Mathematics | 0 | 0.0% |
| Bio, Nature & Agricultural | 3 | 30.0% |
| Physical & Health Sciences | 0 | 0.0% |
| Psychology | 0 | 0.0% |
| Social Sciences | 0 | 0.0% |
| Engineering | 2 | 20.0% |
| Multidisciplinary Studies | 0 | 0.0% |
| Science & Technology | 0 | 0.0% |
| Business | 4 | 40.0% |
| Education | 0 | 0.0% |
| Literature & Languages | 0 | 0.0% |
| Liberal Arts & History | 0 | 0.0% |
| Visual & Performing Arts | 1 | 10.0% |
| Communications | 0 | 0.0% |
| Arts & Humanities | 0 | 0.0% |
| Total | 10 | 100.0% |
Transportation & Commute in Lockbourne
Vehicle Availability by Sex in Lockbourne
The most prevalent vehicle ownership categories in Lockbourne are males with 2 vehicles (19, accounting for 50.0%) and females with 2 vehicles (18, making up 55.9%).
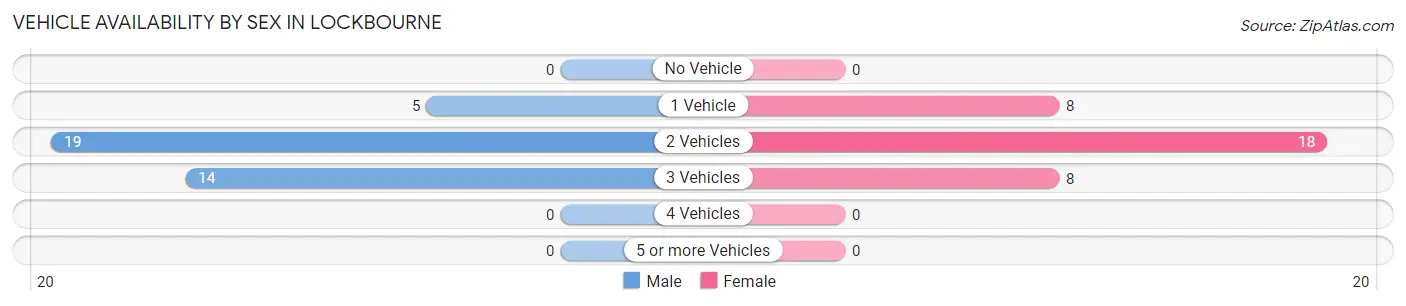
| Vehicles Available | Male | Female |
| No Vehicle | 0 (0.0%) | 0 (0.0%) |
| 1 Vehicle | 5 (13.2%) | 8 (23.5%) |
| 2 Vehicles | 19 (50.0%) | 18 (52.9%) |
| 3 Vehicles | 14 (36.8%) | 8 (23.5%) |
| 4 Vehicles | 0 (0.0%) | 0 (0.0%) |
| 5 or more Vehicles | 0 (0.0%) | 0 (0.0%) |
| Total | 38 (100.0%) | 34 (100.0%) |
Commute Time in Lockbourne
The most frequently occuring commute durations in Lockbourne are 10 to 14 minutes (18 commuters, 26.1%), 20 to 24 minutes (15 commuters, 21.7%), and 15 to 19 minutes (10 commuters, 14.5%).
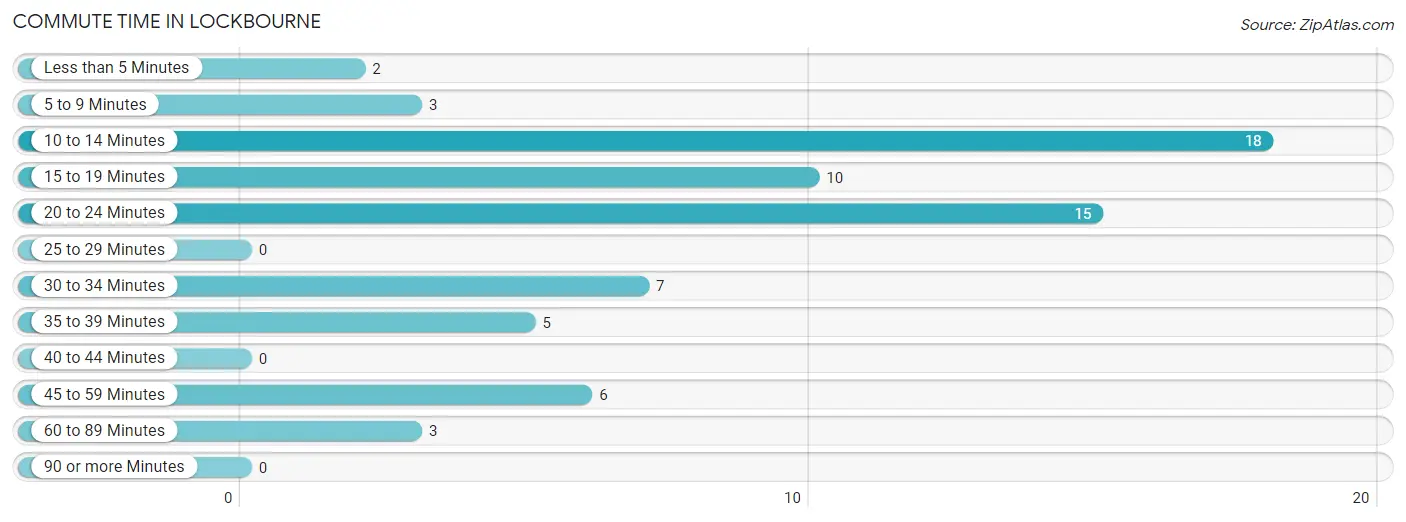
| Commute Time | # Commuters | % Commuters |
| Less than 5 Minutes | 2 | 2.9% |
| 5 to 9 Minutes | 3 | 4.3% |
| 10 to 14 Minutes | 18 | 26.1% |
| 15 to 19 Minutes | 10 | 14.5% |
| 20 to 24 Minutes | 15 | 21.7% |
| 25 to 29 Minutes | 0 | 0.0% |
| 30 to 34 Minutes | 7 | 10.1% |
| 35 to 39 Minutes | 5 | 7.2% |
| 40 to 44 Minutes | 0 | 0.0% |
| 45 to 59 Minutes | 6 | 8.7% |
| 60 to 89 Minutes | 3 | 4.3% |
| 90 or more Minutes | 0 | 0.0% |
Commute Time by Sex in Lockbourne
The most common commute times in Lockbourne are 20 to 24 minutes (10 commuters, 26.3%) for males and 10 to 14 minutes (9 commuters, 29.0%) for females.
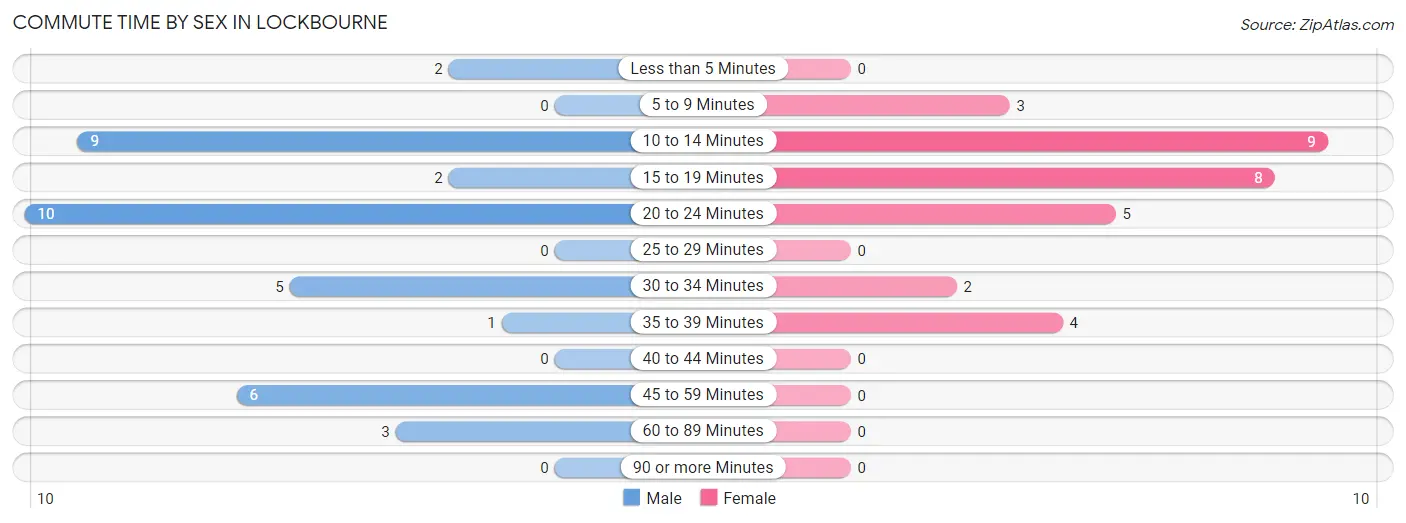
| Commute Time | Male | Female |
| Less than 5 Minutes | 2 (5.3%) | 0 (0.0%) |
| 5 to 9 Minutes | 0 (0.0%) | 3 (9.7%) |
| 10 to 14 Minutes | 9 (23.7%) | 9 (29.0%) |
| 15 to 19 Minutes | 2 (5.3%) | 8 (25.8%) |
| 20 to 24 Minutes | 10 (26.3%) | 5 (16.1%) |
| 25 to 29 Minutes | 0 (0.0%) | 0 (0.0%) |
| 30 to 34 Minutes | 5 (13.2%) | 2 (6.5%) |
| 35 to 39 Minutes | 1 (2.6%) | 4 (12.9%) |
| 40 to 44 Minutes | 0 (0.0%) | 0 (0.0%) |
| 45 to 59 Minutes | 6 (15.8%) | 0 (0.0%) |
| 60 to 89 Minutes | 3 (7.9%) | 0 (0.0%) |
| 90 or more Minutes | 0 (0.0%) | 0 (0.0%) |
Time of Departure to Work by Sex in Lockbourne
The most frequent times of departure to work in Lockbourne are 7:00 AM to 7:29 AM (14, 36.8%) for males and 8:00 AM to 8:29 AM (7, 22.6%) for females.
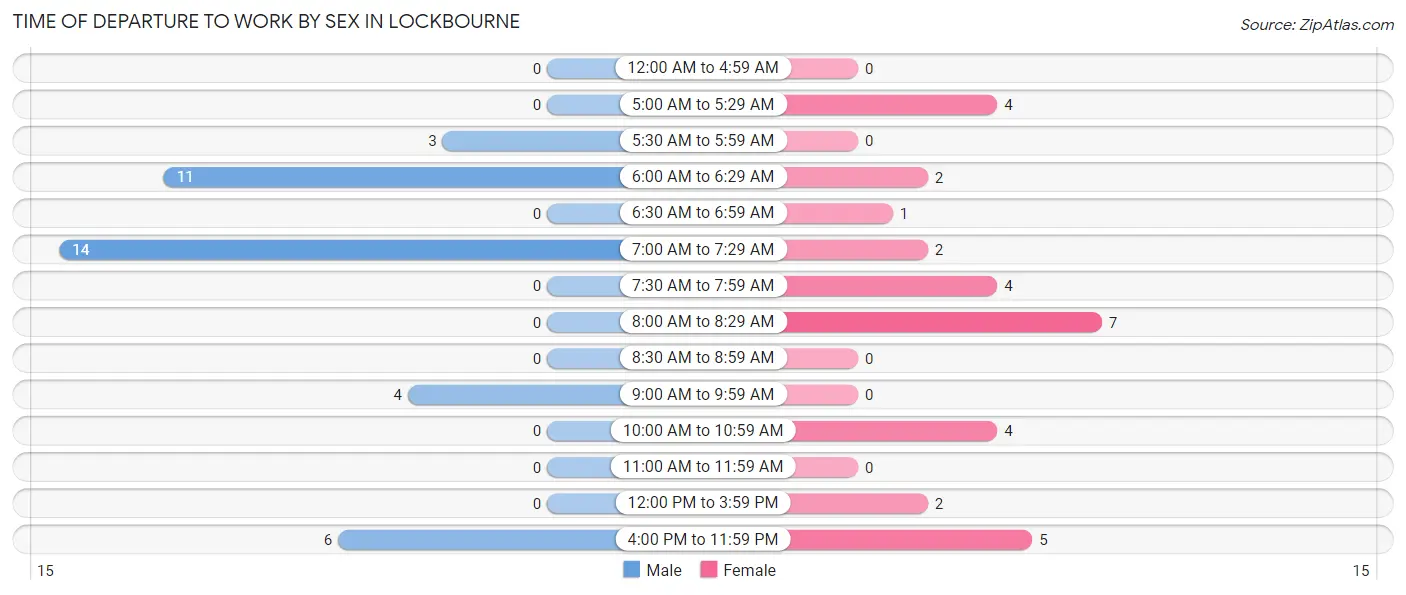
| Time of Departure | Male | Female |
| 12:00 AM to 4:59 AM | 0 (0.0%) | 0 (0.0%) |
| 5:00 AM to 5:29 AM | 0 (0.0%) | 4 (12.9%) |
| 5:30 AM to 5:59 AM | 3 (7.9%) | 0 (0.0%) |
| 6:00 AM to 6:29 AM | 11 (28.9%) | 2 (6.5%) |
| 6:30 AM to 6:59 AM | 0 (0.0%) | 1 (3.2%) |
| 7:00 AM to 7:29 AM | 14 (36.8%) | 2 (6.5%) |
| 7:30 AM to 7:59 AM | 0 (0.0%) | 4 (12.9%) |
| 8:00 AM to 8:29 AM | 0 (0.0%) | 7 (22.6%) |
| 8:30 AM to 8:59 AM | 0 (0.0%) | 0 (0.0%) |
| 9:00 AM to 9:59 AM | 4 (10.5%) | 0 (0.0%) |
| 10:00 AM to 10:59 AM | 0 (0.0%) | 4 (12.9%) |
| 11:00 AM to 11:59 AM | 0 (0.0%) | 0 (0.0%) |
| 12:00 PM to 3:59 PM | 0 (0.0%) | 2 (6.5%) |
| 4:00 PM to 11:59 PM | 6 (15.8%) | 5 (16.1%) |
| Total | 38 (100.0%) | 31 (100.0%) |
Housing Occupancy in Lockbourne
Occupancy by Ownership in Lockbourne
Of the total 88 dwellings in Lockbourne, owner-occupied units account for 68 (77.3%), while renter-occupied units make up 20 (22.7%).
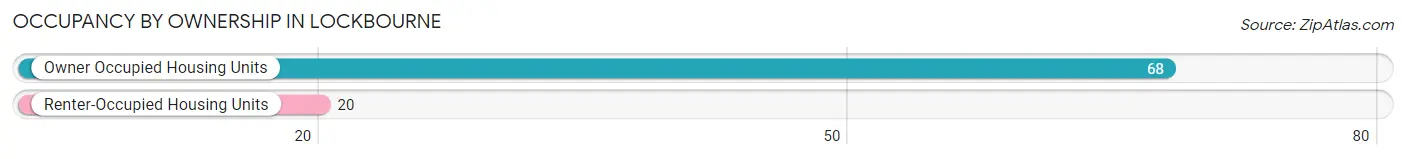
| Occupancy | # Housing Units | % Housing Units |
| Owner Occupied Housing Units | 68 | 77.3% |
| Renter-Occupied Housing Units | 20 | 22.7% |
| Total Occupied Housing Units | 88 | 100.0% |
Occupancy by Household Size in Lockbourne
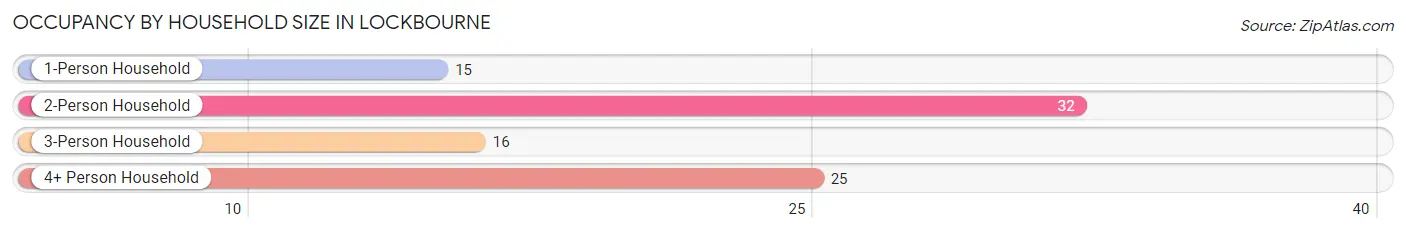
| Household Size | # Housing Units | % Housing Units |
| 1-Person Household | 15 | 17.1% |
| 2-Person Household | 32 | 36.4% |
| 3-Person Household | 16 | 18.2% |
| 4+ Person Household | 25 | 28.4% |
| Total Housing Units | 88 | 100.0% |
Occupancy by Ownership by Household Size in Lockbourne
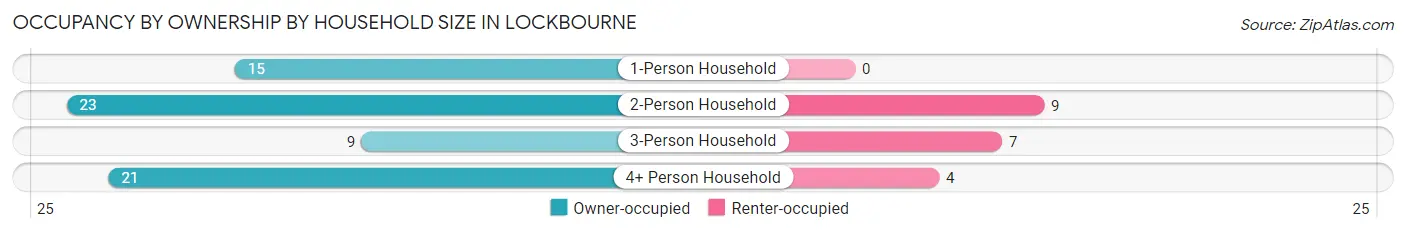
| Household Size | Owner-occupied | Renter-occupied |
| 1-Person Household | 15 (100.0%) | 0 (0.0%) |
| 2-Person Household | 23 (71.9%) | 9 (28.1%) |
| 3-Person Household | 9 (56.2%) | 7 (43.8%) |
| 4+ Person Household | 21 (84.0%) | 4 (16.0%) |
| Total Housing Units | 68 (77.3%) | 20 (22.7%) |
Occupancy by Educational Attainment in Lockbourne
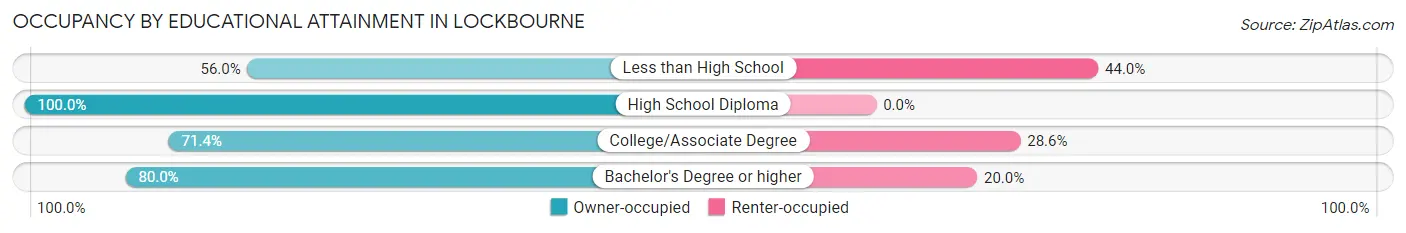
| Household Size | Owner-occupied | Renter-occupied |
| Less than High School | 14 (56.0%) | 11 (44.0%) |
| High School Diploma | 30 (100.0%) | 0 (0.0%) |
| College/Associate Degree | 20 (71.4%) | 8 (28.6%) |
| Bachelor's Degree or higher | 4 (80.0%) | 1 (20.0%) |
Occupancy by Age of Householder in Lockbourne
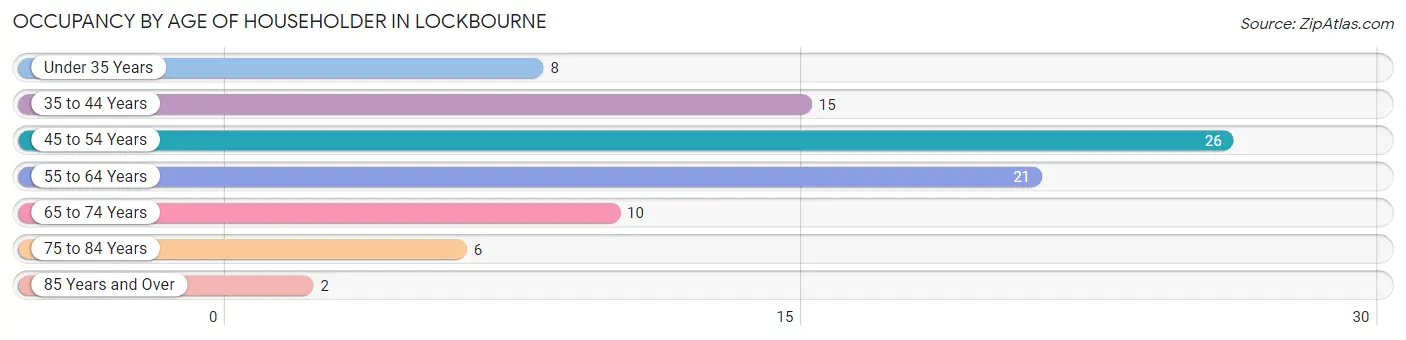
| Age Bracket | # Households | % Households |
| Under 35 Years | 8 | 9.1% |
| 35 to 44 Years | 15 | 17.1% |
| 45 to 54 Years | 26 | 29.5% |
| 55 to 64 Years | 21 | 23.9% |
| 65 to 74 Years | 10 | 11.4% |
| 75 to 84 Years | 6 | 6.8% |
| 85 Years and Over | 2 | 2.3% |
| Total | 88 | 100.0% |
Housing Finances in Lockbourne
Median Income by Occupancy in Lockbourne
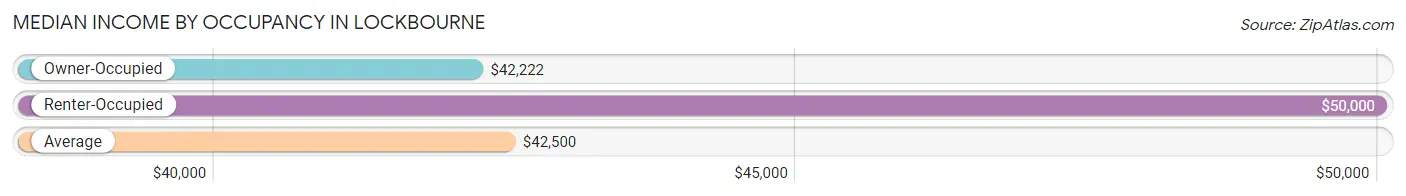
| Occupancy Type | # Households | Median Income |
| Owner-Occupied | 68 (77.3%) | $42,222 |
| Renter-Occupied | 20 (22.7%) | $50,000 |
| Average | 88 (100.0%) | $42,500 |
Occupancy by Householder Income Bracket in Lockbourne
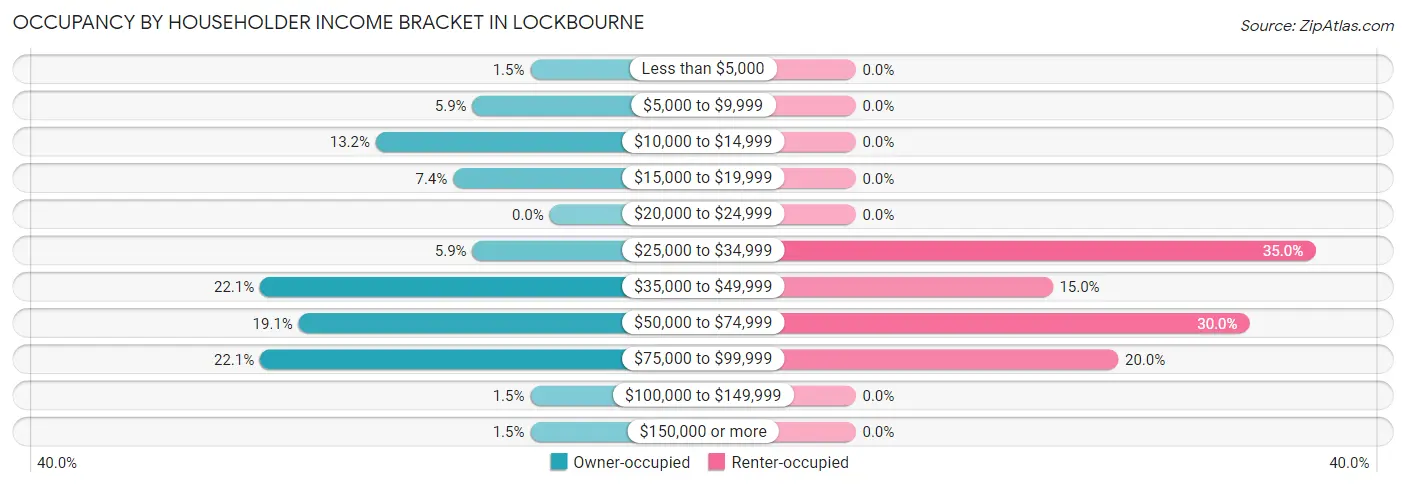
| Income Bracket | Owner-occupied | Renter-occupied |
| Less than $5,000 | 1 (1.5%) | 0 (0.0%) |
| $5,000 to $9,999 | 4 (5.9%) | 0 (0.0%) |
| $10,000 to $14,999 | 9 (13.2%) | 0 (0.0%) |
| $15,000 to $19,999 | 5 (7.3%) | 0 (0.0%) |
| $20,000 to $24,999 | 0 (0.0%) | 0 (0.0%) |
| $25,000 to $34,999 | 4 (5.9%) | 7 (35.0%) |
| $35,000 to $49,999 | 15 (22.1%) | 3 (15.0%) |
| $50,000 to $74,999 | 13 (19.1%) | 6 (30.0%) |
| $75,000 to $99,999 | 15 (22.1%) | 4 (20.0%) |
| $100,000 to $149,999 | 1 (1.5%) | 0 (0.0%) |
| $150,000 or more | 1 (1.5%) | 0 (0.0%) |
| Total | 68 (100.0%) | 20 (100.0%) |
Monthly Housing Cost Tiers in Lockbourne
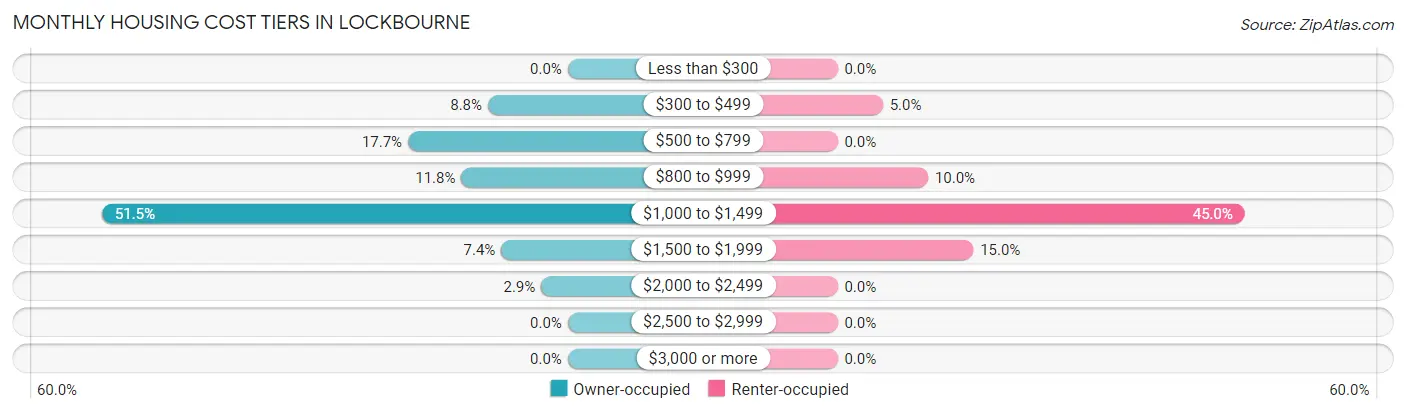
| Monthly Cost | Owner-occupied | Renter-occupied |
| Less than $300 | 0 (0.0%) | 0 (0.0%) |
| $300 to $499 | 6 (8.8%) | 1 (5.0%) |
| $500 to $799 | 12 (17.6%) | 0 (0.0%) |
| $800 to $999 | 8 (11.8%) | 2 (10.0%) |
| $1,000 to $1,499 | 35 (51.5%) | 9 (45.0%) |
| $1,500 to $1,999 | 5 (7.3%) | 3 (15.0%) |
| $2,000 to $2,499 | 2 (2.9%) | 0 (0.0%) |
| $2,500 to $2,999 | 0 (0.0%) | 0 (0.0%) |
| $3,000 or more | 0 (0.0%) | 0 (0.0%) |
| Total | 68 (100.0%) | 20 (100.0%) |
Physical Housing Characteristics in Lockbourne
Housing Structures in Lockbourne
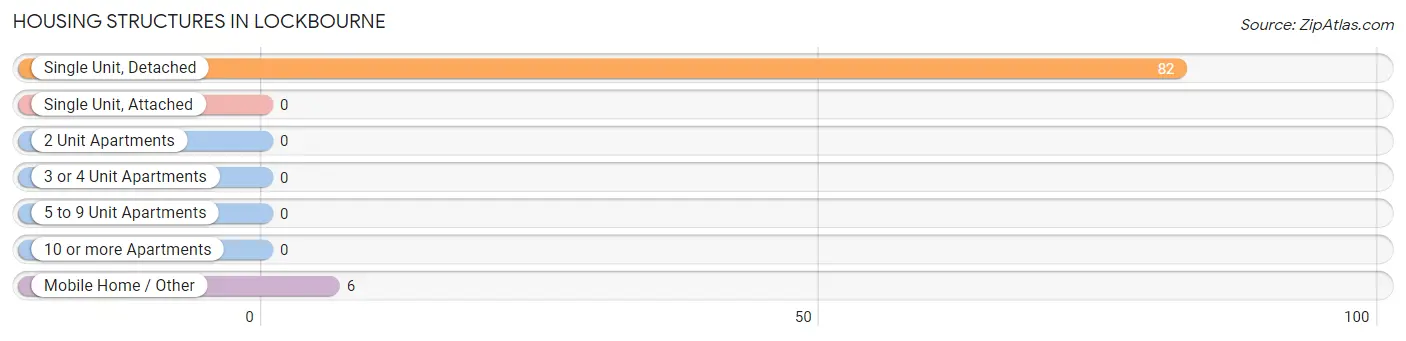
| Structure Type | # Housing Units | % Housing Units |
| Single Unit, Detached | 82 | 93.2% |
| Single Unit, Attached | 0 | 0.0% |
| 2 Unit Apartments | 0 | 0.0% |
| 3 or 4 Unit Apartments | 0 | 0.0% |
| 5 to 9 Unit Apartments | 0 | 0.0% |
| 10 or more Apartments | 0 | 0.0% |
| Mobile Home / Other | 6 | 6.8% |
| Total | 88 | 100.0% |
Housing Structures by Occupancy in Lockbourne
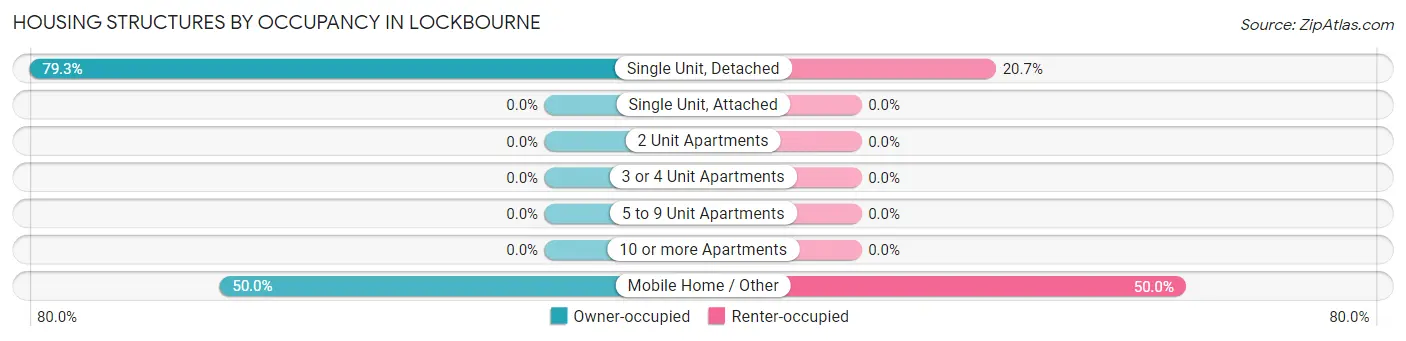
| Structure Type | Owner-occupied | Renter-occupied |
| Single Unit, Detached | 65 (79.3%) | 17 (20.7%) |
| Single Unit, Attached | 0 (0.0%) | 0 (0.0%) |
| 2 Unit Apartments | 0 (0.0%) | 0 (0.0%) |
| 3 or 4 Unit Apartments | 0 (0.0%) | 0 (0.0%) |
| 5 to 9 Unit Apartments | 0 (0.0%) | 0 (0.0%) |
| 10 or more Apartments | 0 (0.0%) | 0 (0.0%) |
| Mobile Home / Other | 3 (50.0%) | 3 (50.0%) |
| Total | 68 (77.3%) | 20 (22.7%) |
Housing Structures by Number of Rooms in Lockbourne
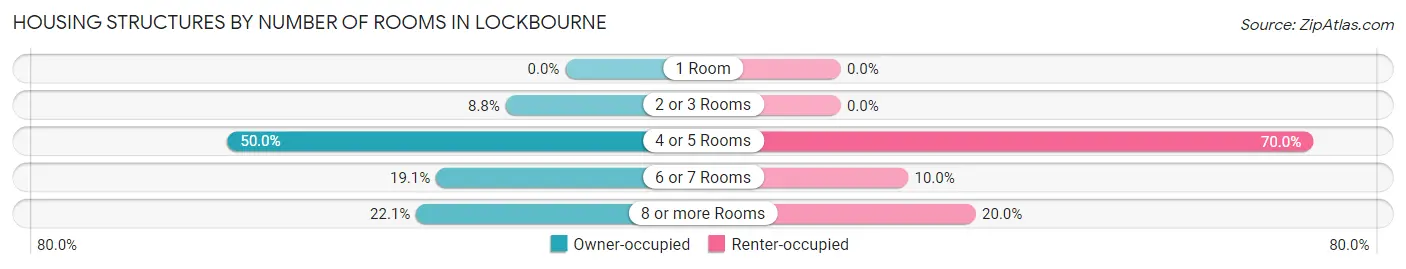
| Number of Rooms | Owner-occupied | Renter-occupied |
| 1 Room | 0 (0.0%) | 0 (0.0%) |
| 2 or 3 Rooms | 6 (8.8%) | 0 (0.0%) |
| 4 or 5 Rooms | 34 (50.0%) | 14 (70.0%) |
| 6 or 7 Rooms | 13 (19.1%) | 2 (10.0%) |
| 8 or more Rooms | 15 (22.1%) | 4 (20.0%) |
| Total | 68 (100.0%) | 20 (100.0%) |
Housing Structure by Heating Type in Lockbourne
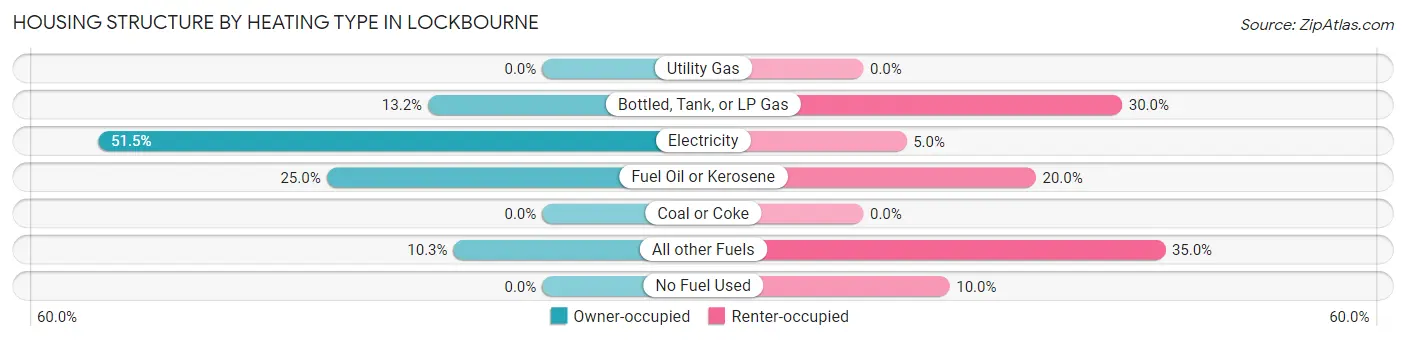
| Heating Type | Owner-occupied | Renter-occupied |
| Utility Gas | 0 (0.0%) | 0 (0.0%) |
| Bottled, Tank, or LP Gas | 9 (13.2%) | 6 (30.0%) |
| Electricity | 35 (51.5%) | 1 (5.0%) |
| Fuel Oil or Kerosene | 17 (25.0%) | 4 (20.0%) |
| Coal or Coke | 0 (0.0%) | 0 (0.0%) |
| All other Fuels | 7 (10.3%) | 7 (35.0%) |
| No Fuel Used | 0 (0.0%) | 2 (10.0%) |
| Total | 68 (100.0%) | 20 (100.0%) |
Household Vehicle Usage in Lockbourne
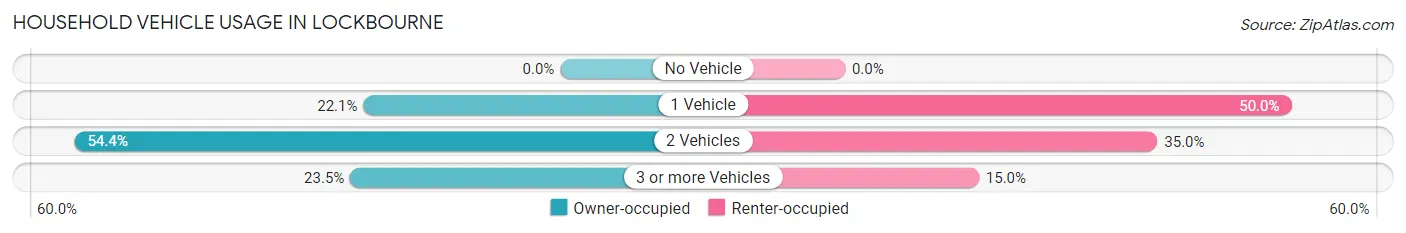
| Vehicles per Household | Owner-occupied | Renter-occupied |
| No Vehicle | 0 (0.0%) | 0 (0.0%) |
| 1 Vehicle | 15 (22.1%) | 10 (50.0%) |
| 2 Vehicles | 37 (54.4%) | 7 (35.0%) |
| 3 or more Vehicles | 16 (23.5%) | 3 (15.0%) |
| Total | 68 (100.0%) | 20 (100.0%) |
Real Estate & Mortgages in Lockbourne
Real Estate and Mortgage Overview in Lockbourne
| Characteristic | Without Mortgage | With Mortgage |
| Housing Units | 28 | 40 |
| Median Property Value | - | - |
| Median Household Income | $33,750 | $1 |
| Monthly Housing Costs | $975 | $0 |
| Real Estate Taxes | $1,700 | $2 |
Property Value by Mortgage Status in Lockbourne
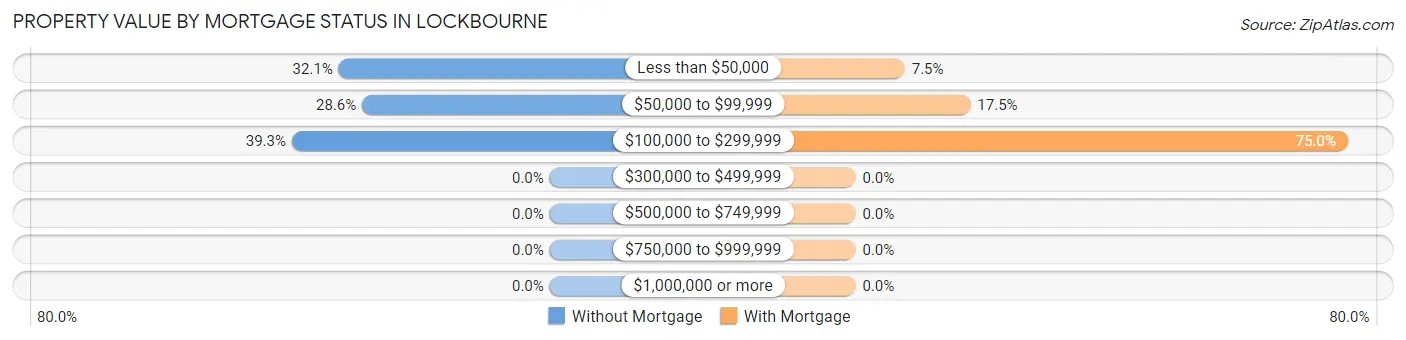
| Property Value | Without Mortgage | With Mortgage |
| Less than $50,000 | 9 (32.1%) | 3 (7.5%) |
| $50,000 to $99,999 | 8 (28.6%) | 7 (17.5%) |
| $100,000 to $299,999 | 11 (39.3%) | 30 (75.0%) |
| $300,000 to $499,999 | 0 (0.0%) | 0 (0.0%) |
| $500,000 to $749,999 | 0 (0.0%) | 0 (0.0%) |
| $750,000 to $999,999 | 0 (0.0%) | 0 (0.0%) |
| $1,000,000 or more | 0 (0.0%) | 0 (0.0%) |
| Total | 28 (100.0%) | 40 (100.0%) |
Household Income by Mortgage Status in Lockbourne
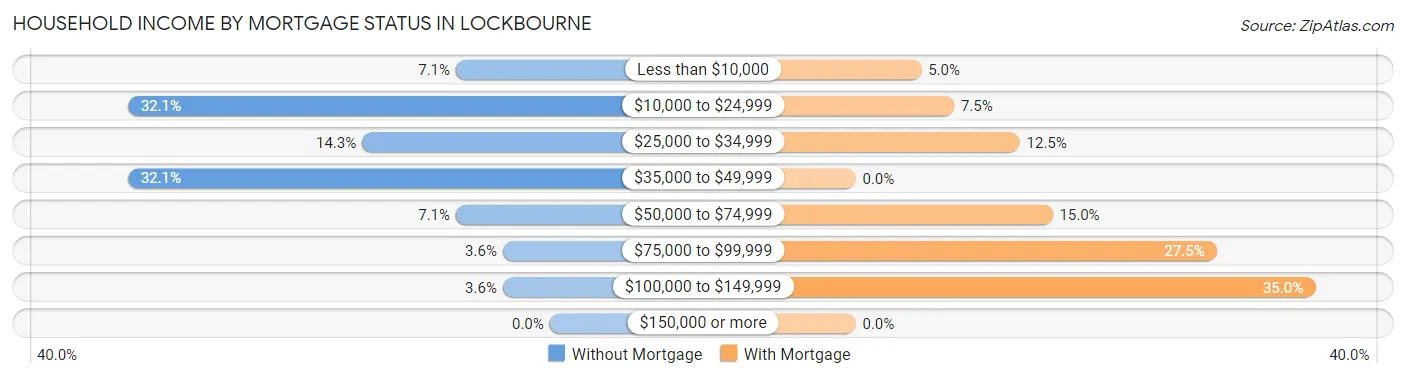
| Household Income | Without Mortgage | With Mortgage |
| Less than $10,000 | 2 (7.1%) | 2 (5.0%) |
| $10,000 to $24,999 | 9 (32.1%) | 3 (7.5%) |
| $25,000 to $34,999 | 4 (14.3%) | 5 (12.5%) |
| $35,000 to $49,999 | 9 (32.1%) | 0 (0.0%) |
| $50,000 to $74,999 | 2 (7.1%) | 6 (15.0%) |
| $75,000 to $99,999 | 1 (3.6%) | 11 (27.5%) |
| $100,000 to $149,999 | 1 (3.6%) | 14 (35.0%) |
| $150,000 or more | 0 (0.0%) | 0 (0.0%) |
| Total | 28 (100.0%) | 40 (100.0%) |
Property Value to Household Income Ratio in Lockbourne
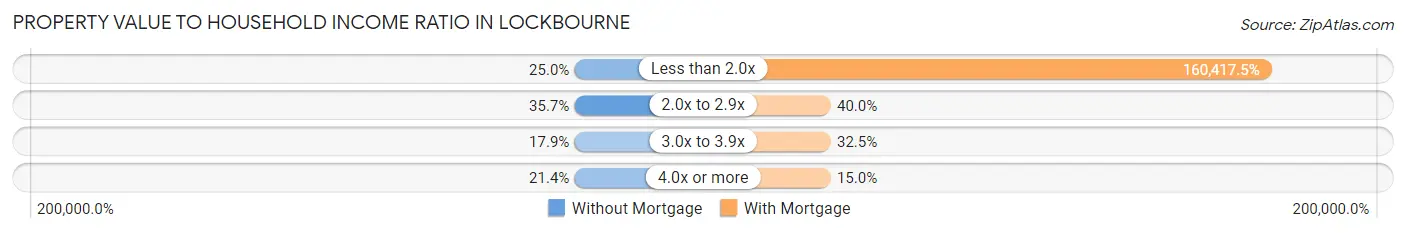
| Value-to-Income Ratio | Without Mortgage | With Mortgage |
| Less than 2.0x | 7 (25.0%) | 64,167 (160,417.5%) |
| 2.0x to 2.9x | 10 (35.7%) | 16 (40.0%) |
| 3.0x to 3.9x | 5 (17.9%) | 13 (32.5%) |
| 4.0x or more | 6 (21.4%) | 6 (15.0%) |
| Total | 28 (100.0%) | 40 (100.0%) |
Real Estate Taxes by Mortgage Status in Lockbourne
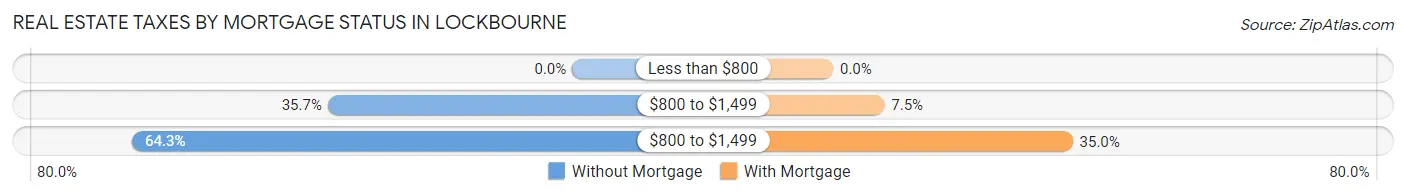
| Property Taxes | Without Mortgage | With Mortgage |
| Less than $800 | 0 (0.0%) | 0 (0.0%) |
| $800 to $1,499 | 10 (35.7%) | 3 (7.5%) |
| $800 to $1,499 | 18 (64.3%) | 14 (35.0%) |
| Total | 28 (100.0%) | 40 (100.0%) |
Health & Disability in Lockbourne
Health Insurance Coverage by Age in Lockbourne
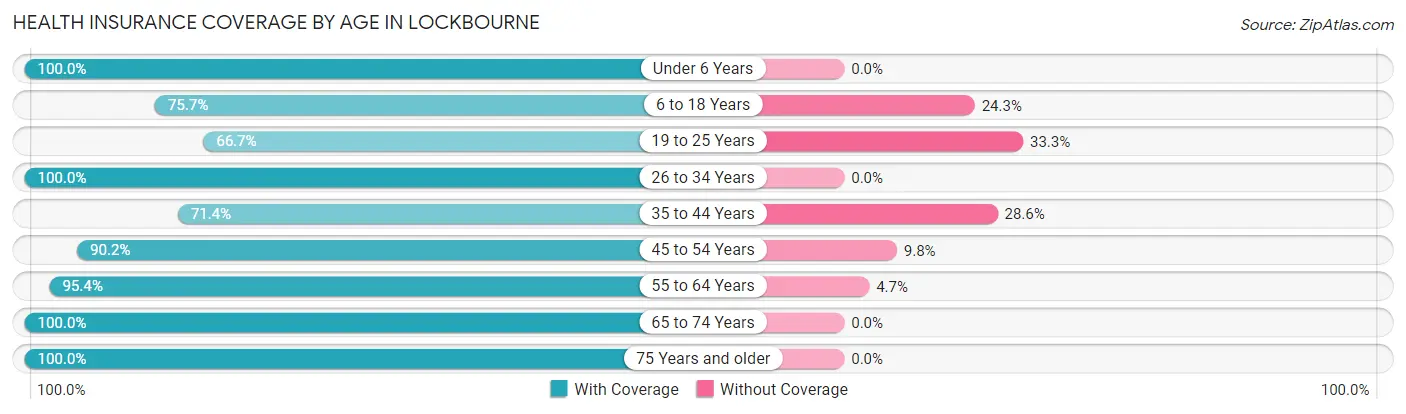
| Age Bracket | With Coverage | Without Coverage |
| Under 6 Years | 48 (100.0%) | 0 (0.0%) |
| 6 to 18 Years | 28 (75.7%) | 9 (24.3%) |
| 19 to 25 Years | 8 (66.7%) | 4 (33.3%) |
| 26 to 34 Years | 24 (100.0%) | 0 (0.0%) |
| 35 to 44 Years | 15 (71.4%) | 6 (28.6%) |
| 45 to 54 Years | 46 (90.2%) | 5 (9.8%) |
| 55 to 64 Years | 41 (95.4%) | 2 (4.6%) |
| 65 to 74 Years | 11 (100.0%) | 0 (0.0%) |
| 75 Years and older | 8 (100.0%) | 0 (0.0%) |
| Total | 229 (89.8%) | 26 (10.2%) |
Health Insurance Coverage by Citizenship Status in Lockbourne
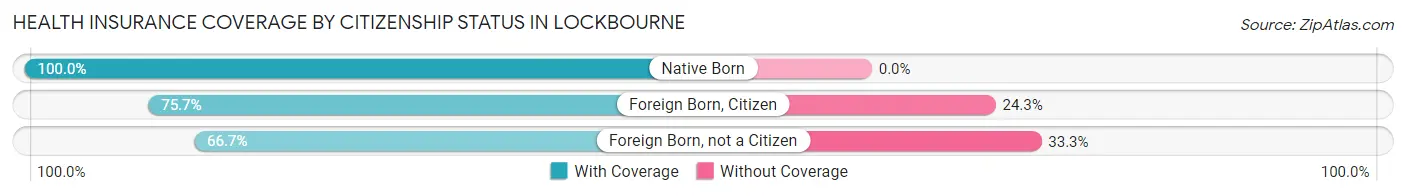
| Citizenship Status | With Coverage | Without Coverage |
| Native Born | 48 (100.0%) | 0 (0.0%) |
| Foreign Born, Citizen | 28 (75.7%) | 9 (24.3%) |
| Foreign Born, not a Citizen | 8 (66.7%) | 4 (33.3%) |
Health Insurance Coverage by Household Income in Lockbourne
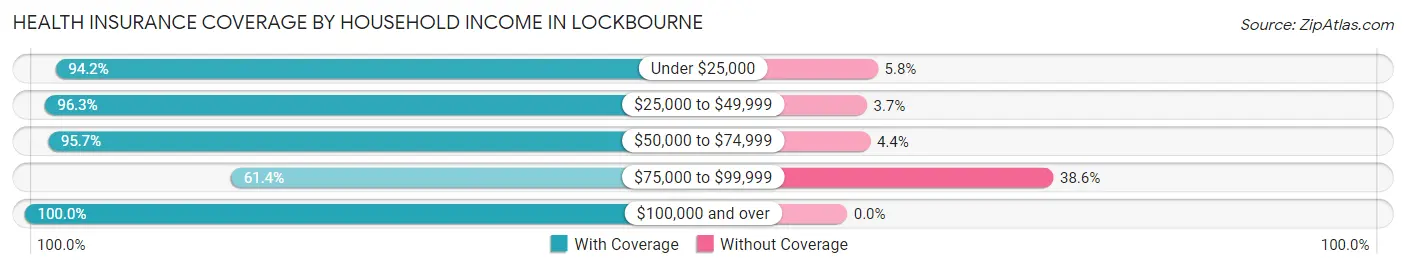
| Household Income | With Coverage | Without Coverage |
| Under $25,000 | 49 (94.2%) | 3 (5.8%) |
| $25,000 to $49,999 | 78 (96.3%) | 3 (3.7%) |
| $50,000 to $74,999 | 66 (95.7%) | 3 (4.3%) |
| $75,000 to $99,999 | 27 (61.4%) | 17 (38.6%) |
| $100,000 and over | 9 (100.0%) | 0 (0.0%) |
Public vs Private Health Insurance Coverage by Age in Lockbourne
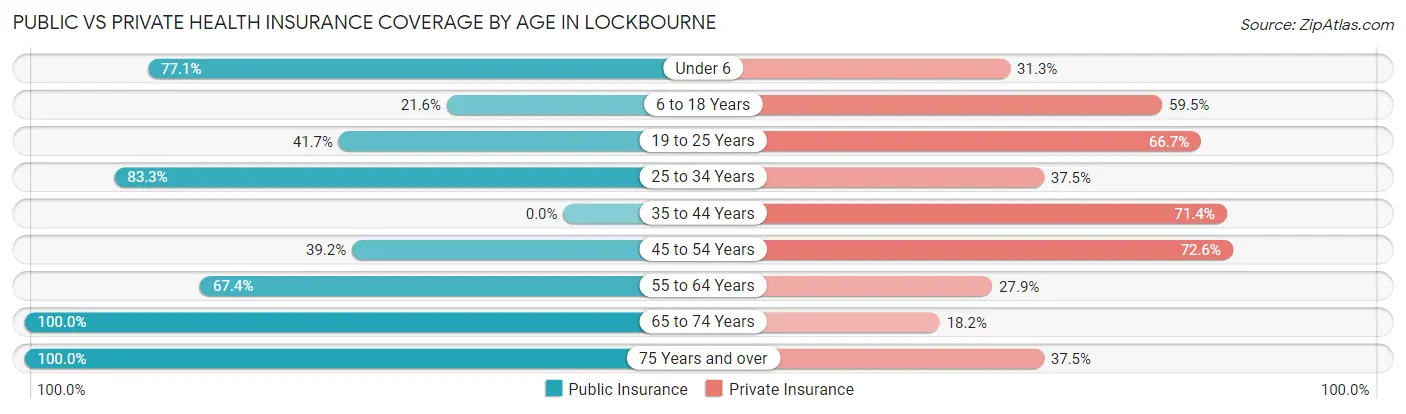
| Age Bracket | Public Insurance | Private Insurance |
| Under 6 | 37 (77.1%) | 15 (31.2%) |
| 6 to 18 Years | 8 (21.6%) | 22 (59.5%) |
| 19 to 25 Years | 5 (41.7%) | 8 (66.7%) |
| 25 to 34 Years | 20 (83.3%) | 9 (37.5%) |
| 35 to 44 Years | 0 (0.0%) | 15 (71.4%) |
| 45 to 54 Years | 20 (39.2%) | 37 (72.6%) |
| 55 to 64 Years | 29 (67.4%) | 12 (27.9%) |
| 65 to 74 Years | 11 (100.0%) | 2 (18.2%) |
| 75 Years and over | 8 (100.0%) | 3 (37.5%) |
| Total | 138 (54.1%) | 123 (48.2%) |
Disability Status by Sex by Age in Lockbourne
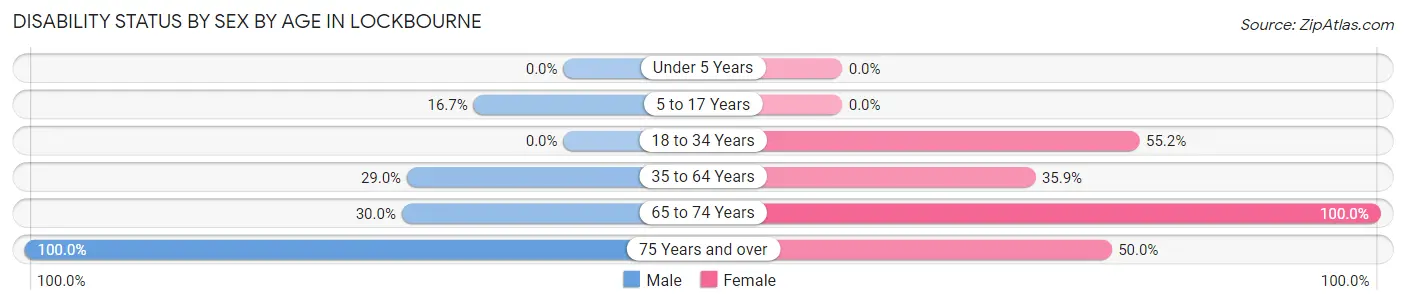
| Age Bracket | Male | Female |
| Under 5 Years | 0 (0.0%) | 0 (0.0%) |
| 5 to 17 Years | 3 (16.7%) | 0 (0.0%) |
| 18 to 34 Years | 0 (0.0%) | 16 (55.2%) |
| 35 to 64 Years | 18 (29.0%) | 19 (35.8%) |
| 65 to 74 Years | 3 (30.0%) | 1 (100.0%) |
| 75 Years and over | 2 (100.0%) | 3 (50.0%) |
Disability Class by Sex by Age in Lockbourne
Disability Class: Hearing Difficulty
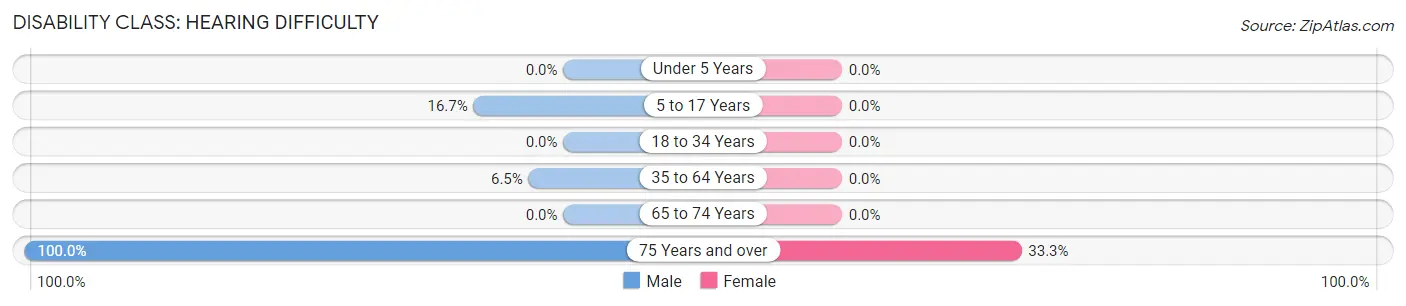
| Age Bracket | Male | Female |
| Under 5 Years | 0 (0.0%) | 0 (0.0%) |
| 5 to 17 Years | 3 (16.7%) | 0 (0.0%) |
| 18 to 34 Years | 0 (0.0%) | 0 (0.0%) |
| 35 to 64 Years | 4 (6.5%) | 0 (0.0%) |
| 65 to 74 Years | 0 (0.0%) | 0 (0.0%) |
| 75 Years and over | 2 (100.0%) | 2 (33.3%) |
Disability Class: Vision Difficulty
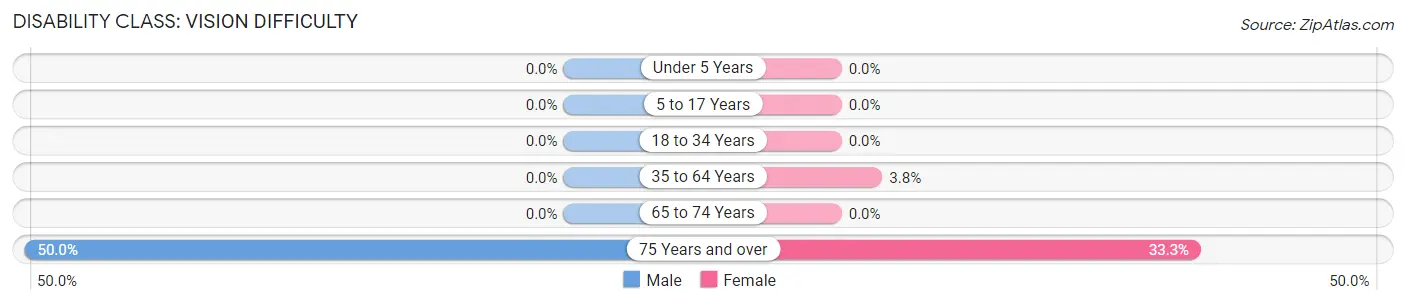
| Age Bracket | Male | Female |
| Under 5 Years | 0 (0.0%) | 0 (0.0%) |
| 5 to 17 Years | 0 (0.0%) | 0 (0.0%) |
| 18 to 34 Years | 0 (0.0%) | 0 (0.0%) |
| 35 to 64 Years | 0 (0.0%) | 2 (3.8%) |
| 65 to 74 Years | 0 (0.0%) | 0 (0.0%) |
| 75 Years and over | 1 (50.0%) | 2 (33.3%) |
Disability Class: Cognitive Difficulty
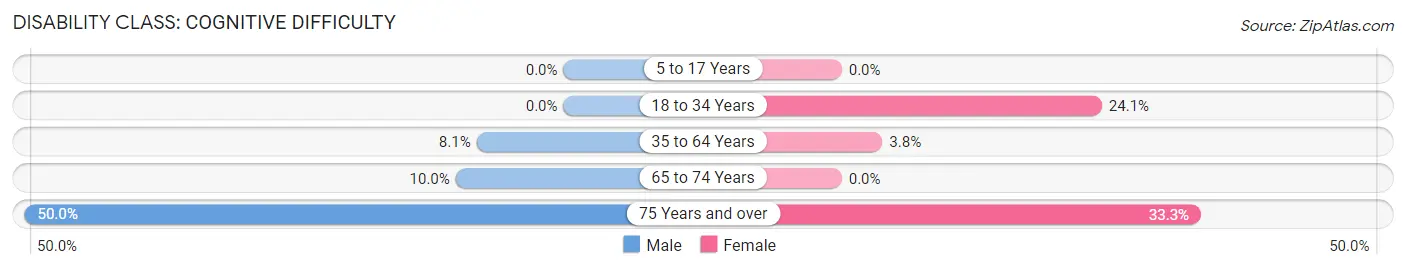
| Age Bracket | Male | Female |
| 5 to 17 Years | 0 (0.0%) | 0 (0.0%) |
| 18 to 34 Years | 0 (0.0%) | 7 (24.1%) |
| 35 to 64 Years | 5 (8.1%) | 2 (3.8%) |
| 65 to 74 Years | 1 (10.0%) | 0 (0.0%) |
| 75 Years and over | 1 (50.0%) | 2 (33.3%) |
Disability Class: Ambulatory Difficulty
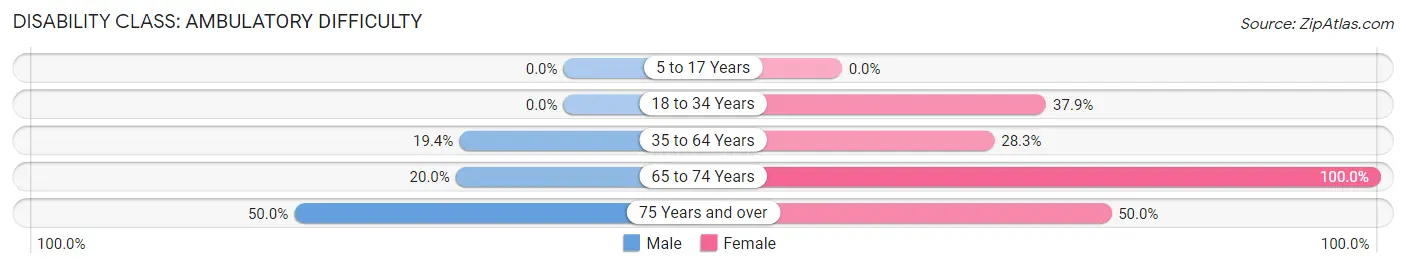
| Age Bracket | Male | Female |
| 5 to 17 Years | 0 (0.0%) | 0 (0.0%) |
| 18 to 34 Years | 0 (0.0%) | 11 (37.9%) |
| 35 to 64 Years | 12 (19.4%) | 15 (28.3%) |
| 65 to 74 Years | 2 (20.0%) | 1 (100.0%) |
| 75 Years and over | 1 (50.0%) | 3 (50.0%) |
Disability Class: Self-Care Difficulty
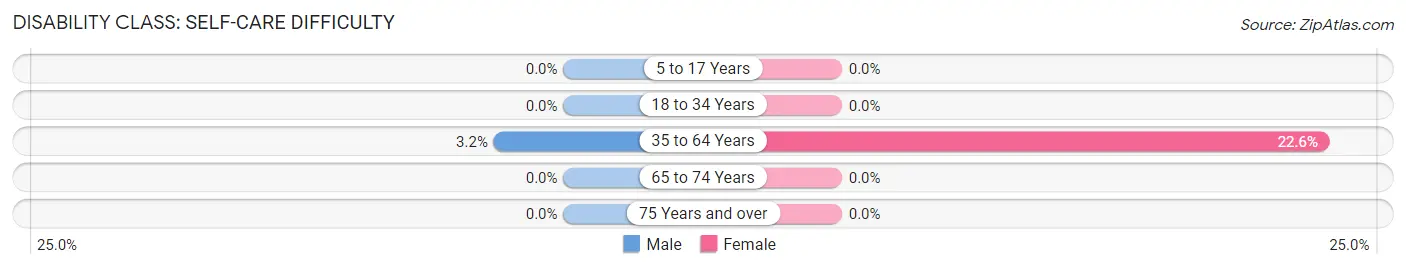
| Age Bracket | Male | Female |
| 5 to 17 Years | 0 (0.0%) | 0 (0.0%) |
| 18 to 34 Years | 0 (0.0%) | 0 (0.0%) |
| 35 to 64 Years | 2 (3.2%) | 12 (22.6%) |
| 65 to 74 Years | 0 (0.0%) | 0 (0.0%) |
| 75 Years and over | 0 (0.0%) | 0 (0.0%) |
Technology Access in Lockbourne
Computing Device Access in Lockbourne
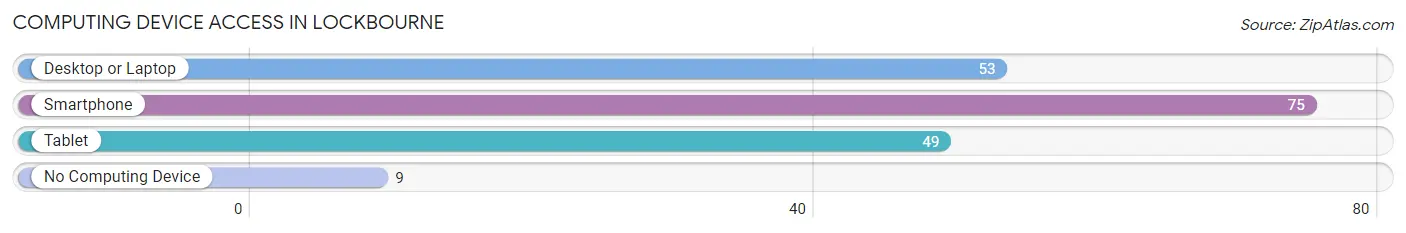
| Device Type | # Households | % Households |
| Desktop or Laptop | 53 | 60.2% |
| Smartphone | 75 | 85.2% |
| Tablet | 49 | 55.7% |
| No Computing Device | 9 | 10.2% |
| Total | 88 | 100.0% |
Internet Access in Lockbourne
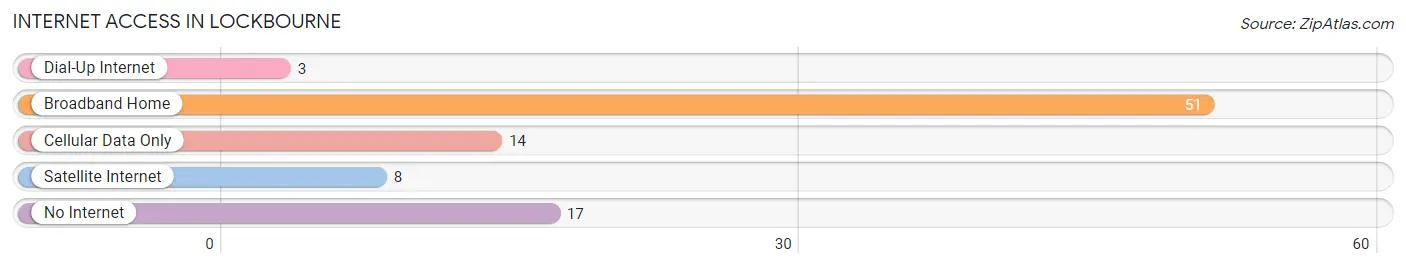
| Internet Type | # Households | % Households |
| Dial-Up Internet | 3 | 3.4% |
| Broadband Home | 51 | 58.0% |
| Cellular Data Only | 14 | 15.9% |
| Satellite Internet | 8 | 9.1% |
| No Internet | 17 | 19.3% |
| Total | 88 | 100.0% |
Lockbourne Summary
Lockbourne is a small village located in Franklin County, Ohio. It is situated approximately 10 miles south of Columbus, the state capital. The village has a population of 1,845 people, according to the 2010 census. The village is part of the Columbus Metropolitan Statistical Area.
History
The area that is now Lockbourne was first settled in 1810 by a group of settlers from Pennsylvania. The village was originally known as Lockbourne Station, named after the nearby Lockbourne Lock, which was built in 1831. The lock was part of the Ohio and Erie Canal, which connected the Ohio River to Lake Erie. The village was officially incorporated in 1851.
In the late 19th century, Lockbourne was a thriving agricultural community. The village was home to several mills, including a flour mill, a sawmill, and a gristmill. The village also had a blacksmith shop, a general store, and a post office.
In the early 20th century, Lockbourne began to experience a decline in population as many of its residents moved to larger cities in search of better job opportunities. The village was also affected by the Great Depression, which caused many businesses to close.
Geography
Lockbourne is located in Franklin County, Ohio. It is situated approximately 10 miles south of Columbus, the state capital. The village is part of the Columbus Metropolitan Statistical Area.
The village is situated on the Scioto River, which flows through the area. The terrain is mostly flat, with some rolling hills. The village is located in a temperate climate zone, with hot summers and cold winters.
Economy
The economy of Lockbourne is largely based on agriculture. The village is home to several farms, which produce a variety of crops, including corn, soybeans, and wheat. The village also has several small businesses, including a grocery store, a hardware store, and a gas station.
The village is also home to several manufacturing companies, including a plastics manufacturer and a metal fabrication company. The village is also home to a number of small businesses, including restaurants, retail stores, and professional services.
Demographics
According to the 2010 census, the population of Lockbourne is 1,845 people. The village has a median household income of $45,000, and the median age is 37. The village is predominantly white, with a small percentage of African-American and Hispanic residents.
The village is served by the Lockbourne Local School District, which consists of two elementary schools, one middle school, and one high school. The village is also home to a branch of the Columbus Metropolitan Library.
Conclusion
Lockbourne is a small village located in Franklin County, Ohio. It is situated approximately 10 miles south of Columbus, the state capital. The village has a population of 1,845 people, according to the 2010 census. The village is part of the Columbus Metropolitan Statistical Area. The economy of Lockbourne is largely based on agriculture, and the village is home to several small businesses. The village is predominantly white, with a small percentage of African-American and Hispanic residents. Lockbourne is served by the Lockbourne Local School District, and is home to a branch of the Columbus Metropolitan Library.
Common Questions
What is Per Capita Income in Lockbourne?
Per Capita income in Lockbourne is $17,607.
What is the Median Family Income in Lockbourne?
Median Family Income in Lockbourne is $40,500.
What is the Median Household income in Lockbourne?
Median Household Income in Lockbourne is $42,500.
What is Income or Wage Gap in Lockbourne?
Income or Wage Gap in Lockbourne is 16.8%.
Women in Lockbourne earn 83.2 cents for every dollar earned by a man.
What is Inequality or Gini Index in Lockbourne?
Inequality or Gini Index in Lockbourne is 0.33.
What is the Total Population of Lockbourne?
Total Population of Lockbourne is 255.
What is the Total Male Population of Lockbourne?
Total Male Population of Lockbourne is 129.
What is the Total Female Population of Lockbourne?
Total Female Population of Lockbourne is 126.
What is the Ratio of Males per 100 Females in Lockbourne?
There are 102.38 Males per 100 Females in Lockbourne.
What is the Ratio of Females per 100 Males in Lockbourne?
There are 97.67 Females per 100 Males in Lockbourne.
What is the Median Population Age in Lockbourne?
Median Population Age in Lockbourne is 38.1 Years.
What is the Average Family Size in Lockbourne
Average Family Size in Lockbourne is 3.3 People.
What is the Average Household Size in Lockbourne
Average Household Size in Lockbourne is 2.9 People.
How Large is the Labor Force in Lockbourne?
There are 88 People in the Labor Forcein in Lockbourne.
What is the Percentage of People in the Labor Force in Lockbourne?
50.3% of People are in the Labor Force in Lockbourne.
What is the Unemployment Rate in Lockbourne?
Unemployment Rate in Lockbourne is 18.2%.