Yorkville, OH Map & Demographics
Yorkville Map
Yorkville Overview
$37,184
PER CAPITA INCOME
$64,375
AVG FAMILY INCOME
$45,592
AVG HOUSEHOLD INCOME
43.9%
WAGE / INCOME GAP [ % ]
56.1¢/ $1
WAGE / INCOME GAP [ $ ]
0.47
INEQUALITY / GINI INDEX
959
TOTAL POPULATION
456
MALE POPULATION
503
FEMALE POPULATION
90.66
MALES / 100 FEMALES
110.31
FEMALES / 100 MALES
47.5
MEDIAN AGE
2.9
AVG FAMILY SIZE
2.2
AVG HOUSEHOLD SIZE
424
LABOR FORCE [ PEOPLE ]
54.9%
PERCENT IN LABOR FORCE
7.3%
UNEMPLOYMENT RATE
Yorkville Zip Codes
Yorkville Area Codes
Income in Yorkville
Income Overview in Yorkville
Per Capita Income in Yorkville is $37,184, while median incomes of families and households are $64,375 and $45,592 respectively.
| Characteristic | Number | Measure |
| Per Capita Income | 959 | $37,184 |
| Median Family Income | 242 | $64,375 |
| Mean Family Income | 242 | $90,783 |
| Median Household Income | 418 | $45,592 |
| Mean Household Income | 418 | $73,985 |
| Income Deficit | 242 | $0 |
| Wage / Income Gap (%) | 959 | 43.89% |
| Wage / Income Gap ($) | 959 | 56.11¢ per $1 |
| Gini / Inequality Index | 959 | 0.47 |
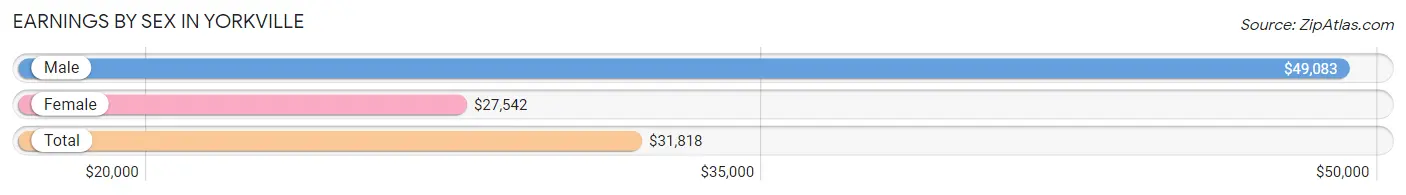
Earnings by Sex in Yorkville
Average Earnings in Yorkville are $31,818, $49,083 for men and $27,542 for women, a difference of 43.9%.
| Sex | Number | Average Earnings |
| Male | 237 (52.9%) | $49,083 |
| Female | 211 (47.1%) | $27,542 |
| Total | 448 (100.0%) | $31,818 |
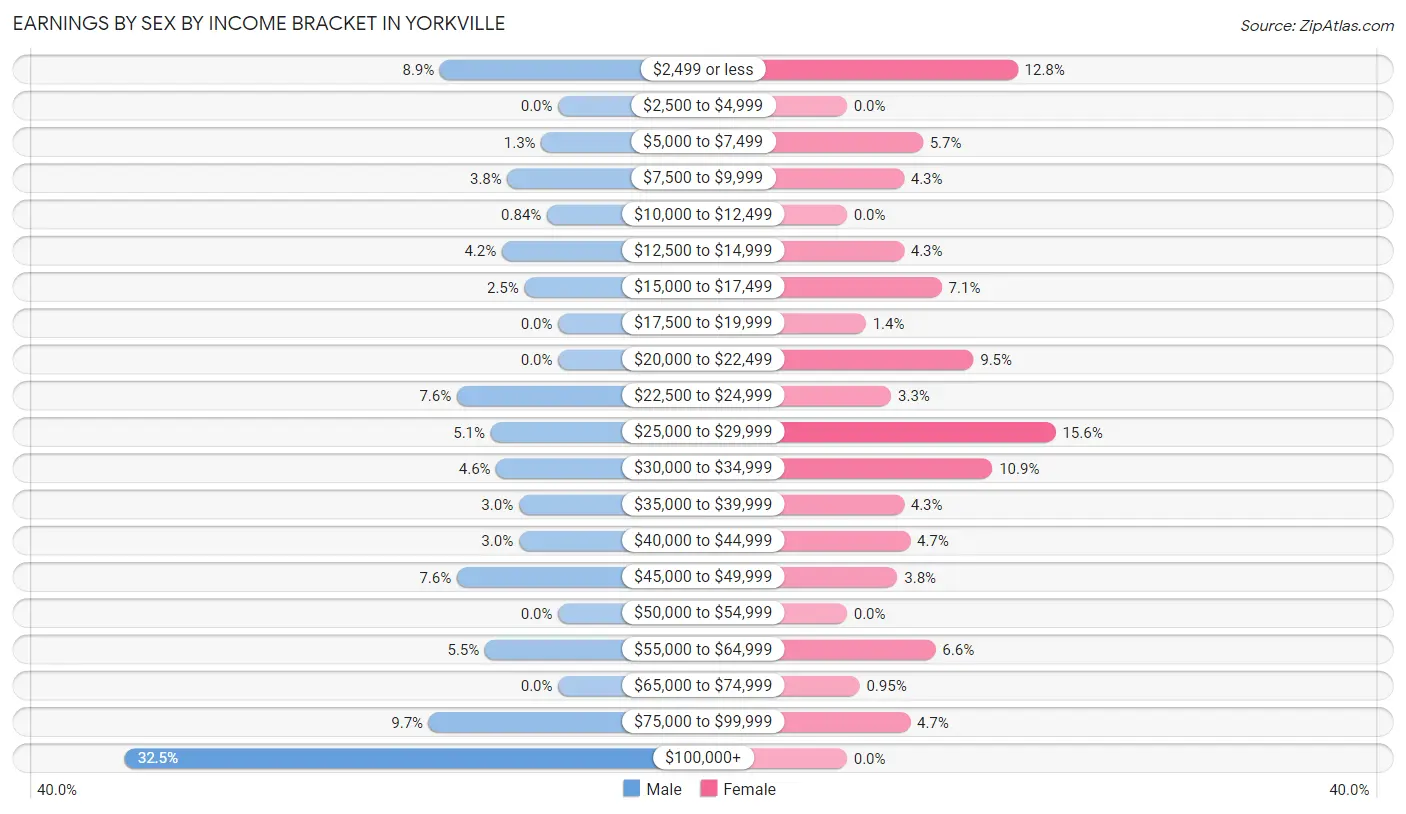
Earnings by Sex by Income Bracket in Yorkville
The most common earnings brackets in Yorkville are $100,000+ for men (77 | 32.5%) and $25,000 to $29,999 for women (33 | 15.6%).
| Income | Male | Female |
| $2,499 or less | 21 (8.9%) | 27 (12.8%) |
| $2,500 to $4,999 | 0 (0.0%) | 0 (0.0%) |
| $5,000 to $7,499 | 3 (1.3%) | 12 (5.7%) |
| $7,500 to $9,999 | 9 (3.8%) | 9 (4.3%) |
| $10,000 to $12,499 | 2 (0.8%) | 0 (0.0%) |
| $12,500 to $14,999 | 10 (4.2%) | 9 (4.3%) |
| $15,000 to $17,499 | 6 (2.5%) | 15 (7.1%) |
| $17,500 to $19,999 | 0 (0.0%) | 3 (1.4%) |
| $20,000 to $22,499 | 0 (0.0%) | 20 (9.5%) |
| $22,500 to $24,999 | 18 (7.6%) | 7 (3.3%) |
| $25,000 to $29,999 | 12 (5.1%) | 33 (15.6%) |
| $30,000 to $34,999 | 11 (4.6%) | 23 (10.9%) |
| $35,000 to $39,999 | 7 (2.9%) | 9 (4.3%) |
| $40,000 to $44,999 | 7 (2.9%) | 10 (4.7%) |
| $45,000 to $49,999 | 18 (7.6%) | 8 (3.8%) |
| $50,000 to $54,999 | 0 (0.0%) | 0 (0.0%) |
| $55,000 to $64,999 | 13 (5.5%) | 14 (6.6%) |
| $65,000 to $74,999 | 0 (0.0%) | 2 (0.9%) |
| $75,000 to $99,999 | 23 (9.7%) | 10 (4.7%) |
| $100,000+ | 77 (32.5%) | 0 (0.0%) |
| Total | 237 (100.0%) | 211 (100.0%) |
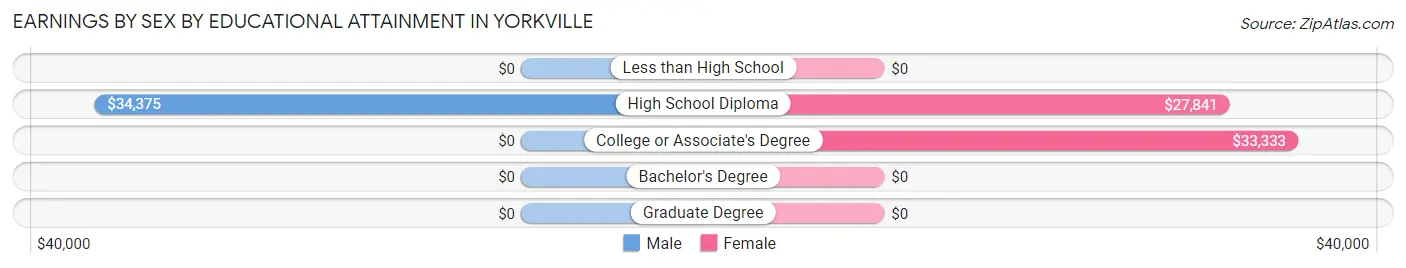
Earnings by Sex by Educational Attainment in Yorkville
Average earnings in Yorkville are $49,833 for men and $29,602 for women, a difference of 40.6%. Men with an educational attainment of high school diploma enjoy the highest average annual earnings of $34,375, while those with high school diploma education earn the least with $34,375. Women with an educational attainment of college or associate's degree earn the most with the average annual earnings of $33,333, while those with high school diploma education have the smallest earnings of $27,841.
| Educational Attainment | Male Income | Female Income |
| Less than High School | - | - |
| High School Diploma | $34,375 | $27,841 |
| College or Associate's Degree | - | - |
| Bachelor's Degree | - | - |
| Graduate Degree | - | - |
| Total | $49,833 | $29,602 |
Family Income in Yorkville
Family Income Brackets in Yorkville
According to the Yorkville family income data, there are 57 families falling into the $35,000 to $49,999 income range, which is the most common income bracket and makes up 23.5% of all families. Conversely, the $15,000 to $24,999 income bracket is the least frequent group with only 2 families (0.8%) belonging to this category.
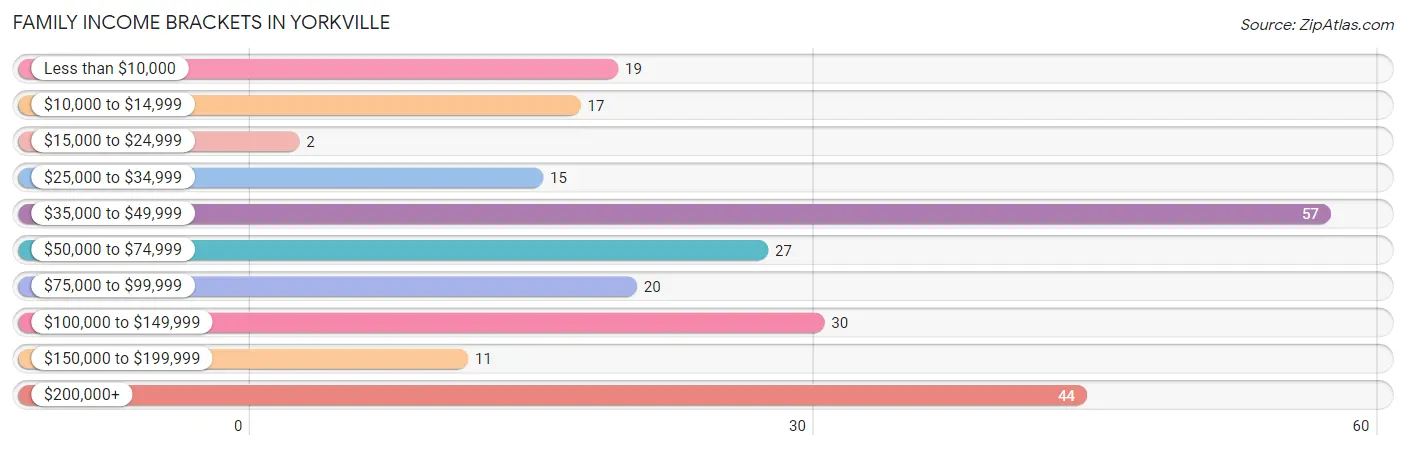
| Income Bracket | # Families | % Families |
| Less than $10,000 | 19 | 7.9% |
| $10,000 to $14,999 | 17 | 7.0% |
| $15,000 to $24,999 | 2 | 0.8% |
| $25,000 to $34,999 | 15 | 6.2% |
| $35,000 to $49,999 | 57 | 23.6% |
| $50,000 to $74,999 | 27 | 11.2% |
| $75,000 to $99,999 | 20 | 8.3% |
| $100,000 to $149,999 | 30 | 12.4% |
| $150,000 to $199,999 | 11 | 4.5% |
| $200,000+ | 44 | 18.2% |
Family Income by Famaliy Size in Yorkville
2-person families (162 | 66.9%) account for the highest median family income in Yorkville with $86,250 per family, while 2-person families (162 | 66.9%) have the highest median income of $43,125 per family member.
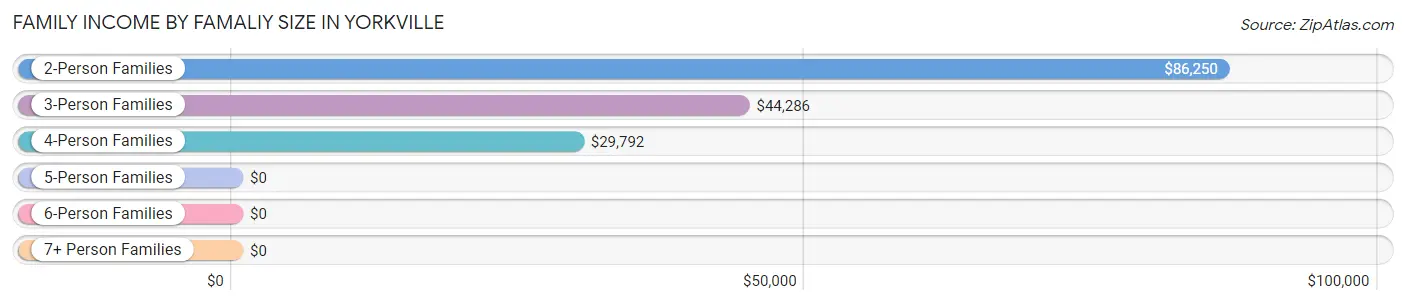
| Income Bracket | # Families | Median Income |
| 2-Person Families | 162 (66.9%) | $86,250 |
| 3-Person Families | 26 (10.7%) | $44,286 |
| 4-Person Families | 45 (18.6%) | $29,792 |
| 5-Person Families | 6 (2.5%) | $0 |
| 6-Person Families | 3 (1.2%) | $0 |
| 7+ Person Families | 0 (0.0%) | $0 |
| Total | 242 (100.0%) | $64,375 |
Family Income by Number of Earners in Yorkville
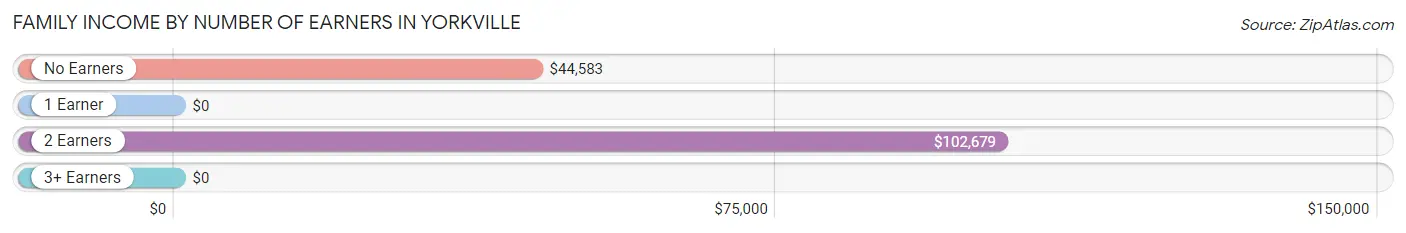
| Number of Earners | # Families | Median Income |
| No Earners | 41 (16.9%) | $44,583 |
| 1 Earner | 130 (53.7%) | $0 |
| 2 Earners | 59 (24.4%) | $102,679 |
| 3+ Earners | 12 (5.0%) | $0 |
| Total | 242 (100.0%) | $64,375 |
Household Income in Yorkville
Household Income Brackets in Yorkville
With 97 households falling in the category, the $35,000 to $49,999 income range is the most frequent in Yorkville, accounting for 23.2% of all households. In contrast, only 11 households (2.6%) fall into the $150,000 to $199,999 income bracket, making it the least populous group.
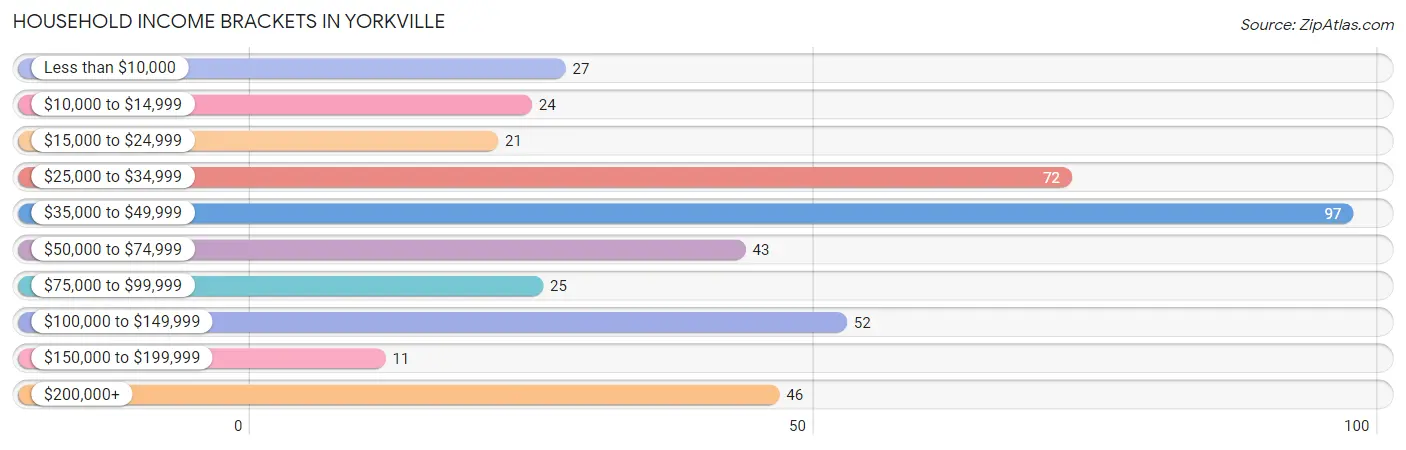
| Income Bracket | # Households | % Households |
| Less than $10,000 | 27 | 6.5% |
| $10,000 to $14,999 | 24 | 5.7% |
| $15,000 to $24,999 | 21 | 5.0% |
| $25,000 to $34,999 | 72 | 17.2% |
| $35,000 to $49,999 | 97 | 23.2% |
| $50,000 to $74,999 | 43 | 10.3% |
| $75,000 to $99,999 | 25 | 6.0% |
| $100,000 to $149,999 | 52 | 12.4% |
| $150,000 to $199,999 | 11 | 2.6% |
| $200,000+ | 46 | 11.0% |
Household Income by Householder Age in Yorkville
The median household income in Yorkville is $45,592, with the highest median household income of $44,375 found in the 65+ years age bracket for the primary householder. A total of 156 households (37.3%) fall into this category. Meanwhile, the 15 to 24 years age bracket for the primary householder has the lowest median household income of $0, with 6 households (1.4%) in this group.
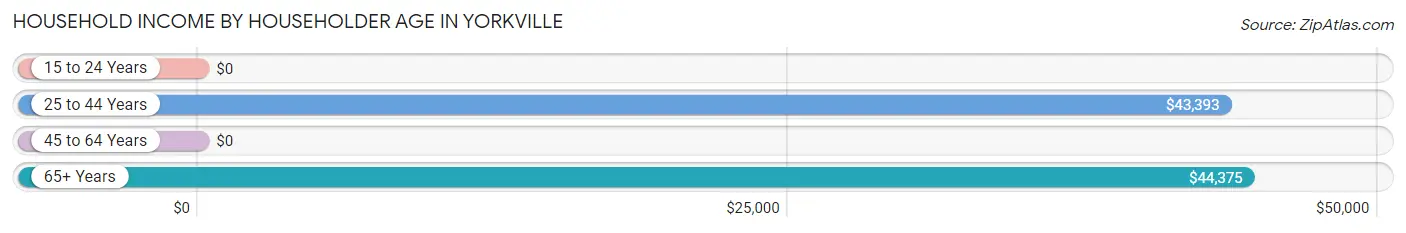
| Income Bracket | # Households | Median Income |
| 15 to 24 Years | 6 (1.4%) | $0 |
| 25 to 44 Years | 97 (23.2%) | $43,393 |
| 45 to 64 Years | 159 (38.0%) | $0 |
| 65+ Years | 156 (37.3%) | $44,375 |
| Total | 418 (100.0%) | $45,592 |
Poverty in Yorkville
Income Below Poverty by Sex and Age in Yorkville
With 13.7% poverty level for males and 21.5% for females among the residents of Yorkville, 12 to 14 year old males and 12 to 14 year old females are the most vulnerable to poverty, with 10 males (58.8%) and 4 females (100.0%) in their respective age groups living below the poverty level.
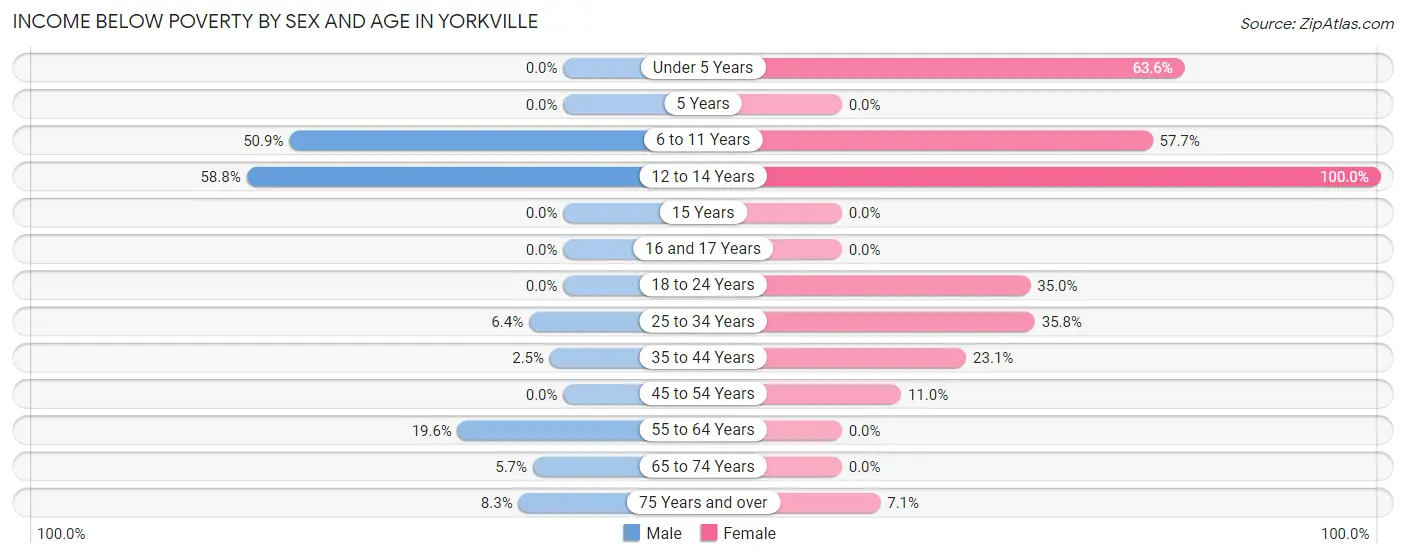
| Age Bracket | Male | Female |
| Under 5 Years | 0 (0.0%) | 28 (63.6%) |
| 5 Years | 0 (0.0%) | 0 (0.0%) |
| 6 to 11 Years | 29 (50.9%) | 15 (57.7%) |
| 12 to 14 Years | 10 (58.8%) | 4 (100.0%) |
| 15 Years | 0 (0.0%) | 0 (0.0%) |
| 16 and 17 Years | 0 (0.0%) | 0 (0.0%) |
| 18 to 24 Years | 0 (0.0%) | 14 (35.0%) |
| 25 to 34 Years | 3 (6.4%) | 24 (35.8%) |
| 35 to 44 Years | 1 (2.5%) | 6 (23.1%) |
| 45 to 54 Years | 0 (0.0%) | 10 (11.0%) |
| 55 to 64 Years | 10 (19.6%) | 0 (0.0%) |
| 65 to 74 Years | 3 (5.7%) | 0 (0.0%) |
| 75 Years and over | 4 (8.3%) | 3 (7.1%) |
| Total | 60 (13.7%) | 104 (21.5%) |
Income Above Poverty by Sex and Age in Yorkville
According to the poverty statistics in Yorkville, males aged under 5 years and females aged 5 years are the age groups that are most secure financially, with 100.0% of males and 100.0% of females in these age groups living above the poverty line.
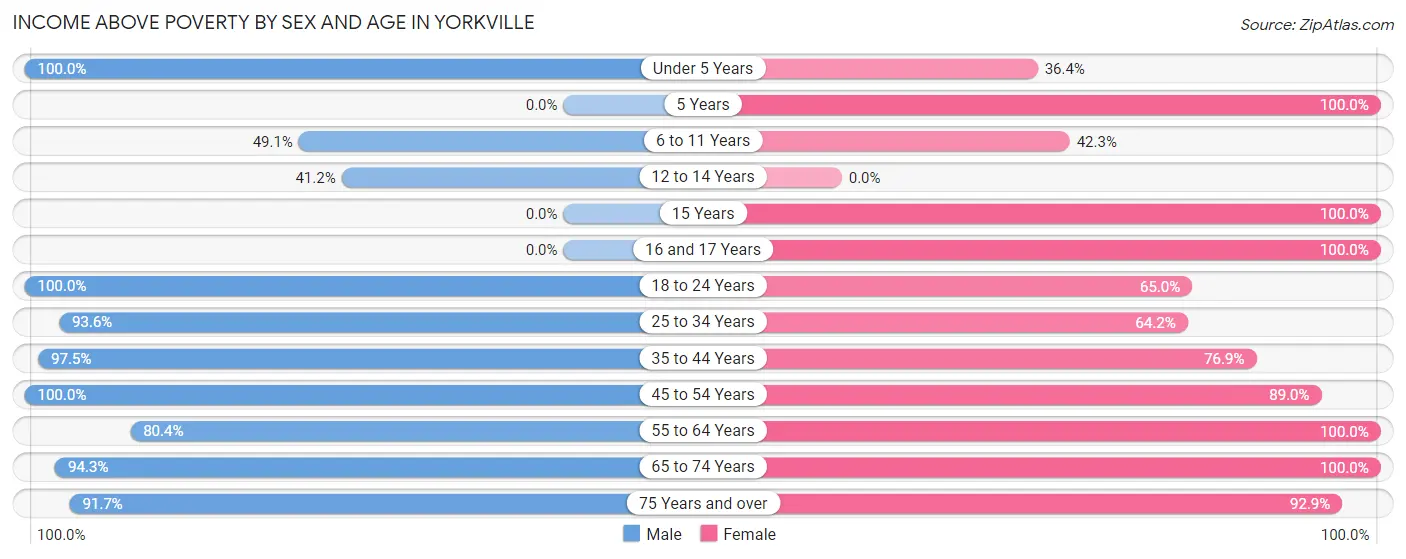
| Age Bracket | Male | Female |
| Under 5 Years | 17 (100.0%) | 16 (36.4%) |
| 5 Years | 0 (0.0%) | 3 (100.0%) |
| 6 to 11 Years | 28 (49.1%) | 11 (42.3%) |
| 12 to 14 Years | 7 (41.2%) | 0 (0.0%) |
| 15 Years | 0 (0.0%) | 4 (100.0%) |
| 16 and 17 Years | 0 (0.0%) | 20 (100.0%) |
| 18 to 24 Years | 9 (100.0%) | 26 (65.0%) |
| 25 to 34 Years | 44 (93.6%) | 43 (64.2%) |
| 35 to 44 Years | 39 (97.5%) | 20 (76.9%) |
| 45 to 54 Years | 99 (100.0%) | 81 (89.0%) |
| 55 to 64 Years | 41 (80.4%) | 41 (100.0%) |
| 65 to 74 Years | 50 (94.3%) | 76 (100.0%) |
| 75 Years and over | 44 (91.7%) | 39 (92.9%) |
| Total | 378 (86.3%) | 380 (78.5%) |
Income Below Poverty Among Married-Couple Families in Yorkville
The poverty statistics for married-couple families in Yorkville show that 7.6% or 14 of the total 183 families live below the poverty line. Families with 3 or 4 children have the highest poverty rate of 66.7%, comprising of 6 families. On the other hand, families with no children have the lowest poverty rate of 0.0%, which includes 0 families.
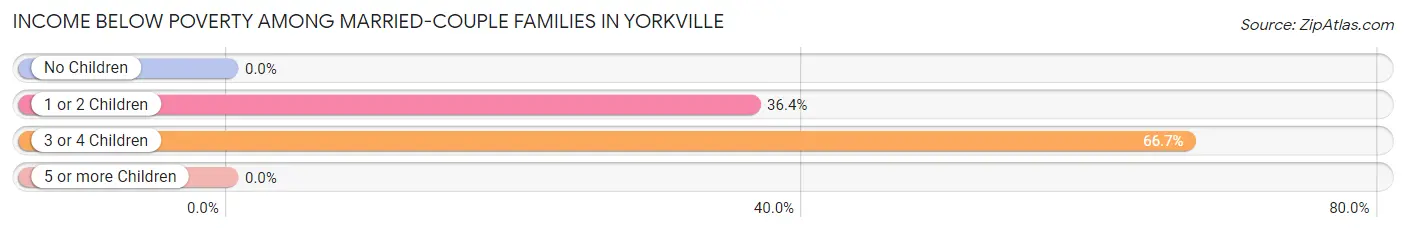
| Children | Above Poverty | Below Poverty |
| No Children | 152 (100.0%) | 0 (0.0%) |
| 1 or 2 Children | 14 (63.6%) | 8 (36.4%) |
| 3 or 4 Children | 3 (33.3%) | 6 (66.7%) |
| 5 or more Children | 0 (0.0%) | 0 (0.0%) |
| Total | 169 (92.3%) | 14 (7.6%) |
Income Below Poverty Among Single-Parent Households in Yorkville
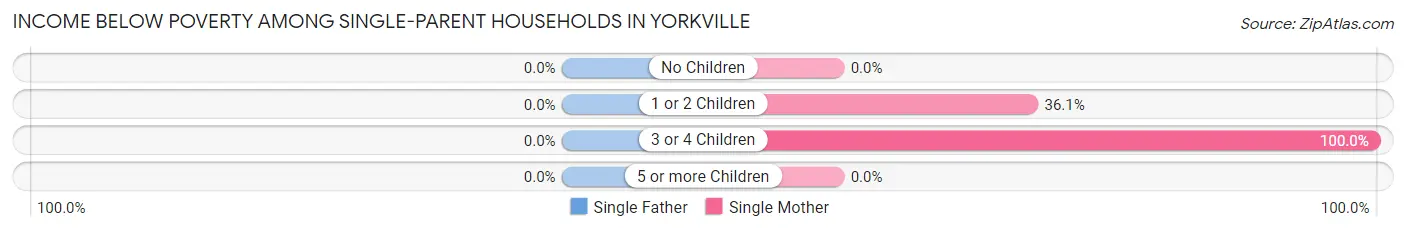
| Children | Single Father | Single Mother |
| No Children | 0 (0.0%) | 0 (0.0%) |
| 1 or 2 Children | 0 (0.0%) | 13 (36.1%) |
| 3 or 4 Children | 0 (0.0%) | 9 (100.0%) |
| 5 or more Children | 0 (0.0%) | 0 (0.0%) |
| Total | 0 (0.0%) | 22 (41.5%) |
Income Below Poverty Among Married-Couple vs Single-Parent Households in Yorkville
The poverty data for Yorkville shows that 14 of the married-couple family households (7.6%) and 22 of the single-parent households (37.3%) are living below the poverty level. Within the married-couple family households, those with 3 or 4 children have the highest poverty rate, with 6 households (66.7%) falling below the poverty line. Among the single-parent households, those with 3 or 4 children have the highest poverty rate, with 9 household (60.0%) living below poverty.
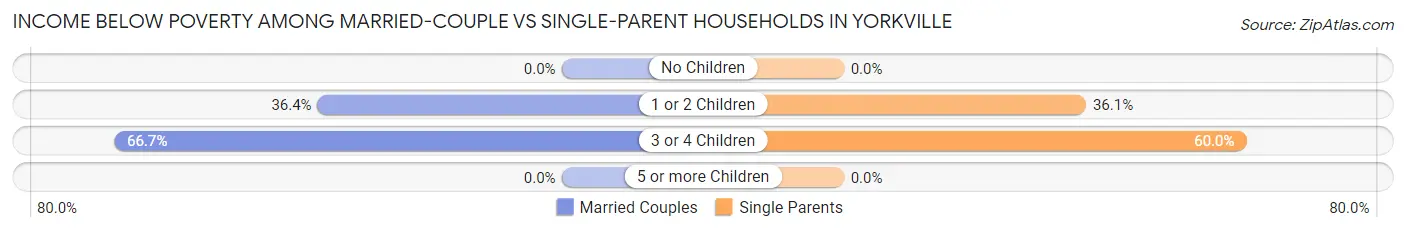
| Children | Married-Couple Families | Single-Parent Households |
| No Children | 0 (0.0%) | 0 (0.0%) |
| 1 or 2 Children | 8 (36.4%) | 13 (36.1%) |
| 3 or 4 Children | 6 (66.7%) | 9 (60.0%) |
| 5 or more Children | 0 (0.0%) | 0 (0.0%) |
| Total | 14 (7.6%) | 22 (37.3%) |
Race in Yorkville
The most populous races in Yorkville are White / Caucasian (860 | 89.7%), Two or more Races (89 | 9.3%), and Hispanic or Latino (15 | 1.6%).
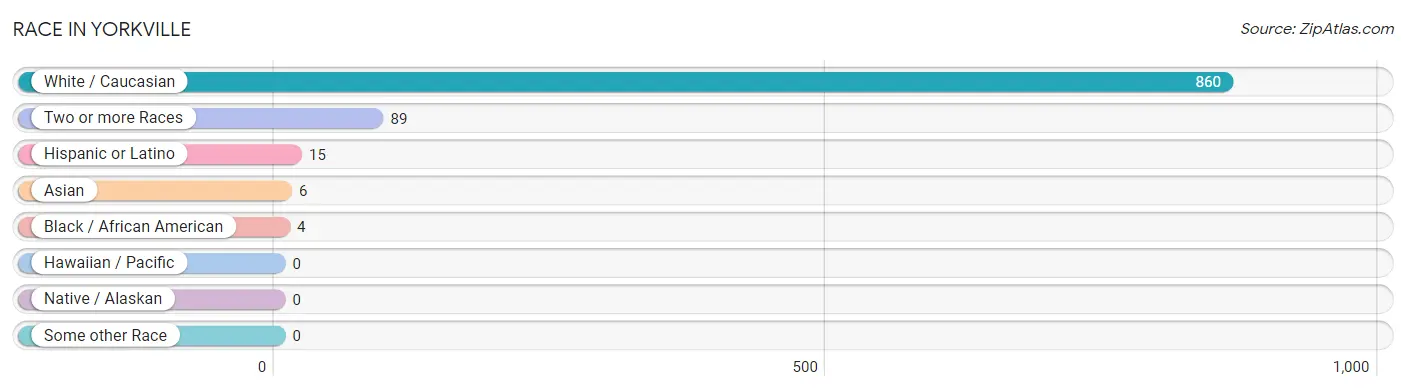
| Race | # Population | % Population |
| Asian | 6 | 0.6% |
| Black / African American | 4 | 0.4% |
| Hawaiian / Pacific | 0 | 0.0% |
| Hispanic or Latino | 15 | 1.6% |
| Native / Alaskan | 0 | 0.0% |
| White / Caucasian | 860 | 89.7% |
| Two or more Races | 89 | 9.3% |
| Some other Race | 0 | 0.0% |
| Total | 959 | 100.0% |
Ancestry in Yorkville
The most populous ancestries reported in Yorkville are Italian (144 | 15.0%), German (110 | 11.5%), Irish (92 | 9.6%), English (89 | 9.3%), and Greek (61 | 6.4%), together accounting for 51.7% of all Yorkville residents.
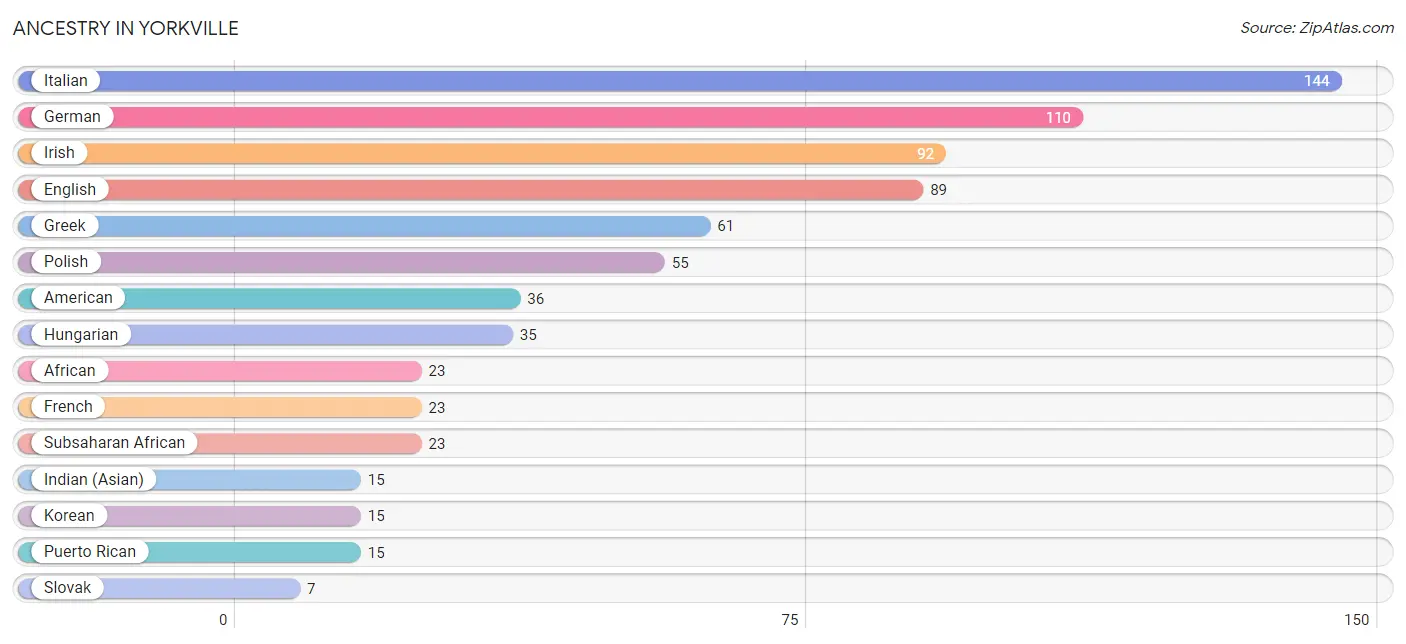
| Ancestry | # Population | % Population |
| African | 23 | 2.4% |
| American | 36 | 3.7% |
| Blackfeet | 3 | 0.3% |
| Burmese | 6 | 0.6% |
| Cherokee | 3 | 0.3% |
| Dutch | 2 | 0.2% |
| English | 89 | 9.3% |
| French | 23 | 2.4% |
| German | 110 | 11.5% |
| Greek | 61 | 6.4% |
| Hungarian | 35 | 3.6% |
| Indian (Asian) | 15 | 1.6% |
| Irish | 92 | 9.6% |
| Italian | 144 | 15.0% |
| Korean | 15 | 1.6% |
| Polish | 55 | 5.7% |
| Puerto Rican | 15 | 1.6% |
| Russian | 3 | 0.3% |
| Scotch-Irish | 3 | 0.3% |
| Serbian | 2 | 0.2% |
| Slovak | 7 | 0.7% |
| Subsaharan African | 23 | 2.4% | View All 22 Rows |
Immigrants in Yorkville
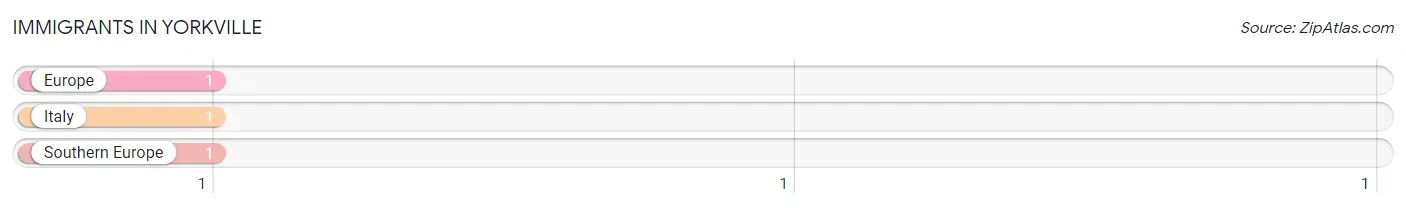
The most numerous immigrant groups reported in Yorkville came from Europe (1 | 0.1%), Italy (1 | 0.1%), and Southern Europe (1 | 0.1%), together accounting for 0.3% of all Yorkville residents.
| Immigration Origin | # Population | % Population |
| Europe | 1 | 0.1% |
| Italy | 1 | 0.1% |
| Southern Europe | 1 | 0.1% | View All 3 Rows |
Sex and Age in Yorkville
Sex and Age in Yorkville
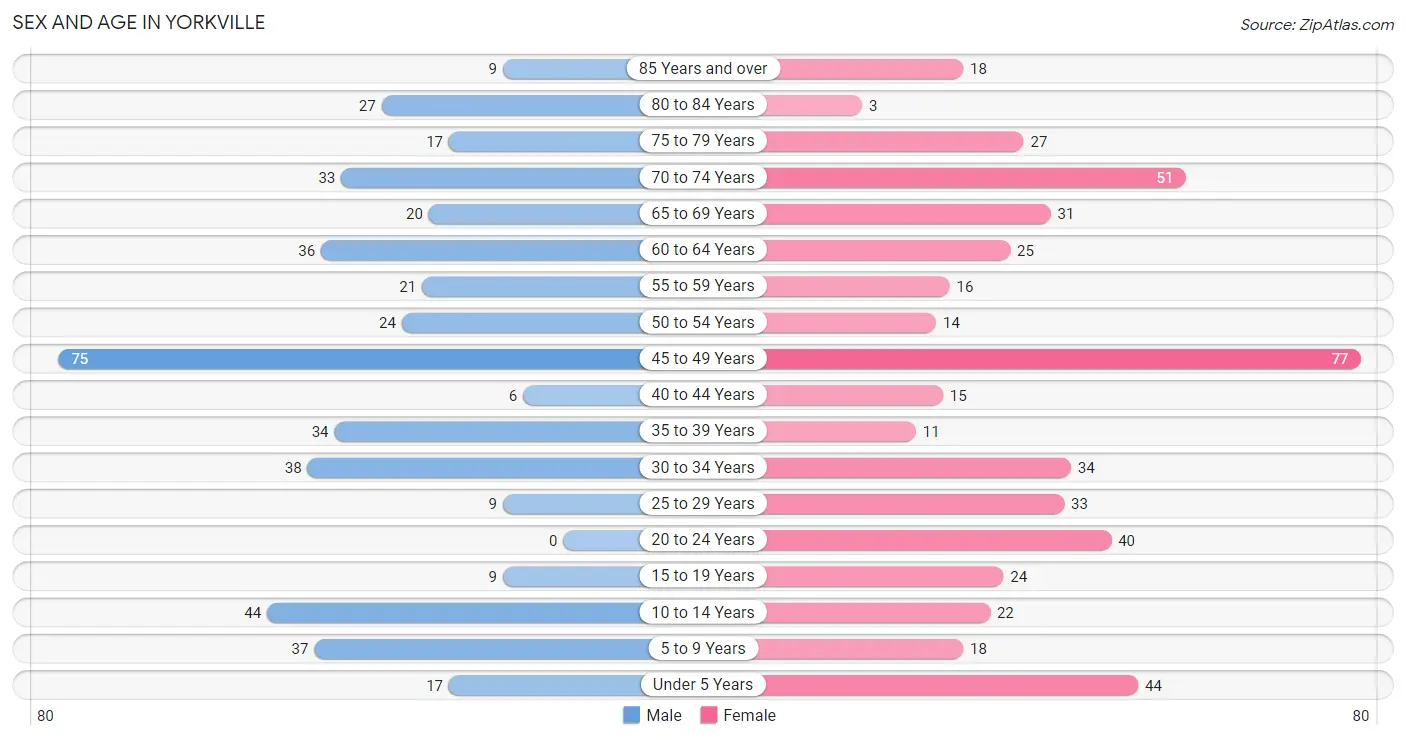
The most populous age groups in Yorkville are 45 to 49 Years (75 | 16.5%) for men and 45 to 49 Years (77 | 15.3%) for women.
| Age Bracket | Male | Female |
| Under 5 Years | 17 (3.7%) | 44 (8.7%) |
| 5 to 9 Years | 37 (8.1%) | 18 (3.6%) |
| 10 to 14 Years | 44 (9.7%) | 22 (4.4%) |
| 15 to 19 Years | 9 (2.0%) | 24 (4.8%) |
| 20 to 24 Years | 0 (0.0%) | 40 (8.0%) |
| 25 to 29 Years | 9 (2.0%) | 33 (6.6%) |
| 30 to 34 Years | 38 (8.3%) | 34 (6.8%) |
| 35 to 39 Years | 34 (7.5%) | 11 (2.2%) |
| 40 to 44 Years | 6 (1.3%) | 15 (3.0%) |
| 45 to 49 Years | 75 (16.5%) | 77 (15.3%) |
| 50 to 54 Years | 24 (5.3%) | 14 (2.8%) |
| 55 to 59 Years | 21 (4.6%) | 16 (3.2%) |
| 60 to 64 Years | 36 (7.9%) | 25 (5.0%) |
| 65 to 69 Years | 20 (4.4%) | 31 (6.2%) |
| 70 to 74 Years | 33 (7.2%) | 51 (10.1%) |
| 75 to 79 Years | 17 (3.7%) | 27 (5.4%) |
| 80 to 84 Years | 27 (5.9%) | 3 (0.6%) |
| 85 Years and over | 9 (2.0%) | 18 (3.6%) |
| Total | 456 (100.0%) | 503 (100.0%) |
Families and Households in Yorkville
Median Family Size in Yorkville
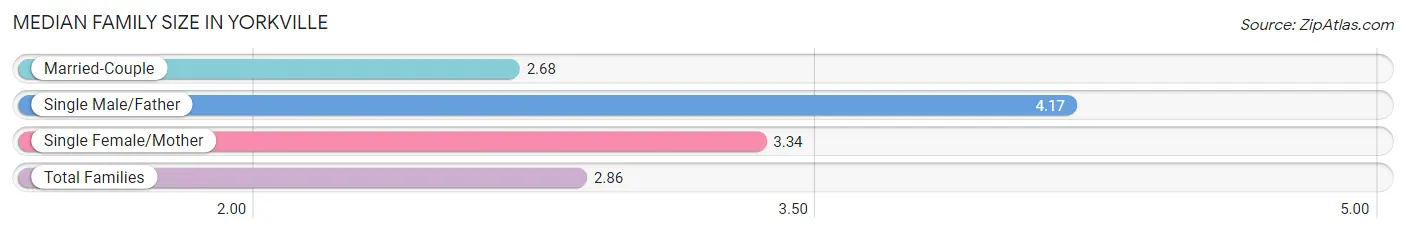
The median family size in Yorkville is 2.86 persons per family, with single male/father families (6 | 2.5%) accounting for the largest median family size of 4.17 persons per family. On the other hand, married-couple families (183 | 75.6%) represent the smallest median family size with 2.68 persons per family.
| Family Type | # Families | Family Size |
| Married-Couple | 183 (75.6%) | 2.68 |
| Single Male/Father | 6 (2.5%) | 4.17 |
| Single Female/Mother | 53 (21.9%) | 3.34 |
| Total Families | 242 (100.0%) | 2.86 |
Median Household Size in Yorkville
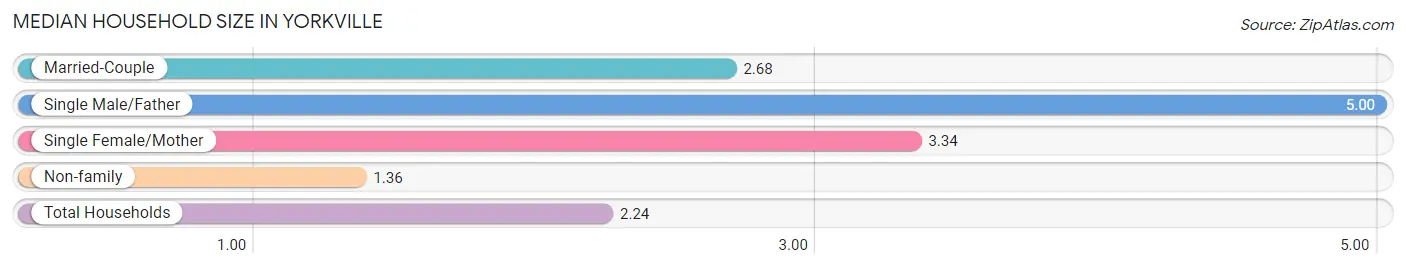
The median household size in Yorkville is 2.24 persons per household, with single male/father households (6 | 1.4%) accounting for the largest median household size of 5 persons per household. non-family households (176 | 42.1%) represent the smallest median household size with 1.36 persons per household.
| Household Type | # Households | Household Size |
| Married-Couple | 183 (43.8%) | 2.68 |
| Single Male/Father | 6 (1.4%) | 5.00 |
| Single Female/Mother | 53 (12.7%) | 3.34 |
| Non-family | 176 (42.1%) | 1.36 |
| Total Households | 418 (100.0%) | 2.24 |
Household Size by Marriage Status in Yorkville
Out of a total of 418 households in Yorkville, 242 (57.9%) are family households, while 176 (42.1%) are nonfamily households. The most numerous type of family households are 2-person households, comprising 162, and the most common type of nonfamily households are 1-person households, comprising 151.
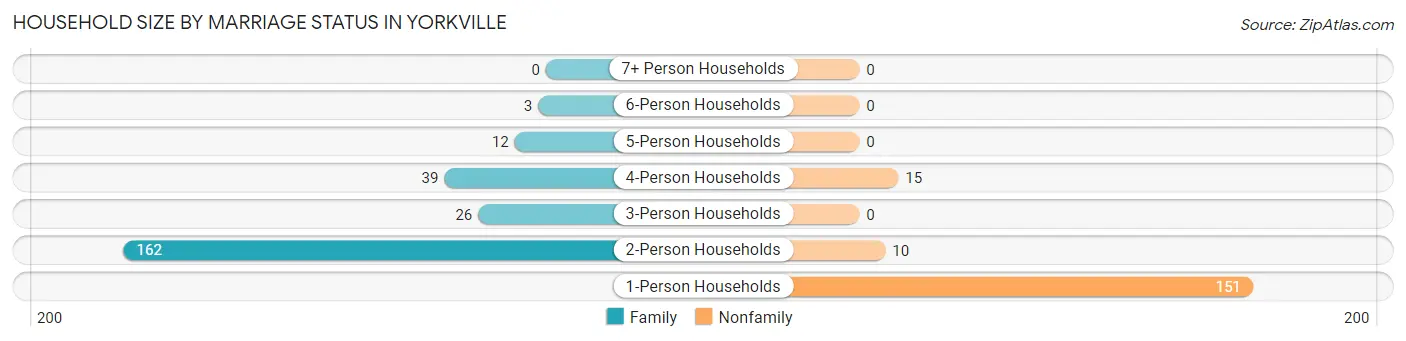
| Household Size | Family Households | Nonfamily Households |
| 1-Person Households | - | 151 (36.1%) |
| 2-Person Households | 162 (38.8%) | 10 (2.4%) |
| 3-Person Households | 26 (6.2%) | 0 (0.0%) |
| 4-Person Households | 39 (9.3%) | 15 (3.6%) |
| 5-Person Households | 12 (2.9%) | 0 (0.0%) |
| 6-Person Households | 3 (0.7%) | 0 (0.0%) |
| 7+ Person Households | 0 (0.0%) | 0 (0.0%) |
| Total | 242 (57.9%) | 176 (42.1%) |
Female Fertility in Yorkville
Fertility by Age in Yorkville
| Age Bracket | Women with Births | Births / 1,000 Women |
| 15 to 19 years | 0 (0.0%) | 0.0 |
| 20 to 34 years | 0 (0.0%) | 0.0 |
| 35 to 50 years | 0 (0.0%) | 0.0 |
| Total | 0 (0.0%) | 0.0 |
Fertility by Age by Marriage Status in Yorkville
| Age Bracket | Married | Unmarried |
| 15 to 19 years | 0 (0.0%) | 0 (0.0%) |
| 20 to 34 years | 0 (0.0%) | 0 (0.0%) |
| 35 to 50 years | 0 (0.0%) | 0 (0.0%) |
| Total | 0 (0.0%) | 0 (0.0%) |
Fertility by Education in Yorkville
| Educational Attainment | Women with Births | Births / 1,000 Women |
| Less than High School | 0 (0.0%) | 0.0 |
| High School Diploma | 0 (0.0%) | 0.0 |
| College or Associate's Degree | 0 (0.0%) | 0.0 |
| Bachelor's Degree | 0 (0.0%) | 0.0 |
| Graduate Degree | 0 (0.0%) | 0.0 |
| Total | 0 (0.0%) | 0.0 |
Fertility by Education by Marriage Status in Yorkville
| Educational Attainment | Married | Unmarried |
| Less than High School | 0 (0.0%) | 0 (0.0%) |
| High School Diploma | 0 (0.0%) | 0 (0.0%) |
| College or Associate's Degree | 0 (0.0%) | 0 (0.0%) |
| Bachelor's Degree | 0 (0.0%) | 0 (0.0%) |
| Graduate Degree | 0 (0.0%) | 0 (0.0%) |
| Total | 0 (0.0%) | 0 (0.0%) |
Employment Characteristics in Yorkville
Employment by Class of Employer in Yorkville
Among the 390 employed individuals in Yorkville, private company employees (318 | 81.5%), local government employees (42 | 10.8%), and self-employed (not incorporated) (15 | 3.8%) make up the most common classes of employment.
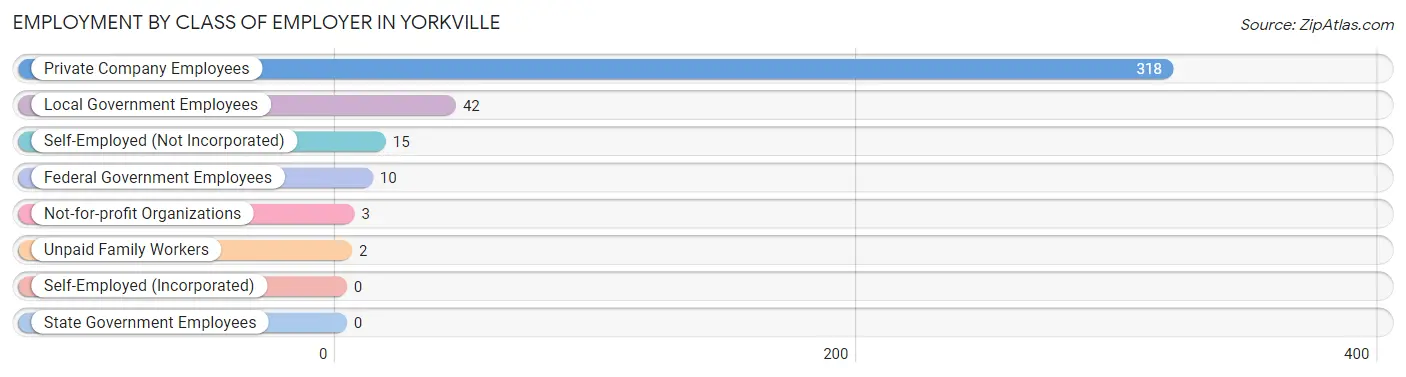
| Employer Class | # Employees | % Employees |
| Private Company Employees | 318 | 81.5% |
| Self-Employed (Incorporated) | 0 | 0.0% |
| Self-Employed (Not Incorporated) | 15 | 3.8% |
| Not-for-profit Organizations | 3 | 0.8% |
| Local Government Employees | 42 | 10.8% |
| State Government Employees | 0 | 0.0% |
| Federal Government Employees | 10 | 2.6% |
| Unpaid Family Workers | 2 | 0.5% |
| Total | 390 | 100.0% |
Employment Status by Age in Yorkville
According to the labor force statistics for Yorkville, out of the total population over 16 years of age (773), 54.9% or 424 individuals are in the labor force, with 7.3% or 31 of them unemployed. The age group with the highest labor force participation rate is 55 to 59 years, with 89.2% or 33 individuals in the labor force. Within the labor force, the 35 to 44 years age range has the highest percentage of unemployed individuals, with 28.6% or 14 of them being unemployed.
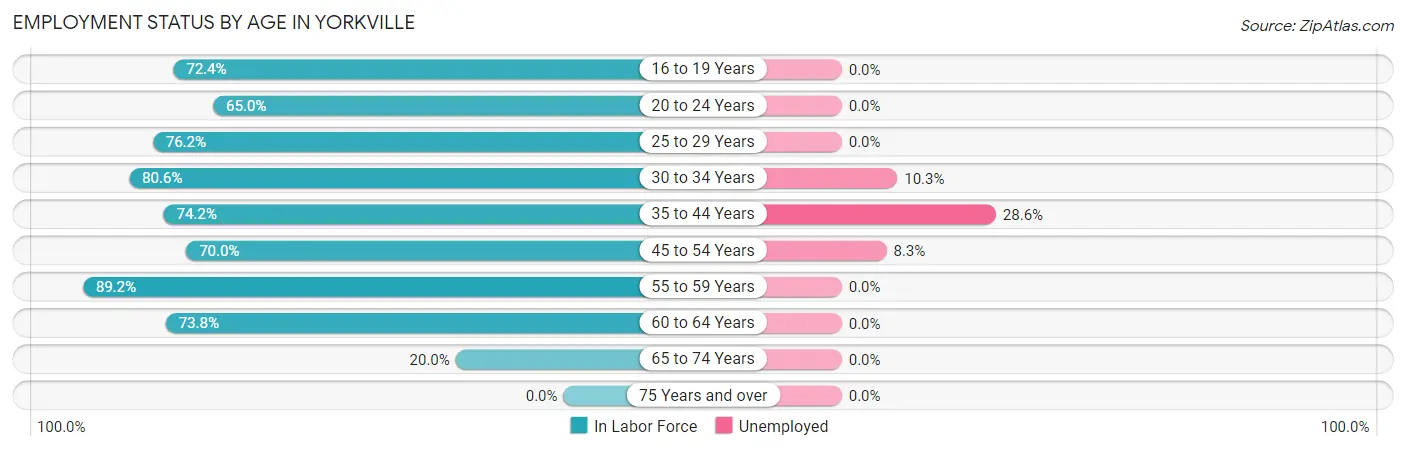
| Age Bracket | In Labor Force | Unemployed |
| 16 to 19 Years | 21 (72.4%) | 0 (0.0%) |
| 20 to 24 Years | 26 (65.0%) | 0 (0.0%) |
| 25 to 29 Years | 32 (76.2%) | 0 (0.0%) |
| 30 to 34 Years | 58 (80.6%) | 6 (10.3%) |
| 35 to 44 Years | 49 (74.2%) | 14 (28.6%) |
| 45 to 54 Years | 133 (70.0%) | 11 (8.3%) |
| 55 to 59 Years | 33 (89.2%) | 0 (0.0%) |
| 60 to 64 Years | 45 (73.8%) | 0 (0.0%) |
| 65 to 74 Years | 27 (20.0%) | 0 (0.0%) |
| 75 Years and over | 0 (0.0%) | 0 (0.0%) |
| Total | 424 (54.9%) | 31 (7.3%) |
Employment Status by Educational Attainment in Yorkville
According to labor force statistics for Yorkville, 74.8% of individuals (350) out of the total population between 25 and 64 years of age (468) are in the labor force, with 8.9% or 31 of them being unemployed. The group with the highest labor force participation rate are those with the educational attainment of bachelor's degree or higher, with 100.0% or 11 individuals in the labor force. Within the labor force, individuals with less than high school education have the highest percentage of unemployment, with 26.9% or 7 of them being unemployed.
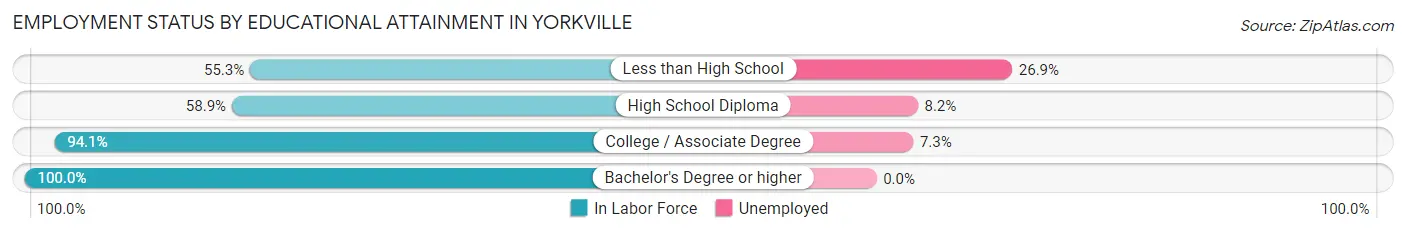
| Educational Attainment | In Labor Force | Unemployed |
| Less than High School | 26 (55.3%) | 13 (26.9%) |
| High School Diploma | 122 (58.9%) | 17 (8.2%) |
| College / Associate Degree | 191 (94.1%) | 15 (7.3%) |
| Bachelor's Degree or higher | 11 (100.0%) | 0 (0.0%) |
| Total | 350 (74.8%) | 42 (8.9%) |
Employment Occupations by Sex in Yorkville
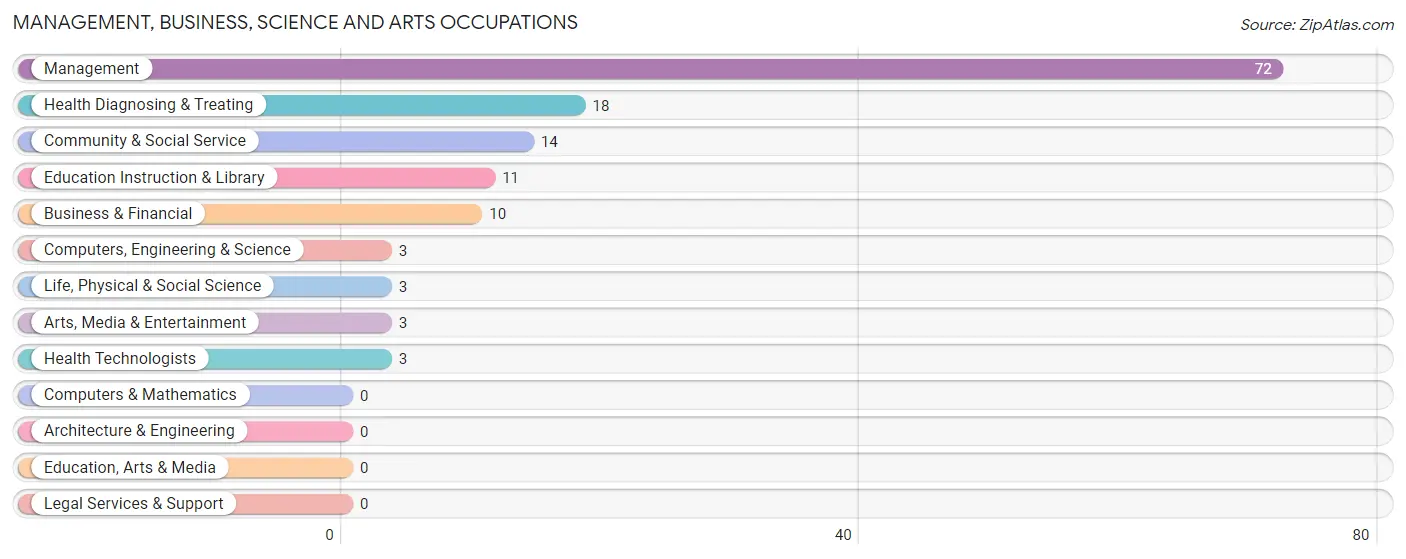
Management, Business, Science and Arts Occupations
The most common Management, Business, Science and Arts occupations in Yorkville are Management (72 | 18.3%), Health Diagnosing & Treating (18 | 4.6%), Community & Social Service (14 | 3.6%), Education Instruction & Library (11 | 2.8%), and Business & Financial (10 | 2.5%).
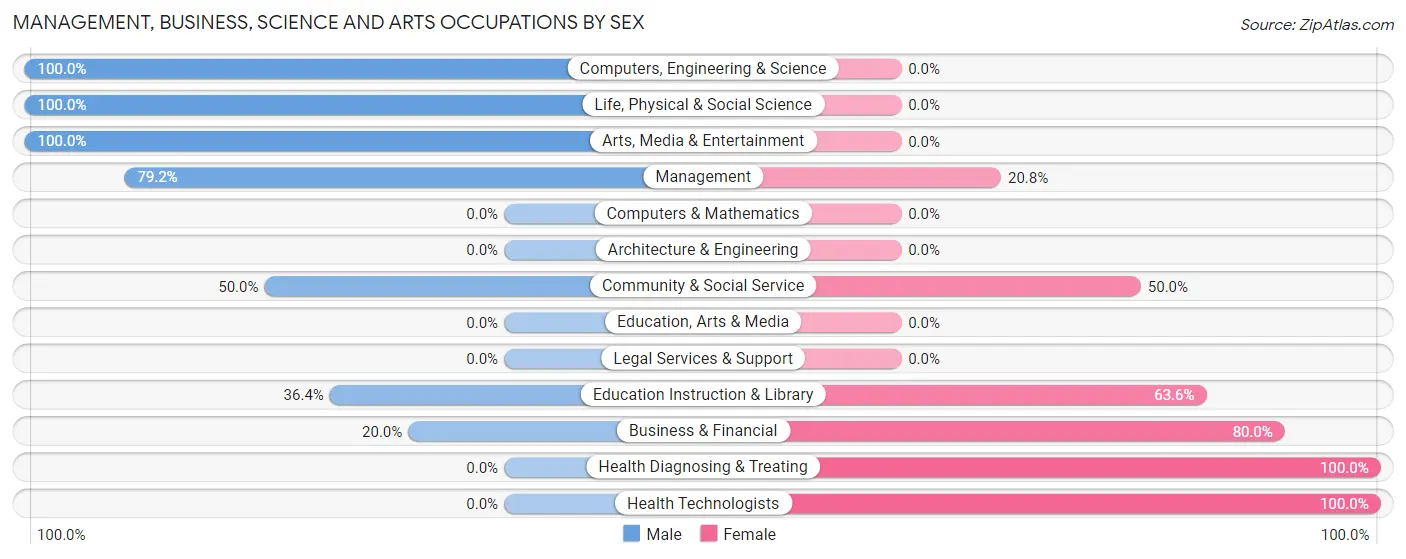
Management, Business, Science and Arts Occupations by Sex
Within the Management, Business, Science and Arts occupations in Yorkville, the most male-oriented occupations are Computers, Engineering & Science (100.0%), Life, Physical & Social Science (100.0%), and Arts, Media & Entertainment (100.0%), while the most female-oriented occupations are Health Diagnosing & Treating (100.0%), Health Technologists (100.0%), and Business & Financial (80.0%).
| Occupation | Male | Female |
| Management | 57 (79.2%) | 15 (20.8%) |
| Business & Financial | 2 (20.0%) | 8 (80.0%) |
| Computers, Engineering & Science | 3 (100.0%) | 0 (0.0%) |
| Computers & Mathematics | 0 (0.0%) | 0 (0.0%) |
| Architecture & Engineering | 0 (0.0%) | 0 (0.0%) |
| Life, Physical & Social Science | 3 (100.0%) | 0 (0.0%) |
| Community & Social Service | 7 (50.0%) | 7 (50.0%) |
| Education, Arts & Media | 0 (0.0%) | 0 (0.0%) |
| Legal Services & Support | 0 (0.0%) | 0 (0.0%) |
| Education Instruction & Library | 4 (36.4%) | 7 (63.6%) |
| Arts, Media & Entertainment | 3 (100.0%) | 0 (0.0%) |
| Health Diagnosing & Treating | 0 (0.0%) | 18 (100.0%) |
| Health Technologists | 0 (0.0%) | 3 (100.0%) |
| Total (Category) | 69 (59.0%) | 48 (41.0%) |
| Total (Overall) | 207 (52.7%) | 186 (47.3%) |
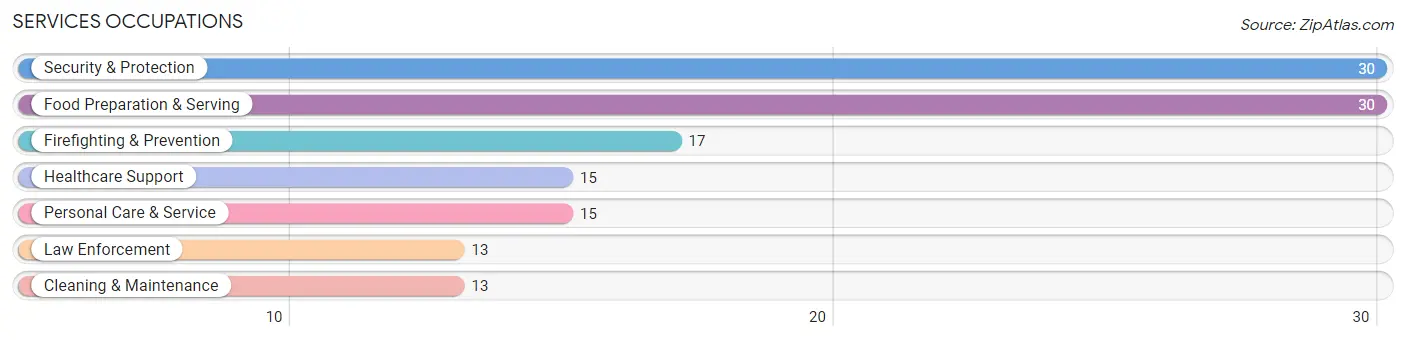
Services Occupations
The most common Services occupations in Yorkville are Security & Protection (30 | 7.6%), Food Preparation & Serving (30 | 7.6%), Firefighting & Prevention (17 | 4.3%), Healthcare Support (15 | 3.8%), and Personal Care & Service (15 | 3.8%).
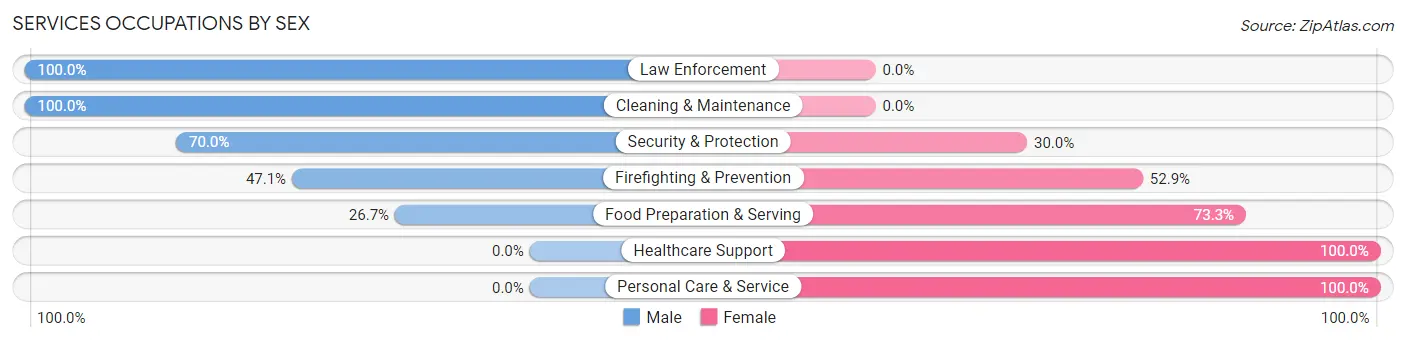
Services Occupations by Sex
Within the Services occupations in Yorkville, the most male-oriented occupations are Law Enforcement (100.0%), Cleaning & Maintenance (100.0%), and Security & Protection (70.0%), while the most female-oriented occupations are Healthcare Support (100.0%), Personal Care & Service (100.0%), and Food Preparation & Serving (73.3%).
| Occupation | Male | Female |
| Healthcare Support | 0 (0.0%) | 15 (100.0%) |
| Security & Protection | 21 (70.0%) | 9 (30.0%) |
| Firefighting & Prevention | 8 (47.1%) | 9 (52.9%) |
| Law Enforcement | 13 (100.0%) | 0 (0.0%) |
| Food Preparation & Serving | 8 (26.7%) | 22 (73.3%) |
| Cleaning & Maintenance | 13 (100.0%) | 0 (0.0%) |
| Personal Care & Service | 0 (0.0%) | 15 (100.0%) |
| Total (Category) | 42 (40.8%) | 61 (59.2%) |
| Total (Overall) | 207 (52.7%) | 186 (47.3%) |
Sales and Office Occupations
The most common Sales and Office occupations in Yorkville are Office & Administration (50 | 12.7%), and Sales & Related (32 | 8.1%).

Sales and Office Occupations by Sex
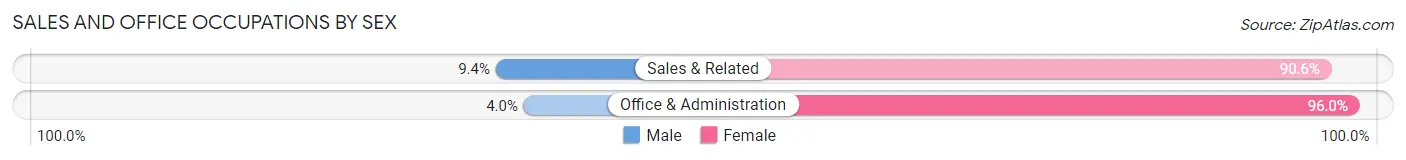
| Occupation | Male | Female |
| Sales & Related | 3 (9.4%) | 29 (90.6%) |
| Office & Administration | 2 (4.0%) | 48 (96.0%) |
| Total (Category) | 5 (6.1%) | 77 (93.9%) |
| Total (Overall) | 207 (52.7%) | 186 (47.3%) |
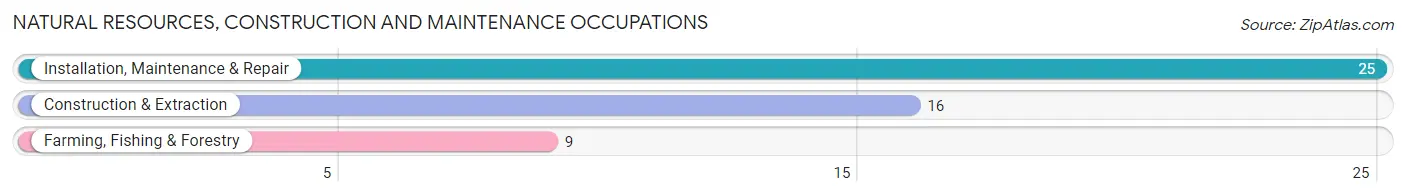
Natural Resources, Construction and Maintenance Occupations
The most common Natural Resources, Construction and Maintenance occupations in Yorkville are Installation, Maintenance & Repair (25 | 6.4%), Construction & Extraction (16 | 4.1%), and Farming, Fishing & Forestry (9 | 2.3%).
Natural Resources, Construction and Maintenance Occupations by Sex
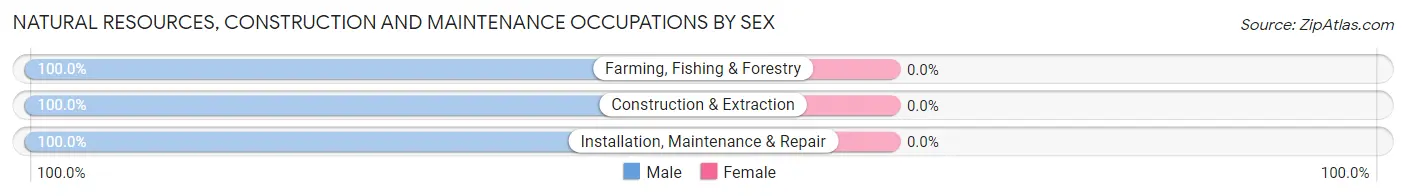
| Occupation | Male | Female |
| Farming, Fishing & Forestry | 9 (100.0%) | 0 (0.0%) |
| Construction & Extraction | 16 (100.0%) | 0 (0.0%) |
| Installation, Maintenance & Repair | 25 (100.0%) | 0 (0.0%) |
| Total (Category) | 50 (100.0%) | 0 (0.0%) |
| Total (Overall) | 207 (52.7%) | 186 (47.3%) |
Production, Transportation and Moving Occupations
The most common Production, Transportation and Moving occupations in Yorkville are Material Moving (17 | 4.3%), Transportation (14 | 3.6%), and Production (10 | 2.5%).
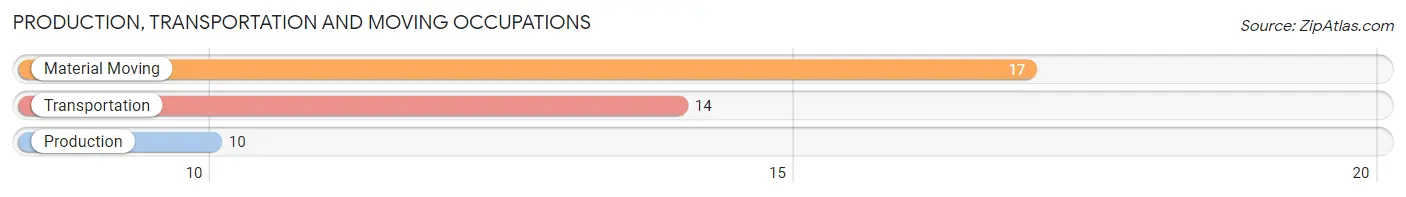
Production, Transportation and Moving Occupations by Sex
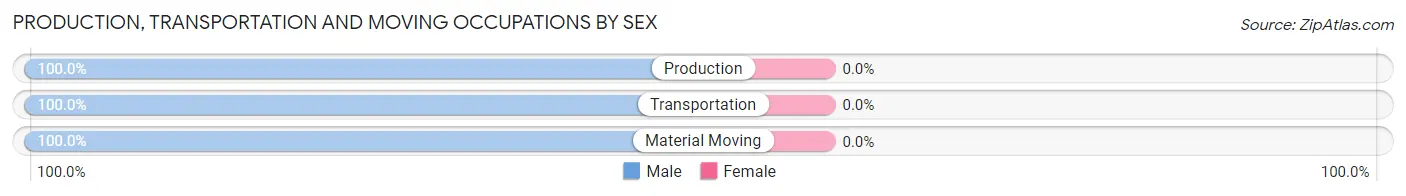
| Occupation | Male | Female |
| Production | 10 (100.0%) | 0 (0.0%) |
| Transportation | 14 (100.0%) | 0 (0.0%) |
| Material Moving | 17 (100.0%) | 0 (0.0%) |
| Total (Category) | 41 (100.0%) | 0 (0.0%) |
| Total (Overall) | 207 (52.7%) | 186 (47.3%) |
Employment Industries by Sex in Yorkville
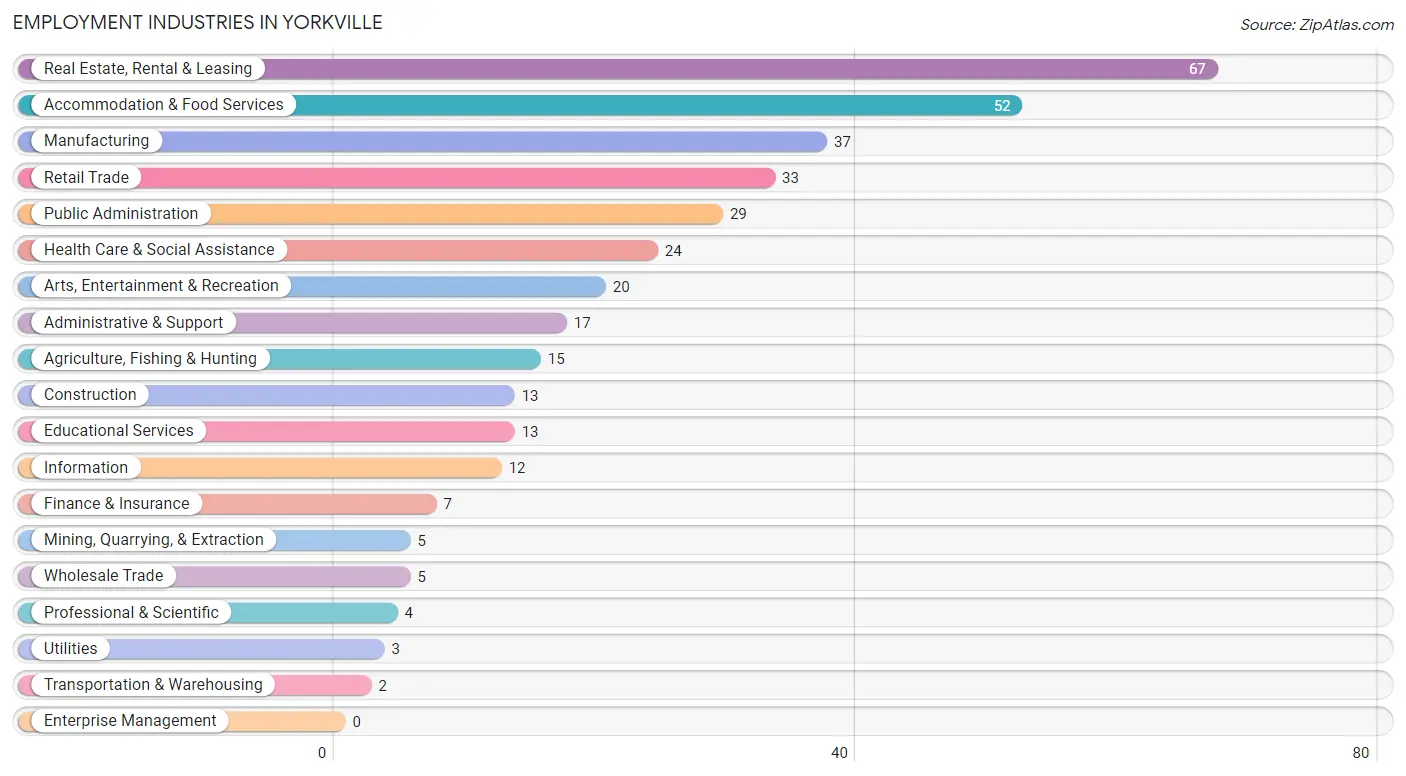
Employment Industries in Yorkville
The major employment industries in Yorkville include Real Estate, Rental & Leasing (67 | 17.1%), Accommodation & Food Services (52 | 13.2%), Manufacturing (37 | 9.4%), Retail Trade (33 | 8.4%), and Public Administration (29 | 7.4%).
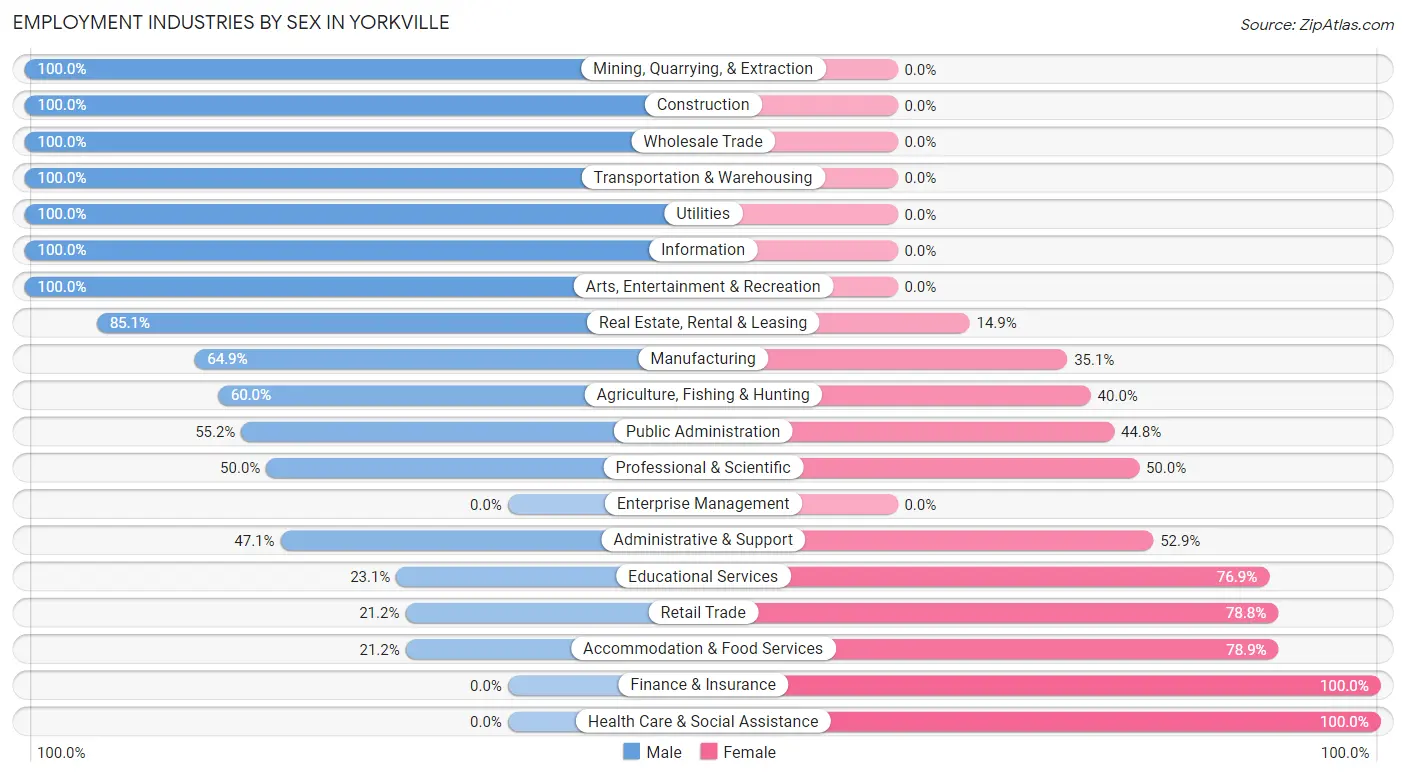
Employment Industries by Sex in Yorkville
The Yorkville industries that see more men than women are Mining, Quarrying, & Extraction (100.0%), Construction (100.0%), and Wholesale Trade (100.0%), whereas the industries that tend to have a higher number of women are Finance & Insurance (100.0%), Health Care & Social Assistance (100.0%), and Accommodation & Food Services (78.8%).
| Industry | Male | Female |
| Agriculture, Fishing & Hunting | 9 (60.0%) | 6 (40.0%) |
| Mining, Quarrying, & Extraction | 5 (100.0%) | 0 (0.0%) |
| Construction | 13 (100.0%) | 0 (0.0%) |
| Manufacturing | 24 (64.9%) | 13 (35.1%) |
| Wholesale Trade | 5 (100.0%) | 0 (0.0%) |
| Retail Trade | 7 (21.2%) | 26 (78.8%) |
| Transportation & Warehousing | 2 (100.0%) | 0 (0.0%) |
| Utilities | 3 (100.0%) | 0 (0.0%) |
| Information | 12 (100.0%) | 0 (0.0%) |
| Finance & Insurance | 0 (0.0%) | 7 (100.0%) |
| Real Estate, Rental & Leasing | 57 (85.1%) | 10 (14.9%) |
| Professional & Scientific | 2 (50.0%) | 2 (50.0%) |
| Enterprise Management | 0 (0.0%) | 0 (0.0%) |
| Administrative & Support | 8 (47.1%) | 9 (52.9%) |
| Educational Services | 3 (23.1%) | 10 (76.9%) |
| Health Care & Social Assistance | 0 (0.0%) | 24 (100.0%) |
| Arts, Entertainment & Recreation | 20 (100.0%) | 0 (0.0%) |
| Accommodation & Food Services | 11 (21.1%) | 41 (78.8%) |
| Public Administration | 16 (55.2%) | 13 (44.8%) |
| Total | 207 (52.7%) | 186 (47.3%) |
Education in Yorkville
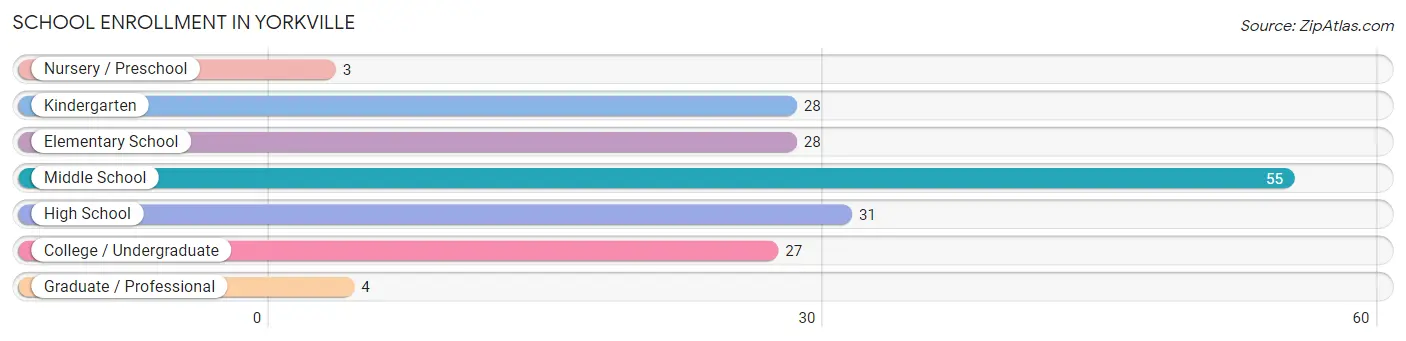
School Enrollment in Yorkville
The most common levels of schooling among the 176 students in Yorkville are middle school (55 | 31.2%), high school (31 | 17.6%), and kindergarten (28 | 15.9%).
| School Level | # Students | % Students |
| Nursery / Preschool | 3 | 1.7% |
| Kindergarten | 28 | 15.9% |
| Elementary School | 28 | 15.9% |
| Middle School | 55 | 31.2% |
| High School | 31 | 17.6% |
| College / Undergraduate | 27 | 15.3% |
| Graduate / Professional | 4 | 2.3% |
| Total | 176 | 100.0% |
School Enrollment by Age by Funding Source in Yorkville
Out of a total of 176 students who are enrolled in schools in Yorkville, 4 (2.3%) attend a private institution, while the remaining 172 (97.7%) are enrolled in public schools. The age group of 15 to 17 year olds has the highest likelihood of being enrolled in private schools, with 4 (16.7% in the age bracket) enrolled. Conversely, the age group of 5 to 9 year old has the lowest likelihood of being enrolled in a private school, with 55 (100.0% in the age bracket) attending a public institution.
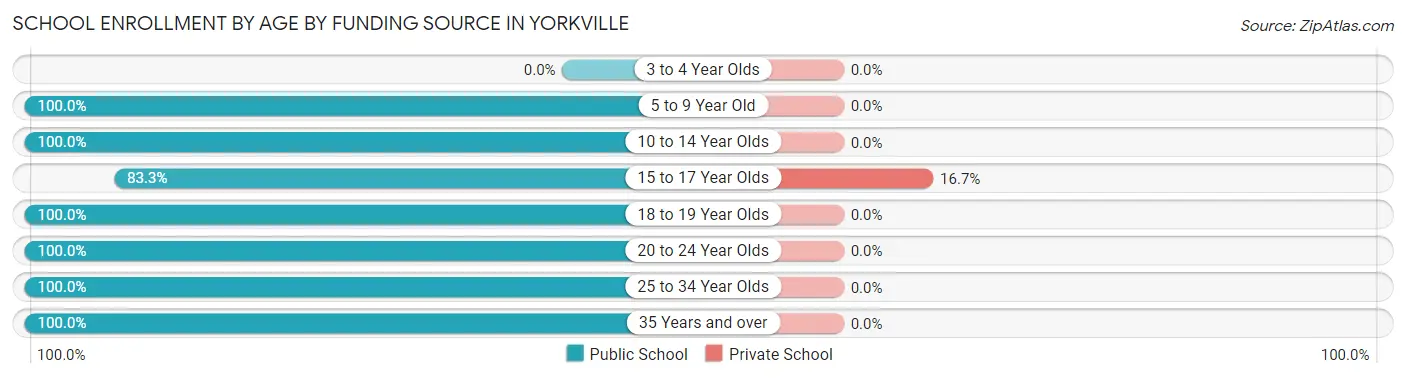
| Age Bracket | Public School | Private School |
| 3 to 4 Year Olds | 0 (0.0%) | 0 (0.0%) |
| 5 to 9 Year Old | 55 (100.0%) | 0 (0.0%) |
| 10 to 14 Year Olds | 66 (100.0%) | 0 (0.0%) |
| 15 to 17 Year Olds | 20 (83.3%) | 4 (16.7%) |
| 18 to 19 Year Olds | 9 (100.0%) | 0 (0.0%) |
| 20 to 24 Year Olds | 15 (100.0%) | 0 (0.0%) |
| 25 to 34 Year Olds | 3 (100.0%) | 0 (0.0%) |
| 35 Years and over | 4 (100.0%) | 0 (0.0%) |
| Total | 172 (97.7%) | 4 (2.3%) |
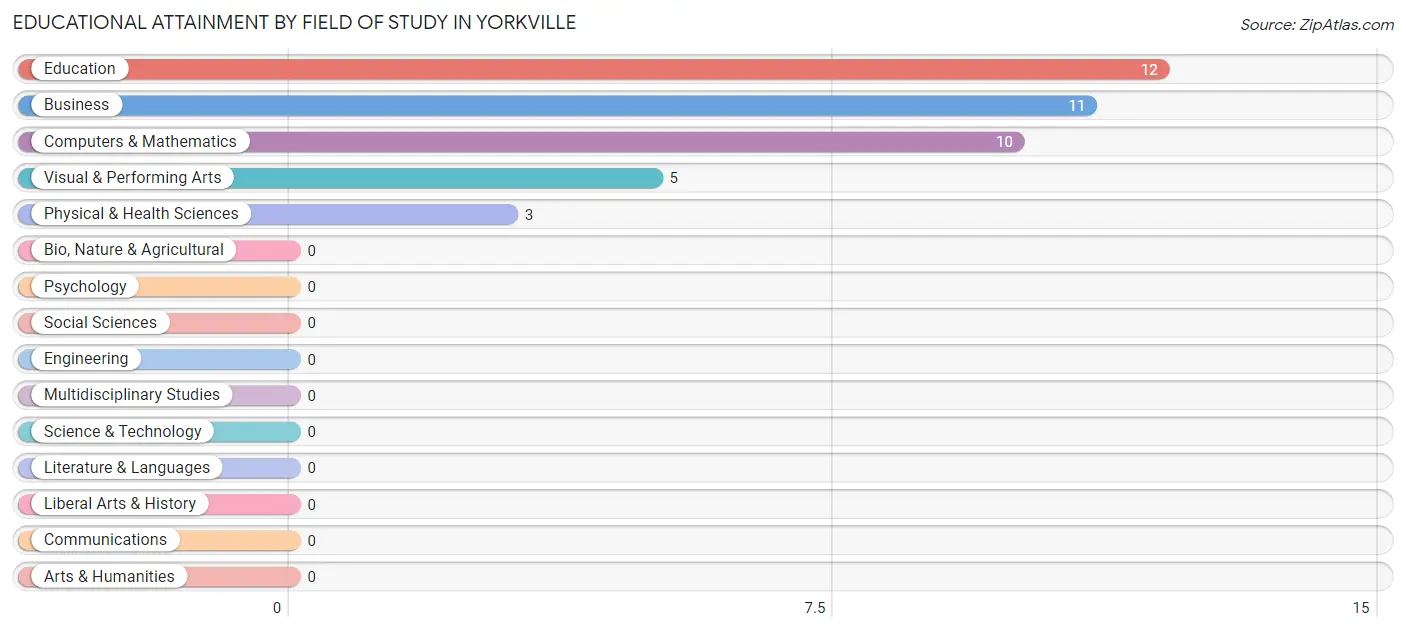
Educational Attainment by Field of Study in Yorkville
Education (12 | 29.3%), business (11 | 26.8%), computers & mathematics (10 | 24.4%), visual & performing arts (5 | 12.2%), and physical & health sciences (3 | 7.3%) are the most common fields of study among 41 individuals in Yorkville who have obtained a bachelor's degree or higher.
| Field of Study | # Graduates | % Graduates |
| Computers & Mathematics | 10 | 24.4% |
| Bio, Nature & Agricultural | 0 | 0.0% |
| Physical & Health Sciences | 3 | 7.3% |
| Psychology | 0 | 0.0% |
| Social Sciences | 0 | 0.0% |
| Engineering | 0 | 0.0% |
| Multidisciplinary Studies | 0 | 0.0% |
| Science & Technology | 0 | 0.0% |
| Business | 11 | 26.8% |
| Education | 12 | 29.3% |
| Literature & Languages | 0 | 0.0% |
| Liberal Arts & History | 0 | 0.0% |
| Visual & Performing Arts | 5 | 12.2% |
| Communications | 0 | 0.0% |
| Arts & Humanities | 0 | 0.0% |
| Total | 41 | 100.0% |
Transportation & Commute in Yorkville
Vehicle Availability by Sex in Yorkville
The most prevalent vehicle ownership categories in Yorkville are males with 5 or more vehicles (57, accounting for 27.9%) and females with 5 or more vehicles (0, making up 30.6%).
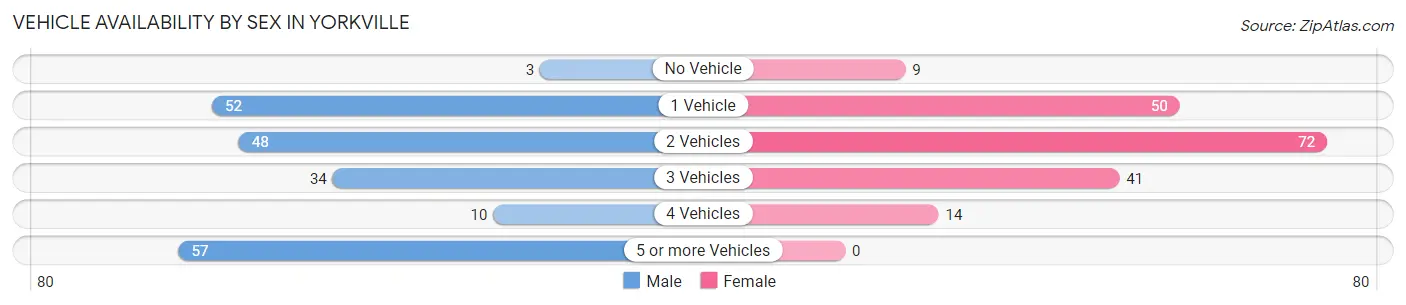
| Vehicles Available | Male | Female |
| No Vehicle | 3 (1.5%) | 9 (4.8%) |
| 1 Vehicle | 52 (25.5%) | 50 (26.9%) |
| 2 Vehicles | 48 (23.5%) | 72 (38.7%) |
| 3 Vehicles | 34 (16.7%) | 41 (22.0%) |
| 4 Vehicles | 10 (4.9%) | 14 (7.5%) |
| 5 or more Vehicles | 57 (27.9%) | 0 (0.0%) |
| Total | 204 (100.0%) | 186 (100.0%) |
Commute Time in Yorkville
The most frequently occuring commute durations in Yorkville are 20 to 24 minutes (90 commuters, 23.7%), 30 to 34 minutes (61 commuters, 16.1%), and 25 to 29 minutes (55 commuters, 14.5%).
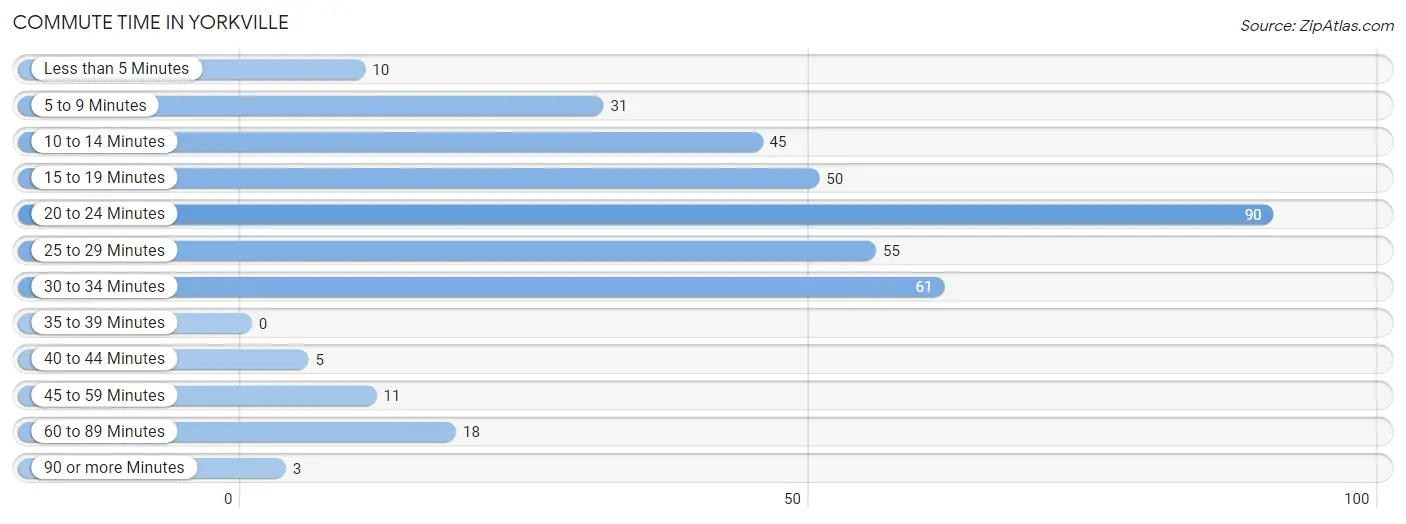
| Commute Time | # Commuters | % Commuters |
| Less than 5 Minutes | 10 | 2.6% |
| 5 to 9 Minutes | 31 | 8.2% |
| 10 to 14 Minutes | 45 | 11.9% |
| 15 to 19 Minutes | 50 | 13.2% |
| 20 to 24 Minutes | 90 | 23.7% |
| 25 to 29 Minutes | 55 | 14.5% |
| 30 to 34 Minutes | 61 | 16.1% |
| 35 to 39 Minutes | 0 | 0.0% |
| 40 to 44 Minutes | 5 | 1.3% |
| 45 to 59 Minutes | 11 | 2.9% |
| 60 to 89 Minutes | 18 | 4.8% |
| 90 or more Minutes | 3 | 0.8% |
Commute Time by Sex in Yorkville
The most common commute times in Yorkville are 20 to 24 minutes (66 commuters, 33.2%) for males and 25 to 29 minutes (35 commuters, 19.4%) for females.
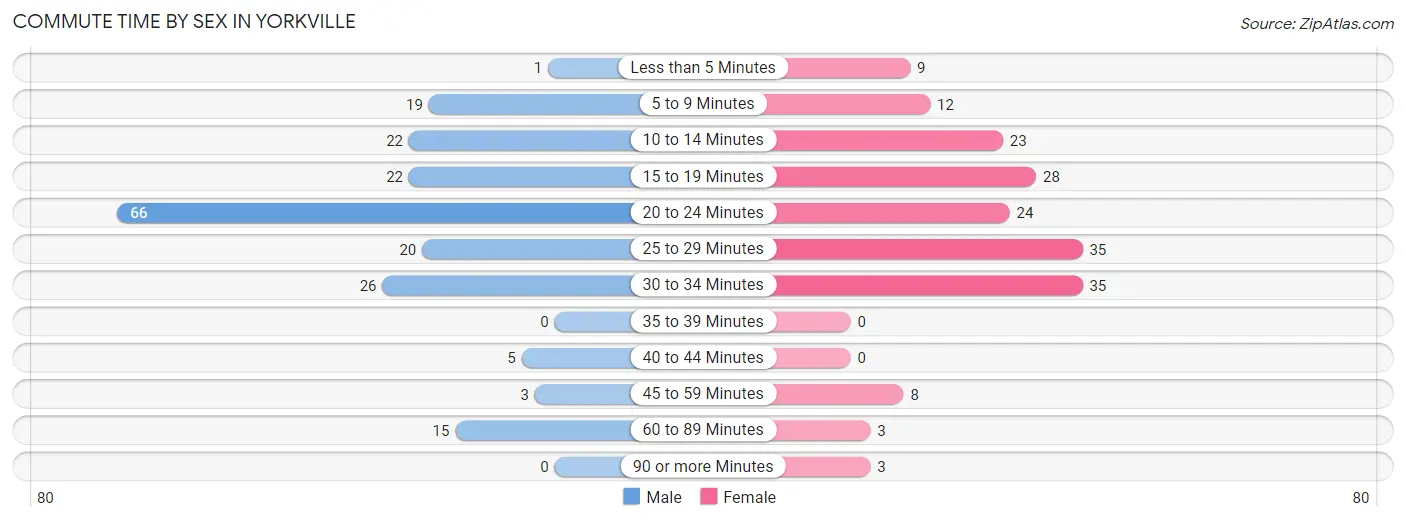
| Commute Time | Male | Female |
| Less than 5 Minutes | 1 (0.5%) | 9 (5.0%) |
| 5 to 9 Minutes | 19 (9.6%) | 12 (6.7%) |
| 10 to 14 Minutes | 22 (11.1%) | 23 (12.8%) |
| 15 to 19 Minutes | 22 (11.1%) | 28 (15.6%) |
| 20 to 24 Minutes | 66 (33.2%) | 24 (13.3%) |
| 25 to 29 Minutes | 20 (10.1%) | 35 (19.4%) |
| 30 to 34 Minutes | 26 (13.1%) | 35 (19.4%) |
| 35 to 39 Minutes | 0 (0.0%) | 0 (0.0%) |
| 40 to 44 Minutes | 5 (2.5%) | 0 (0.0%) |
| 45 to 59 Minutes | 3 (1.5%) | 8 (4.4%) |
| 60 to 89 Minutes | 15 (7.5%) | 3 (1.7%) |
| 90 or more Minutes | 0 (0.0%) | 3 (1.7%) |
Time of Departure to Work by Sex in Yorkville
The most frequent times of departure to work in Yorkville are 7:30 AM to 7:59 AM (57, 28.6%) for males and 7:00 AM to 7:29 AM (31, 17.2%) for females.
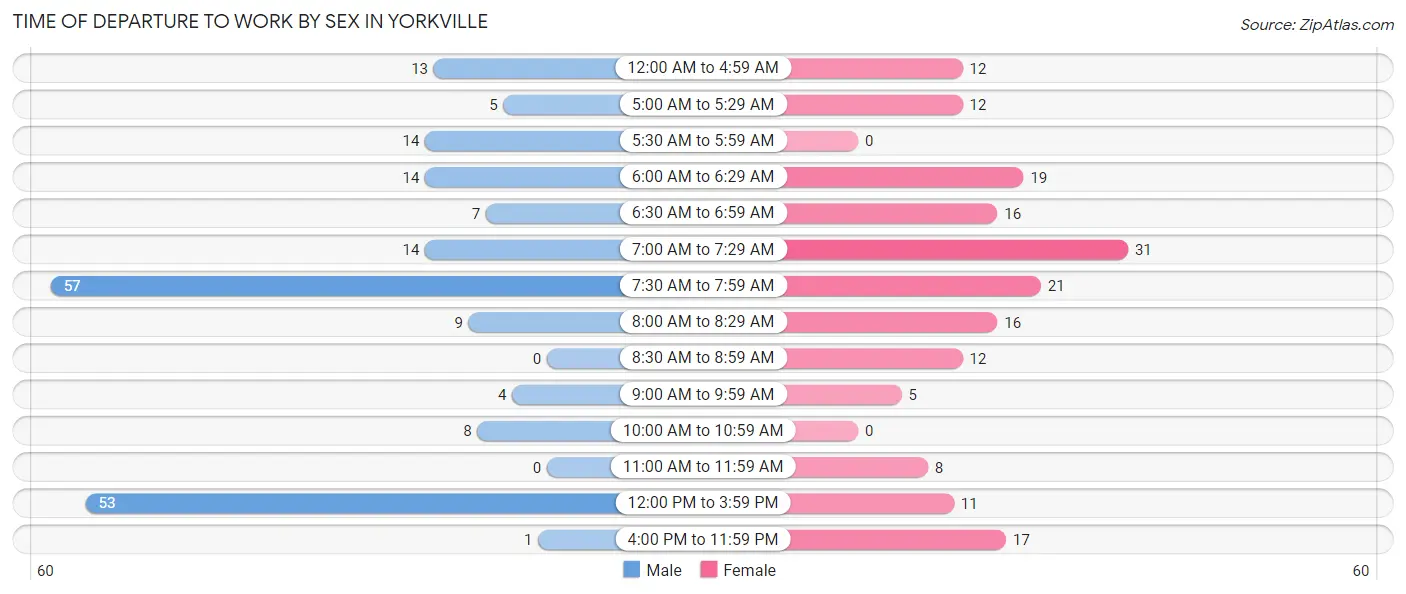
| Time of Departure | Male | Female |
| 12:00 AM to 4:59 AM | 13 (6.5%) | 12 (6.7%) |
| 5:00 AM to 5:29 AM | 5 (2.5%) | 12 (6.7%) |
| 5:30 AM to 5:59 AM | 14 (7.0%) | 0 (0.0%) |
| 6:00 AM to 6:29 AM | 14 (7.0%) | 19 (10.6%) |
| 6:30 AM to 6:59 AM | 7 (3.5%) | 16 (8.9%) |
| 7:00 AM to 7:29 AM | 14 (7.0%) | 31 (17.2%) |
| 7:30 AM to 7:59 AM | 57 (28.6%) | 21 (11.7%) |
| 8:00 AM to 8:29 AM | 9 (4.5%) | 16 (8.9%) |
| 8:30 AM to 8:59 AM | 0 (0.0%) | 12 (6.7%) |
| 9:00 AM to 9:59 AM | 4 (2.0%) | 5 (2.8%) |
| 10:00 AM to 10:59 AM | 8 (4.0%) | 0 (0.0%) |
| 11:00 AM to 11:59 AM | 0 (0.0%) | 8 (4.4%) |
| 12:00 PM to 3:59 PM | 53 (26.6%) | 11 (6.1%) |
| 4:00 PM to 11:59 PM | 1 (0.5%) | 17 (9.4%) |
| Total | 199 (100.0%) | 180 (100.0%) |
Housing Occupancy in Yorkville
Occupancy by Ownership in Yorkville
Of the total 418 dwellings in Yorkville, owner-occupied units account for 258 (61.7%), while renter-occupied units make up 160 (38.3%).
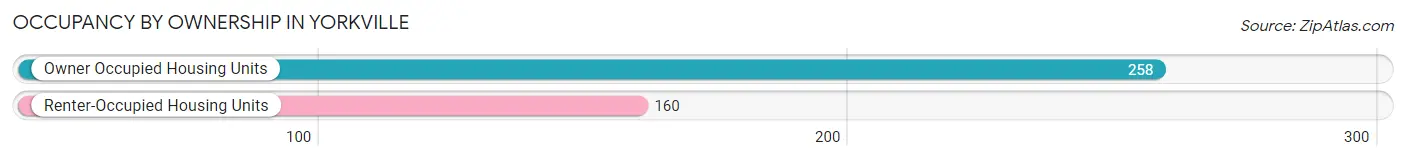
| Occupancy | # Housing Units | % Housing Units |
| Owner Occupied Housing Units | 258 | 61.7% |
| Renter-Occupied Housing Units | 160 | 38.3% |
| Total Occupied Housing Units | 418 | 100.0% |
Occupancy by Household Size in Yorkville
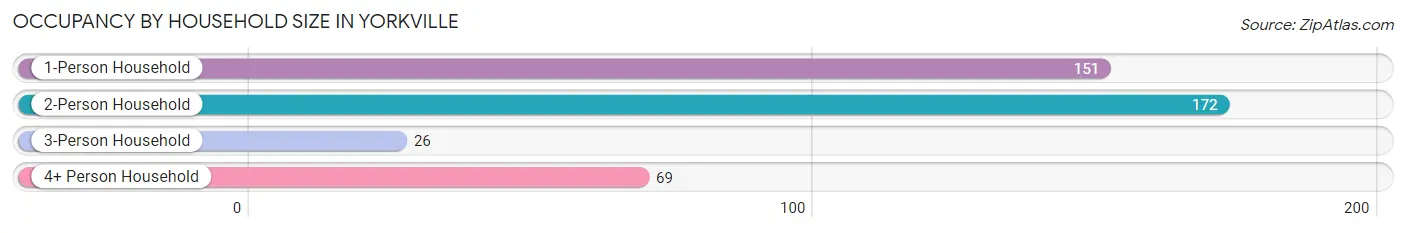
| Household Size | # Housing Units | % Housing Units |
| 1-Person Household | 151 | 36.1% |
| 2-Person Household | 172 | 41.1% |
| 3-Person Household | 26 | 6.2% |
| 4+ Person Household | 69 | 16.5% |
| Total Housing Units | 418 | 100.0% |
Occupancy by Ownership by Household Size in Yorkville
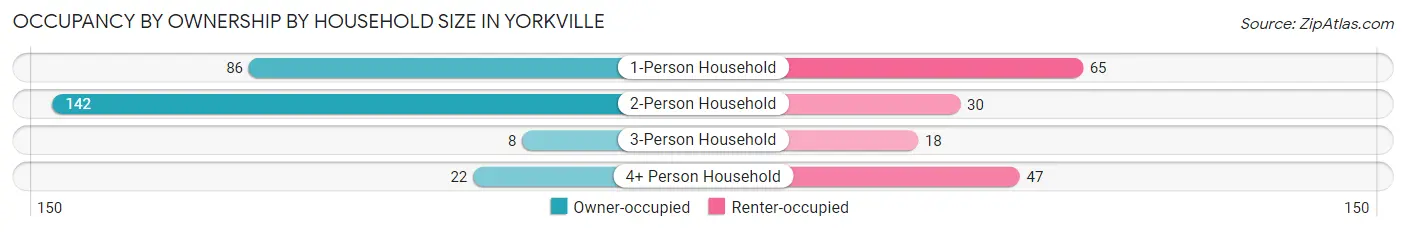
| Household Size | Owner-occupied | Renter-occupied |
| 1-Person Household | 86 (57.0%) | 65 (43.0%) |
| 2-Person Household | 142 (82.6%) | 30 (17.4%) |
| 3-Person Household | 8 (30.8%) | 18 (69.2%) |
| 4+ Person Household | 22 (31.9%) | 47 (68.1%) |
| Total Housing Units | 258 (61.7%) | 160 (38.3%) |
Occupancy by Educational Attainment in Yorkville
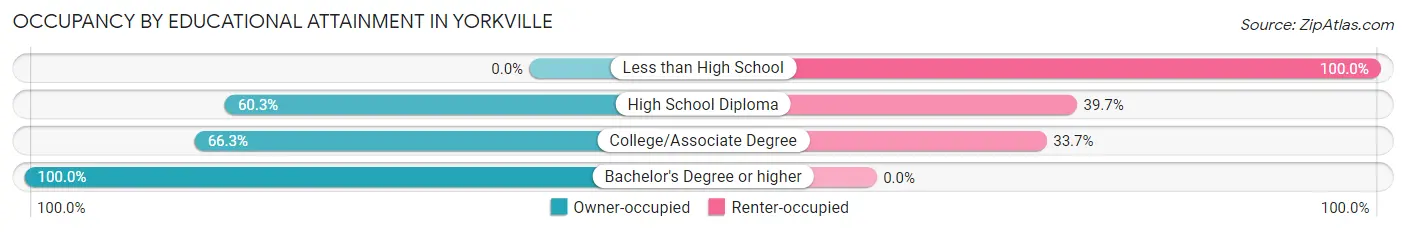
| Household Size | Owner-occupied | Renter-occupied |
| Less than High School | 0 (0.0%) | 16 (100.0%) |
| High School Diploma | 132 (60.3%) | 87 (39.7%) |
| College/Associate Degree | 112 (66.3%) | 57 (33.7%) |
| Bachelor's Degree or higher | 14 (100.0%) | 0 (0.0%) |
Occupancy by Age of Householder in Yorkville
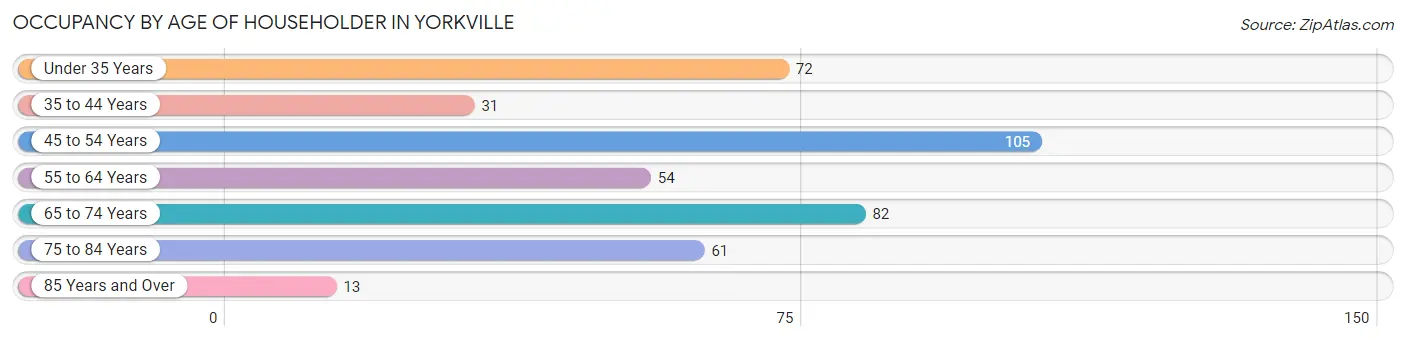
| Age Bracket | # Households | % Households |
| Under 35 Years | 72 | 17.2% |
| 35 to 44 Years | 31 | 7.4% |
| 45 to 54 Years | 105 | 25.1% |
| 55 to 64 Years | 54 | 12.9% |
| 65 to 74 Years | 82 | 19.6% |
| 75 to 84 Years | 61 | 14.6% |
| 85 Years and Over | 13 | 3.1% |
| Total | 418 | 100.0% |
Housing Finances in Yorkville
Median Income by Occupancy in Yorkville
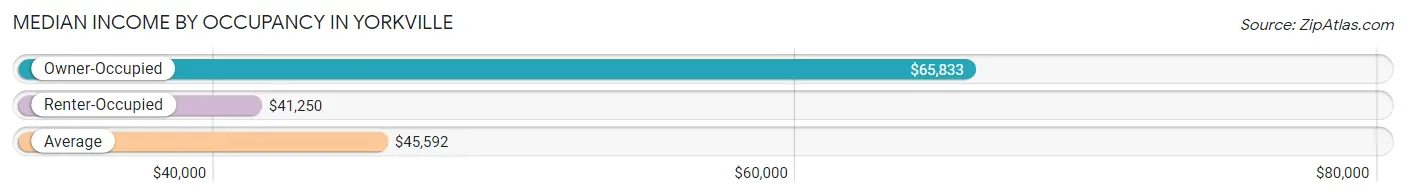
| Occupancy Type | # Households | Median Income |
| Owner-Occupied | 258 (61.7%) | $65,833 |
| Renter-Occupied | 160 (38.3%) | $41,250 |
| Average | 418 (100.0%) | $45,592 |
Occupancy by Householder Income Bracket in Yorkville
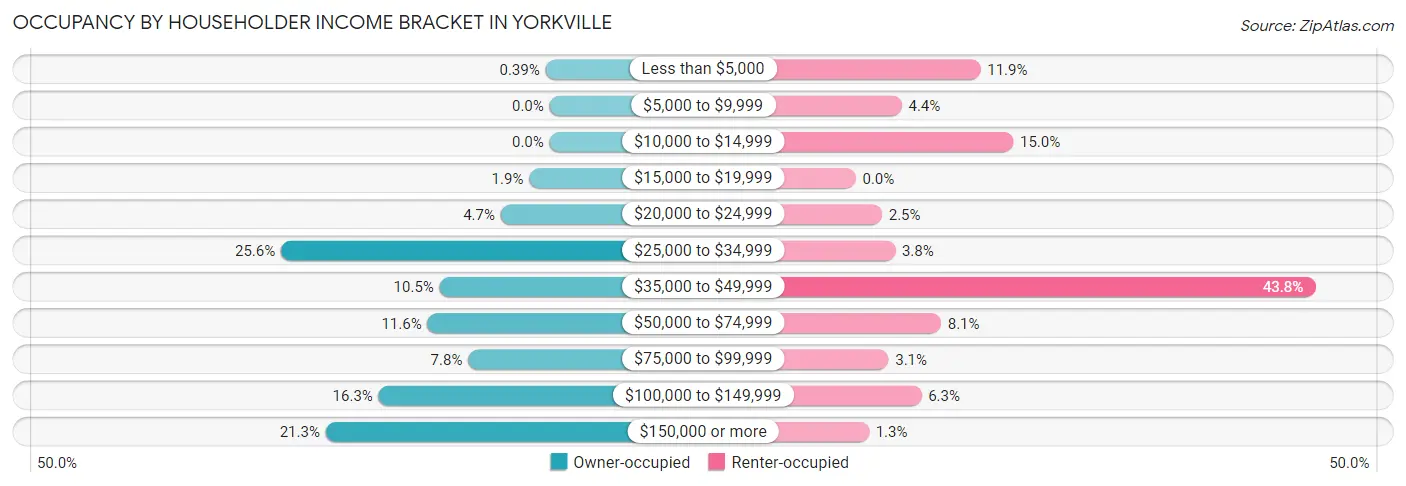
| Income Bracket | Owner-occupied | Renter-occupied |
| Less than $5,000 | 1 (0.4%) | 19 (11.9%) |
| $5,000 to $9,999 | 0 (0.0%) | 7 (4.4%) |
| $10,000 to $14,999 | 0 (0.0%) | 24 (15.0%) |
| $15,000 to $19,999 | 5 (1.9%) | 0 (0.0%) |
| $20,000 to $24,999 | 12 (4.6%) | 4 (2.5%) |
| $25,000 to $34,999 | 66 (25.6%) | 6 (3.7%) |
| $35,000 to $49,999 | 27 (10.5%) | 70 (43.8%) |
| $50,000 to $74,999 | 30 (11.6%) | 13 (8.1%) |
| $75,000 to $99,999 | 20 (7.7%) | 5 (3.1%) |
| $100,000 to $149,999 | 42 (16.3%) | 10 (6.2%) |
| $150,000 or more | 55 (21.3%) | 2 (1.3%) |
| Total | 258 (100.0%) | 160 (100.0%) |
Monthly Housing Cost Tiers in Yorkville
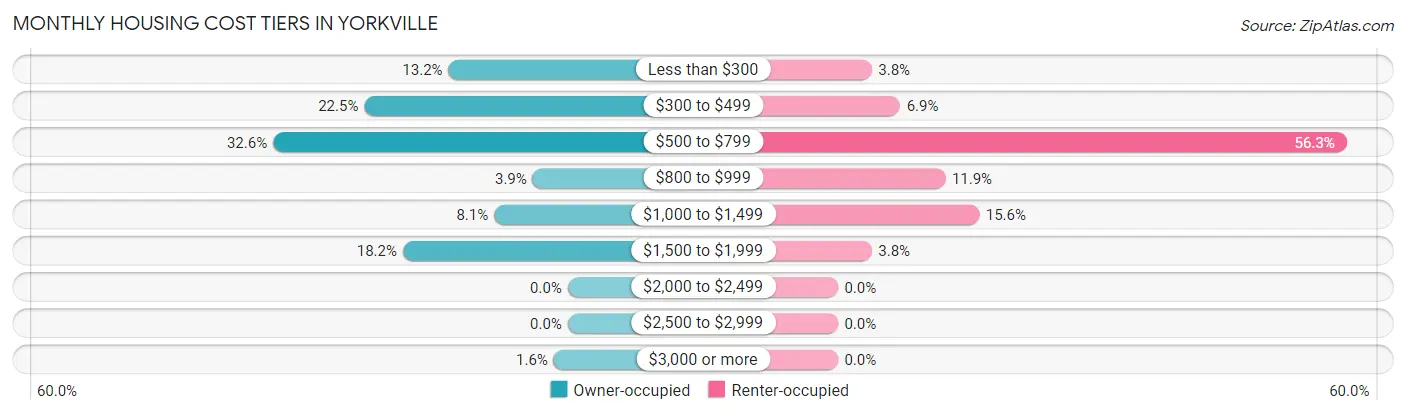
| Monthly Cost | Owner-occupied | Renter-occupied |
| Less than $300 | 34 (13.2%) | 6 (3.7%) |
| $300 to $499 | 58 (22.5%) | 11 (6.9%) |
| $500 to $799 | 84 (32.6%) | 90 (56.2%) |
| $800 to $999 | 10 (3.9%) | 19 (11.9%) |
| $1,000 to $1,499 | 21 (8.1%) | 25 (15.6%) |
| $1,500 to $1,999 | 47 (18.2%) | 6 (3.7%) |
| $2,000 to $2,499 | 0 (0.0%) | 0 (0.0%) |
| $2,500 to $2,999 | 0 (0.0%) | 0 (0.0%) |
| $3,000 or more | 4 (1.5%) | 0 (0.0%) |
| Total | 258 (100.0%) | 160 (100.0%) |
Physical Housing Characteristics in Yorkville
Housing Structures in Yorkville
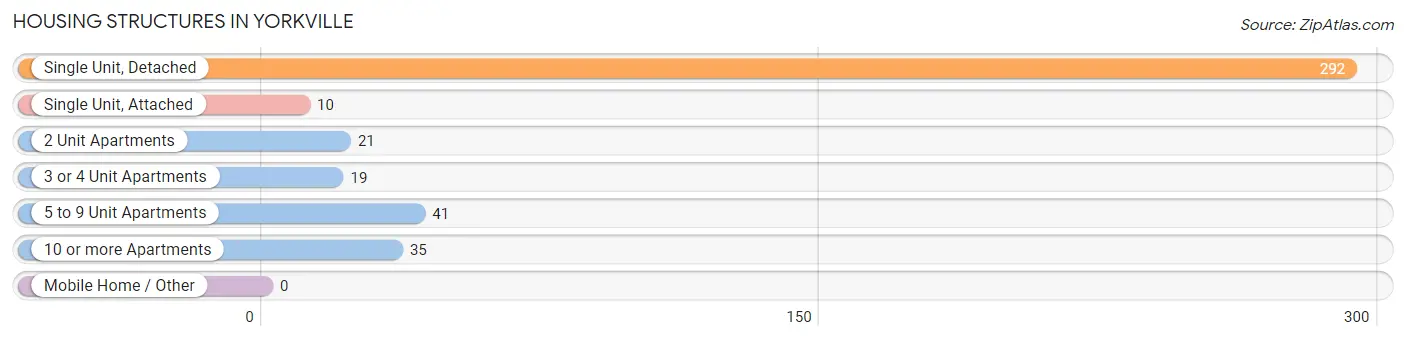
| Structure Type | # Housing Units | % Housing Units |
| Single Unit, Detached | 292 | 69.9% |
| Single Unit, Attached | 10 | 2.4% |
| 2 Unit Apartments | 21 | 5.0% |
| 3 or 4 Unit Apartments | 19 | 4.5% |
| 5 to 9 Unit Apartments | 41 | 9.8% |
| 10 or more Apartments | 35 | 8.4% |
| Mobile Home / Other | 0 | 0.0% |
| Total | 418 | 100.0% |
Housing Structures by Occupancy in Yorkville
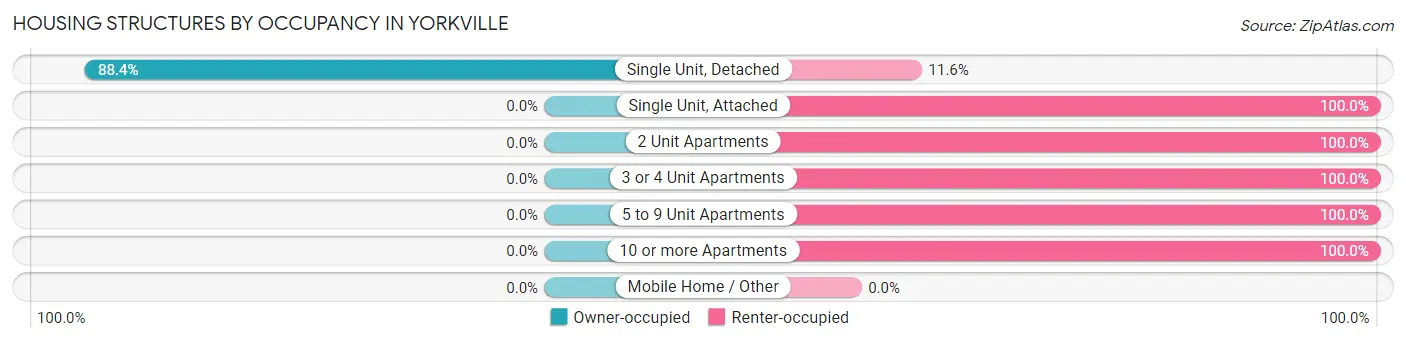
| Structure Type | Owner-occupied | Renter-occupied |
| Single Unit, Detached | 258 (88.4%) | 34 (11.6%) |
| Single Unit, Attached | 0 (0.0%) | 10 (100.0%) |
| 2 Unit Apartments | 0 (0.0%) | 21 (100.0%) |
| 3 or 4 Unit Apartments | 0 (0.0%) | 19 (100.0%) |
| 5 to 9 Unit Apartments | 0 (0.0%) | 41 (100.0%) |
| 10 or more Apartments | 0 (0.0%) | 35 (100.0%) |
| Mobile Home / Other | 0 (0.0%) | 0 (0.0%) |
| Total | 258 (61.7%) | 160 (38.3%) |
Housing Structures by Number of Rooms in Yorkville
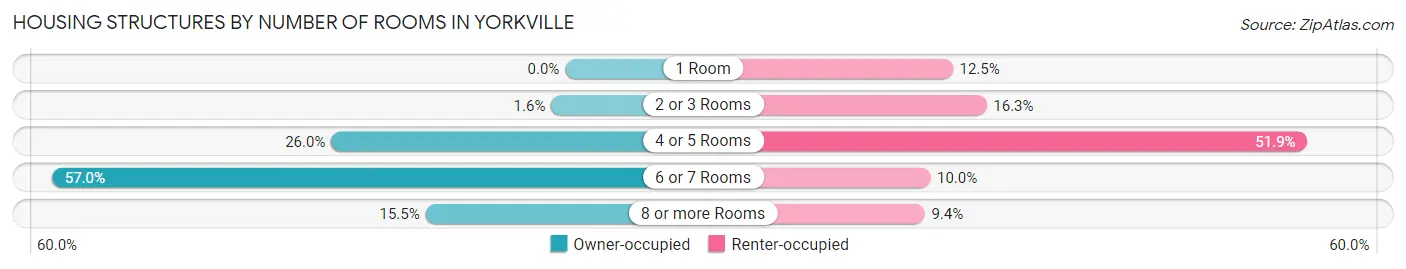
| Number of Rooms | Owner-occupied | Renter-occupied |
| 1 Room | 0 (0.0%) | 20 (12.5%) |
| 2 or 3 Rooms | 4 (1.5%) | 26 (16.3%) |
| 4 or 5 Rooms | 67 (26.0%) | 83 (51.9%) |
| 6 or 7 Rooms | 147 (57.0%) | 16 (10.0%) |
| 8 or more Rooms | 40 (15.5%) | 15 (9.4%) |
| Total | 258 (100.0%) | 160 (100.0%) |
Housing Structure by Heating Type in Yorkville
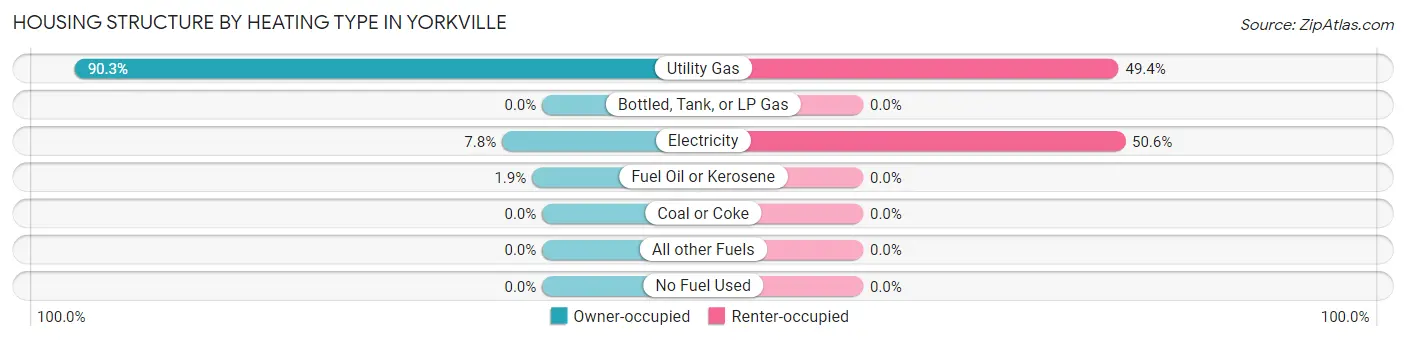
| Heating Type | Owner-occupied | Renter-occupied |
| Utility Gas | 233 (90.3%) | 79 (49.4%) |
| Bottled, Tank, or LP Gas | 0 (0.0%) | 0 (0.0%) |
| Electricity | 20 (7.7%) | 81 (50.6%) |
| Fuel Oil or Kerosene | 5 (1.9%) | 0 (0.0%) |
| Coal or Coke | 0 (0.0%) | 0 (0.0%) |
| All other Fuels | 0 (0.0%) | 0 (0.0%) |
| No Fuel Used | 0 (0.0%) | 0 (0.0%) |
| Total | 258 (100.0%) | 160 (100.0%) |
Household Vehicle Usage in Yorkville
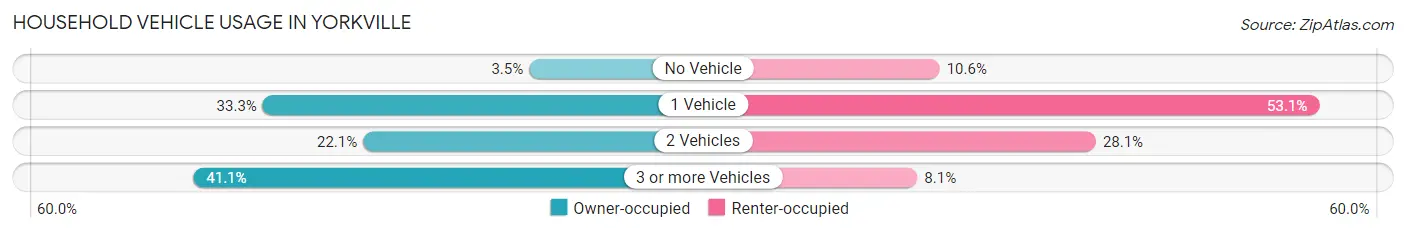
| Vehicles per Household | Owner-occupied | Renter-occupied |
| No Vehicle | 9 (3.5%) | 17 (10.6%) |
| 1 Vehicle | 86 (33.3%) | 85 (53.1%) |
| 2 Vehicles | 57 (22.1%) | 45 (28.1%) |
| 3 or more Vehicles | 106 (41.1%) | 13 (8.1%) |
| Total | 258 (100.0%) | 160 (100.0%) |
Real Estate & Mortgages in Yorkville
Real Estate and Mortgage Overview in Yorkville
| Characteristic | Without Mortgage | With Mortgage |
| Housing Units | 114 | 144 |
| Median Property Value | $91,400 | $112,500 |
| Median Household Income | $41,000 | $52 |
| Monthly Housing Costs | $388 | $0 |
| Real Estate Taxes | $856 | $0 |
Property Value by Mortgage Status in Yorkville
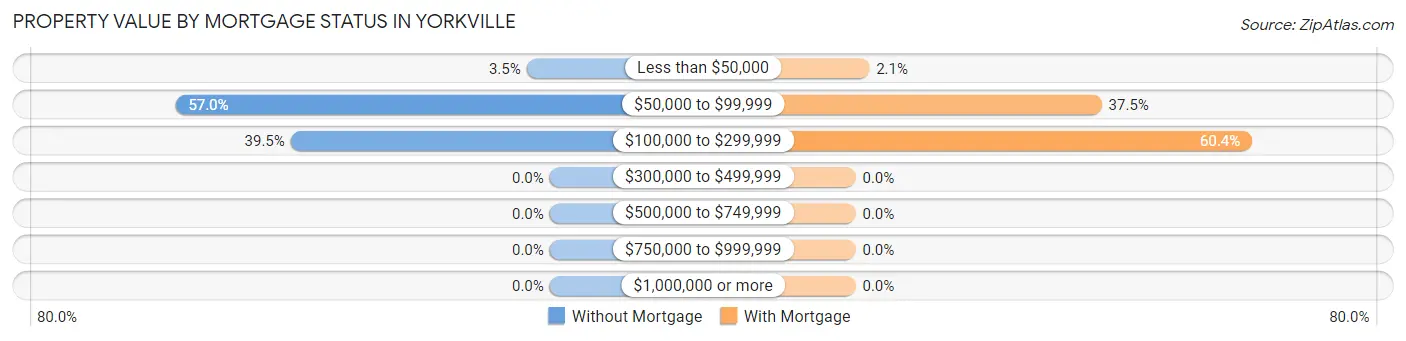
| Property Value | Without Mortgage | With Mortgage |
| Less than $50,000 | 4 (3.5%) | 3 (2.1%) |
| $50,000 to $99,999 | 65 (57.0%) | 54 (37.5%) |
| $100,000 to $299,999 | 45 (39.5%) | 87 (60.4%) |
| $300,000 to $499,999 | 0 (0.0%) | 0 (0.0%) |
| $500,000 to $749,999 | 0 (0.0%) | 0 (0.0%) |
| $750,000 to $999,999 | 0 (0.0%) | 0 (0.0%) |
| $1,000,000 or more | 0 (0.0%) | 0 (0.0%) |
| Total | 114 (100.0%) | 144 (100.0%) |
Household Income by Mortgage Status in Yorkville
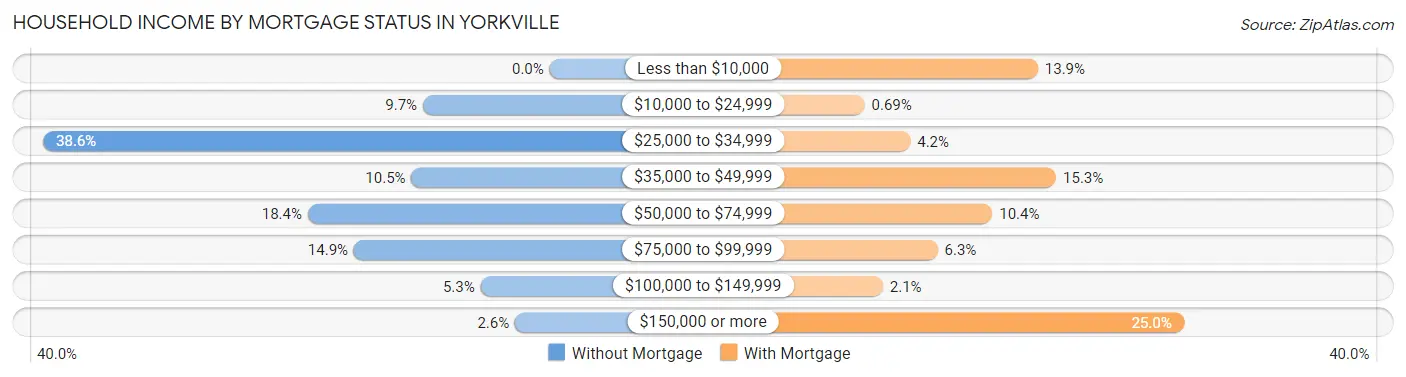
| Household Income | Without Mortgage | With Mortgage |
| Less than $10,000 | 0 (0.0%) | 20 (13.9%) |
| $10,000 to $24,999 | 11 (9.7%) | 1 (0.7%) |
| $25,000 to $34,999 | 44 (38.6%) | 6 (4.2%) |
| $35,000 to $49,999 | 12 (10.5%) | 22 (15.3%) |
| $50,000 to $74,999 | 21 (18.4%) | 15 (10.4%) |
| $75,000 to $99,999 | 17 (14.9%) | 9 (6.2%) |
| $100,000 to $149,999 | 6 (5.3%) | 3 (2.1%) |
| $150,000 or more | 3 (2.6%) | 36 (25.0%) |
| Total | 114 (100.0%) | 144 (100.0%) |
Property Value to Household Income Ratio in Yorkville
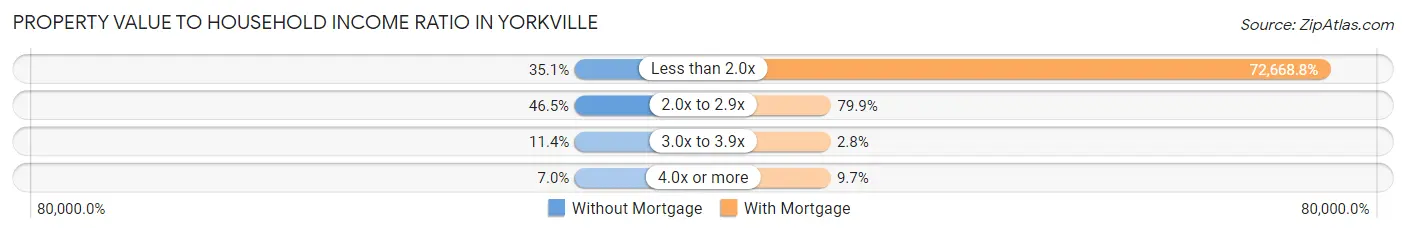
| Value-to-Income Ratio | Without Mortgage | With Mortgage |
| Less than 2.0x | 40 (35.1%) | 104,643 (72,668.8%) |
| 2.0x to 2.9x | 53 (46.5%) | 115 (79.9%) |
| 3.0x to 3.9x | 13 (11.4%) | 4 (2.8%) |
| 4.0x or more | 8 (7.0%) | 14 (9.7%) |
| Total | 114 (100.0%) | 144 (100.0%) |
Real Estate Taxes by Mortgage Status in Yorkville
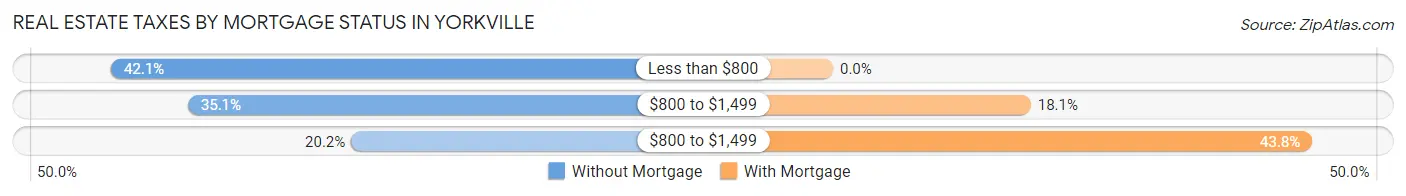
| Property Taxes | Without Mortgage | With Mortgage |
| Less than $800 | 48 (42.1%) | 0 (0.0%) |
| $800 to $1,499 | 40 (35.1%) | 26 (18.1%) |
| $800 to $1,499 | 23 (20.2%) | 63 (43.8%) |
| Total | 114 (100.0%) | 144 (100.0%) |
Health & Disability in Yorkville
Health Insurance Coverage by Age in Yorkville
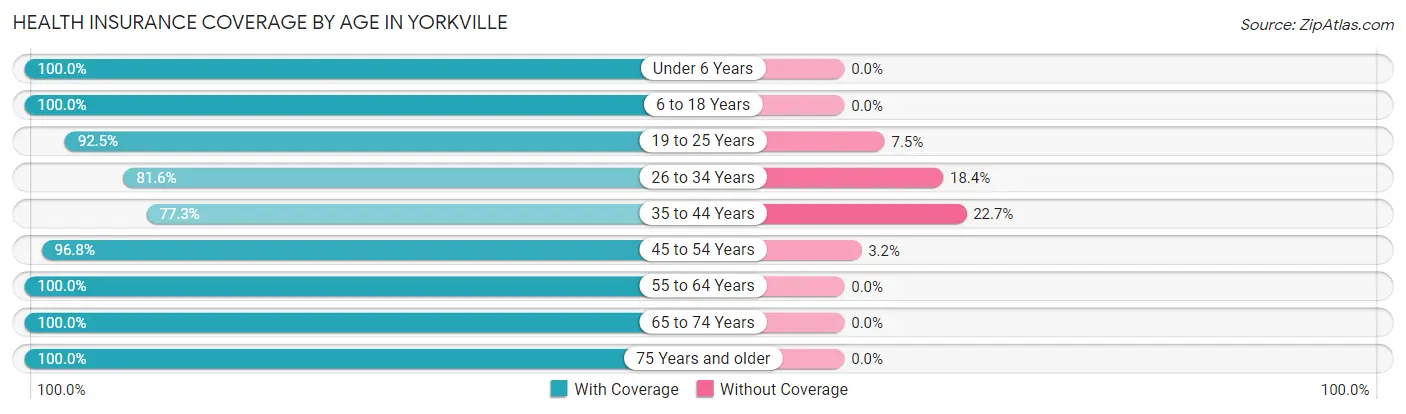
| Age Bracket | With Coverage | Without Coverage |
| Under 6 Years | 64 (100.0%) | 0 (0.0%) |
| 6 to 18 Years | 151 (100.0%) | 0 (0.0%) |
| 19 to 25 Years | 37 (92.5%) | 3 (7.5%) |
| 26 to 34 Years | 93 (81.6%) | 21 (18.4%) |
| 35 to 44 Years | 51 (77.3%) | 15 (22.7%) |
| 45 to 54 Years | 184 (96.8%) | 6 (3.2%) |
| 55 to 64 Years | 92 (100.0%) | 0 (0.0%) |
| 65 to 74 Years | 129 (100.0%) | 0 (0.0%) |
| 75 Years and older | 90 (100.0%) | 0 (0.0%) |
| Total | 891 (95.2%) | 45 (4.8%) |
Health Insurance Coverage by Citizenship Status in Yorkville
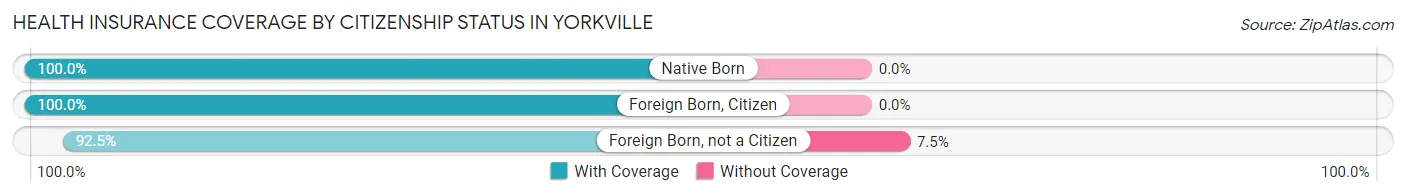
| Citizenship Status | With Coverage | Without Coverage |
| Native Born | 64 (100.0%) | 0 (0.0%) |
| Foreign Born, Citizen | 151 (100.0%) | 0 (0.0%) |
| Foreign Born, not a Citizen | 37 (92.5%) | 3 (7.5%) |
Health Insurance Coverage by Household Income in Yorkville
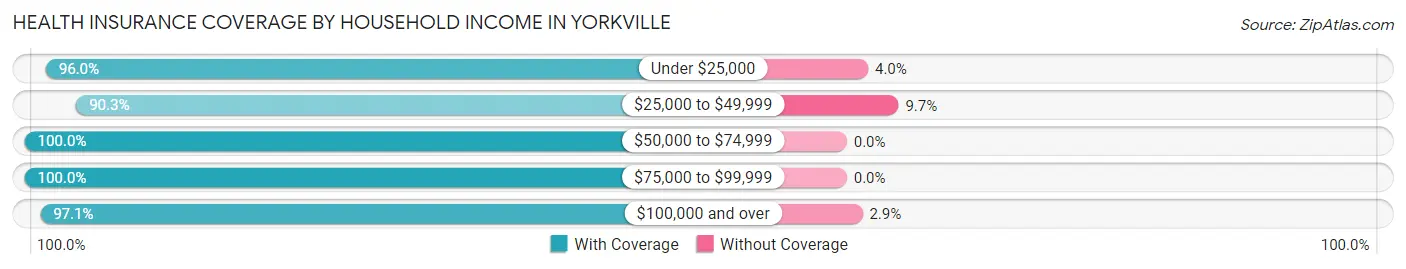
| Household Income | With Coverage | Without Coverage |
| Under $25,000 | 169 (96.0%) | 7 (4.0%) |
| $25,000 to $49,999 | 280 (90.3%) | 30 (9.7%) |
| $50,000 to $74,999 | 130 (100.0%) | 0 (0.0%) |
| $75,000 to $99,999 | 47 (100.0%) | 0 (0.0%) |
| $100,000 and over | 265 (97.1%) | 8 (2.9%) |
Public vs Private Health Insurance Coverage by Age in Yorkville
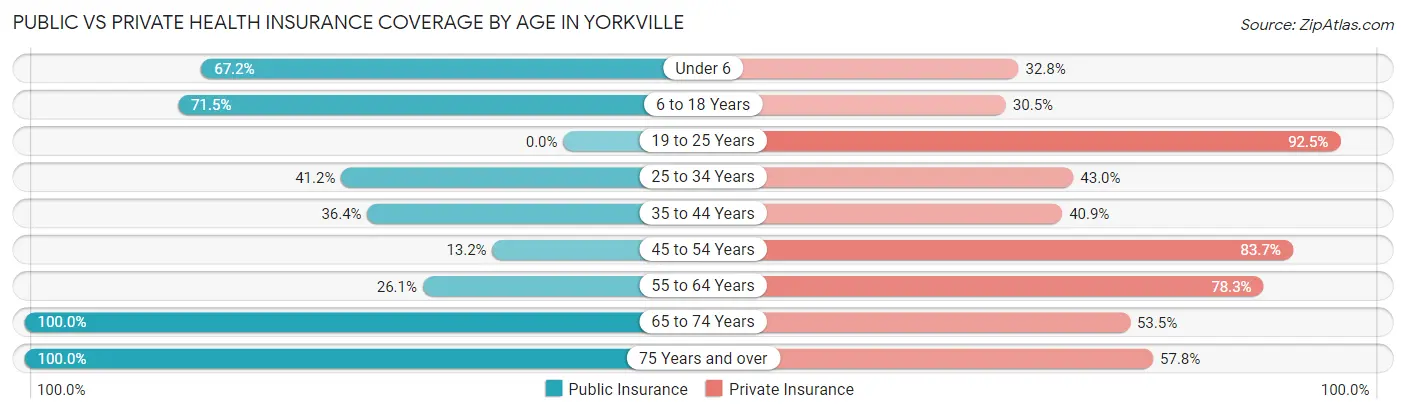
| Age Bracket | Public Insurance | Private Insurance |
| Under 6 | 43 (67.2%) | 21 (32.8%) |
| 6 to 18 Years | 108 (71.5%) | 46 (30.5%) |
| 19 to 25 Years | 0 (0.0%) | 37 (92.5%) |
| 25 to 34 Years | 47 (41.2%) | 49 (43.0%) |
| 35 to 44 Years | 24 (36.4%) | 27 (40.9%) |
| 45 to 54 Years | 25 (13.2%) | 159 (83.7%) |
| 55 to 64 Years | 24 (26.1%) | 72 (78.3%) |
| 65 to 74 Years | 129 (100.0%) | 69 (53.5%) |
| 75 Years and over | 90 (100.0%) | 52 (57.8%) |
| Total | 490 (52.3%) | 532 (56.8%) |
Disability Status by Sex by Age in Yorkville
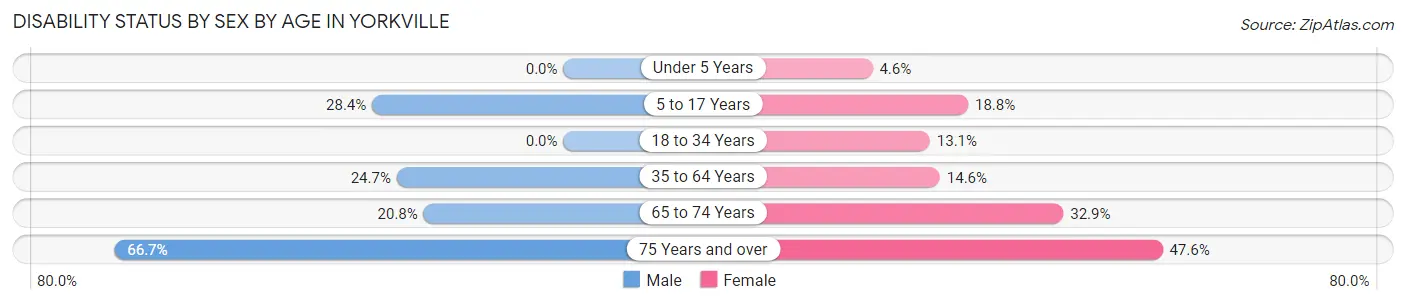
| Age Bracket | Male | Female |
| Under 5 Years | 0 (0.0%) | 2 (4.5%) |
| 5 to 17 Years | 23 (28.4%) | 12 (18.8%) |
| 18 to 34 Years | 0 (0.0%) | 14 (13.1%) |
| 35 to 64 Years | 47 (24.7%) | 23 (14.6%) |
| 65 to 74 Years | 11 (20.7%) | 25 (32.9%) |
| 75 Years and over | 32 (66.7%) | 20 (47.6%) |
Disability Class by Sex by Age in Yorkville
Disability Class: Hearing Difficulty
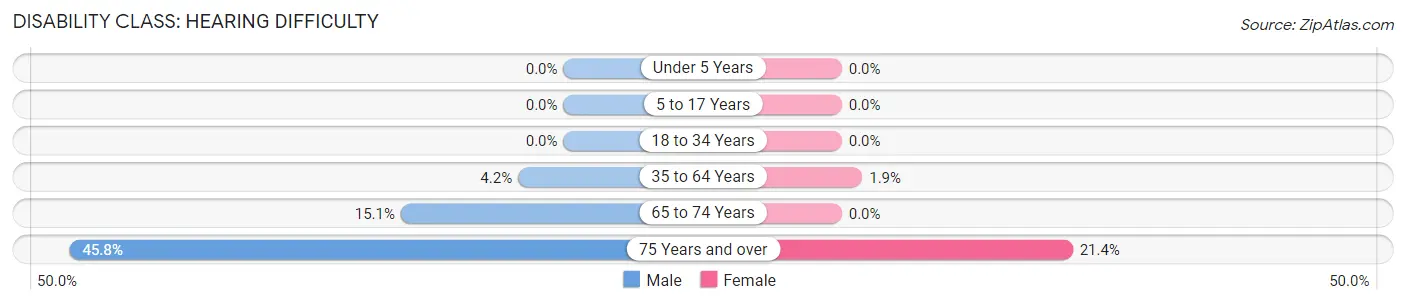
| Age Bracket | Male | Female |
| Under 5 Years | 0 (0.0%) | 0 (0.0%) |
| 5 to 17 Years | 0 (0.0%) | 0 (0.0%) |
| 18 to 34 Years | 0 (0.0%) | 0 (0.0%) |
| 35 to 64 Years | 8 (4.2%) | 3 (1.9%) |
| 65 to 74 Years | 8 (15.1%) | 0 (0.0%) |
| 75 Years and over | 22 (45.8%) | 9 (21.4%) |
Disability Class: Vision Difficulty
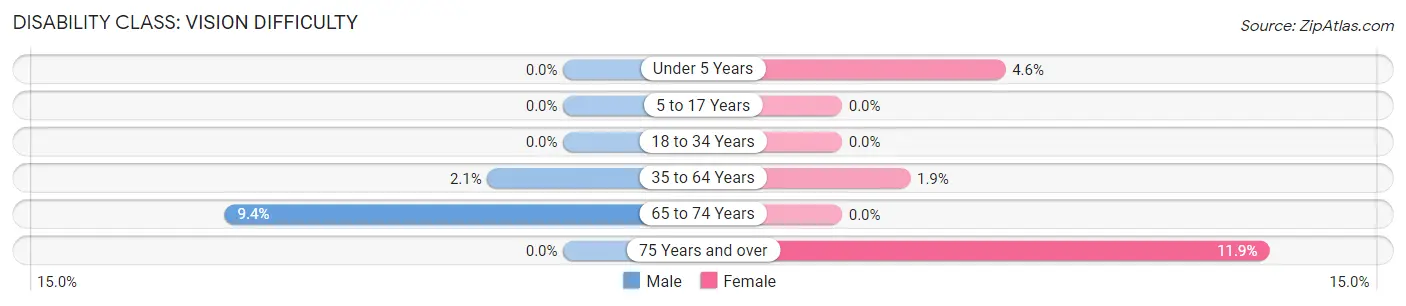
| Age Bracket | Male | Female |
| Under 5 Years | 0 (0.0%) | 2 (4.5%) |
| 5 to 17 Years | 0 (0.0%) | 0 (0.0%) |
| 18 to 34 Years | 0 (0.0%) | 0 (0.0%) |
| 35 to 64 Years | 4 (2.1%) | 3 (1.9%) |
| 65 to 74 Years | 5 (9.4%) | 0 (0.0%) |
| 75 Years and over | 0 (0.0%) | 5 (11.9%) |
Disability Class: Cognitive Difficulty
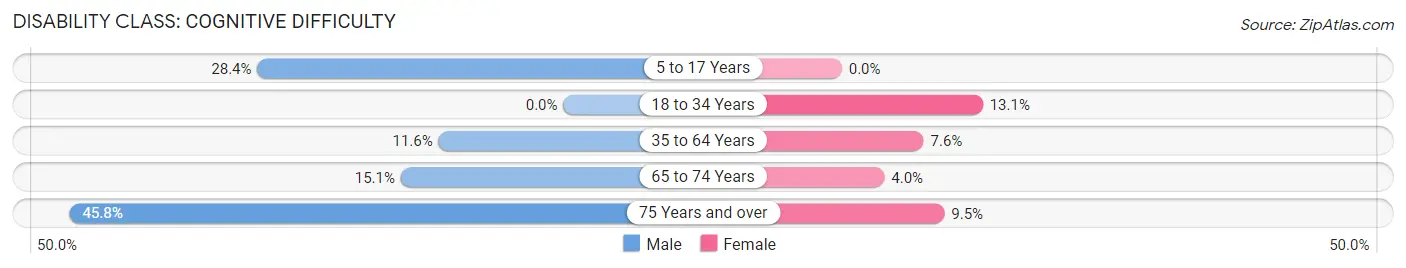
| Age Bracket | Male | Female |
| 5 to 17 Years | 23 (28.4%) | 0 (0.0%) |
| 18 to 34 Years | 0 (0.0%) | 14 (13.1%) |
| 35 to 64 Years | 22 (11.6%) | 12 (7.6%) |
| 65 to 74 Years | 8 (15.1%) | 3 (4.0%) |
| 75 Years and over | 22 (45.8%) | 4 (9.5%) |
Disability Class: Ambulatory Difficulty
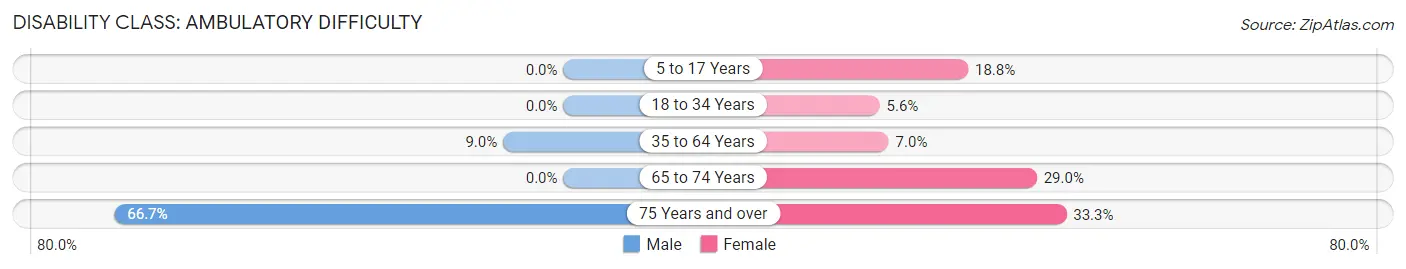
| Age Bracket | Male | Female |
| 5 to 17 Years | 0 (0.0%) | 12 (18.8%) |
| 18 to 34 Years | 0 (0.0%) | 6 (5.6%) |
| 35 to 64 Years | 17 (8.9%) | 11 (7.0%) |
| 65 to 74 Years | 0 (0.0%) | 22 (28.9%) |
| 75 Years and over | 32 (66.7%) | 14 (33.3%) |
Disability Class: Self-Care Difficulty
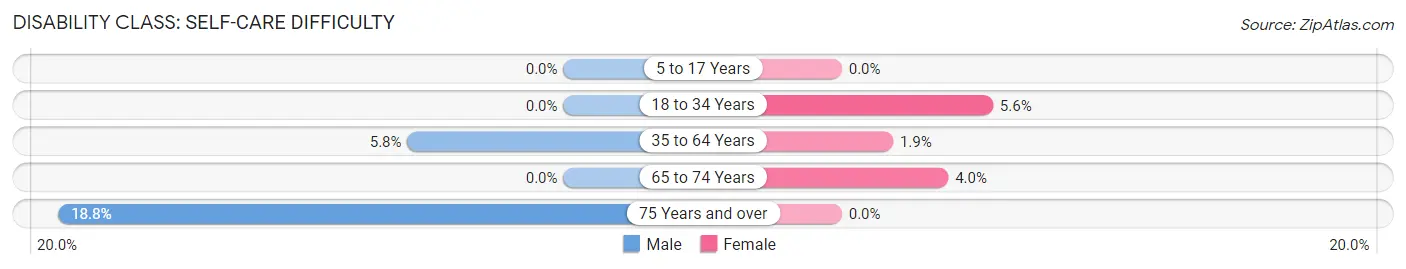
| Age Bracket | Male | Female |
| 5 to 17 Years | 0 (0.0%) | 0 (0.0%) |
| 18 to 34 Years | 0 (0.0%) | 6 (5.6%) |
| 35 to 64 Years | 11 (5.8%) | 3 (1.9%) |
| 65 to 74 Years | 0 (0.0%) | 3 (4.0%) |
| 75 Years and over | 9 (18.8%) | 0 (0.0%) |
Technology Access in Yorkville
Computing Device Access in Yorkville
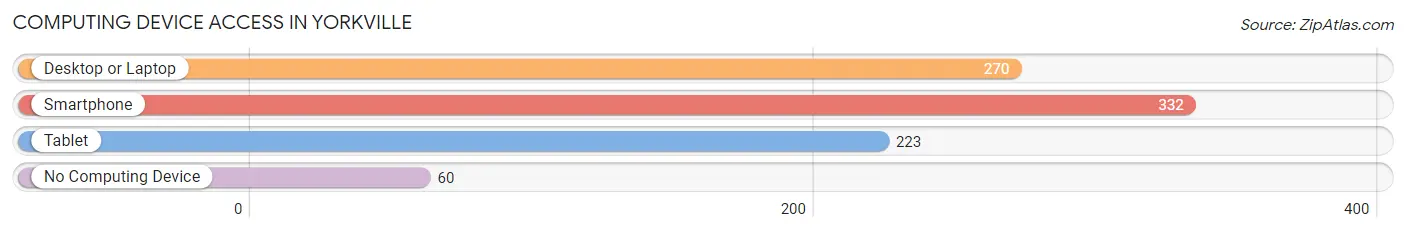
| Device Type | # Households | % Households |
| Desktop or Laptop | 270 | 64.6% |
| Smartphone | 332 | 79.4% |
| Tablet | 223 | 53.3% |
| No Computing Device | 60 | 14.3% |
| Total | 418 | 100.0% |
Internet Access in Yorkville
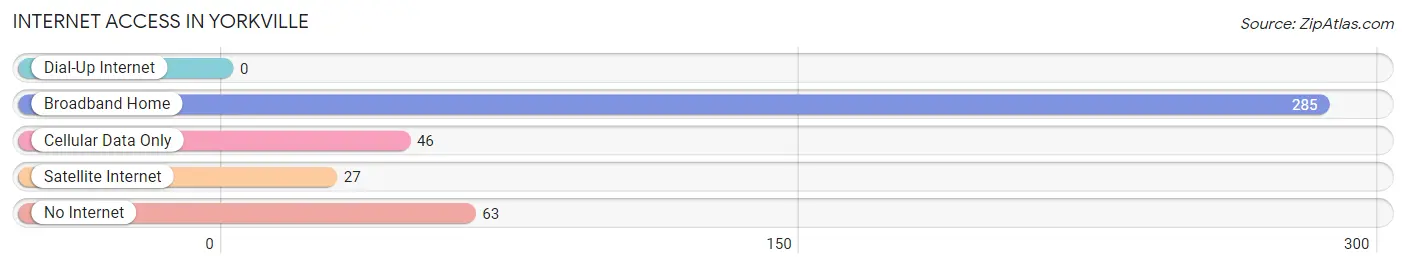
| Internet Type | # Households | % Households |
| Dial-Up Internet | 0 | 0.0% |
| Broadband Home | 285 | 68.2% |
| Cellular Data Only | 46 | 11.0% |
| Satellite Internet | 27 | 6.5% |
| No Internet | 63 | 15.1% |
| Total | 418 | 100.0% |
Yorkville Summary
Yorkville, Ohio is a small village located in Jefferson County, Ohio. It is situated on the banks of the Ohio River, approximately 25 miles east of Steubenville. The village has a population of approximately 1,000 people and is part of the Steubenville-Weirton Metropolitan Statistical Area.
History
Yorkville was founded in 1817 by a group of settlers from Pennsylvania. The village was named after York, Pennsylvania, the hometown of many of the settlers. The village was originally a farming community, but it soon developed into a small industrial center. The first industry in the village was a sawmill, which was built in 1820. This was followed by a gristmill, a tannery, and a woolen mill.
In 1845, the Ohio and Pennsylvania Railroad was built through the village, connecting it to Steubenville and other nearby towns. This allowed for the growth of the village, as it became a stop on the railroad. The railroad also allowed for the shipment of goods from the village to other parts of the state.
In the late 19th century, the village experienced a period of growth. Several new businesses were established, including a brickyard, a furniture factory, and a canning factory. The village also became home to several churches, including the Methodist Episcopal Church, the Presbyterian Church, and the Catholic Church.
Geography
Yorkville is located in the eastern part of Jefferson County, Ohio. It is situated on the banks of the Ohio River, approximately 25 miles east of Steubenville. The village is located in a rural area, with the nearest major city being Pittsburgh, which is approximately 50 miles away.
The village is surrounded by rolling hills and farmland. The terrain is mostly flat, with some areas of higher elevation. The climate in the area is generally mild, with temperatures ranging from the low 30s in the winter to the mid-80s in the summer.
Economy
The economy of Yorkville is largely based on agriculture and manufacturing. The village is home to several small businesses, including a grocery store, a hardware store, and a restaurant. The village also has a few small industrial plants, which produce a variety of products, including furniture, clothing, and canned goods.
The village is also home to several farms, which produce a variety of crops, including corn, soybeans, and wheat. The village also has a few small wineries, which produce a variety of wines.
Demographics
As of the 2010 census, the population of Yorkville was 1,000 people. The racial makeup of the village was 97.2% White, 0.7% African American, 0.2% Native American, 0.2% Asian, and 1.7% from other races. The median household income in the village was $37,500, and the median family income was $45,000. The per capita income in the village was $18,000.
Common Questions
What is Per Capita Income in Yorkville?
Per Capita income in Yorkville is $37,184.
What is the Median Family Income in Yorkville?
Median Family Income in Yorkville is $64,375.
What is the Median Household income in Yorkville?
Median Household Income in Yorkville is $45,592.
What is Income or Wage Gap in Yorkville?
Income or Wage Gap in Yorkville is 43.9%.
Women in Yorkville earn 56.1 cents for every dollar earned by a man.
What is Inequality or Gini Index in Yorkville?
Inequality or Gini Index in Yorkville is 0.47.
What is the Total Population of Yorkville?
Total Population of Yorkville is 959.
What is the Total Male Population of Yorkville?
Total Male Population of Yorkville is 456.
What is the Total Female Population of Yorkville?
Total Female Population of Yorkville is 503.
What is the Ratio of Males per 100 Females in Yorkville?
There are 90.66 Males per 100 Females in Yorkville.
What is the Ratio of Females per 100 Males in Yorkville?
There are 110.31 Females per 100 Males in Yorkville.
What is the Median Population Age in Yorkville?
Median Population Age in Yorkville is 47.5 Years.
What is the Average Family Size in Yorkville
Average Family Size in Yorkville is 2.9 People.
What is the Average Household Size in Yorkville
Average Household Size in Yorkville is 2.2 People.
How Large is the Labor Force in Yorkville?
There are 424 People in the Labor Forcein in Yorkville.
What is the Percentage of People in the Labor Force in Yorkville?
54.9% of People are in the Labor Force in Yorkville.
What is the Unemployment Rate in Yorkville?
Unemployment Rate in Yorkville is 7.3%.