Pleasant Hill, OH Map & Demographics
Pleasant Hill Map
Pleasant Hill Overview
$25,815
PER CAPITA INCOME
$73,611
AVG FAMILY INCOME
$65,875
AVG HOUSEHOLD INCOME
16.5%
WAGE / INCOME GAP [ % ]
83.5¢/ $1
WAGE / INCOME GAP [ $ ]
0.32
INEQUALITY / GINI INDEX
1,390
TOTAL POPULATION
685
MALE POPULATION
705
FEMALE POPULATION
97.16
MALES / 100 FEMALES
102.92
FEMALES / 100 MALES
37.6
MEDIAN AGE
3.6
AVG FAMILY SIZE
3.1
AVG HOUSEHOLD SIZE
624
LABOR FORCE [ PEOPLE ]
62.5%
PERCENT IN LABOR FORCE
3.0%
UNEMPLOYMENT RATE
Pleasant Hill Zip Codes
Pleasant Hill Area Codes
Income in Pleasant Hill
Income Overview in Pleasant Hill
Per Capita Income in Pleasant Hill is $25,815, while median incomes of families and households are $73,611 and $65,875 respectively.
| Characteristic | Number | Measure |
| Per Capita Income | 1,390 | $25,815 |
| Median Family Income | 326 | $73,611 |
| Mean Family Income | 326 | $82,099 |
| Median Household Income | 450 | $65,875 |
| Mean Household Income | 450 | $73,106 |
| Income Deficit | 326 | $0 |
| Wage / Income Gap (%) | 1,390 | 16.46% |
| Wage / Income Gap ($) | 1,390 | 83.54¢ per $1 |
| Gini / Inequality Index | 1,390 | 0.32 |
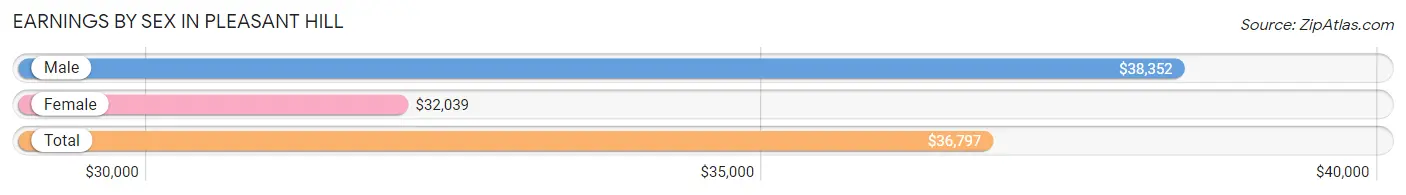
Earnings by Sex in Pleasant Hill
Average Earnings in Pleasant Hill are $36,797, $38,352 for men and $32,039 for women, a difference of 16.5%.
| Sex | Number | Average Earnings |
| Male | 433 (60.8%) | $38,352 |
| Female | 279 (39.2%) | $32,039 |
| Total | 712 (100.0%) | $36,797 |
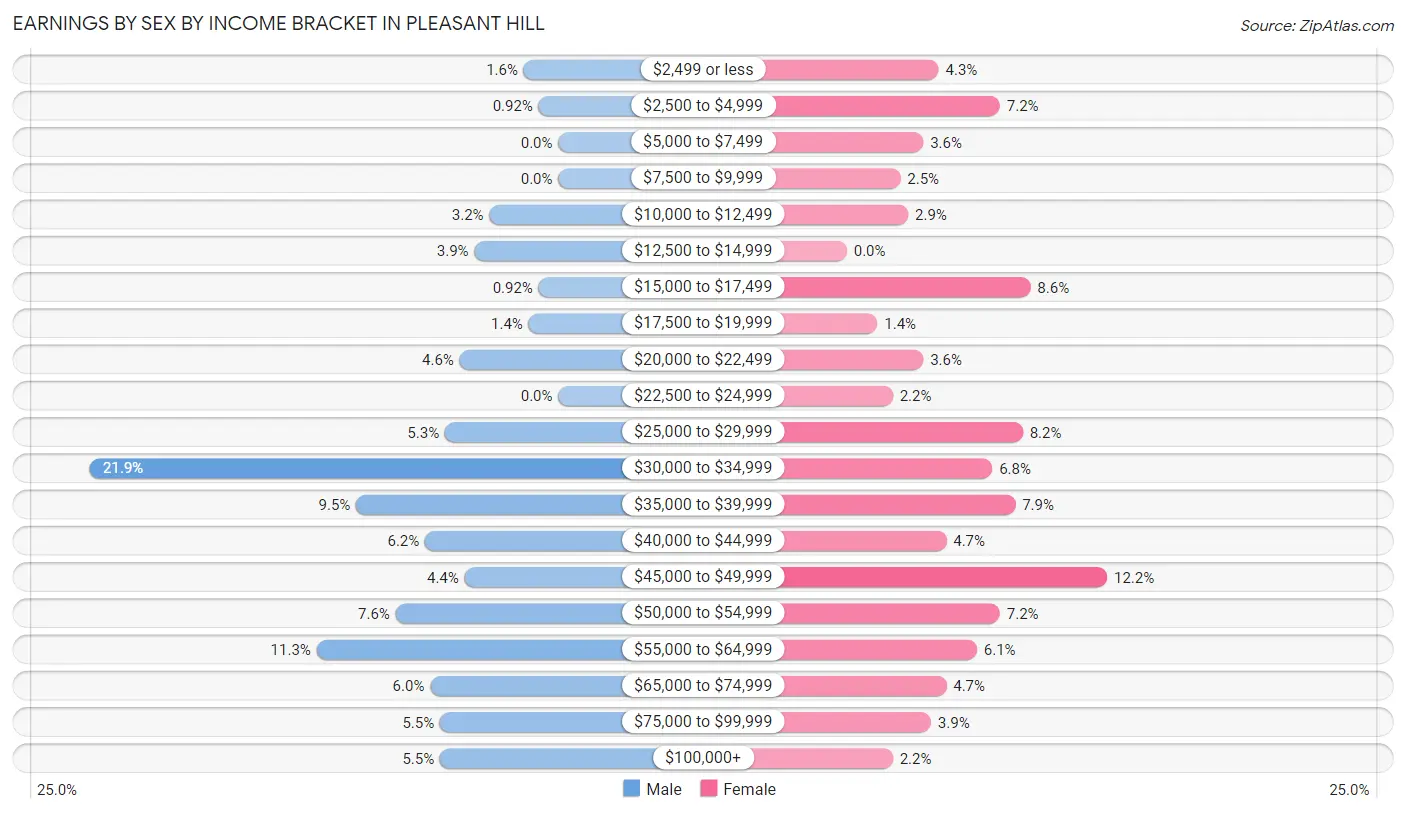
Earnings by Sex by Income Bracket in Pleasant Hill
The most common earnings brackets in Pleasant Hill are $30,000 to $34,999 for men (95 | 21.9%) and $45,000 to $49,999 for women (34 | 12.2%).
| Income | Male | Female |
| $2,499 or less | 7 (1.6%) | 12 (4.3%) |
| $2,500 to $4,999 | 4 (0.9%) | 20 (7.2%) |
| $5,000 to $7,499 | 0 (0.0%) | 10 (3.6%) |
| $7,500 to $9,999 | 0 (0.0%) | 7 (2.5%) |
| $10,000 to $12,499 | 14 (3.2%) | 8 (2.9%) |
| $12,500 to $14,999 | 17 (3.9%) | 0 (0.0%) |
| $15,000 to $17,499 | 4 (0.9%) | 24 (8.6%) |
| $17,500 to $19,999 | 6 (1.4%) | 4 (1.4%) |
| $20,000 to $22,499 | 20 (4.6%) | 10 (3.6%) |
| $22,500 to $24,999 | 0 (0.0%) | 6 (2.1%) |
| $25,000 to $29,999 | 23 (5.3%) | 23 (8.2%) |
| $30,000 to $34,999 | 95 (21.9%) | 19 (6.8%) |
| $35,000 to $39,999 | 41 (9.5%) | 22 (7.9%) |
| $40,000 to $44,999 | 27 (6.2%) | 13 (4.7%) |
| $45,000 to $49,999 | 19 (4.4%) | 34 (12.2%) |
| $50,000 to $54,999 | 33 (7.6%) | 20 (7.2%) |
| $55,000 to $64,999 | 49 (11.3%) | 17 (6.1%) |
| $65,000 to $74,999 | 26 (6.0%) | 13 (4.7%) |
| $75,000 to $99,999 | 24 (5.5%) | 11 (3.9%) |
| $100,000+ | 24 (5.5%) | 6 (2.1%) |
| Total | 433 (100.0%) | 279 (100.0%) |
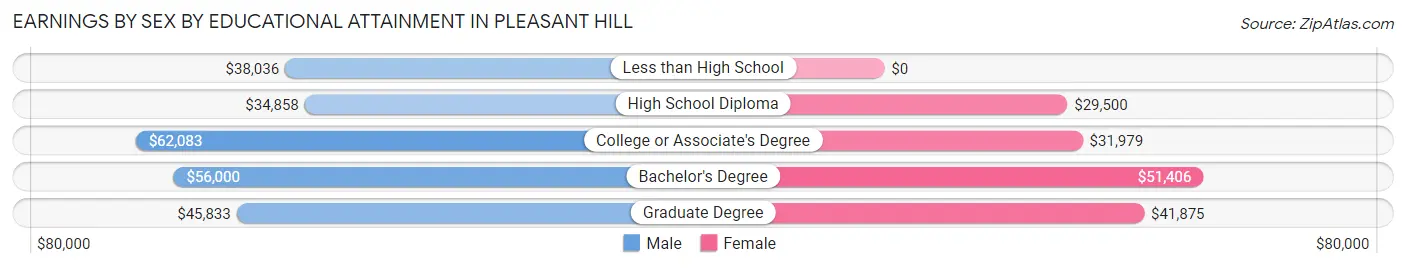
Earnings by Sex by Educational Attainment in Pleasant Hill
Average earnings in Pleasant Hill are $40,060 for men and $37,019 for women, a difference of 7.6%. Men with an educational attainment of college or associate's degree enjoy the highest average annual earnings of $62,083, while those with high school diploma education earn the least with $34,858. Women with an educational attainment of bachelor's degree earn the most with the average annual earnings of $51,406, while those with high school diploma education have the smallest earnings of $29,500.
| Educational Attainment | Male Income | Female Income |
| Less than High School | $38,036 | $0 |
| High School Diploma | $34,858 | $29,500 |
| College or Associate's Degree | $62,083 | $31,979 |
| Bachelor's Degree | $56,000 | $51,406 |
| Graduate Degree | $45,833 | $41,875 |
| Total | $40,060 | $37,019 |
Family Income in Pleasant Hill
Family Income Brackets in Pleasant Hill
According to the Pleasant Hill family income data, there are 85 families falling into the $50,000 to $74,999 income range, which is the most common income bracket and makes up 26.1% of all families.
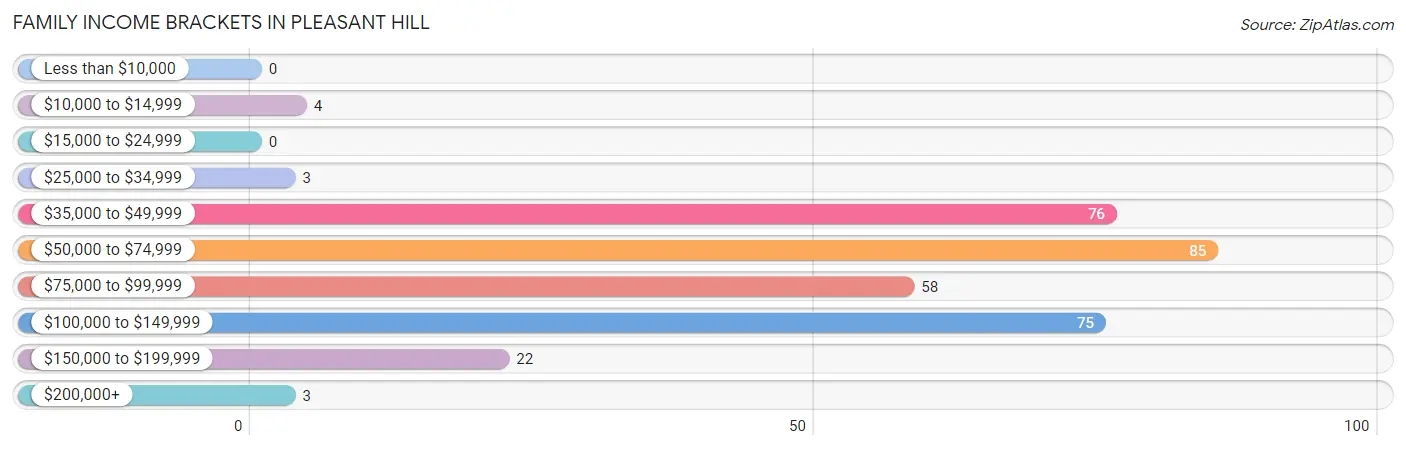
| Income Bracket | # Families | % Families |
| Less than $10,000 | 0 | 0.0% |
| $10,000 to $14,999 | 4 | 1.2% |
| $15,000 to $24,999 | 0 | 0.0% |
| $25,000 to $34,999 | 3 | 0.9% |
| $35,000 to $49,999 | 76 | 23.3% |
| $50,000 to $74,999 | 85 | 26.1% |
| $75,000 to $99,999 | 58 | 17.8% |
| $100,000 to $149,999 | 75 | 23.0% |
| $150,000 to $199,999 | 22 | 6.7% |
| $200,000+ | 3 | 0.9% |
Family Income by Famaliy Size in Pleasant Hill
4-person families (41 | 12.6%) account for the highest median family income in Pleasant Hill with $106,563 per family, while 2-person families (153 | 46.9%) have the highest median income of $32,684 per family member.
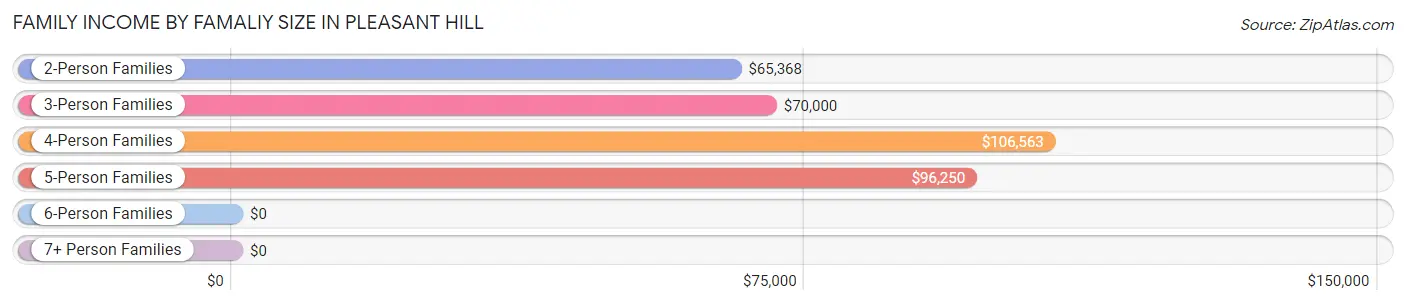
| Income Bracket | # Families | Median Income |
| 2-Person Families | 153 (46.9%) | $65,368 |
| 3-Person Families | 78 (23.9%) | $70,000 |
| 4-Person Families | 41 (12.6%) | $106,563 |
| 5-Person Families | 33 (10.1%) | $96,250 |
| 6-Person Families | 18 (5.5%) | $0 |
| 7+ Person Families | 3 (0.9%) | $0 |
| Total | 326 (100.0%) | $73,611 |
Family Income by Number of Earners in Pleasant Hill
The median family income in Pleasant Hill is $73,611, with families comprising 3+ earners (46) having the highest median family income of $105,833, while families with no earners (42) have the lowest median family income of $48,214, accounting for 14.1% and 12.9% of families, respectively.
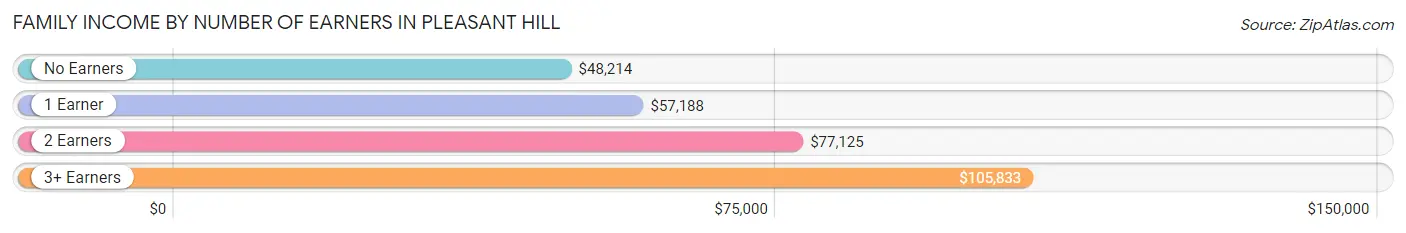
| Number of Earners | # Families | Median Income |
| No Earners | 42 (12.9%) | $48,214 |
| 1 Earner | 87 (26.7%) | $57,188 |
| 2 Earners | 151 (46.3%) | $77,125 |
| 3+ Earners | 46 (14.1%) | $105,833 |
| Total | 326 (100.0%) | $73,611 |
Household Income in Pleasant Hill
Household Income Brackets in Pleasant Hill
With 103 households falling in the category, the $35,000 to $49,999 income range is the most frequent in Pleasant Hill, accounting for 22.9% of all households. In contrast, only 2 households (0.4%) fall into the less than $10,000 income bracket, making it the least populous group.
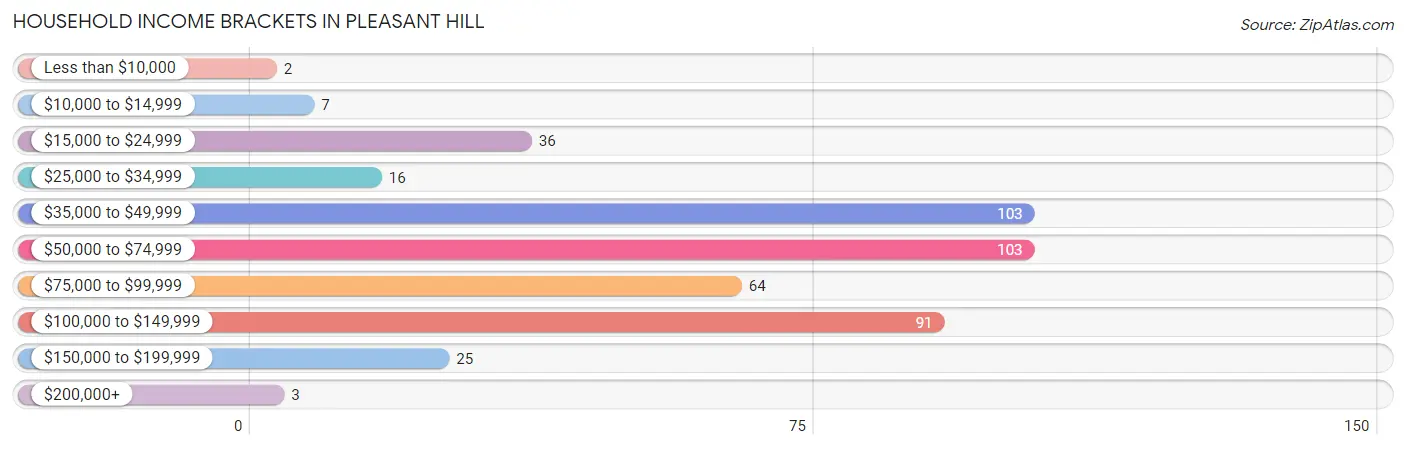
| Income Bracket | # Households | % Households |
| Less than $10,000 | 2 | 0.4% |
| $10,000 to $14,999 | 7 | 1.6% |
| $15,000 to $24,999 | 36 | 8.0% |
| $25,000 to $34,999 | 16 | 3.6% |
| $35,000 to $49,999 | 103 | 22.9% |
| $50,000 to $74,999 | 103 | 22.9% |
| $75,000 to $99,999 | 64 | 14.2% |
| $100,000 to $149,999 | 91 | 20.2% |
| $150,000 to $199,999 | 25 | 5.6% |
| $200,000+ | 3 | 0.7% |
Household Income by Householder Age in Pleasant Hill
The median household income in Pleasant Hill is $65,875, with the highest median household income of $79,625 found in the 25 to 44 years age bracket for the primary householder. A total of 147 households (32.7%) fall into this category. Meanwhile, the 65+ years age bracket for the primary householder has the lowest median household income of $46,964, with 147 households (32.7%) in this group.
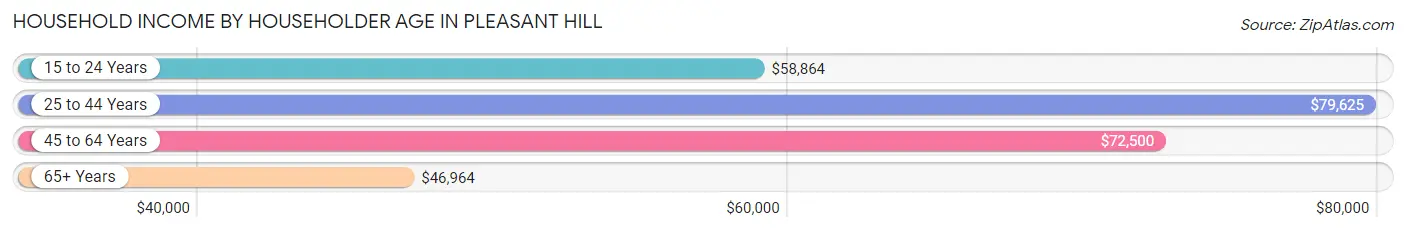
| Income Bracket | # Households | Median Income |
| 15 to 24 Years | 18 (4.0%) | $58,864 |
| 25 to 44 Years | 147 (32.7%) | $79,625 |
| 45 to 64 Years | 138 (30.7%) | $72,500 |
| 65+ Years | 147 (32.7%) | $46,964 |
| Total | 450 (100.0%) | $65,875 |
Poverty in Pleasant Hill
Income Below Poverty by Sex and Age in Pleasant Hill
With 1.4% poverty level for males and 4.7% for females among the residents of Pleasant Hill, 15 year old males and 15 year old females are the most vulnerable to poverty, with 5 males (100.0%) and 23 females (82.1%) in their respective age groups living below the poverty level.
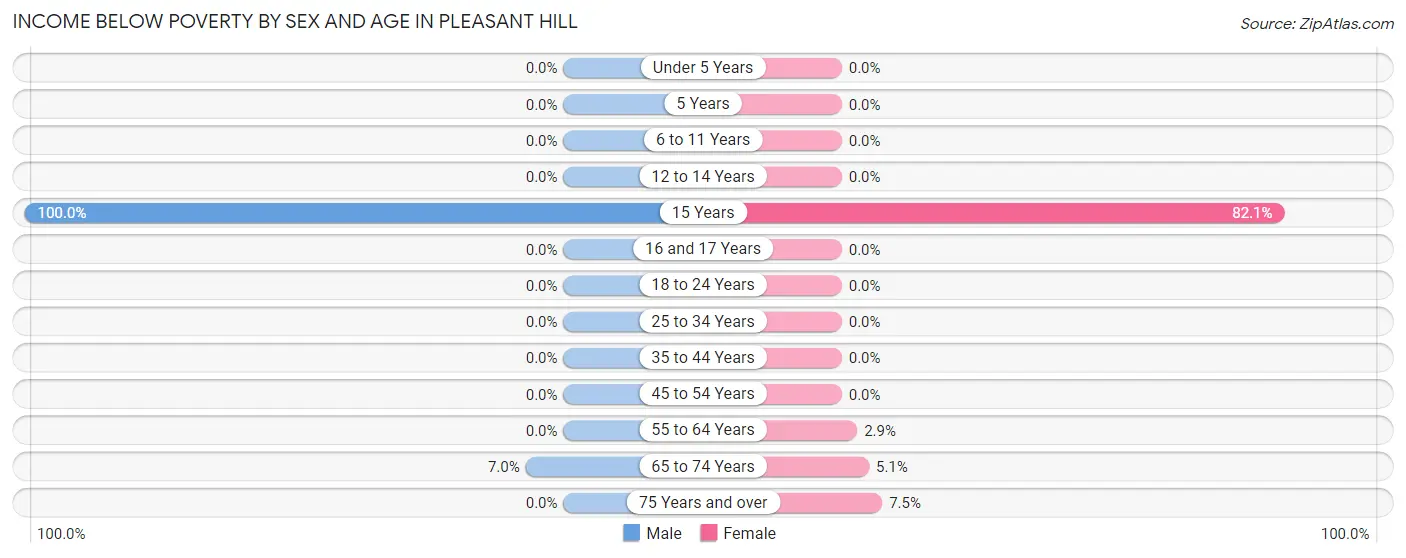
| Age Bracket | Male | Female |
| Under 5 Years | 0 (0.0%) | 0 (0.0%) |
| 5 Years | 0 (0.0%) | 0 (0.0%) |
| 6 to 11 Years | 0 (0.0%) | 0 (0.0%) |
| 12 to 14 Years | 0 (0.0%) | 0 (0.0%) |
| 15 Years | 5 (100.0%) | 23 (82.1%) |
| 16 and 17 Years | 0 (0.0%) | 0 (0.0%) |
| 18 to 24 Years | 0 (0.0%) | 0 (0.0%) |
| 25 to 34 Years | 0 (0.0%) | 0 (0.0%) |
| 35 to 44 Years | 0 (0.0%) | 0 (0.0%) |
| 45 to 54 Years | 0 (0.0%) | 0 (0.0%) |
| 55 to 64 Years | 0 (0.0%) | 2 (2.9%) |
| 65 to 74 Years | 4 (7.0%) | 4 (5.1%) |
| 75 Years and over | 0 (0.0%) | 3 (7.5%) |
| Total | 9 (1.4%) | 32 (4.7%) |
Income Above Poverty by Sex and Age in Pleasant Hill
According to the poverty statistics in Pleasant Hill, males aged under 5 years and females aged under 5 years are the age groups that are most secure financially, with 100.0% of males and 100.0% of females in these age groups living above the poverty line.
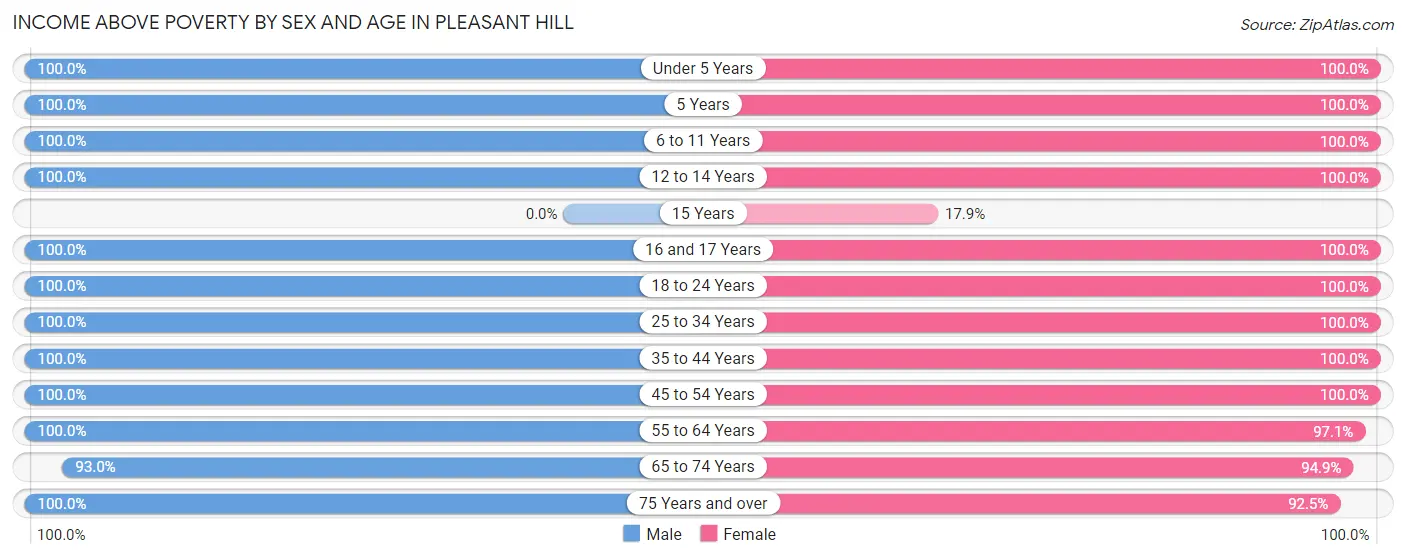
| Age Bracket | Male | Female |
| Under 5 Years | 26 (100.0%) | 43 (100.0%) |
| 5 Years | 5 (100.0%) | 7 (100.0%) |
| 6 to 11 Years | 65 (100.0%) | 37 (100.0%) |
| 12 to 14 Years | 27 (100.0%) | 106 (100.0%) |
| 15 Years | 0 (0.0%) | 5 (17.9%) |
| 16 and 17 Years | 15 (100.0%) | 28 (100.0%) |
| 18 to 24 Years | 45 (100.0%) | 47 (100.0%) |
| 25 to 34 Years | 80 (100.0%) | 48 (100.0%) |
| 35 to 44 Years | 111 (100.0%) | 96 (100.0%) |
| 45 to 54 Years | 161 (100.0%) | 57 (100.0%) |
| 55 to 64 Years | 32 (100.0%) | 68 (97.1%) |
| 65 to 74 Years | 53 (93.0%) | 75 (94.9%) |
| 75 Years and over | 33 (100.0%) | 37 (92.5%) |
| Total | 653 (98.6%) | 654 (95.3%) |
Income Below Poverty Among Married-Couple Families in Pleasant Hill
The poverty statistics for married-couple families in Pleasant Hill show that 1.5% or 4 of the total 266 families live below the poverty line. Families with no children have the highest poverty rate of 3.0%, comprising of 4 families. On the other hand, families with 1 or 2 children have the lowest poverty rate of 0.0%, which includes 0 families.
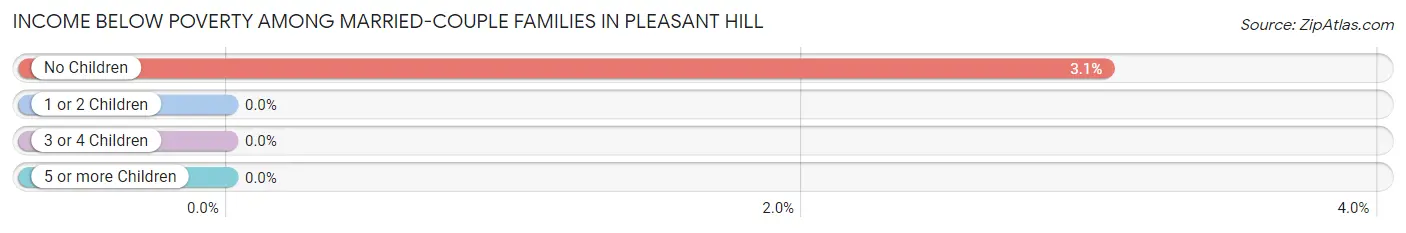
| Children | Above Poverty | Below Poverty |
| No Children | 127 (97.0%) | 4 (3.0%) |
| 1 or 2 Children | 89 (100.0%) | 0 (0.0%) |
| 3 or 4 Children | 43 (100.0%) | 0 (0.0%) |
| 5 or more Children | 3 (100.0%) | 0 (0.0%) |
| Total | 262 (98.5%) | 4 (1.5%) |
Income Below Poverty Among Single-Parent Households in Pleasant Hill
| Children | Single Father | Single Mother |
| No Children | 0 (0.0%) | 0 (0.0%) |
| 1 or 2 Children | 0 (0.0%) | 0 (0.0%) |
| 3 or 4 Children | 0 (0.0%) | 0 (0.0%) |
| 5 or more Children | 0 (0.0%) | 0 (0.0%) |
| Total | 0 (0.0%) | 0 (0.0%) |
Income Below Poverty Among Married-Couple vs Single-Parent Households in Pleasant Hill
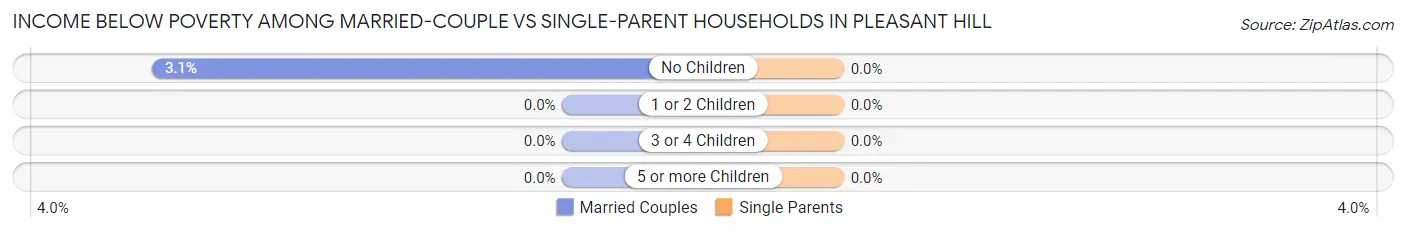
| Children | Married-Couple Families | Single-Parent Households |
| No Children | 4 (3.0%) | 0 (0.0%) |
| 1 or 2 Children | 0 (0.0%) | 0 (0.0%) |
| 3 or 4 Children | 0 (0.0%) | 0 (0.0%) |
| 5 or more Children | 0 (0.0%) | 0 (0.0%) |
| Total | 4 (1.5%) | 0 (0.0%) |
Race in Pleasant Hill
The most populous races in Pleasant Hill are White / Caucasian (1,271 | 91.4%), Two or more Races (114 | 8.2%), and Hispanic or Latino (4 | 0.3%).
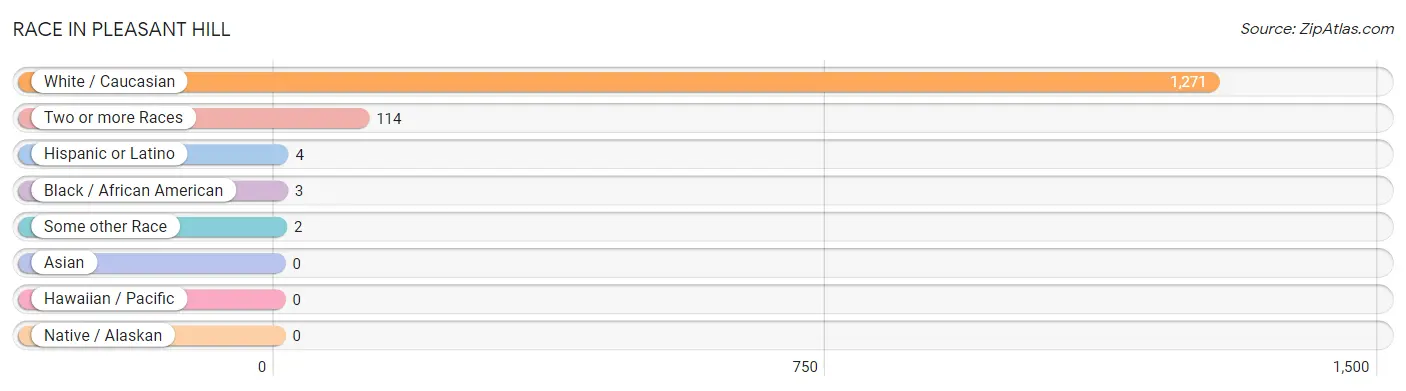
| Race | # Population | % Population |
| Asian | 0 | 0.0% |
| Black / African American | 3 | 0.2% |
| Hawaiian / Pacific | 0 | 0.0% |
| Hispanic or Latino | 4 | 0.3% |
| Native / Alaskan | 0 | 0.0% |
| White / Caucasian | 1,271 | 91.4% |
| Two or more Races | 114 | 8.2% |
| Some other Race | 2 | 0.1% |
| Total | 1,390 | 100.0% |
Ancestry in Pleasant Hill
The most populous ancestries reported in Pleasant Hill are German (411 | 29.6%), Irish (145 | 10.4%), English (130 | 9.3%), American (111 | 8.0%), and Italian (44 | 3.2%), together accounting for 60.5% of all Pleasant Hill residents.
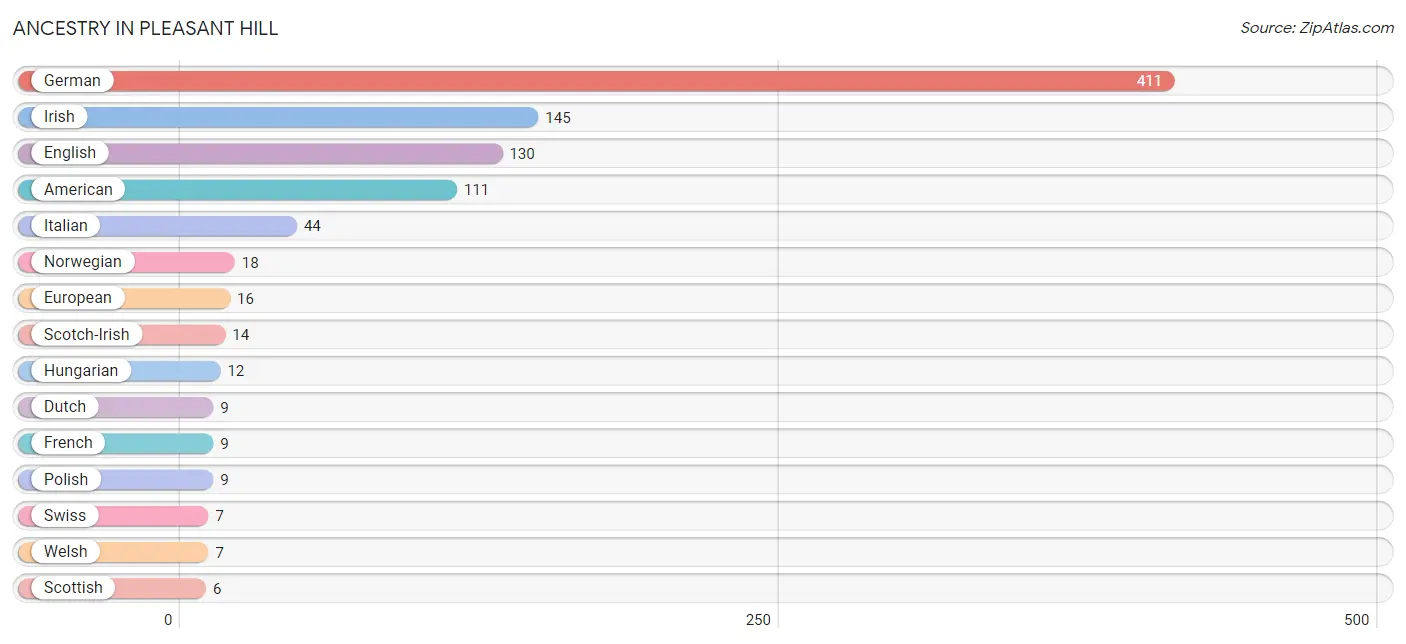
| Ancestry | # Population | % Population |
| African | 3 | 0.2% |
| American | 111 | 8.0% |
| Cherokee | 3 | 0.2% |
| Cheyenne | 2 | 0.1% |
| Dutch | 9 | 0.6% |
| Eastern European | 5 | 0.4% |
| English | 130 | 9.3% |
| European | 16 | 1.1% |
| French | 9 | 0.6% |
| German | 411 | 29.6% |
| Hmong | 2 | 0.1% |
| Hungarian | 12 | 0.9% |
| Irish | 145 | 10.4% |
| Italian | 44 | 3.2% |
| Norwegian | 18 | 1.3% |
| Polish | 9 | 0.6% |
| Puerto Rican | 2 | 0.1% |
| Scandinavian | 2 | 0.1% |
| Scotch-Irish | 14 | 1.0% |
| Scottish | 6 | 0.4% |
| Subsaharan African | 3 | 0.2% |
| Swiss | 7 | 0.5% |
| Thai | 2 | 0.1% |
| Welsh | 7 | 0.5% | View All 24 Rows |
Immigrants in Pleasant Hill
The most numerous immigrant groups reported in Pleasant Hill came from Europe (2 | 0.1%), Germany (2 | 0.1%), and Western Europe (2 | 0.1%), together accounting for 0.4% of all Pleasant Hill residents.
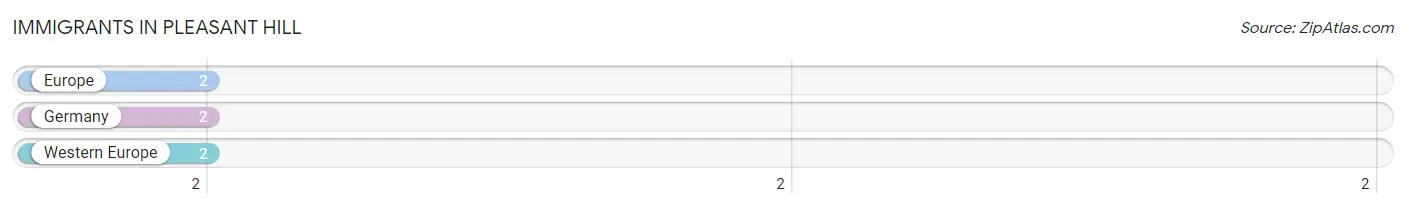
| Immigration Origin | # Population | % Population |
| Europe | 2 | 0.1% |
| Germany | 2 | 0.1% |
| Western Europe | 2 | 0.1% | View All 3 Rows |
Sex and Age in Pleasant Hill
Sex and Age in Pleasant Hill
The most populous age groups in Pleasant Hill are 50 to 54 Years (116 | 16.9%) for men and 10 to 14 Years (127 | 18.0%) for women.
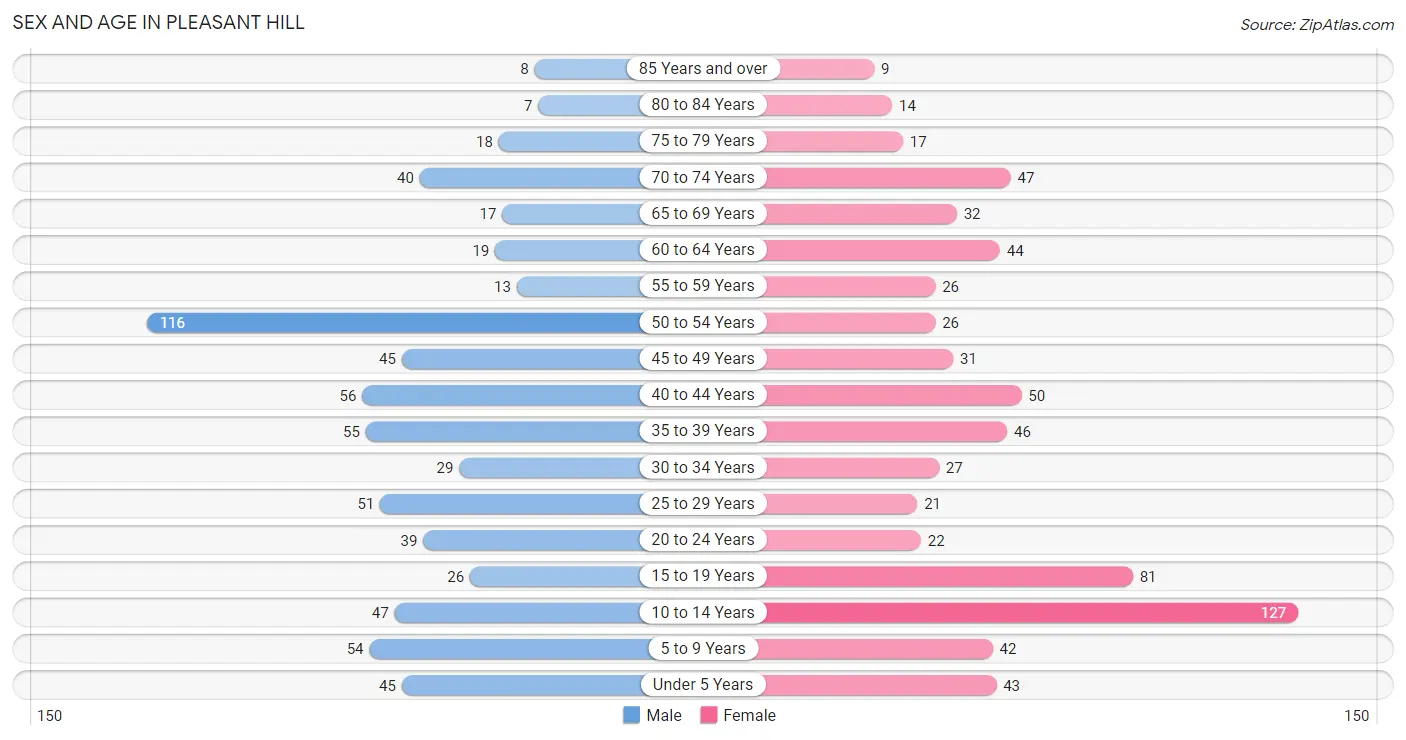
| Age Bracket | Male | Female |
| Under 5 Years | 45 (6.6%) | 43 (6.1%) |
| 5 to 9 Years | 54 (7.9%) | 42 (6.0%) |
| 10 to 14 Years | 47 (6.9%) | 127 (18.0%) |
| 15 to 19 Years | 26 (3.8%) | 81 (11.5%) |
| 20 to 24 Years | 39 (5.7%) | 22 (3.1%) |
| 25 to 29 Years | 51 (7.4%) | 21 (3.0%) |
| 30 to 34 Years | 29 (4.2%) | 27 (3.8%) |
| 35 to 39 Years | 55 (8.0%) | 46 (6.5%) |
| 40 to 44 Years | 56 (8.2%) | 50 (7.1%) |
| 45 to 49 Years | 45 (6.6%) | 31 (4.4%) |
| 50 to 54 Years | 116 (16.9%) | 26 (3.7%) |
| 55 to 59 Years | 13 (1.9%) | 26 (3.7%) |
| 60 to 64 Years | 19 (2.8%) | 44 (6.2%) |
| 65 to 69 Years | 17 (2.5%) | 32 (4.5%) |
| 70 to 74 Years | 40 (5.8%) | 47 (6.7%) |
| 75 to 79 Years | 18 (2.6%) | 17 (2.4%) |
| 80 to 84 Years | 7 (1.0%) | 14 (2.0%) |
| 85 Years and over | 8 (1.2%) | 9 (1.3%) |
| Total | 685 (100.0%) | 705 (100.0%) |
Families and Households in Pleasant Hill
Median Family Size in Pleasant Hill
The median family size in Pleasant Hill is 3.57 persons per family, with single male/father families (31 | 9.5%) accounting for the largest median family size of 4.19 persons per family. On the other hand, single female/mother families (29 | 8.9%) represent the smallest median family size with 2.72 persons per family.
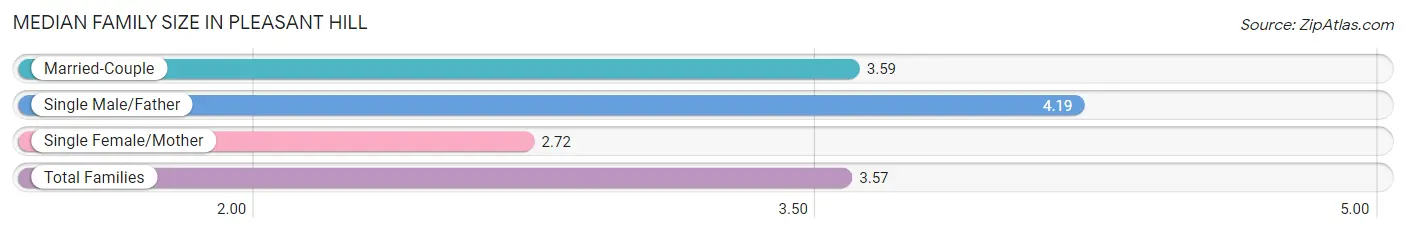
| Family Type | # Families | Family Size |
| Married-Couple | 266 (81.6%) | 3.59 |
| Single Male/Father | 31 (9.5%) | 4.19 |
| Single Female/Mother | 29 (8.9%) | 2.72 |
| Total Families | 326 (100.0%) | 3.57 |
Median Household Size in Pleasant Hill
The median household size in Pleasant Hill is 3.09 persons per household, with single male/father households (31 | 6.9%) accounting for the largest median household size of 4.74 persons per household. non-family households (124 | 27.6%) represent the smallest median household size with 1.17 persons per household.
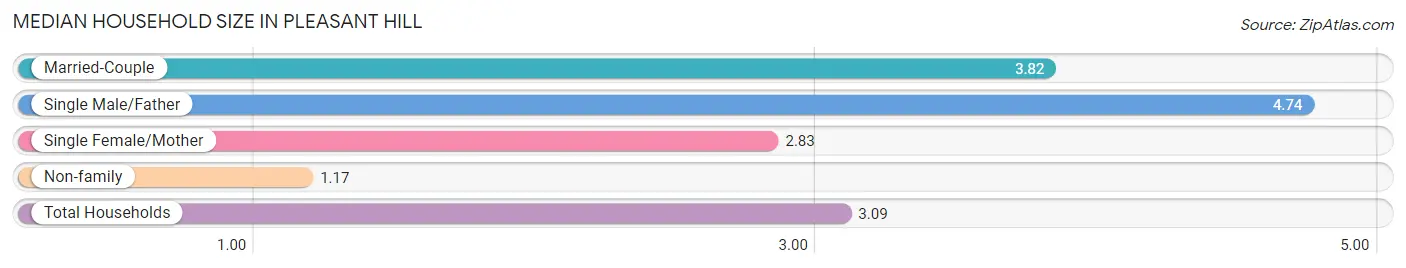
| Household Type | # Households | Household Size |
| Married-Couple | 266 (59.1%) | 3.82 |
| Single Male/Father | 31 (6.9%) | 4.74 |
| Single Female/Mother | 29 (6.4%) | 2.83 |
| Non-family | 124 (27.6%) | 1.17 |
| Total Households | 450 (100.0%) | 3.09 |
Household Size by Marriage Status in Pleasant Hill
Out of a total of 450 households in Pleasant Hill, 326 (72.4%) are family households, while 124 (27.6%) are nonfamily households. The most numerous type of family households are 2-person households, comprising 146, and the most common type of nonfamily households are 1-person households, comprising 109.
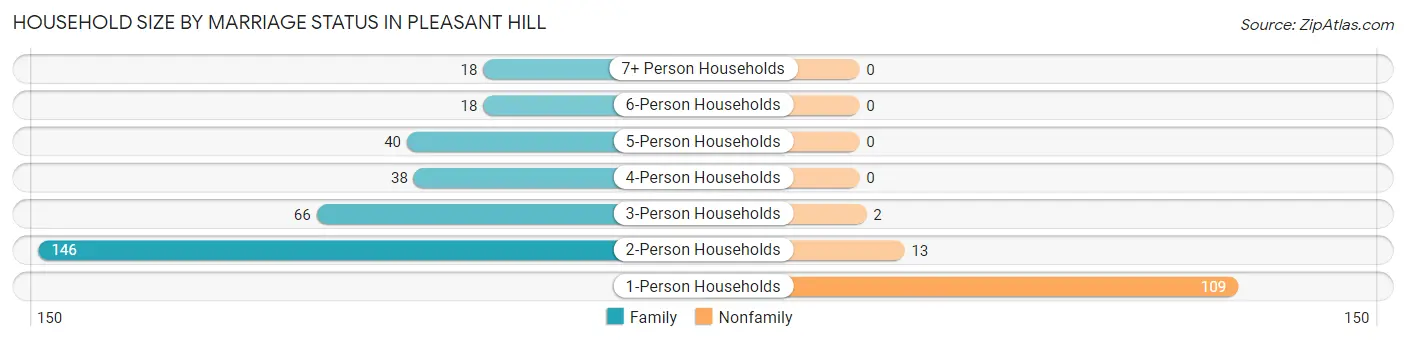
| Household Size | Family Households | Nonfamily Households |
| 1-Person Households | - | 109 (24.2%) |
| 2-Person Households | 146 (32.4%) | 13 (2.9%) |
| 3-Person Households | 66 (14.7%) | 2 (0.4%) |
| 4-Person Households | 38 (8.4%) | 0 (0.0%) |
| 5-Person Households | 40 (8.9%) | 0 (0.0%) |
| 6-Person Households | 18 (4.0%) | 0 (0.0%) |
| 7+ Person Households | 18 (4.0%) | 0 (0.0%) |
| Total | 326 (72.4%) | 124 (27.6%) |
Female Fertility in Pleasant Hill
Fertility by Age in Pleasant Hill
Average fertility rate in Pleasant Hill is 76.0 births per 1,000 women. Women in the age bracket of 20 to 34 years have the highest fertility rate with 157.0 births per 1,000 women. Women in the age bracket of 20 to 34 years acount for 52.4% of all women with births.
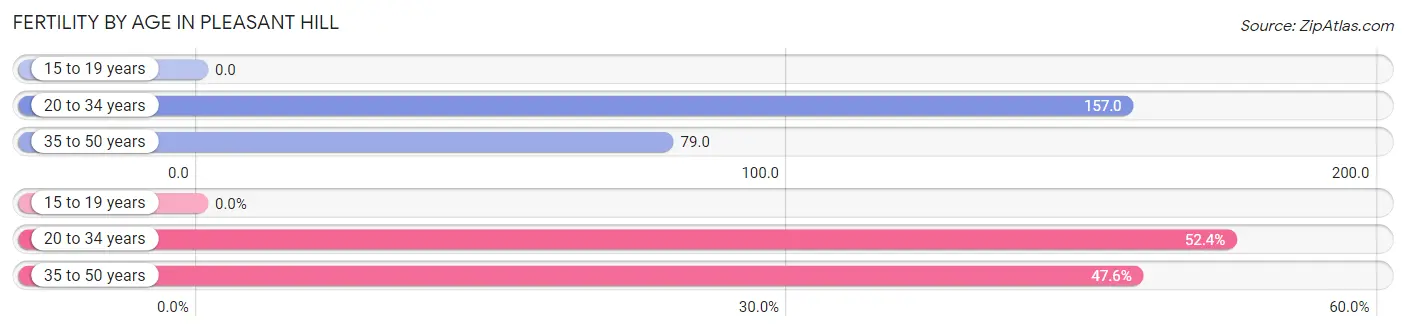
| Age Bracket | Women with Births | Births / 1,000 Women |
| 15 to 19 years | 0 (0.0%) | 0.0 |
| 20 to 34 years | 11 (52.4%) | 157.0 |
| 35 to 50 years | 10 (47.6%) | 79.0 |
| Total | 21 (100.0%) | 76.0 |
Fertility by Age by Marriage Status in Pleasant Hill
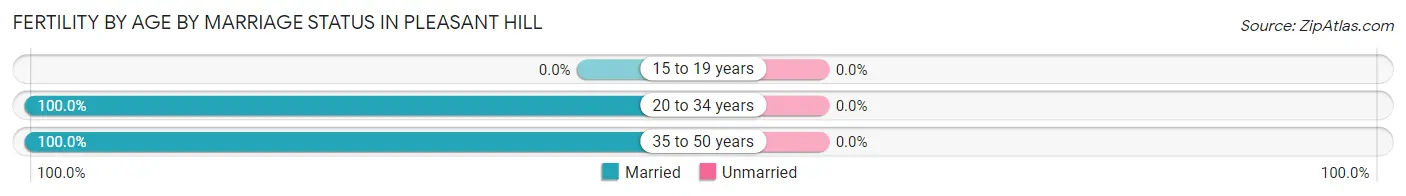
| Age Bracket | Married | Unmarried |
| 15 to 19 years | 0 (0.0%) | 0 (0.0%) |
| 20 to 34 years | 11 (100.0%) | 0 (0.0%) |
| 35 to 50 years | 10 (100.0%) | 0 (0.0%) |
| Total | 21 (100.0%) | 0 (0.0%) |
Fertility by Education in Pleasant Hill
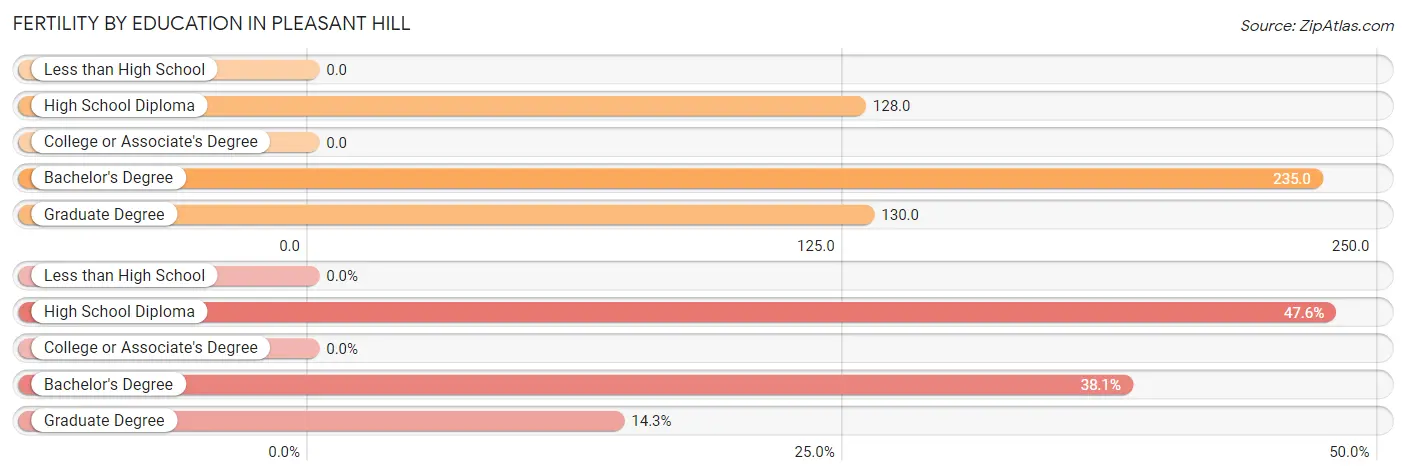
| Educational Attainment | Women with Births | Births / 1,000 Women |
| Less than High School | 0 (0.0%) | 0.0 |
| High School Diploma | 10 (47.6%) | 128.0 |
| College or Associate's Degree | 0 (0.0%) | 0.0 |
| Bachelor's Degree | 8 (38.1%) | 235.0 |
| Graduate Degree | 3 (14.3%) | 130.0 |
| Total | 21 (100.0%) | 76.0 |
Fertility by Education by Marriage Status in Pleasant Hill
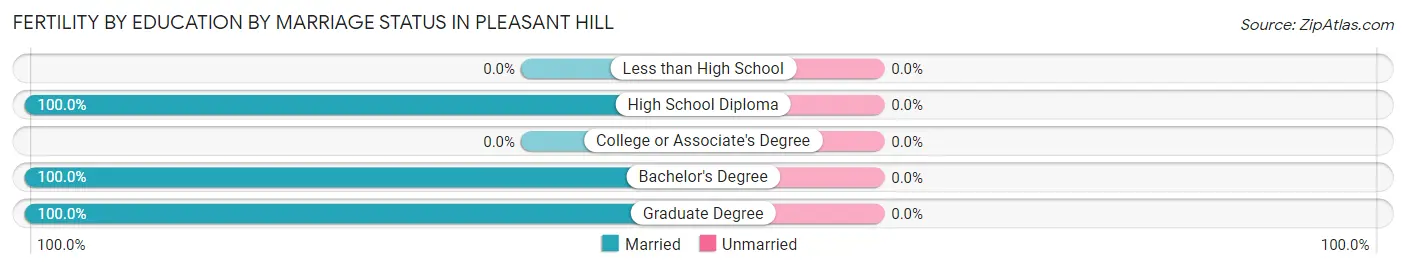
| Educational Attainment | Married | Unmarried |
| Less than High School | 0 (0.0%) | 0 (0.0%) |
| High School Diploma | 10 (100.0%) | 0 (0.0%) |
| College or Associate's Degree | 0 (0.0%) | 0 (0.0%) |
| Bachelor's Degree | 8 (100.0%) | 0 (0.0%) |
| Graduate Degree | 3 (100.0%) | 0 (0.0%) |
| Total | 21 (100.0%) | 0 (0.0%) |
Employment Characteristics in Pleasant Hill
Employment by Class of Employer in Pleasant Hill
Among the 603 employed individuals in Pleasant Hill, private company employees (412 | 68.3%), not-for-profit organizations (61 | 10.1%), and local government employees (49 | 8.1%) make up the most common classes of employment.
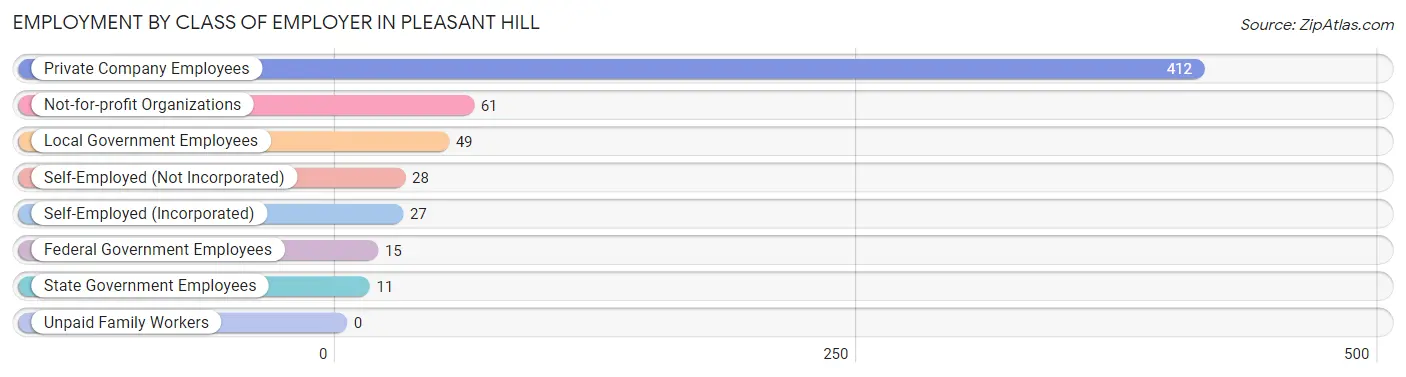
| Employer Class | # Employees | % Employees |
| Private Company Employees | 412 | 68.3% |
| Self-Employed (Incorporated) | 27 | 4.5% |
| Self-Employed (Not Incorporated) | 28 | 4.6% |
| Not-for-profit Organizations | 61 | 10.1% |
| Local Government Employees | 49 | 8.1% |
| State Government Employees | 11 | 1.8% |
| Federal Government Employees | 15 | 2.5% |
| Unpaid Family Workers | 0 | 0.0% |
| Total | 603 | 100.0% |
Employment Status by Age in Pleasant Hill
According to the labor force statistics for Pleasant Hill, out of the total population over 16 years of age (999), 62.5% or 624 individuals are in the labor force, with 3.0% or 19 of them unemployed. The age group with the highest labor force participation rate is 55 to 59 years, with 100.0% or 39 individuals in the labor force. Within the labor force, the 20 to 24 years age range has the highest percentage of unemployed individuals, with 8.7% or 4 of them being unemployed.
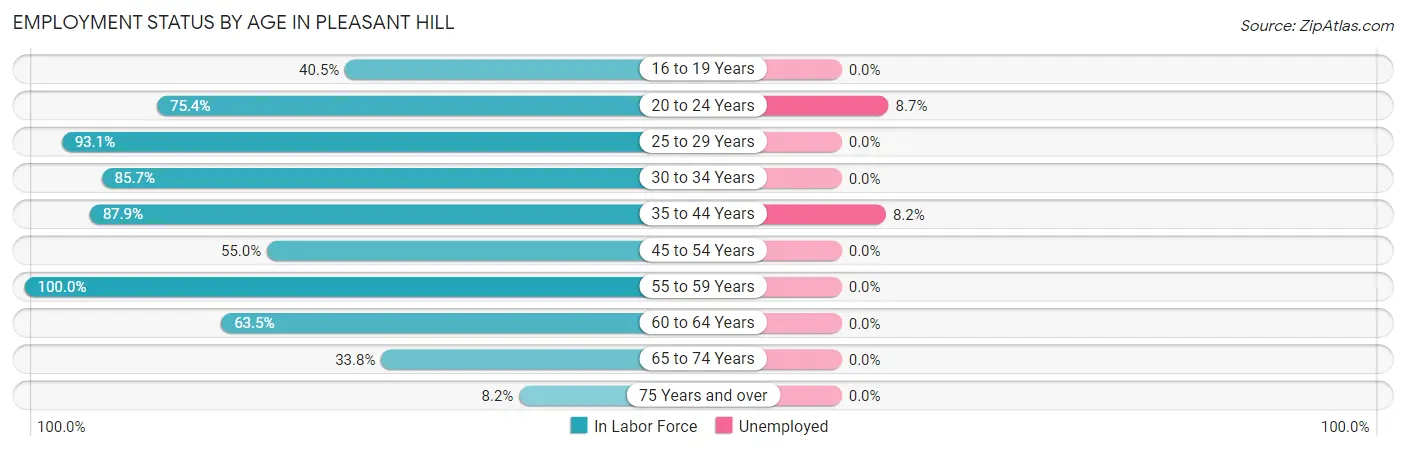
| Age Bracket | In Labor Force | Unemployed |
| 16 to 19 Years | 30 (40.5%) | 0 (0.0%) |
| 20 to 24 Years | 46 (75.4%) | 4 (8.7%) |
| 25 to 29 Years | 67 (93.1%) | 0 (0.0%) |
| 30 to 34 Years | 48 (85.7%) | 0 (0.0%) |
| 35 to 44 Years | 182 (87.9%) | 15 (8.2%) |
| 45 to 54 Years | 120 (55.0%) | 0 (0.0%) |
| 55 to 59 Years | 39 (100.0%) | 0 (0.0%) |
| 60 to 64 Years | 40 (63.5%) | 0 (0.0%) |
| 65 to 74 Years | 46 (33.8%) | 0 (0.0%) |
| 75 Years and over | 6 (8.2%) | 0 (0.0%) |
| Total | 624 (62.5%) | 19 (3.0%) |
Employment Status by Educational Attainment in Pleasant Hill
According to labor force statistics for Pleasant Hill, 75.7% of individuals (496) out of the total population between 25 and 64 years of age (655) are in the labor force, with 3.0% or 15 of them being unemployed. The group with the highest labor force participation rate are those with the educational attainment of bachelor's degree or higher, with 100.0% or 126 individuals in the labor force. Within the labor force, individuals with college / associate degree education have the highest percentage of unemployment, with 8.9% or 15 of them being unemployed.
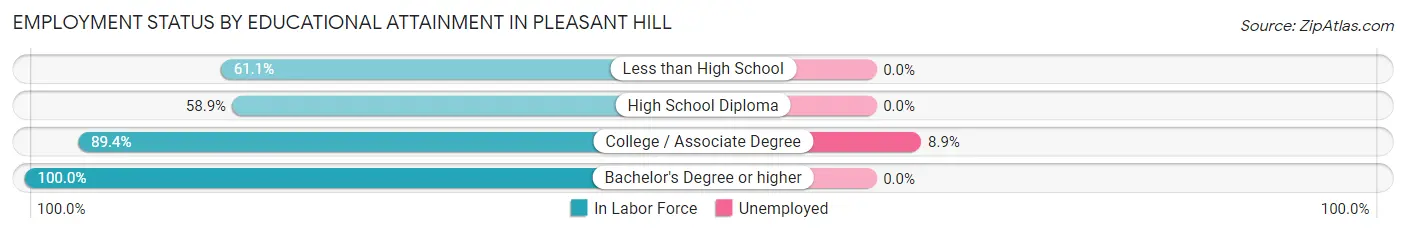
| Educational Attainment | In Labor Force | Unemployed |
| Less than High School | 22 (61.1%) | 0 (0.0%) |
| High School Diploma | 179 (58.9%) | 0 (0.0%) |
| College / Associate Degree | 169 (89.4%) | 17 (8.9%) |
| Bachelor's Degree or higher | 126 (100.0%) | 0 (0.0%) |
| Total | 496 (75.7%) | 20 (3.0%) |
Employment Occupations by Sex in Pleasant Hill
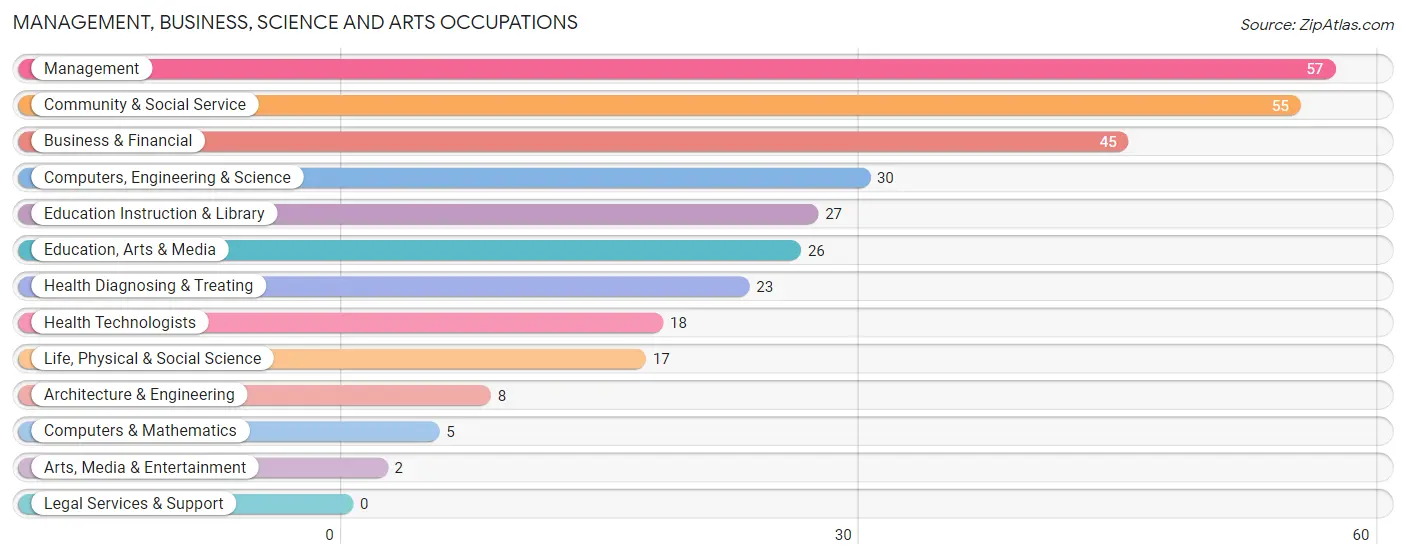
Management, Business, Science and Arts Occupations
The most common Management, Business, Science and Arts occupations in Pleasant Hill are Management (57 | 9.4%), Community & Social Service (55 | 9.1%), Business & Financial (45 | 7.4%), Computers, Engineering & Science (30 | 5.0%), and Education Instruction & Library (27 | 4.5%).
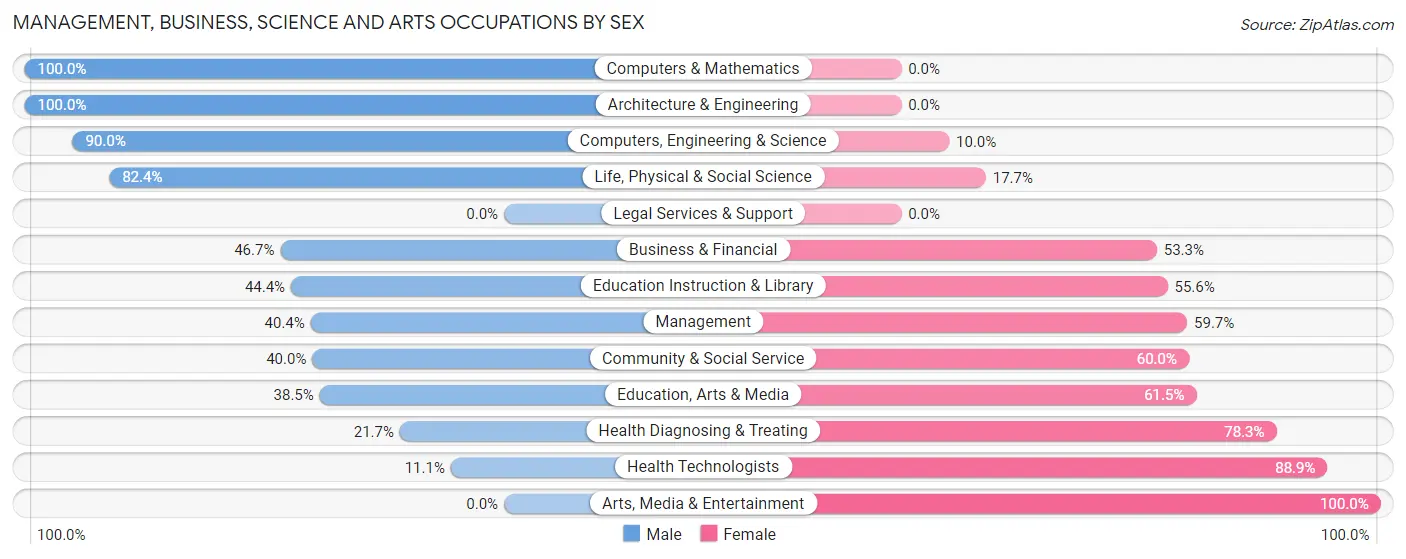
Management, Business, Science and Arts Occupations by Sex
Within the Management, Business, Science and Arts occupations in Pleasant Hill, the most male-oriented occupations are Computers & Mathematics (100.0%), Architecture & Engineering (100.0%), and Computers, Engineering & Science (90.0%), while the most female-oriented occupations are Arts, Media & Entertainment (100.0%), Health Technologists (88.9%), and Health Diagnosing & Treating (78.3%).
| Occupation | Male | Female |
| Management | 23 (40.4%) | 34 (59.7%) |
| Business & Financial | 21 (46.7%) | 24 (53.3%) |
| Computers, Engineering & Science | 27 (90.0%) | 3 (10.0%) |
| Computers & Mathematics | 5 (100.0%) | 0 (0.0%) |
| Architecture & Engineering | 8 (100.0%) | 0 (0.0%) |
| Life, Physical & Social Science | 14 (82.4%) | 3 (17.6%) |
| Community & Social Service | 22 (40.0%) | 33 (60.0%) |
| Education, Arts & Media | 10 (38.5%) | 16 (61.5%) |
| Legal Services & Support | 0 (0.0%) | 0 (0.0%) |
| Education Instruction & Library | 12 (44.4%) | 15 (55.6%) |
| Arts, Media & Entertainment | 0 (0.0%) | 2 (100.0%) |
| Health Diagnosing & Treating | 5 (21.7%) | 18 (78.3%) |
| Health Technologists | 2 (11.1%) | 16 (88.9%) |
| Total (Category) | 98 (46.7%) | 112 (53.3%) |
| Total (Overall) | 338 (55.9%) | 267 (44.1%) |
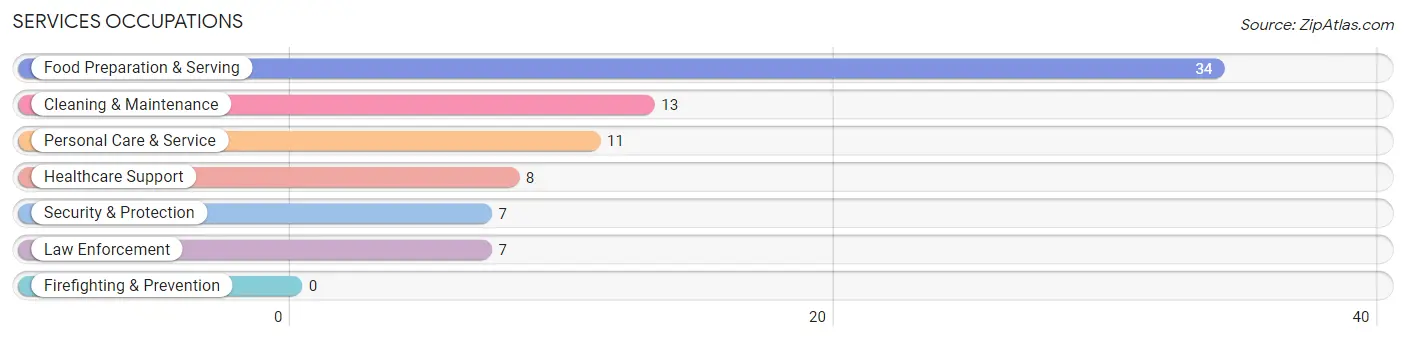
Services Occupations
The most common Services occupations in Pleasant Hill are Food Preparation & Serving (34 | 5.6%), Cleaning & Maintenance (13 | 2.1%), Personal Care & Service (11 | 1.8%), Healthcare Support (8 | 1.3%), and Security & Protection (7 | 1.2%).
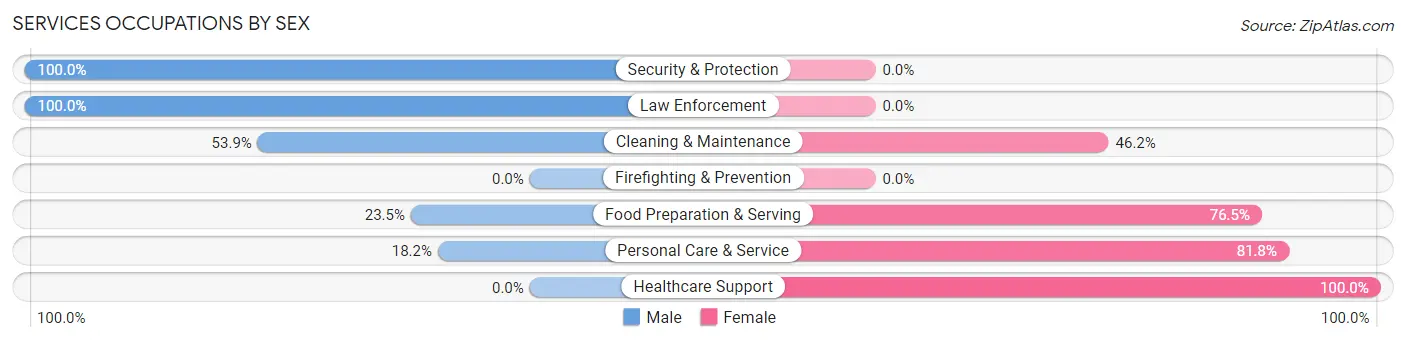
Services Occupations by Sex
Within the Services occupations in Pleasant Hill, the most male-oriented occupations are Security & Protection (100.0%), Law Enforcement (100.0%), and Cleaning & Maintenance (53.8%), while the most female-oriented occupations are Healthcare Support (100.0%), Personal Care & Service (81.8%), and Food Preparation & Serving (76.5%).
| Occupation | Male | Female |
| Healthcare Support | 0 (0.0%) | 8 (100.0%) |
| Security & Protection | 7 (100.0%) | 0 (0.0%) |
| Firefighting & Prevention | 0 (0.0%) | 0 (0.0%) |
| Law Enforcement | 7 (100.0%) | 0 (0.0%) |
| Food Preparation & Serving | 8 (23.5%) | 26 (76.5%) |
| Cleaning & Maintenance | 7 (53.8%) | 6 (46.2%) |
| Personal Care & Service | 2 (18.2%) | 9 (81.8%) |
| Total (Category) | 24 (32.9%) | 49 (67.1%) |
| Total (Overall) | 338 (55.9%) | 267 (44.1%) |
Sales and Office Occupations
The most common Sales and Office occupations in Pleasant Hill are Office & Administration (88 | 14.5%), and Sales & Related (28 | 4.6%).
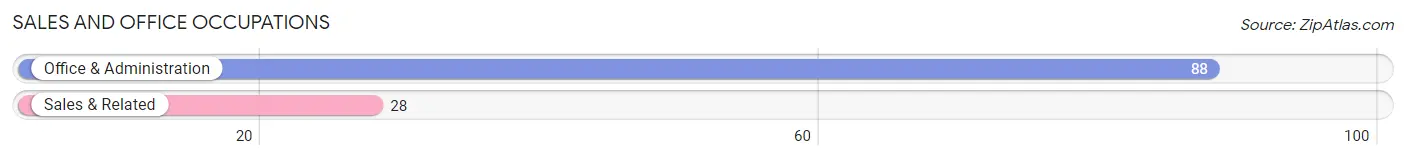
Sales and Office Occupations by Sex
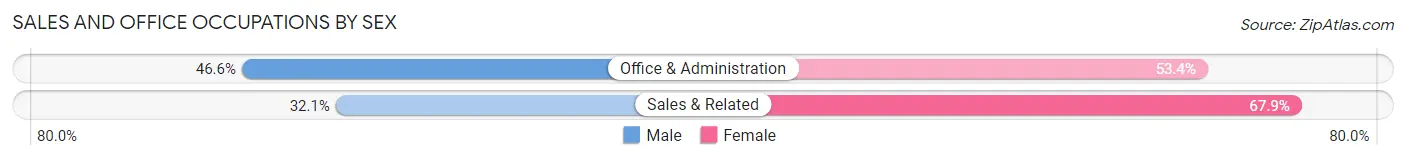
| Occupation | Male | Female |
| Sales & Related | 9 (32.1%) | 19 (67.9%) |
| Office & Administration | 41 (46.6%) | 47 (53.4%) |
| Total (Category) | 50 (43.1%) | 66 (56.9%) |
| Total (Overall) | 338 (55.9%) | 267 (44.1%) |
Natural Resources, Construction and Maintenance Occupations
The most common Natural Resources, Construction and Maintenance occupations in Pleasant Hill are Construction & Extraction (26 | 4.3%), Installation, Maintenance & Repair (10 | 1.7%), and Farming, Fishing & Forestry (2 | 0.3%).
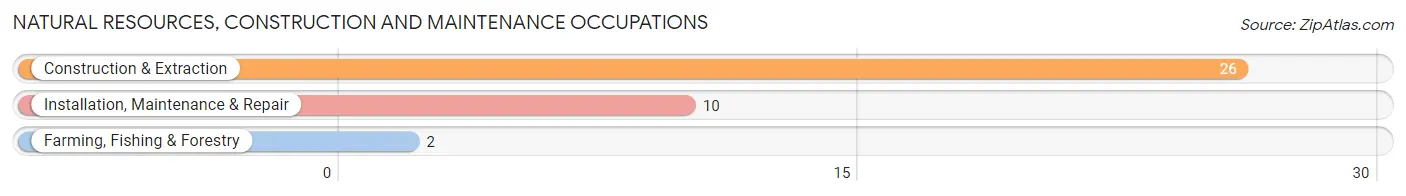
Natural Resources, Construction and Maintenance Occupations by Sex
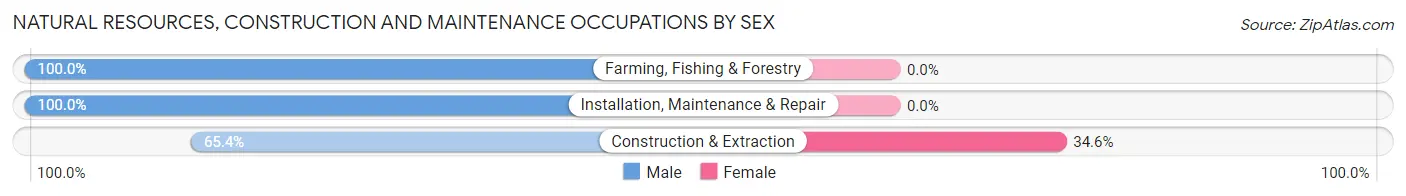
| Occupation | Male | Female |
| Farming, Fishing & Forestry | 2 (100.0%) | 0 (0.0%) |
| Construction & Extraction | 17 (65.4%) | 9 (34.6%) |
| Installation, Maintenance & Repair | 10 (100.0%) | 0 (0.0%) |
| Total (Category) | 29 (76.3%) | 9 (23.7%) |
| Total (Overall) | 338 (55.9%) | 267 (44.1%) |
Production, Transportation and Moving Occupations
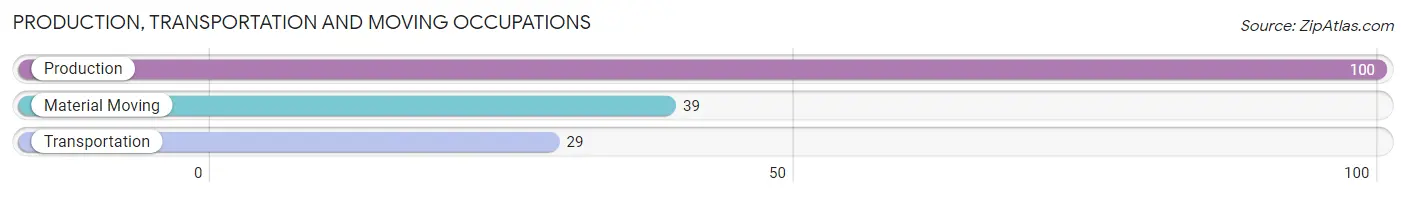
The most common Production, Transportation and Moving occupations in Pleasant Hill are Production (100 | 16.5%), Material Moving (39 | 6.5%), and Transportation (29 | 4.8%).
Production, Transportation and Moving Occupations by Sex
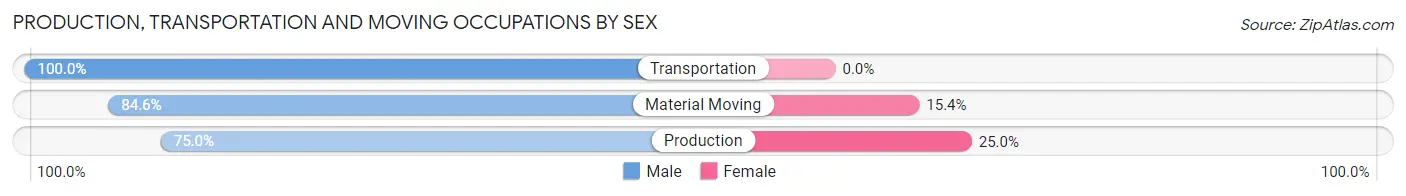
| Occupation | Male | Female |
| Production | 75 (75.0%) | 25 (25.0%) |
| Transportation | 29 (100.0%) | 0 (0.0%) |
| Material Moving | 33 (84.6%) | 6 (15.4%) |
| Total (Category) | 137 (81.6%) | 31 (18.4%) |
| Total (Overall) | 338 (55.9%) | 267 (44.1%) |
Employment Industries by Sex in Pleasant Hill
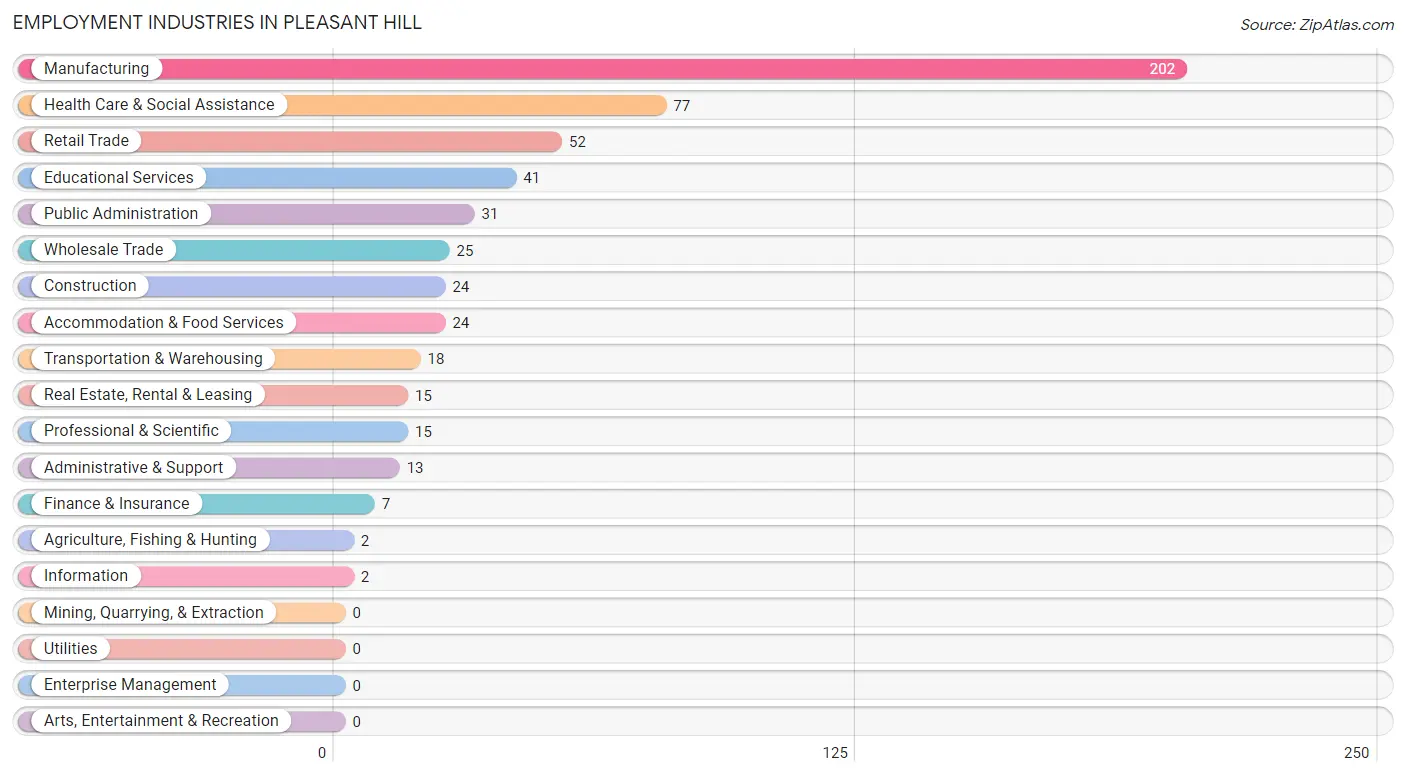
Employment Industries in Pleasant Hill
The major employment industries in Pleasant Hill include Manufacturing (202 | 33.4%), Health Care & Social Assistance (77 | 12.7%), Retail Trade (52 | 8.6%), Educational Services (41 | 6.8%), and Public Administration (31 | 5.1%).
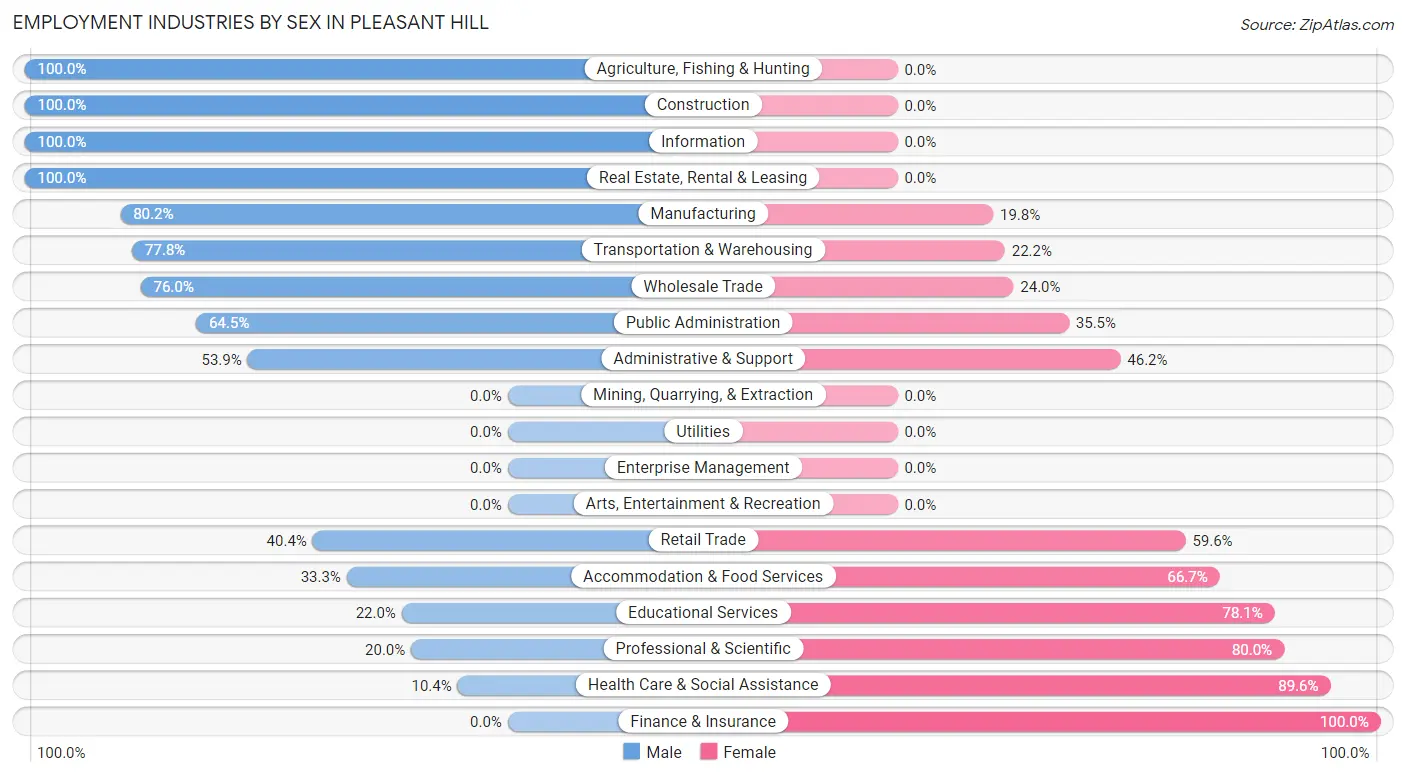
Employment Industries by Sex in Pleasant Hill
The Pleasant Hill industries that see more men than women are Agriculture, Fishing & Hunting (100.0%), Construction (100.0%), and Information (100.0%), whereas the industries that tend to have a higher number of women are Finance & Insurance (100.0%), Health Care & Social Assistance (89.6%), and Professional & Scientific (80.0%).
| Industry | Male | Female |
| Agriculture, Fishing & Hunting | 2 (100.0%) | 0 (0.0%) |
| Mining, Quarrying, & Extraction | 0 (0.0%) | 0 (0.0%) |
| Construction | 24 (100.0%) | 0 (0.0%) |
| Manufacturing | 162 (80.2%) | 40 (19.8%) |
| Wholesale Trade | 19 (76.0%) | 6 (24.0%) |
| Retail Trade | 21 (40.4%) | 31 (59.6%) |
| Transportation & Warehousing | 14 (77.8%) | 4 (22.2%) |
| Utilities | 0 (0.0%) | 0 (0.0%) |
| Information | 2 (100.0%) | 0 (0.0%) |
| Finance & Insurance | 0 (0.0%) | 7 (100.0%) |
| Real Estate, Rental & Leasing | 15 (100.0%) | 0 (0.0%) |
| Professional & Scientific | 3 (20.0%) | 12 (80.0%) |
| Enterprise Management | 0 (0.0%) | 0 (0.0%) |
| Administrative & Support | 7 (53.8%) | 6 (46.2%) |
| Educational Services | 9 (22.0%) | 32 (78.0%) |
| Health Care & Social Assistance | 8 (10.4%) | 69 (89.6%) |
| Arts, Entertainment & Recreation | 0 (0.0%) | 0 (0.0%) |
| Accommodation & Food Services | 8 (33.3%) | 16 (66.7%) |
| Public Administration | 20 (64.5%) | 11 (35.5%) |
| Total | 338 (55.9%) | 267 (44.1%) |
Education in Pleasant Hill
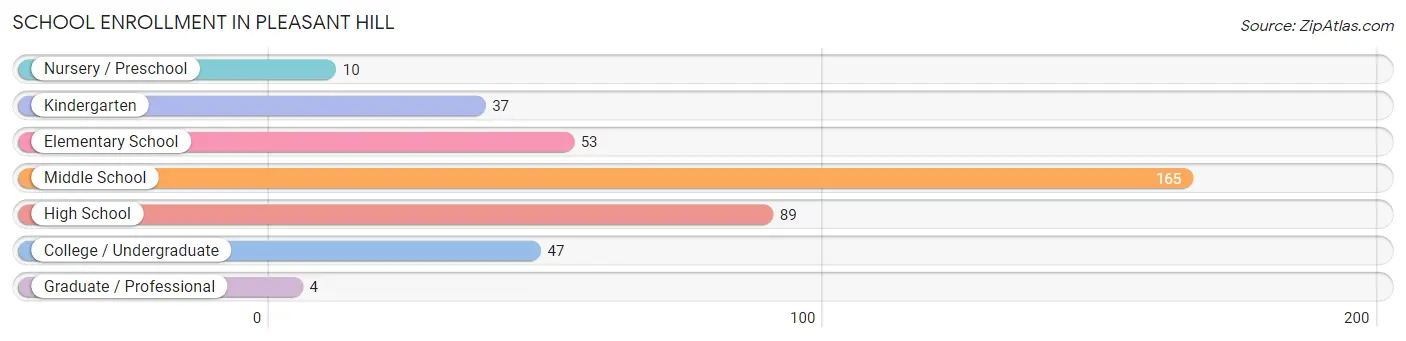
School Enrollment in Pleasant Hill
The most common levels of schooling among the 405 students in Pleasant Hill are middle school (165 | 40.7%), high school (89 | 22.0%), and elementary school (53 | 13.1%).
| School Level | # Students | % Students |
| Nursery / Preschool | 10 | 2.5% |
| Kindergarten | 37 | 9.1% |
| Elementary School | 53 | 13.1% |
| Middle School | 165 | 40.7% |
| High School | 89 | 22.0% |
| College / Undergraduate | 47 | 11.6% |
| Graduate / Professional | 4 | 1.0% |
| Total | 405 | 100.0% |
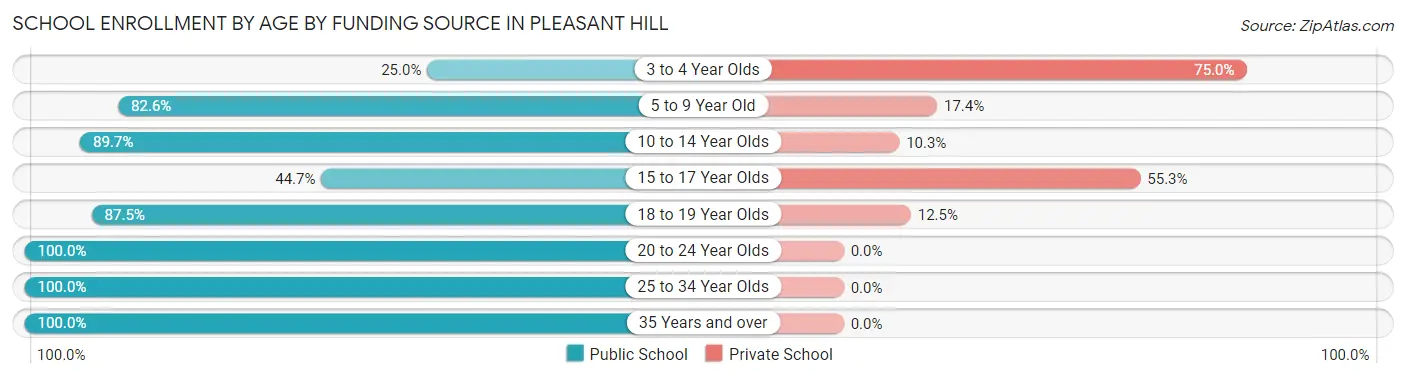
School Enrollment by Age by Funding Source in Pleasant Hill
Out of a total of 405 students who are enrolled in schools in Pleasant Hill, 84 (20.7%) attend a private institution, while the remaining 321 (79.3%) are enrolled in public schools. The age group of 3 to 4 year olds has the highest likelihood of being enrolled in private schools, with 6 (75.0% in the age bracket) enrolled. Conversely, the age group of 20 to 24 year olds has the lowest likelihood of being enrolled in a private school, with 19 (100.0% in the age bracket) attending a public institution.
| Age Bracket | Public School | Private School |
| 3 to 4 Year Olds | 2 (25.0%) | 6 (75.0%) |
| 5 to 9 Year Old | 76 (82.6%) | 16 (17.4%) |
| 10 to 14 Year Olds | 156 (89.7%) | 18 (10.3%) |
| 15 to 17 Year Olds | 34 (44.7%) | 42 (55.3%) |
| 18 to 19 Year Olds | 14 (87.5%) | 2 (12.5%) |
| 20 to 24 Year Olds | 19 (100.0%) | 0 (0.0%) |
| 25 to 34 Year Olds | 4 (100.0%) | 0 (0.0%) |
| 35 Years and over | 16 (100.0%) | 0 (0.0%) |
| Total | 321 (79.3%) | 84 (20.7%) |
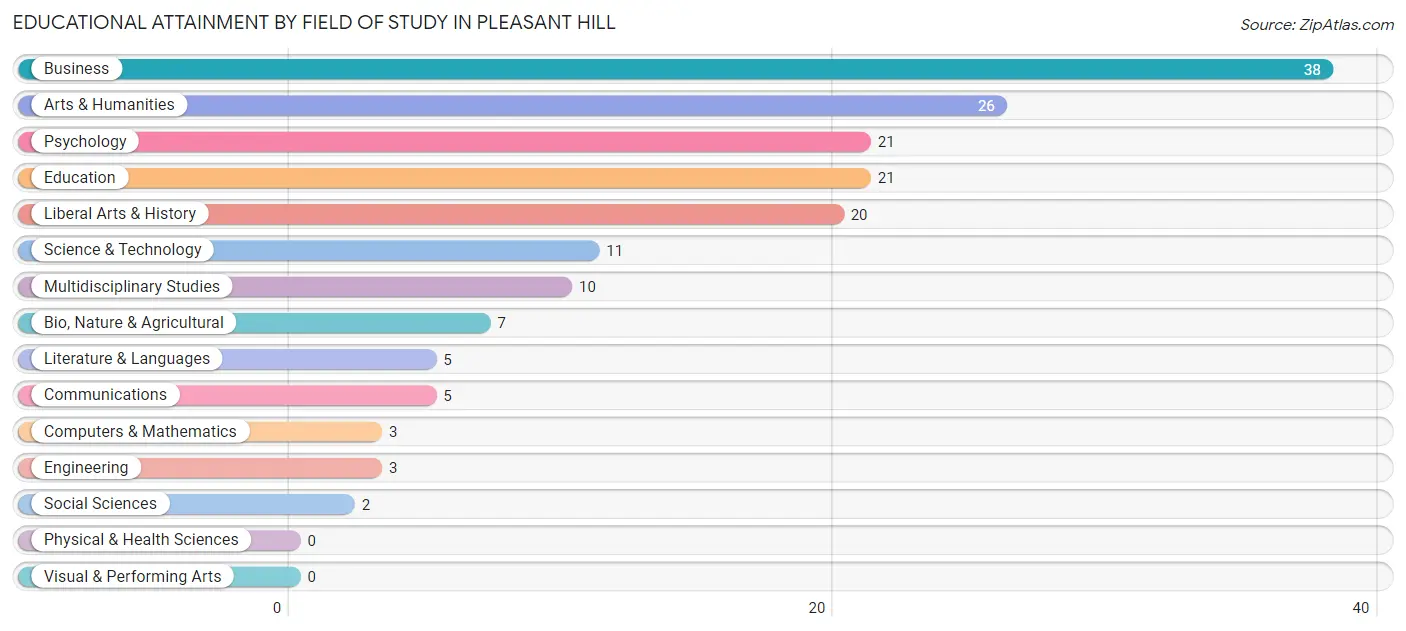
Educational Attainment by Field of Study in Pleasant Hill
Business (38 | 22.1%), arts & humanities (26 | 15.1%), psychology (21 | 12.2%), education (21 | 12.2%), and liberal arts & history (20 | 11.6%) are the most common fields of study among 172 individuals in Pleasant Hill who have obtained a bachelor's degree or higher.
| Field of Study | # Graduates | % Graduates |
| Computers & Mathematics | 3 | 1.7% |
| Bio, Nature & Agricultural | 7 | 4.1% |
| Physical & Health Sciences | 0 | 0.0% |
| Psychology | 21 | 12.2% |
| Social Sciences | 2 | 1.2% |
| Engineering | 3 | 1.7% |
| Multidisciplinary Studies | 10 | 5.8% |
| Science & Technology | 11 | 6.4% |
| Business | 38 | 22.1% |
| Education | 21 | 12.2% |
| Literature & Languages | 5 | 2.9% |
| Liberal Arts & History | 20 | 11.6% |
| Visual & Performing Arts | 0 | 0.0% |
| Communications | 5 | 2.9% |
| Arts & Humanities | 26 | 15.1% |
| Total | 172 | 100.0% |
Transportation & Commute in Pleasant Hill
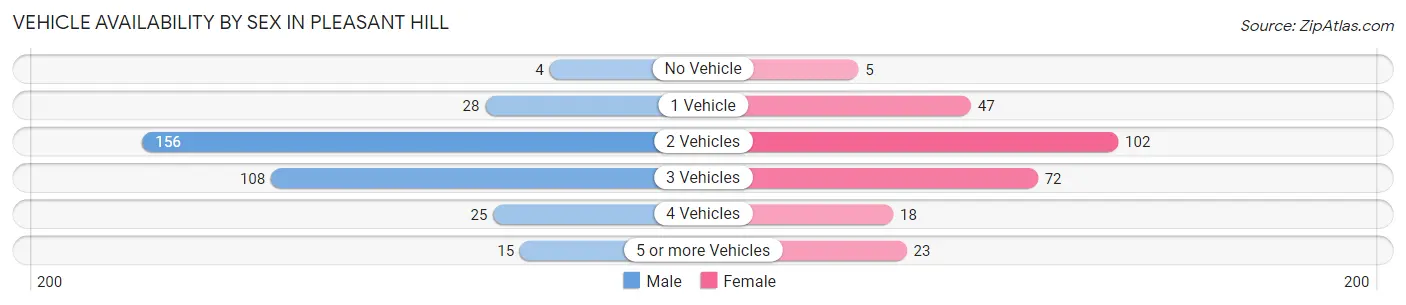
Vehicle Availability by Sex in Pleasant Hill
The most prevalent vehicle ownership categories in Pleasant Hill are males with 2 vehicles (156, accounting for 46.4%) and females with 2 vehicles (102, making up 58.4%).
| Vehicles Available | Male | Female |
| No Vehicle | 4 (1.2%) | 5 (1.9%) |
| 1 Vehicle | 28 (8.3%) | 47 (17.6%) |
| 2 Vehicles | 156 (46.4%) | 102 (38.2%) |
| 3 Vehicles | 108 (32.1%) | 72 (27.0%) |
| 4 Vehicles | 25 (7.4%) | 18 (6.7%) |
| 5 or more Vehicles | 15 (4.5%) | 23 (8.6%) |
| Total | 336 (100.0%) | 267 (100.0%) |
Commute Time in Pleasant Hill
The most frequently occuring commute durations in Pleasant Hill are 20 to 24 minutes (116 commuters, 19.8%), 15 to 19 minutes (100 commuters, 17.1%), and 30 to 34 minutes (67 commuters, 11.4%).
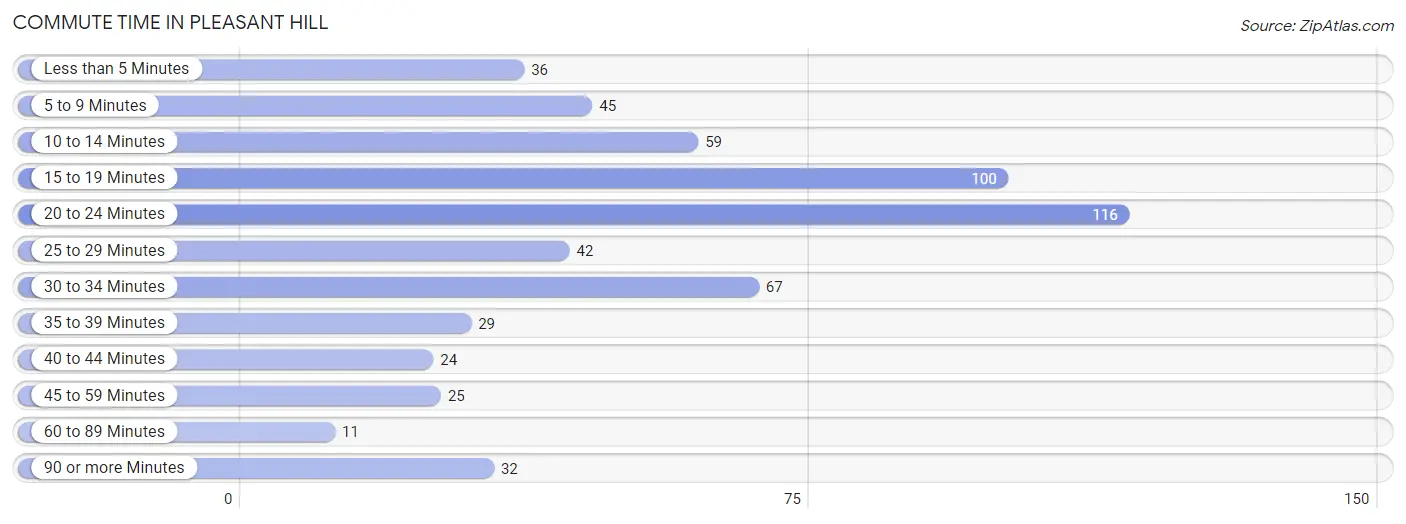
| Commute Time | # Commuters | % Commuters |
| Less than 5 Minutes | 36 | 6.1% |
| 5 to 9 Minutes | 45 | 7.7% |
| 10 to 14 Minutes | 59 | 10.1% |
| 15 to 19 Minutes | 100 | 17.1% |
| 20 to 24 Minutes | 116 | 19.8% |
| 25 to 29 Minutes | 42 | 7.2% |
| 30 to 34 Minutes | 67 | 11.4% |
| 35 to 39 Minutes | 29 | 5.0% |
| 40 to 44 Minutes | 24 | 4.1% |
| 45 to 59 Minutes | 25 | 4.3% |
| 60 to 89 Minutes | 11 | 1.9% |
| 90 or more Minutes | 32 | 5.5% |
Commute Time by Sex in Pleasant Hill
The most common commute times in Pleasant Hill are 15 to 19 minutes (65 commuters, 19.6%) for males and 20 to 24 minutes (65 commuters, 25.5%) for females.
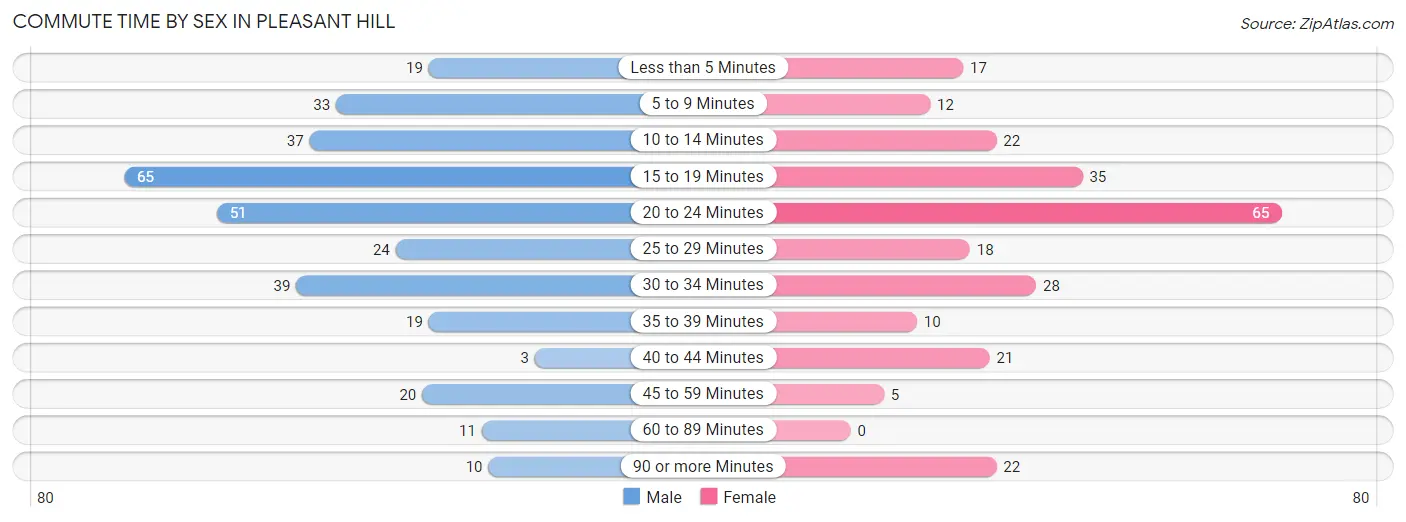
| Commute Time | Male | Female |
| Less than 5 Minutes | 19 (5.7%) | 17 (6.7%) |
| 5 to 9 Minutes | 33 (10.0%) | 12 (4.7%) |
| 10 to 14 Minutes | 37 (11.2%) | 22 (8.6%) |
| 15 to 19 Minutes | 65 (19.6%) | 35 (13.7%) |
| 20 to 24 Minutes | 51 (15.4%) | 65 (25.5%) |
| 25 to 29 Minutes | 24 (7.2%) | 18 (7.1%) |
| 30 to 34 Minutes | 39 (11.8%) | 28 (11.0%) |
| 35 to 39 Minutes | 19 (5.7%) | 10 (3.9%) |
| 40 to 44 Minutes | 3 (0.9%) | 21 (8.2%) |
| 45 to 59 Minutes | 20 (6.0%) | 5 (2.0%) |
| 60 to 89 Minutes | 11 (3.3%) | 0 (0.0%) |
| 90 or more Minutes | 10 (3.0%) | 22 (8.6%) |
Time of Departure to Work by Sex in Pleasant Hill
The most frequent times of departure to work in Pleasant Hill are 7:30 AM to 7:59 AM (61, 18.4%) for males and 7:00 AM to 7:29 AM (42, 16.5%) for females.
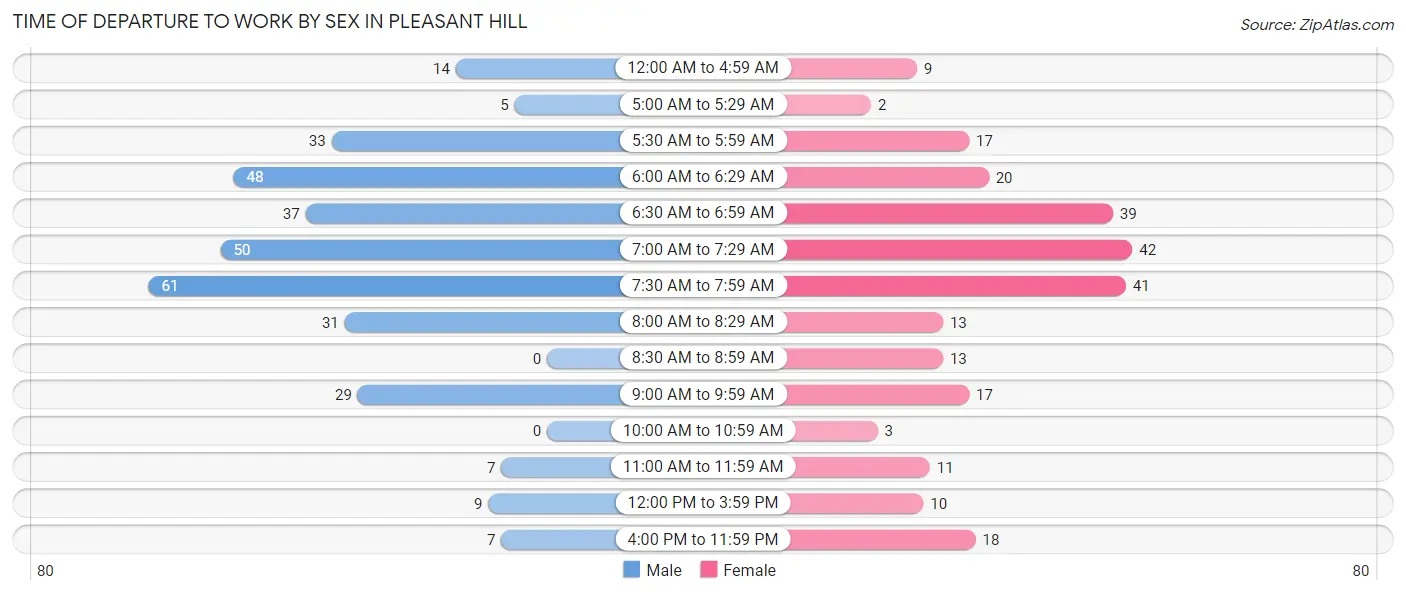
| Time of Departure | Male | Female |
| 12:00 AM to 4:59 AM | 14 (4.2%) | 9 (3.5%) |
| 5:00 AM to 5:29 AM | 5 (1.5%) | 2 (0.8%) |
| 5:30 AM to 5:59 AM | 33 (10.0%) | 17 (6.7%) |
| 6:00 AM to 6:29 AM | 48 (14.5%) | 20 (7.8%) |
| 6:30 AM to 6:59 AM | 37 (11.2%) | 39 (15.3%) |
| 7:00 AM to 7:29 AM | 50 (15.1%) | 42 (16.5%) |
| 7:30 AM to 7:59 AM | 61 (18.4%) | 41 (16.1%) |
| 8:00 AM to 8:29 AM | 31 (9.4%) | 13 (5.1%) |
| 8:30 AM to 8:59 AM | 0 (0.0%) | 13 (5.1%) |
| 9:00 AM to 9:59 AM | 29 (8.8%) | 17 (6.7%) |
| 10:00 AM to 10:59 AM | 0 (0.0%) | 3 (1.2%) |
| 11:00 AM to 11:59 AM | 7 (2.1%) | 11 (4.3%) |
| 12:00 PM to 3:59 PM | 9 (2.7%) | 10 (3.9%) |
| 4:00 PM to 11:59 PM | 7 (2.1%) | 18 (7.1%) |
| Total | 331 (100.0%) | 255 (100.0%) |
Housing Occupancy in Pleasant Hill
Occupancy by Ownership in Pleasant Hill
Of the total 450 dwellings in Pleasant Hill, owner-occupied units account for 349 (77.6%), while renter-occupied units make up 101 (22.4%).
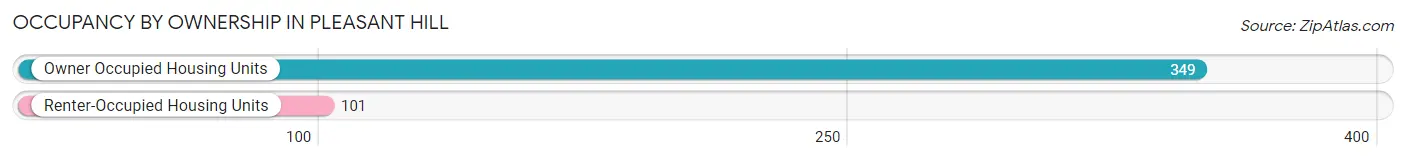
| Occupancy | # Housing Units | % Housing Units |
| Owner Occupied Housing Units | 349 | 77.6% |
| Renter-Occupied Housing Units | 101 | 22.4% |
| Total Occupied Housing Units | 450 | 100.0% |
Occupancy by Household Size in Pleasant Hill
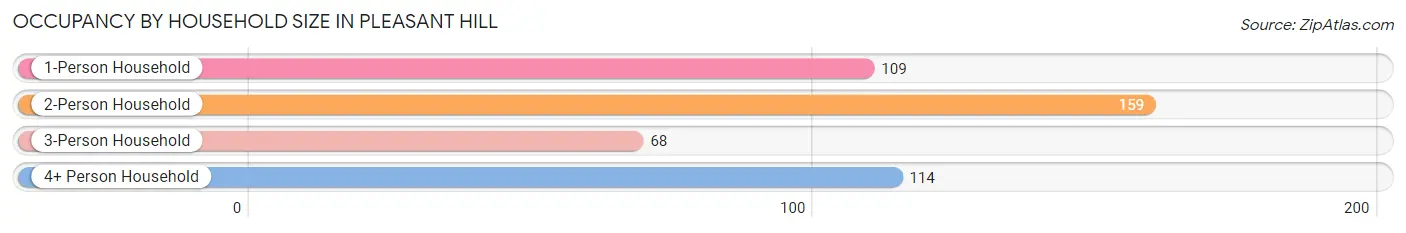
| Household Size | # Housing Units | % Housing Units |
| 1-Person Household | 109 | 24.2% |
| 2-Person Household | 159 | 35.3% |
| 3-Person Household | 68 | 15.1% |
| 4+ Person Household | 114 | 25.3% |
| Total Housing Units | 450 | 100.0% |
Occupancy by Ownership by Household Size in Pleasant Hill
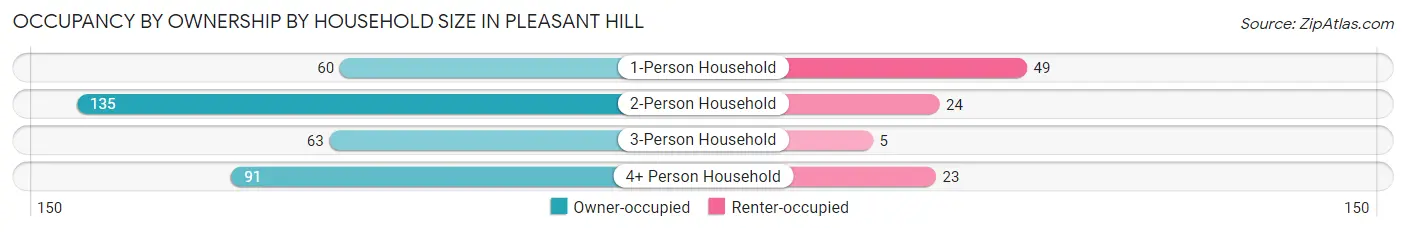
| Household Size | Owner-occupied | Renter-occupied |
| 1-Person Household | 60 (55.0%) | 49 (45.0%) |
| 2-Person Household | 135 (84.9%) | 24 (15.1%) |
| 3-Person Household | 63 (92.6%) | 5 (7.3%) |
| 4+ Person Household | 91 (79.8%) | 23 (20.2%) |
| Total Housing Units | 349 (77.6%) | 101 (22.4%) |
Occupancy by Educational Attainment in Pleasant Hill
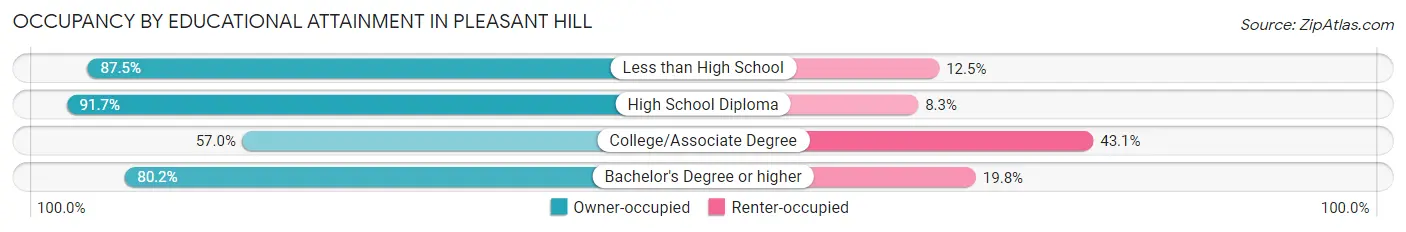
| Household Size | Owner-occupied | Renter-occupied |
| Less than High School | 14 (87.5%) | 2 (12.5%) |
| High School Diploma | 176 (91.7%) | 16 (8.3%) |
| College/Associate Degree | 86 (57.0%) | 65 (43.0%) |
| Bachelor's Degree or higher | 73 (80.2%) | 18 (19.8%) |
Occupancy by Age of Householder in Pleasant Hill
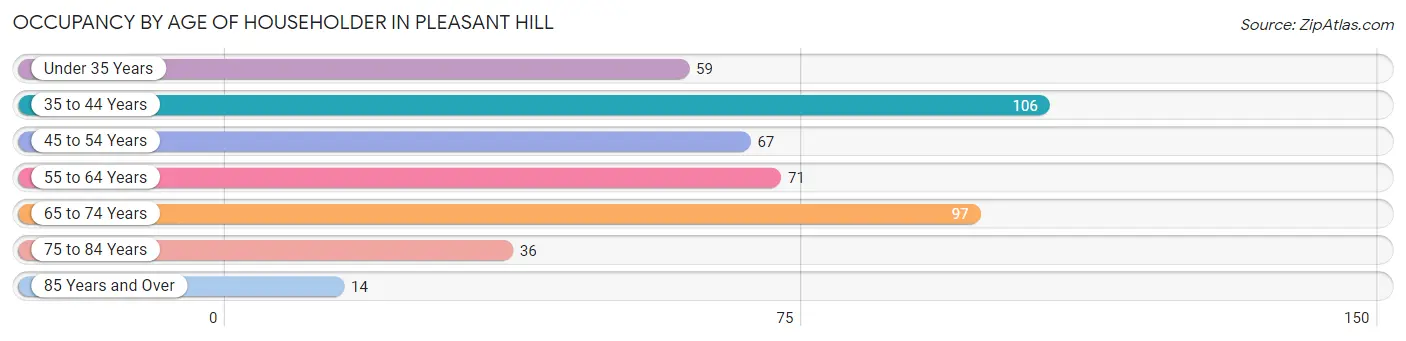
| Age Bracket | # Households | % Households |
| Under 35 Years | 59 | 13.1% |
| 35 to 44 Years | 106 | 23.6% |
| 45 to 54 Years | 67 | 14.9% |
| 55 to 64 Years | 71 | 15.8% |
| 65 to 74 Years | 97 | 21.6% |
| 75 to 84 Years | 36 | 8.0% |
| 85 Years and Over | 14 | 3.1% |
| Total | 450 | 100.0% |
Housing Finances in Pleasant Hill
Median Income by Occupancy in Pleasant Hill
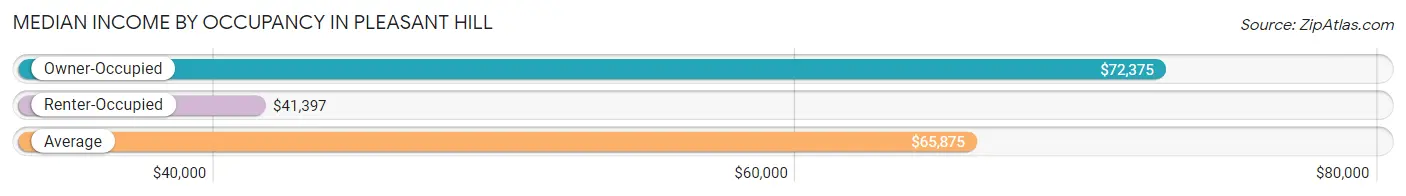
| Occupancy Type | # Households | Median Income |
| Owner-Occupied | 349 (77.6%) | $72,375 |
| Renter-Occupied | 101 (22.4%) | $41,397 |
| Average | 450 (100.0%) | $65,875 |
Occupancy by Householder Income Bracket in Pleasant Hill
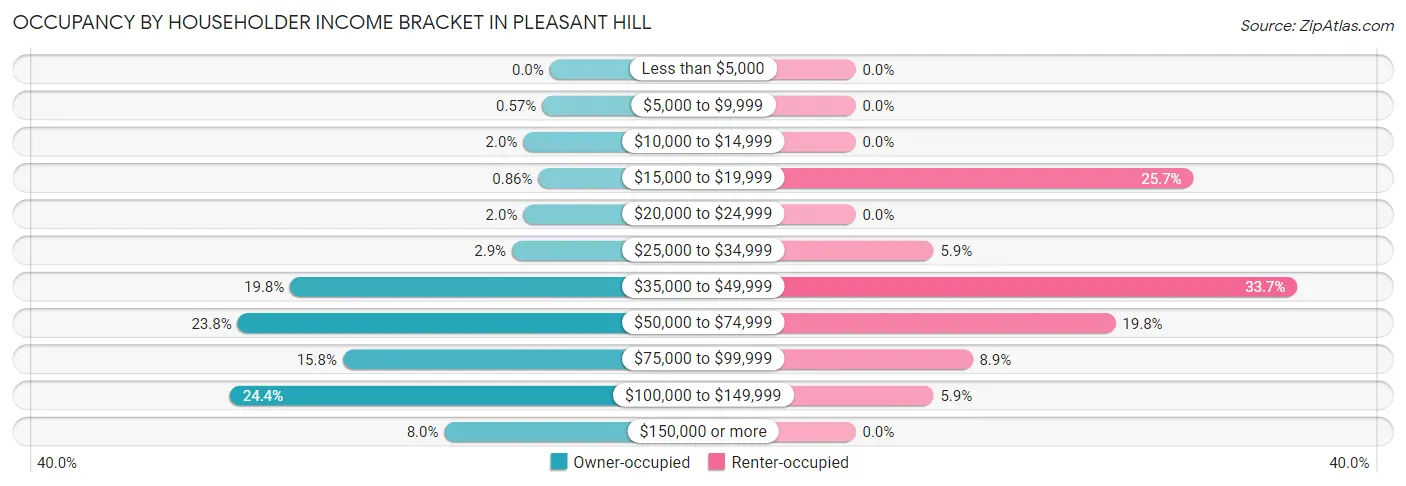
| Income Bracket | Owner-occupied | Renter-occupied |
| Less than $5,000 | 0 (0.0%) | 0 (0.0%) |
| $5,000 to $9,999 | 2 (0.6%) | 0 (0.0%) |
| $10,000 to $14,999 | 7 (2.0%) | 0 (0.0%) |
| $15,000 to $19,999 | 3 (0.9%) | 26 (25.7%) |
| $20,000 to $24,999 | 7 (2.0%) | 0 (0.0%) |
| $25,000 to $34,999 | 10 (2.9%) | 6 (5.9%) |
| $35,000 to $49,999 | 69 (19.8%) | 34 (33.7%) |
| $50,000 to $74,999 | 83 (23.8%) | 20 (19.8%) |
| $75,000 to $99,999 | 55 (15.8%) | 9 (8.9%) |
| $100,000 to $149,999 | 85 (24.4%) | 6 (5.9%) |
| $150,000 or more | 28 (8.0%) | 0 (0.0%) |
| Total | 349 (100.0%) | 101 (100.0%) |
Monthly Housing Cost Tiers in Pleasant Hill
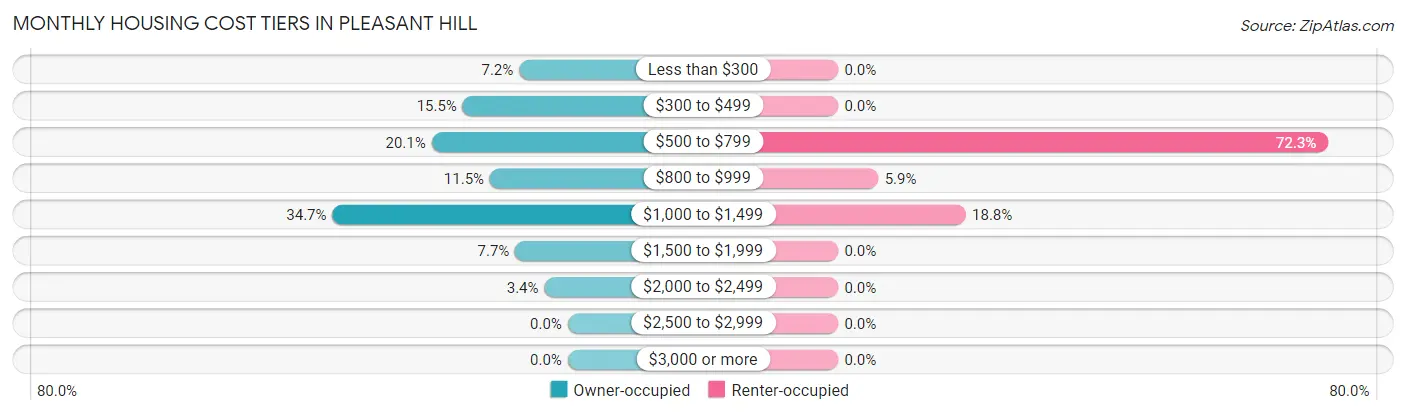
| Monthly Cost | Owner-occupied | Renter-occupied |
| Less than $300 | 25 (7.2%) | 0 (0.0%) |
| $300 to $499 | 54 (15.5%) | 0 (0.0%) |
| $500 to $799 | 70 (20.1%) | 73 (72.3%) |
| $800 to $999 | 40 (11.5%) | 6 (5.9%) |
| $1,000 to $1,499 | 121 (34.7%) | 19 (18.8%) |
| $1,500 to $1,999 | 27 (7.7%) | 0 (0.0%) |
| $2,000 to $2,499 | 12 (3.4%) | 0 (0.0%) |
| $2,500 to $2,999 | 0 (0.0%) | 0 (0.0%) |
| $3,000 or more | 0 (0.0%) | 0 (0.0%) |
| Total | 349 (100.0%) | 101 (100.0%) |
Physical Housing Characteristics in Pleasant Hill
Housing Structures in Pleasant Hill
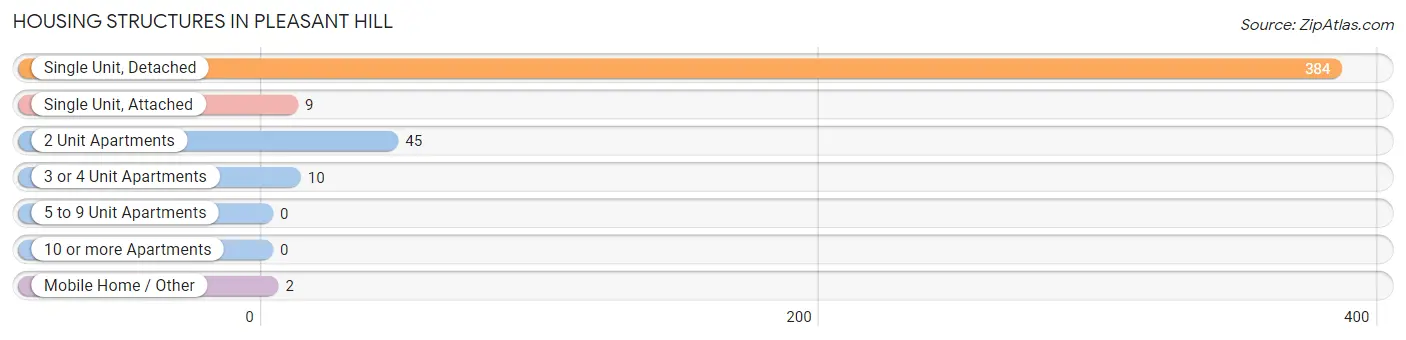
| Structure Type | # Housing Units | % Housing Units |
| Single Unit, Detached | 384 | 85.3% |
| Single Unit, Attached | 9 | 2.0% |
| 2 Unit Apartments | 45 | 10.0% |
| 3 or 4 Unit Apartments | 10 | 2.2% |
| 5 to 9 Unit Apartments | 0 | 0.0% |
| 10 or more Apartments | 0 | 0.0% |
| Mobile Home / Other | 2 | 0.4% |
| Total | 450 | 100.0% |
Housing Structures by Occupancy in Pleasant Hill
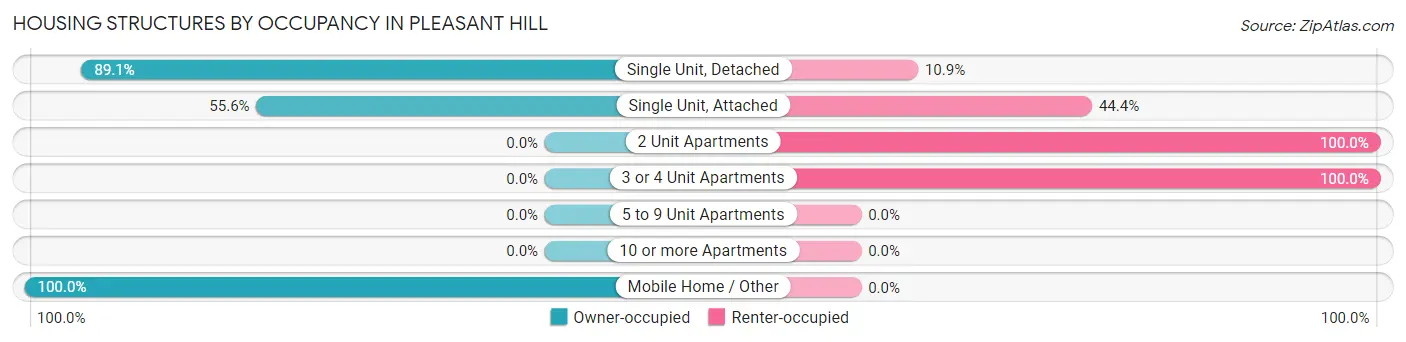
| Structure Type | Owner-occupied | Renter-occupied |
| Single Unit, Detached | 342 (89.1%) | 42 (10.9%) |
| Single Unit, Attached | 5 (55.6%) | 4 (44.4%) |
| 2 Unit Apartments | 0 (0.0%) | 45 (100.0%) |
| 3 or 4 Unit Apartments | 0 (0.0%) | 10 (100.0%) |
| 5 to 9 Unit Apartments | 0 (0.0%) | 0 (0.0%) |
| 10 or more Apartments | 0 (0.0%) | 0 (0.0%) |
| Mobile Home / Other | 2 (100.0%) | 0 (0.0%) |
| Total | 349 (77.6%) | 101 (22.4%) |
Housing Structures by Number of Rooms in Pleasant Hill
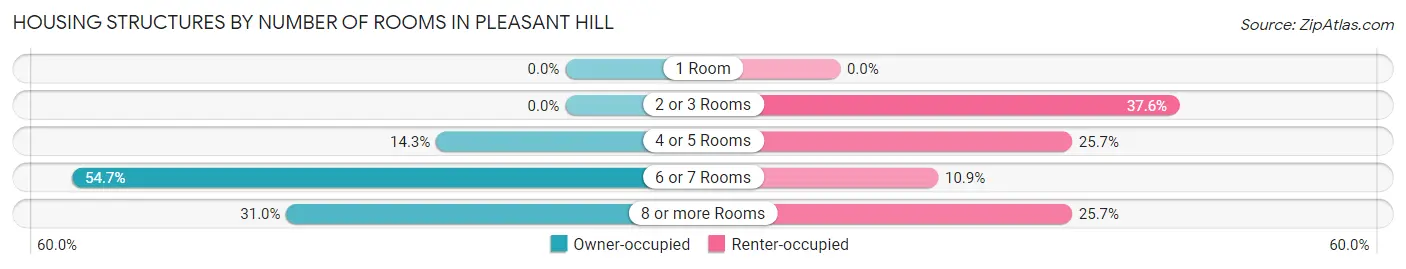
| Number of Rooms | Owner-occupied | Renter-occupied |
| 1 Room | 0 (0.0%) | 0 (0.0%) |
| 2 or 3 Rooms | 0 (0.0%) | 38 (37.6%) |
| 4 or 5 Rooms | 50 (14.3%) | 26 (25.7%) |
| 6 or 7 Rooms | 191 (54.7%) | 11 (10.9%) |
| 8 or more Rooms | 108 (30.9%) | 26 (25.7%) |
| Total | 349 (100.0%) | 101 (100.0%) |
Housing Structure by Heating Type in Pleasant Hill
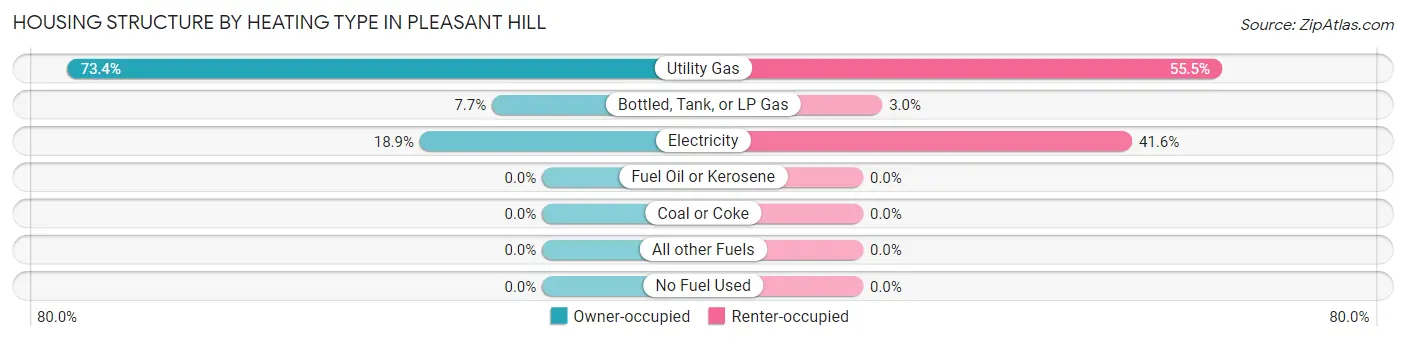
| Heating Type | Owner-occupied | Renter-occupied |
| Utility Gas | 256 (73.4%) | 56 (55.4%) |
| Bottled, Tank, or LP Gas | 27 (7.7%) | 3 (3.0%) |
| Electricity | 66 (18.9%) | 42 (41.6%) |
| Fuel Oil or Kerosene | 0 (0.0%) | 0 (0.0%) |
| Coal or Coke | 0 (0.0%) | 0 (0.0%) |
| All other Fuels | 0 (0.0%) | 0 (0.0%) |
| No Fuel Used | 0 (0.0%) | 0 (0.0%) |
| Total | 349 (100.0%) | 101 (100.0%) |
Household Vehicle Usage in Pleasant Hill
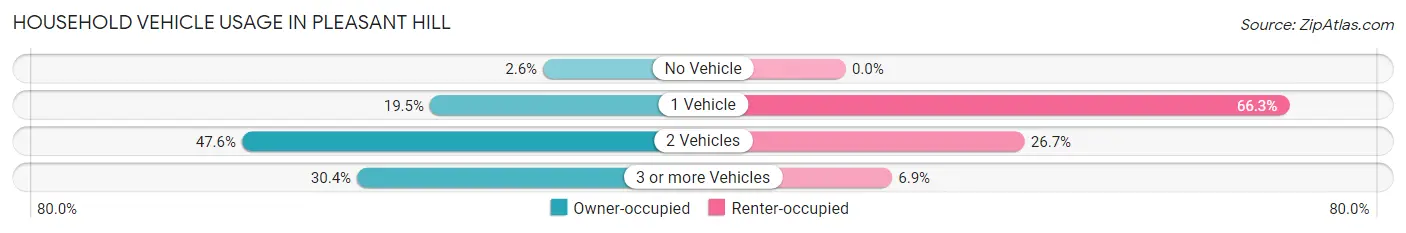
| Vehicles per Household | Owner-occupied | Renter-occupied |
| No Vehicle | 9 (2.6%) | 0 (0.0%) |
| 1 Vehicle | 68 (19.5%) | 67 (66.3%) |
| 2 Vehicles | 166 (47.6%) | 27 (26.7%) |
| 3 or more Vehicles | 106 (30.4%) | 7 (6.9%) |
| Total | 349 (100.0%) | 101 (100.0%) |
Real Estate & Mortgages in Pleasant Hill
Real Estate and Mortgage Overview in Pleasant Hill
| Characteristic | Without Mortgage | With Mortgage |
| Housing Units | 117 | 232 |
| Median Property Value | $155,300 | $151,300 |
| Median Household Income | $64,750 | $27 |
| Monthly Housing Costs | $428 | $0 |
| Real Estate Taxes | $1,527 | $6 |
Property Value by Mortgage Status in Pleasant Hill
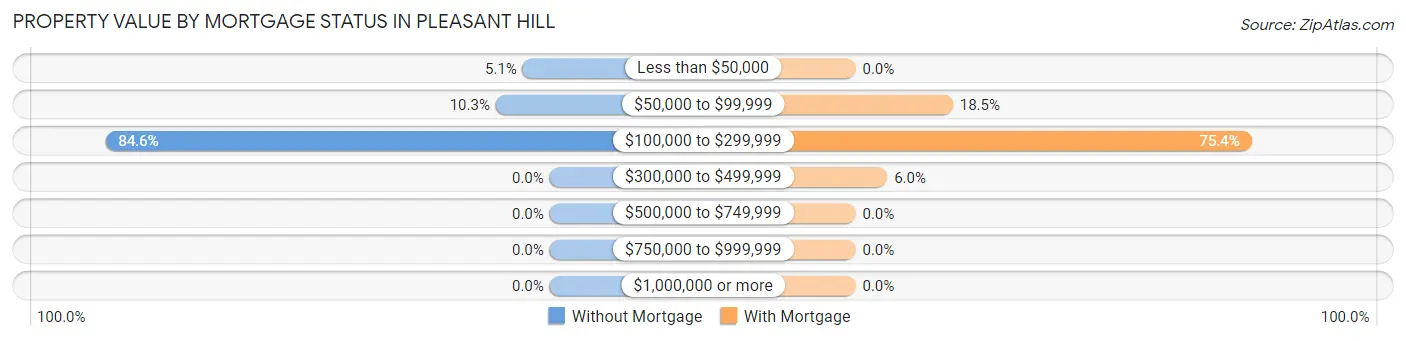
| Property Value | Without Mortgage | With Mortgage |
| Less than $50,000 | 6 (5.1%) | 0 (0.0%) |
| $50,000 to $99,999 | 12 (10.3%) | 43 (18.5%) |
| $100,000 to $299,999 | 99 (84.6%) | 175 (75.4%) |
| $300,000 to $499,999 | 0 (0.0%) | 14 (6.0%) |
| $500,000 to $749,999 | 0 (0.0%) | 0 (0.0%) |
| $750,000 to $999,999 | 0 (0.0%) | 0 (0.0%) |
| $1,000,000 or more | 0 (0.0%) | 0 (0.0%) |
| Total | 117 (100.0%) | 232 (100.0%) |
Household Income by Mortgage Status in Pleasant Hill
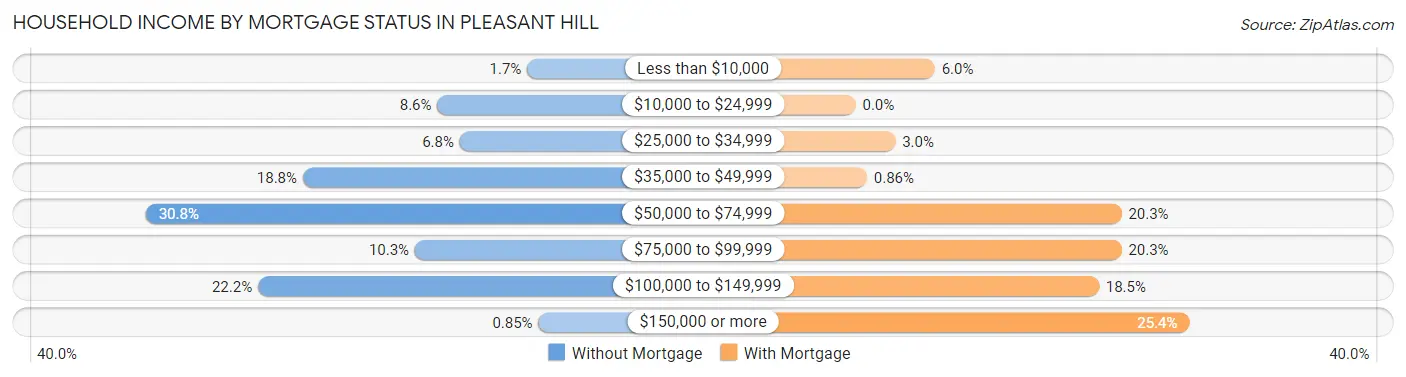
| Household Income | Without Mortgage | With Mortgage |
| Less than $10,000 | 2 (1.7%) | 14 (6.0%) |
| $10,000 to $24,999 | 10 (8.6%) | 0 (0.0%) |
| $25,000 to $34,999 | 8 (6.8%) | 7 (3.0%) |
| $35,000 to $49,999 | 22 (18.8%) | 2 (0.9%) |
| $50,000 to $74,999 | 36 (30.8%) | 47 (20.3%) |
| $75,000 to $99,999 | 12 (10.3%) | 47 (20.3%) |
| $100,000 to $149,999 | 26 (22.2%) | 43 (18.5%) |
| $150,000 or more | 1 (0.9%) | 59 (25.4%) |
| Total | 117 (100.0%) | 232 (100.0%) |
Property Value to Household Income Ratio in Pleasant Hill
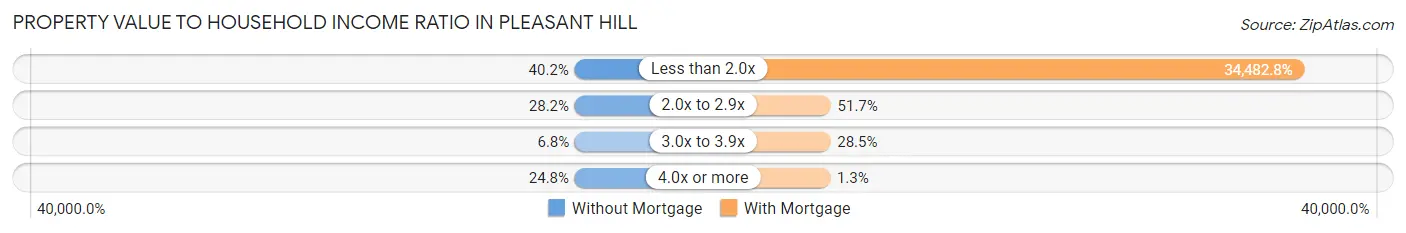
| Value-to-Income Ratio | Without Mortgage | With Mortgage |
| Less than 2.0x | 47 (40.2%) | 80,000 (34,482.8%) |
| 2.0x to 2.9x | 33 (28.2%) | 120 (51.7%) |
| 3.0x to 3.9x | 8 (6.8%) | 66 (28.4%) |
| 4.0x or more | 29 (24.8%) | 3 (1.3%) |
| Total | 117 (100.0%) | 232 (100.0%) |
Real Estate Taxes by Mortgage Status in Pleasant Hill
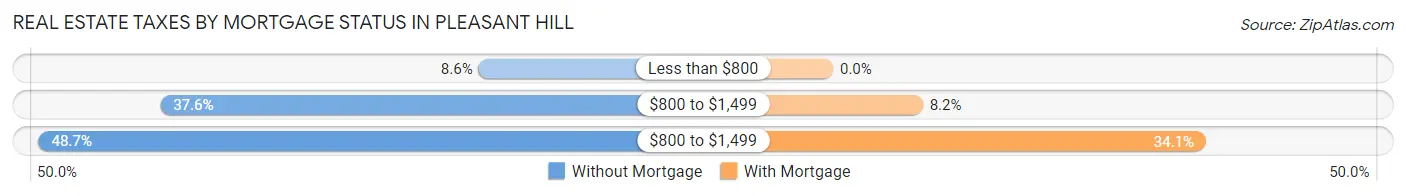
| Property Taxes | Without Mortgage | With Mortgage |
| Less than $800 | 10 (8.6%) | 0 (0.0%) |
| $800 to $1,499 | 44 (37.6%) | 19 (8.2%) |
| $800 to $1,499 | 57 (48.7%) | 79 (34.1%) |
| Total | 117 (100.0%) | 232 (100.0%) |
Health & Disability in Pleasant Hill
Health Insurance Coverage by Age in Pleasant Hill
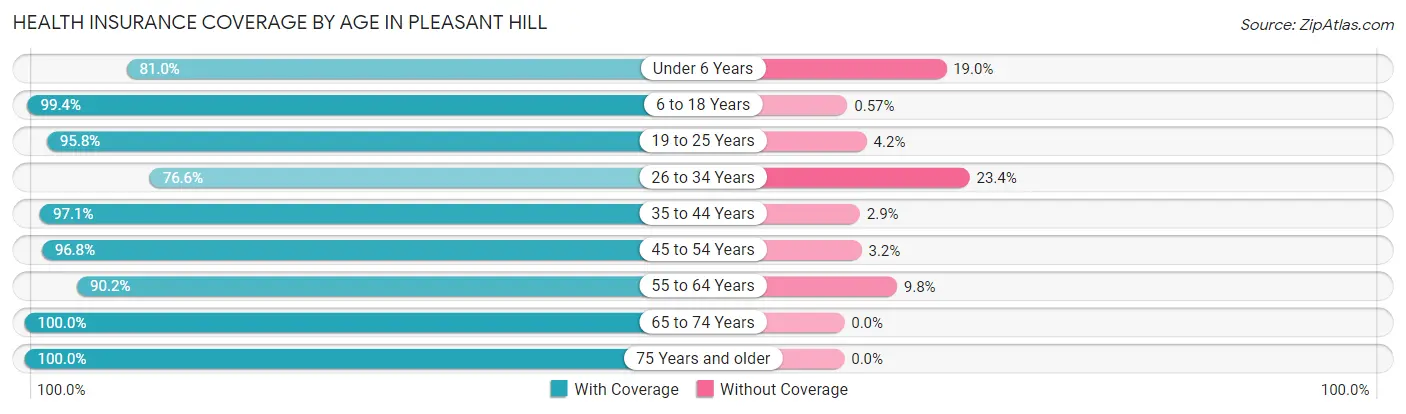
| Age Bracket | With Coverage | Without Coverage |
| Under 6 Years | 81 (81.0%) | 19 (19.0%) |
| 6 to 18 Years | 349 (99.4%) | 2 (0.6%) |
| 19 to 25 Years | 92 (95.8%) | 4 (4.2%) |
| 26 to 34 Years | 82 (76.6%) | 25 (23.4%) |
| 35 to 44 Years | 201 (97.1%) | 6 (2.9%) |
| 45 to 54 Years | 211 (96.8%) | 7 (3.2%) |
| 55 to 64 Years | 92 (90.2%) | 10 (9.8%) |
| 65 to 74 Years | 136 (100.0%) | 0 (0.0%) |
| 75 Years and older | 73 (100.0%) | 0 (0.0%) |
| Total | 1,317 (94.8%) | 73 (5.2%) |
Health Insurance Coverage by Citizenship Status in Pleasant Hill
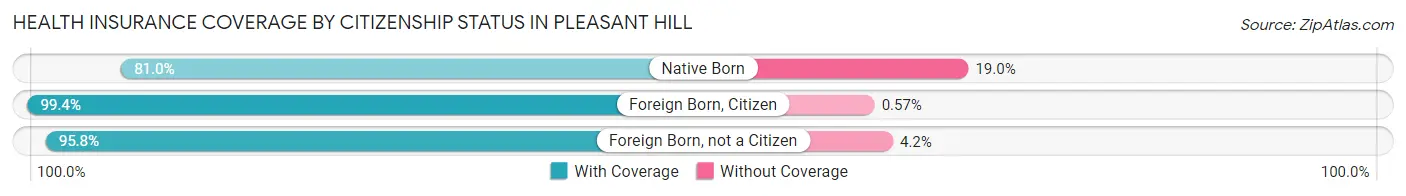
| Citizenship Status | With Coverage | Without Coverage |
| Native Born | 81 (81.0%) | 19 (19.0%) |
| Foreign Born, Citizen | 349 (99.4%) | 2 (0.6%) |
| Foreign Born, not a Citizen | 92 (95.8%) | 4 (4.2%) |
Health Insurance Coverage by Household Income in Pleasant Hill
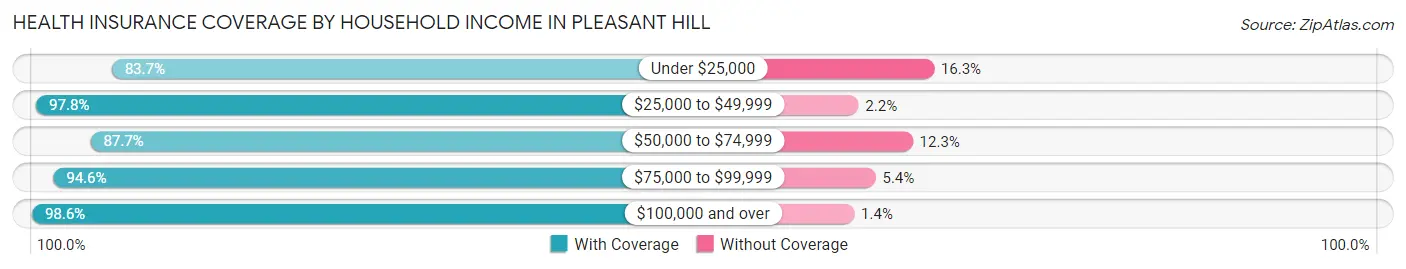
| Household Income | With Coverage | Without Coverage |
| Under $25,000 | 41 (83.7%) | 8 (16.3%) |
| $25,000 to $49,999 | 360 (97.8%) | 8 (2.2%) |
| $50,000 to $74,999 | 277 (87.7%) | 39 (12.3%) |
| $75,000 to $99,999 | 211 (94.6%) | 12 (5.4%) |
| $100,000 and over | 428 (98.6%) | 6 (1.4%) |
Public vs Private Health Insurance Coverage by Age in Pleasant Hill
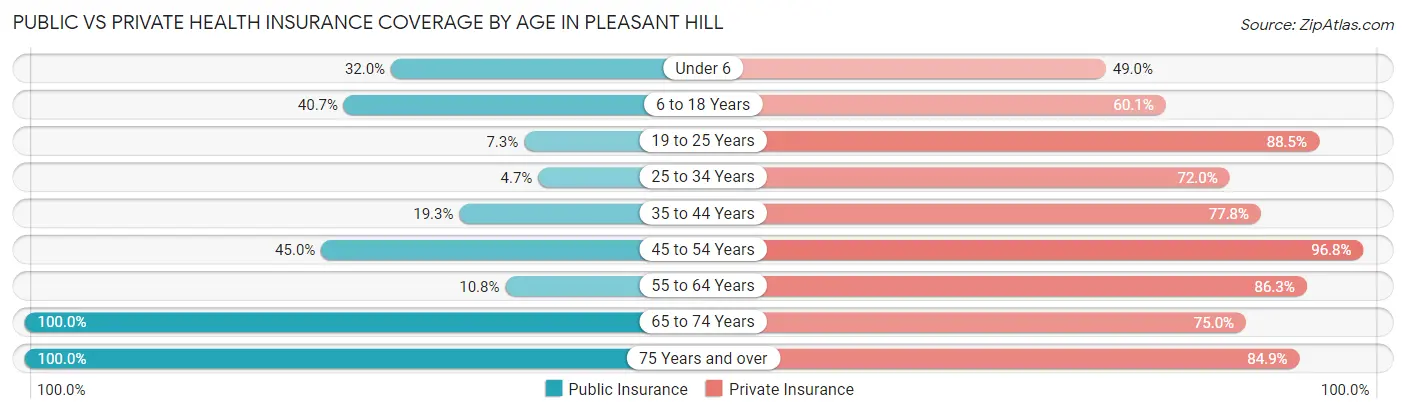
| Age Bracket | Public Insurance | Private Insurance |
| Under 6 | 32 (32.0%) | 49 (49.0%) |
| 6 to 18 Years | 143 (40.7%) | 211 (60.1%) |
| 19 to 25 Years | 7 (7.3%) | 85 (88.5%) |
| 25 to 34 Years | 5 (4.7%) | 77 (72.0%) |
| 35 to 44 Years | 40 (19.3%) | 161 (77.8%) |
| 45 to 54 Years | 98 (45.0%) | 211 (96.8%) |
| 55 to 64 Years | 11 (10.8%) | 88 (86.3%) |
| 65 to 74 Years | 136 (100.0%) | 102 (75.0%) |
| 75 Years and over | 73 (100.0%) | 62 (84.9%) |
| Total | 545 (39.2%) | 1,046 (75.2%) |
Disability Status by Sex by Age in Pleasant Hill
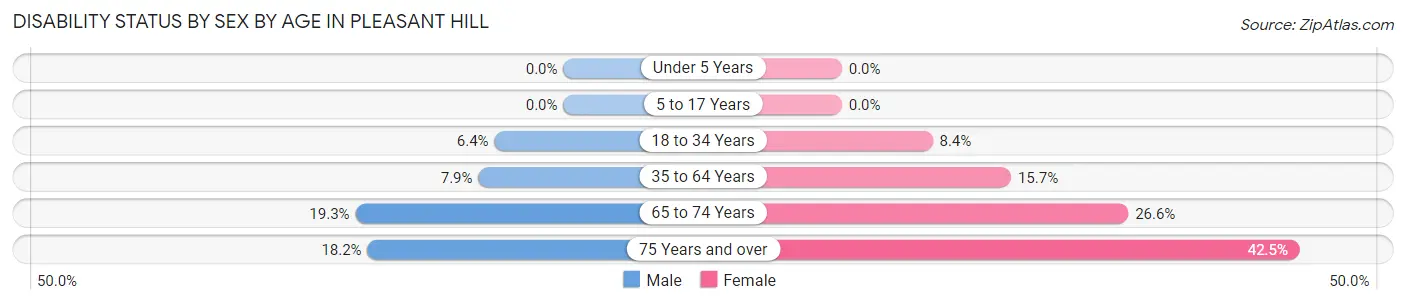
| Age Bracket | Male | Female |
| Under 5 Years | 0 (0.0%) | 0 (0.0%) |
| 5 to 17 Years | 0 (0.0%) | 0 (0.0%) |
| 18 to 34 Years | 8 (6.4%) | 8 (8.4%) |
| 35 to 64 Years | 24 (7.9%) | 35 (15.7%) |
| 65 to 74 Years | 11 (19.3%) | 21 (26.6%) |
| 75 Years and over | 6 (18.2%) | 17 (42.5%) |
Disability Class by Sex by Age in Pleasant Hill
Disability Class: Hearing Difficulty
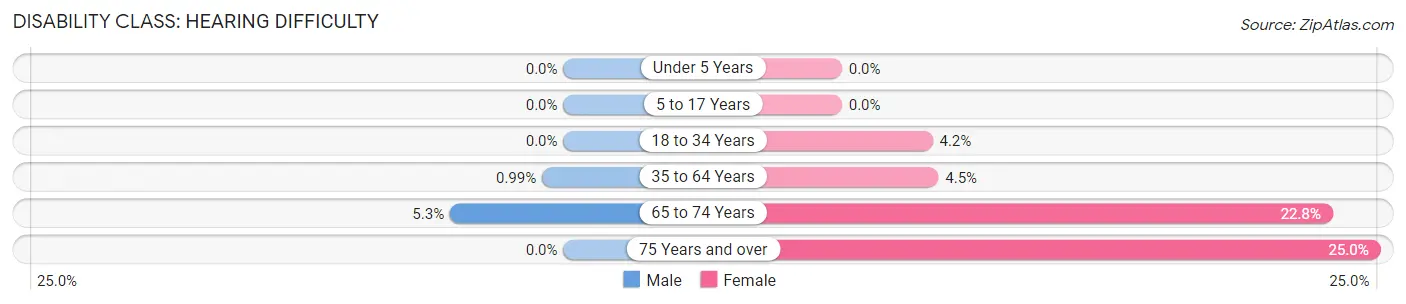
| Age Bracket | Male | Female |
| Under 5 Years | 0 (0.0%) | 0 (0.0%) |
| 5 to 17 Years | 0 (0.0%) | 0 (0.0%) |
| 18 to 34 Years | 0 (0.0%) | 4 (4.2%) |
| 35 to 64 Years | 3 (1.0%) | 10 (4.5%) |
| 65 to 74 Years | 3 (5.3%) | 18 (22.8%) |
| 75 Years and over | 0 (0.0%) | 10 (25.0%) |
Disability Class: Vision Difficulty
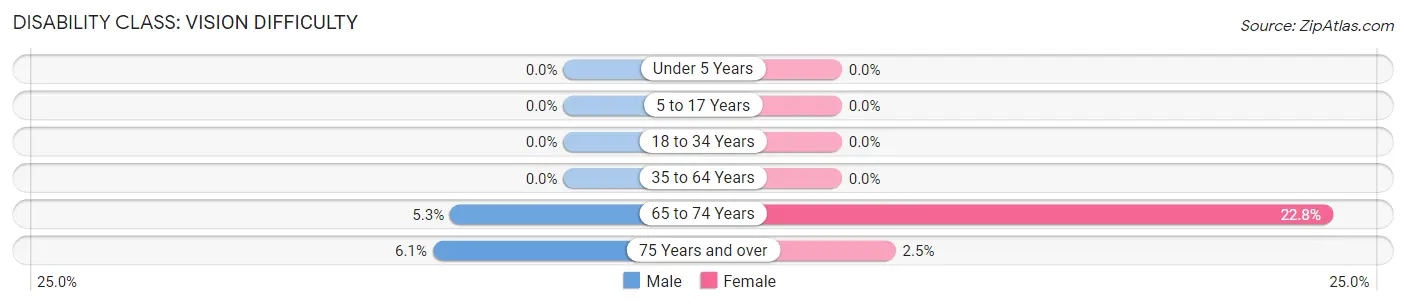
| Age Bracket | Male | Female |
| Under 5 Years | 0 (0.0%) | 0 (0.0%) |
| 5 to 17 Years | 0 (0.0%) | 0 (0.0%) |
| 18 to 34 Years | 0 (0.0%) | 0 (0.0%) |
| 35 to 64 Years | 0 (0.0%) | 0 (0.0%) |
| 65 to 74 Years | 3 (5.3%) | 18 (22.8%) |
| 75 Years and over | 2 (6.1%) | 1 (2.5%) |
Disability Class: Cognitive Difficulty
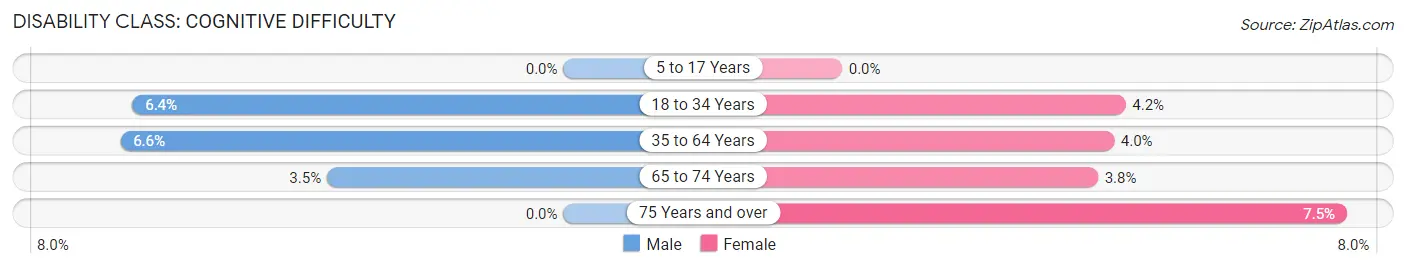
| Age Bracket | Male | Female |
| 5 to 17 Years | 0 (0.0%) | 0 (0.0%) |
| 18 to 34 Years | 8 (6.4%) | 4 (4.2%) |
| 35 to 64 Years | 20 (6.6%) | 9 (4.0%) |
| 65 to 74 Years | 2 (3.5%) | 3 (3.8%) |
| 75 Years and over | 0 (0.0%) | 3 (7.5%) |
Disability Class: Ambulatory Difficulty
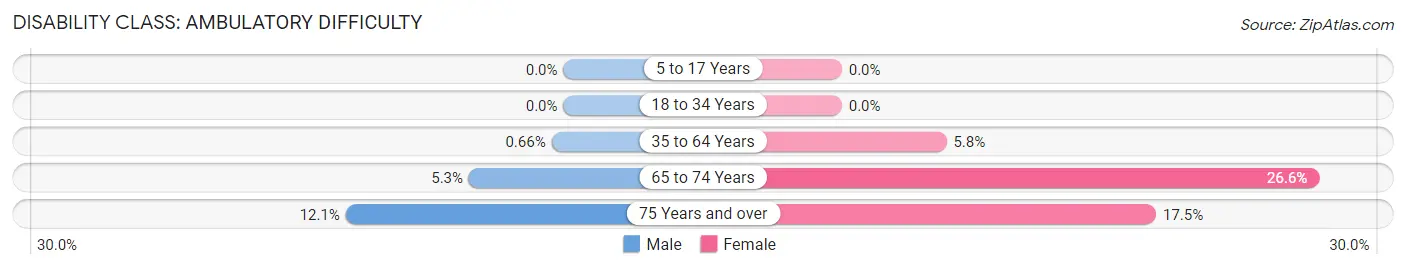
| Age Bracket | Male | Female |
| 5 to 17 Years | 0 (0.0%) | 0 (0.0%) |
| 18 to 34 Years | 0 (0.0%) | 0 (0.0%) |
| 35 to 64 Years | 2 (0.7%) | 13 (5.8%) |
| 65 to 74 Years | 3 (5.3%) | 21 (26.6%) |
| 75 Years and over | 4 (12.1%) | 7 (17.5%) |
Disability Class: Self-Care Difficulty
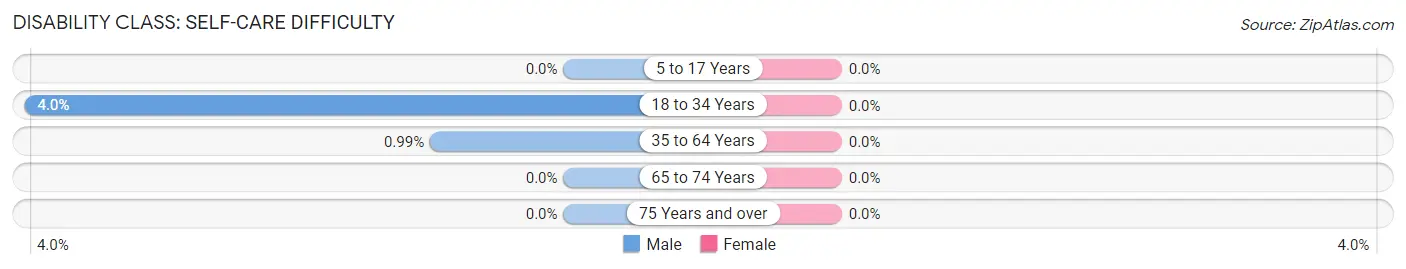
| Age Bracket | Male | Female |
| 5 to 17 Years | 0 (0.0%) | 0 (0.0%) |
| 18 to 34 Years | 5 (4.0%) | 0 (0.0%) |
| 35 to 64 Years | 3 (1.0%) | 0 (0.0%) |
| 65 to 74 Years | 0 (0.0%) | 0 (0.0%) |
| 75 Years and over | 0 (0.0%) | 0 (0.0%) |
Technology Access in Pleasant Hill
Computing Device Access in Pleasant Hill
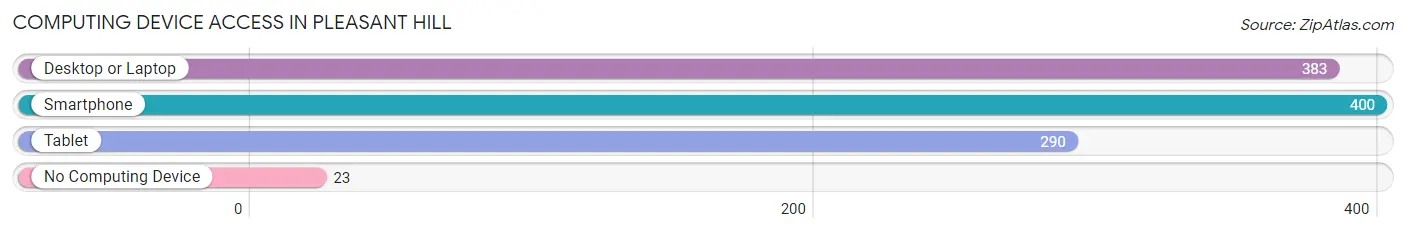
| Device Type | # Households | % Households |
| Desktop or Laptop | 383 | 85.1% |
| Smartphone | 400 | 88.9% |
| Tablet | 290 | 64.4% |
| No Computing Device | 23 | 5.1% |
| Total | 450 | 100.0% |
Internet Access in Pleasant Hill
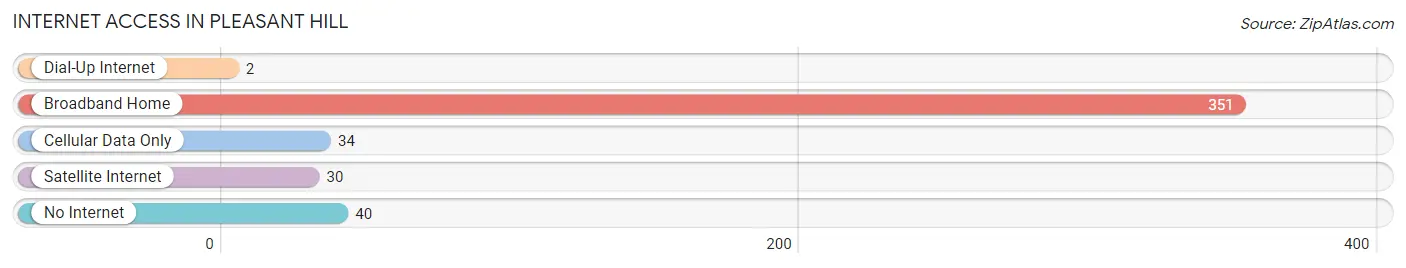
| Internet Type | # Households | % Households |
| Dial-Up Internet | 2 | 0.4% |
| Broadband Home | 351 | 78.0% |
| Cellular Data Only | 34 | 7.6% |
| Satellite Internet | 30 | 6.7% |
| No Internet | 40 | 8.9% |
| Total | 450 | 100.0% |
Pleasant Hill Summary
Pleasant Hill, Ohio is a small village located in Miami County, Ohio. It is situated in the western part of the state, approximately 25 miles north of Dayton. The village has a population of approximately 1,000 people and is part of the Dayton Metropolitan Statistical Area.
History
Pleasant Hill was founded in 1817 by a group of settlers from Pennsylvania. The village was originally known as “Pleasant Hill Settlement” and was located in the township of Staunton. The village was officially incorporated in 1837 and was named after the nearby Pleasant Hill Church.
The village was a small farming community for many years, but in the late 19th century, the village began to grow and develop. The village was home to several businesses, including a sawmill, a grist mill, a blacksmith shop, and a general store.
In the early 20th century, the village experienced a period of growth and development. The village was home to several factories, including a canning factory, a furniture factory, and a brickyard. The village also had a post office, a bank, and a hotel.
Geography
Pleasant Hill is located in western Ohio, approximately 25 miles north of Dayton. The village is situated in the Miami Valley, which is part of the larger Great Miami River Valley. The village is located on the banks of the Stillwater River, which flows through the village.
The village is located in a rural area and is surrounded by farmland. The village is located in a hilly area and is surrounded by wooded areas. The village is located in a temperate climate and experiences four distinct seasons.
Economy
The economy of Pleasant Hill is largely based on agriculture. The village is home to several farms, which produce a variety of crops, including corn, soybeans, and wheat. The village is also home to several small businesses, including a grocery store, a hardware store, and a restaurant.
The village is also home to several manufacturing companies, including a furniture factory and a canning factory. The village is also home to several service-based businesses, including a bank, a post office, and a hotel.
Demographics
As of the 2010 census, the population of Pleasant Hill was 1,000 people. The village is predominantly white, with approximately 95% of the population being white. The village is also home to a small Hispanic population, with approximately 3% of the population being Hispanic.
The median household income in the village is approximately $45,000. The median home value in the village is approximately $150,000. The village has a low unemployment rate, with approximately 4% of the population being unemployed.
Conclusion
Pleasant Hill is a small village located in western Ohio. The village has a population of approximately 1,000 people and is part of the Dayton Metropolitan Statistical Area. The village was founded in 1817 and was originally known as “Pleasant Hill Settlement.” The village is predominantly white, with approximately 95% of the population being white. The village is home to several small businesses and manufacturing companies. The village has a median household income of approximately $45,000 and a median home value of approximately $150,000.
Common Questions
What is Per Capita Income in Pleasant Hill?
Per Capita income in Pleasant Hill is $25,815.
What is the Median Family Income in Pleasant Hill?
Median Family Income in Pleasant Hill is $73,611.
What is the Median Household income in Pleasant Hill?
Median Household Income in Pleasant Hill is $65,875.
What is Income or Wage Gap in Pleasant Hill?
Income or Wage Gap in Pleasant Hill is 16.5%.
Women in Pleasant Hill earn 83.5 cents for every dollar earned by a man.
What is Inequality or Gini Index in Pleasant Hill?
Inequality or Gini Index in Pleasant Hill is 0.32.
What is the Total Population of Pleasant Hill?
Total Population of Pleasant Hill is 1,390.
What is the Total Male Population of Pleasant Hill?
Total Male Population of Pleasant Hill is 685.
What is the Total Female Population of Pleasant Hill?
Total Female Population of Pleasant Hill is 705.
What is the Ratio of Males per 100 Females in Pleasant Hill?
There are 97.16 Males per 100 Females in Pleasant Hill.
What is the Ratio of Females per 100 Males in Pleasant Hill?
There are 102.92 Females per 100 Males in Pleasant Hill.
What is the Median Population Age in Pleasant Hill?
Median Population Age in Pleasant Hill is 37.6 Years.
What is the Average Family Size in Pleasant Hill
Average Family Size in Pleasant Hill is 3.6 People.
What is the Average Household Size in Pleasant Hill
Average Household Size in Pleasant Hill is 3.1 People.
How Large is the Labor Force in Pleasant Hill?
There are 624 People in the Labor Forcein in Pleasant Hill.
What is the Percentage of People in the Labor Force in Pleasant Hill?
62.5% of People are in the Labor Force in Pleasant Hill.
What is the Unemployment Rate in Pleasant Hill?
Unemployment Rate in Pleasant Hill is 3.0%.