Malvern, OH Map & Demographics
Malvern Map
Malvern Overview
$19,675
PER CAPITA INCOME
$34,115
AVG FAMILY INCOME
$28,387
AVG HOUSEHOLD INCOME
15.6%
WAGE / INCOME GAP [ % ]
84.4¢/ $1
WAGE / INCOME GAP [ $ ]
0.49
INEQUALITY / GINI INDEX
1,555
TOTAL POPULATION
693
MALE POPULATION
862
FEMALE POPULATION
80.39
MALES / 100 FEMALES
124.39
FEMALES / 100 MALES
40.6
MEDIAN AGE
2.8
AVG FAMILY SIZE
2.2
AVG HOUSEHOLD SIZE
740
LABOR FORCE [ PEOPLE ]
58.3%
PERCENT IN LABOR FORCE
1.3%
UNEMPLOYMENT RATE
Malvern Zip Codes
Income in Malvern
Income Overview in Malvern
Per Capita Income in Malvern is $19,675, while median incomes of families and households are $34,115 and $28,387 respectively.
| Characteristic | Number | Measure |
| Per Capita Income | 1,555 | $19,675 |
| Median Family Income | 383 | $34,115 |
| Mean Family Income | 383 | $52,449 |
| Median Household Income | 717 | $28,387 |
| Mean Household Income | 717 | $40,847 |
| Income Deficit | 383 | $0 |
| Wage / Income Gap (%) | 1,555 | 15.61% |
| Wage / Income Gap ($) | 1,555 | 84.39¢ per $1 |
| Gini / Inequality Index | 1,555 | 0.49 |
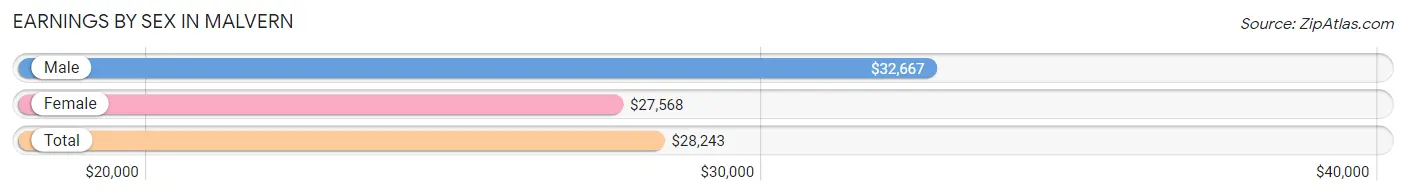
Earnings by Sex in Malvern
Average Earnings in Malvern are $28,243, $32,667 for men and $27,568 for women, a difference of 15.6%.
| Sex | Number | Average Earnings |
| Male | 284 (37.9%) | $32,667 |
| Female | 466 (62.1%) | $27,568 |
| Total | 750 (100.0%) | $28,243 |
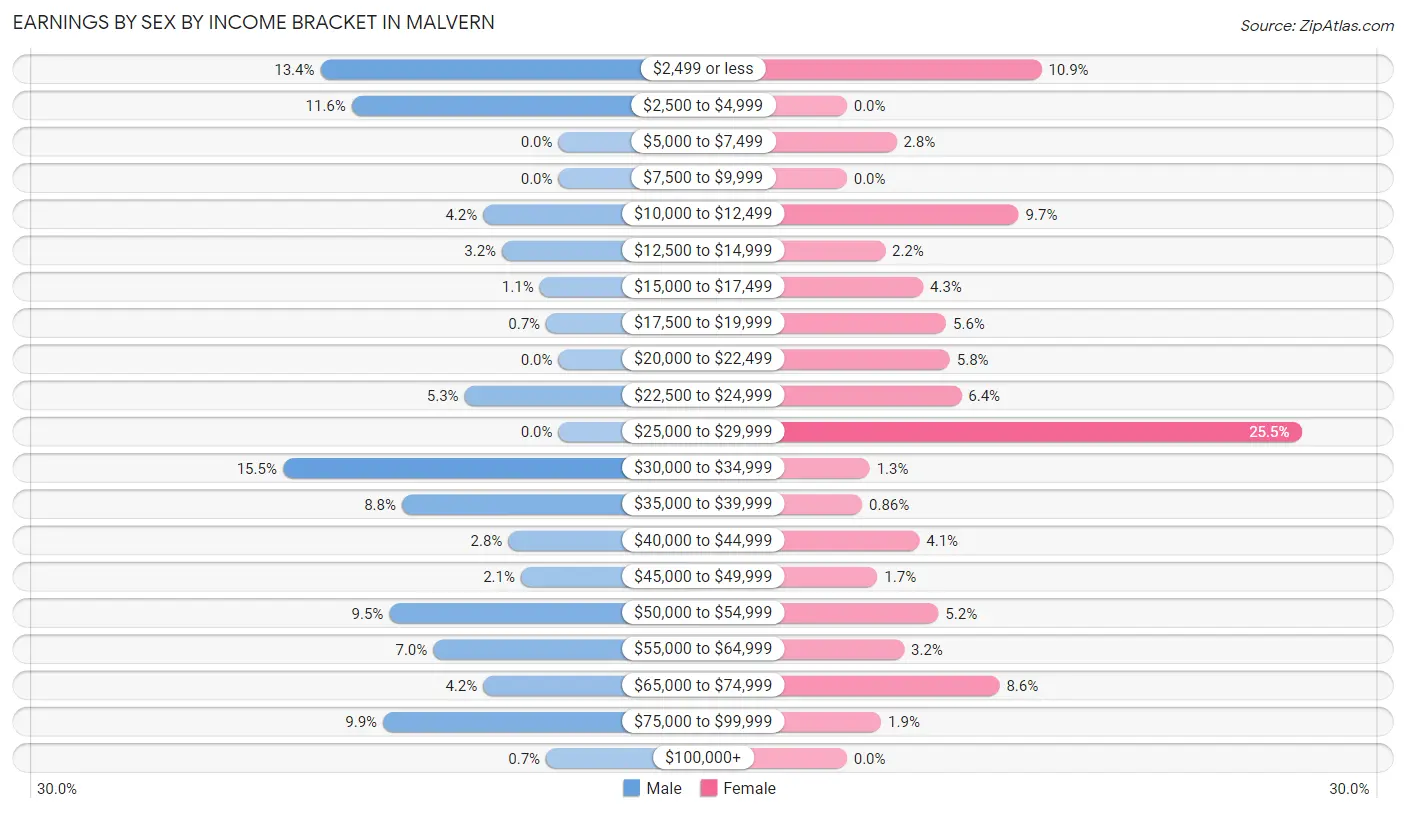
Earnings by Sex by Income Bracket in Malvern
The most common earnings brackets in Malvern are $30,000 to $34,999 for men (44 | 15.5%) and $25,000 to $29,999 for women (119 | 25.5%).
| Income | Male | Female |
| $2,499 or less | 38 (13.4%) | 51 (10.9%) |
| $2,500 to $4,999 | 33 (11.6%) | 0 (0.0%) |
| $5,000 to $7,499 | 0 (0.0%) | 13 (2.8%) |
| $7,500 to $9,999 | 0 (0.0%) | 0 (0.0%) |
| $10,000 to $12,499 | 12 (4.2%) | 45 (9.7%) |
| $12,500 to $14,999 | 9 (3.2%) | 10 (2.1%) |
| $15,000 to $17,499 | 3 (1.1%) | 20 (4.3%) |
| $17,500 to $19,999 | 2 (0.7%) | 26 (5.6%) |
| $20,000 to $22,499 | 0 (0.0%) | 27 (5.8%) |
| $22,500 to $24,999 | 15 (5.3%) | 30 (6.4%) |
| $25,000 to $29,999 | 0 (0.0%) | 119 (25.5%) |
| $30,000 to $34,999 | 44 (15.5%) | 6 (1.3%) |
| $35,000 to $39,999 | 25 (8.8%) | 4 (0.9%) |
| $40,000 to $44,999 | 8 (2.8%) | 19 (4.1%) |
| $45,000 to $49,999 | 6 (2.1%) | 8 (1.7%) |
| $50,000 to $54,999 | 27 (9.5%) | 24 (5.1%) |
| $55,000 to $64,999 | 20 (7.0%) | 15 (3.2%) |
| $65,000 to $74,999 | 12 (4.2%) | 40 (8.6%) |
| $75,000 to $99,999 | 28 (9.9%) | 9 (1.9%) |
| $100,000+ | 2 (0.7%) | 0 (0.0%) |
| Total | 284 (100.0%) | 466 (100.0%) |
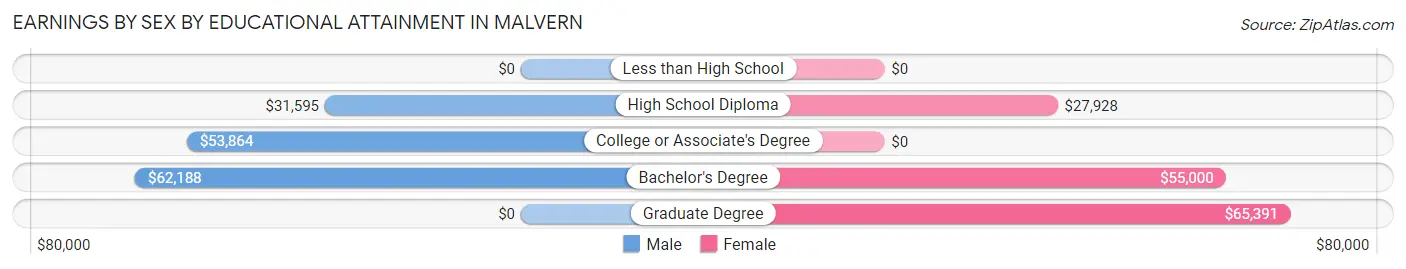
Earnings by Sex by Educational Attainment in Malvern
Average earnings in Malvern are $32,328 for men and $28,119 for women, a difference of 13.0%. Men with an educational attainment of bachelor's degree enjoy the highest average annual earnings of $62,188, while those with high school diploma education earn the least with $31,595. Women with an educational attainment of graduate degree earn the most with the average annual earnings of $65,391, while those with high school diploma education have the smallest earnings of $27,928.
| Educational Attainment | Male Income | Female Income |
| Less than High School | - | - |
| High School Diploma | $31,595 | $27,928 |
| College or Associate's Degree | $53,864 | $0 |
| Bachelor's Degree | $62,188 | $55,000 |
| Graduate Degree | - | - |
| Total | $32,328 | $28,119 |
Family Income in Malvern
Family Income Brackets in Malvern
According to the Malvern family income data, there are 74 families falling into the less than $10,000 income range, which is the most common income bracket and makes up 19.3% of all families.
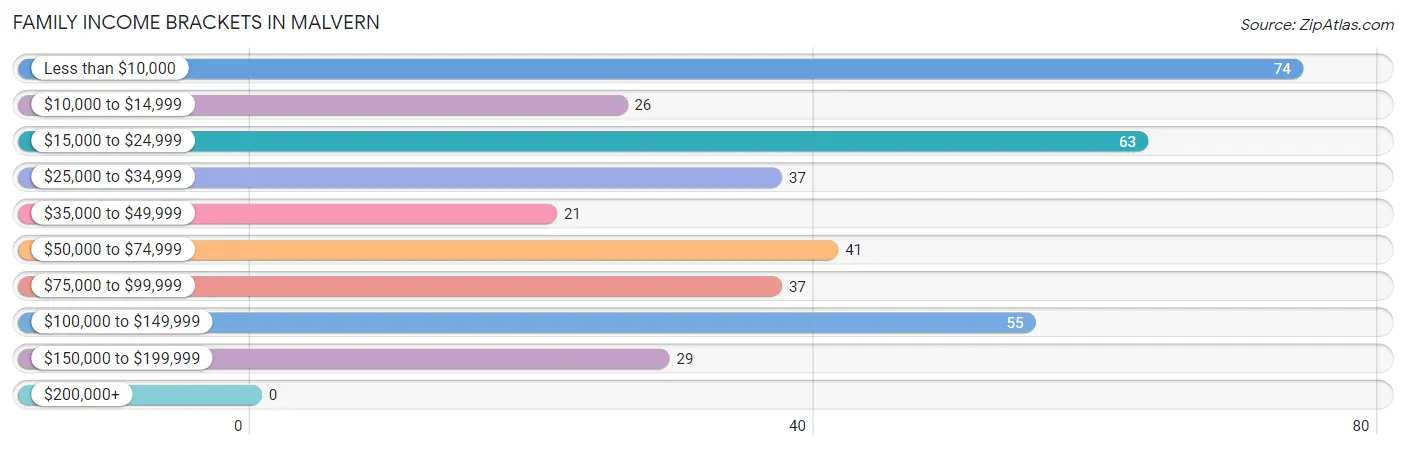
| Income Bracket | # Families | % Families |
| Less than $10,000 | 74 | 19.3% |
| $10,000 to $14,999 | 26 | 6.8% |
| $15,000 to $24,999 | 63 | 16.4% |
| $25,000 to $34,999 | 37 | 9.7% |
| $35,000 to $49,999 | 21 | 5.5% |
| $50,000 to $74,999 | 41 | 10.7% |
| $75,000 to $99,999 | 37 | 9.7% |
| $100,000 to $149,999 | 55 | 14.4% |
| $150,000 to $199,999 | 29 | 7.6% |
| $200,000+ | 0 | 0.0% |
Family Income by Famaliy Size in Malvern
4-person families (33 | 8.6%) account for the highest median family income in Malvern with $60,288 per family, while 4-person families (33 | 8.6%) have the highest median income of $15,072 per family member.
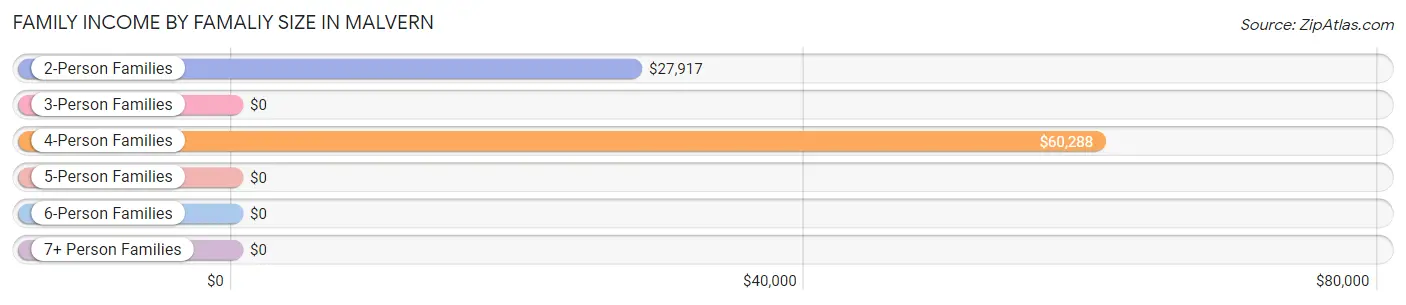
| Income Bracket | # Families | Median Income |
| 2-Person Families | 211 (55.1%) | $27,917 |
| 3-Person Families | 106 (27.7%) | $0 |
| 4-Person Families | 33 (8.6%) | $60,288 |
| 5-Person Families | 25 (6.5%) | $0 |
| 6-Person Families | 2 (0.5%) | $0 |
| 7+ Person Families | 6 (1.6%) | $0 |
| Total | 383 (100.0%) | $34,115 |
Family Income by Number of Earners in Malvern
The median family income in Malvern is $34,115, with families comprising 3+ earners (19) having the highest median family income of $123,958, while families with 1 earner (156) have the lowest median family income of $19,853, accounting for 5.0% and 40.7% of families, respectively.
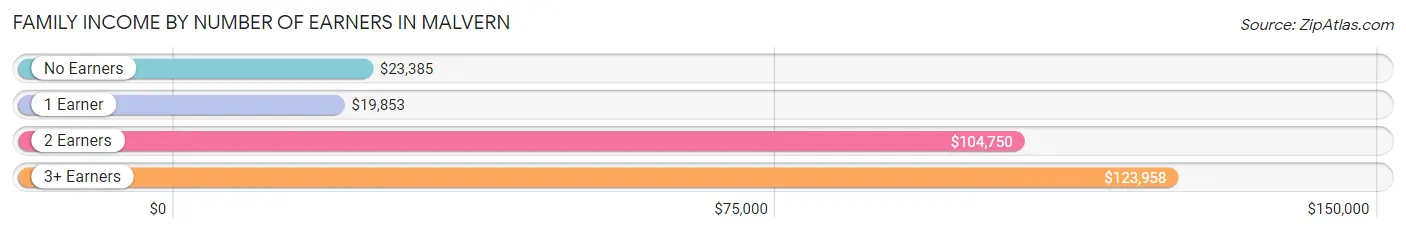
| Number of Earners | # Families | Median Income |
| No Earners | 93 (24.3%) | $23,385 |
| 1 Earner | 156 (40.7%) | $19,853 |
| 2 Earners | 115 (30.0%) | $104,750 |
| 3+ Earners | 19 (5.0%) | $123,958 |
| Total | 383 (100.0%) | $34,115 |
Household Income in Malvern
Household Income Brackets in Malvern
With 149 households falling in the category, the $25,000 to $34,999 income range is the most frequent in Malvern, accounting for 20.8% of all households.
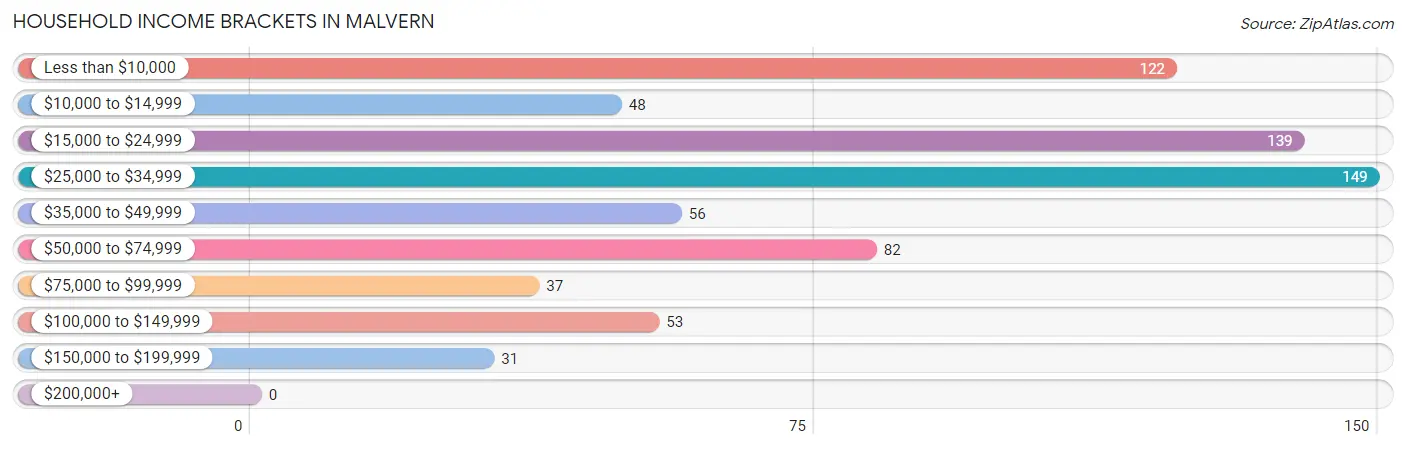
| Income Bracket | # Households | % Households |
| Less than $10,000 | 122 | 17.0% |
| $10,000 to $14,999 | 48 | 6.7% |
| $15,000 to $24,999 | 139 | 19.4% |
| $25,000 to $34,999 | 149 | 20.8% |
| $35,000 to $49,999 | 56 | 7.8% |
| $50,000 to $74,999 | 82 | 11.4% |
| $75,000 to $99,999 | 37 | 5.2% |
| $100,000 to $149,999 | 53 | 7.4% |
| $150,000 to $199,999 | 31 | 4.3% |
| $200,000+ | 0 | 0.0% |
Household Income by Householder Age in Malvern
The median household income in Malvern is $28,387, with the highest median household income of $29,210 found in the 45 to 64 years age bracket for the primary householder. A total of 295 households (41.1%) fall into this category. Meanwhile, the 25 to 44 years age bracket for the primary householder has the lowest median household income of $0, with 226 households (31.5%) in this group.
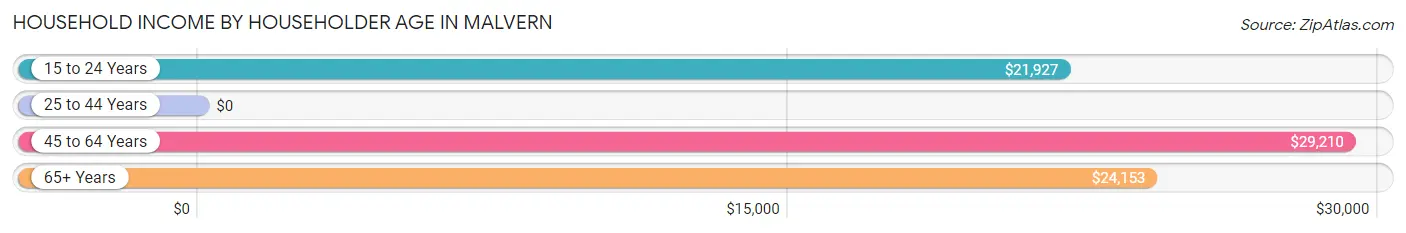
| Income Bracket | # Households | Median Income |
| 15 to 24 Years | 43 (6.0%) | $21,927 |
| 25 to 44 Years | 226 (31.5%) | $0 |
| 45 to 64 Years | 295 (41.1%) | $29,210 |
| 65+ Years | 153 (21.3%) | $24,153 |
| Total | 717 (100.0%) | $28,387 |
Poverty in Malvern
Income Below Poverty by Sex and Age in Malvern
With 24.3% poverty level for males and 26.8% for females among the residents of Malvern, 12 to 14 year old males and 12 to 14 year old females are the most vulnerable to poverty, with 6 males (66.7%) and 10 females (83.3%) in their respective age groups living below the poverty level.
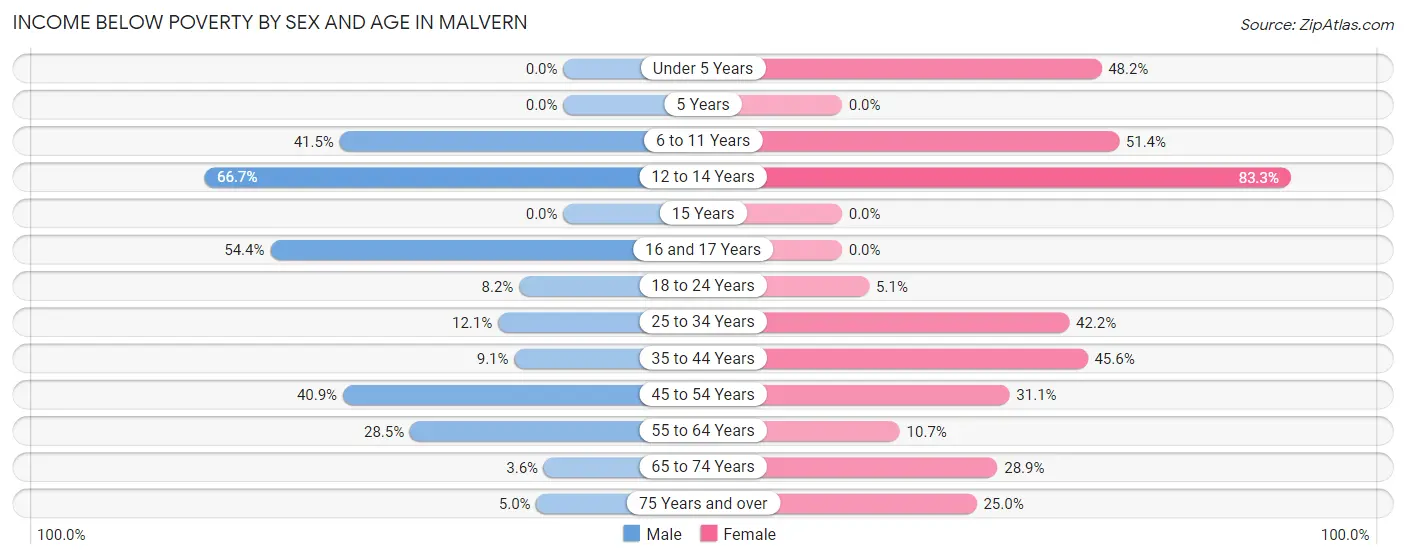
| Age Bracket | Male | Female |
| Under 5 Years | 0 (0.0%) | 13 (48.1%) |
| 5 Years | 0 (0.0%) | 0 (0.0%) |
| 6 to 11 Years | 22 (41.5%) | 18 (51.4%) |
| 12 to 14 Years | 6 (66.7%) | 10 (83.3%) |
| 15 Years | 0 (0.0%) | 0 (0.0%) |
| 16 and 17 Years | 62 (54.4%) | 0 (0.0%) |
| 18 to 24 Years | 5 (8.2%) | 3 (5.1%) |
| 25 to 34 Years | 12 (12.1%) | 27 (42.2%) |
| 35 to 44 Years | 4 (9.1%) | 57 (45.6%) |
| 45 to 54 Years | 18 (40.9%) | 14 (31.1%) |
| 55 to 64 Years | 33 (28.4%) | 26 (10.7%) |
| 65 to 74 Years | 3 (3.6%) | 28 (28.9%) |
| 75 Years and over | 2 (5.0%) | 7 (25.0%) |
| Total | 167 (24.3%) | 203 (26.8%) |
Income Above Poverty by Sex and Age in Malvern
According to the poverty statistics in Malvern, males aged under 5 years and females aged 5 years are the age groups that are most secure financially, with 100.0% of males and 100.0% of females in these age groups living above the poverty line.
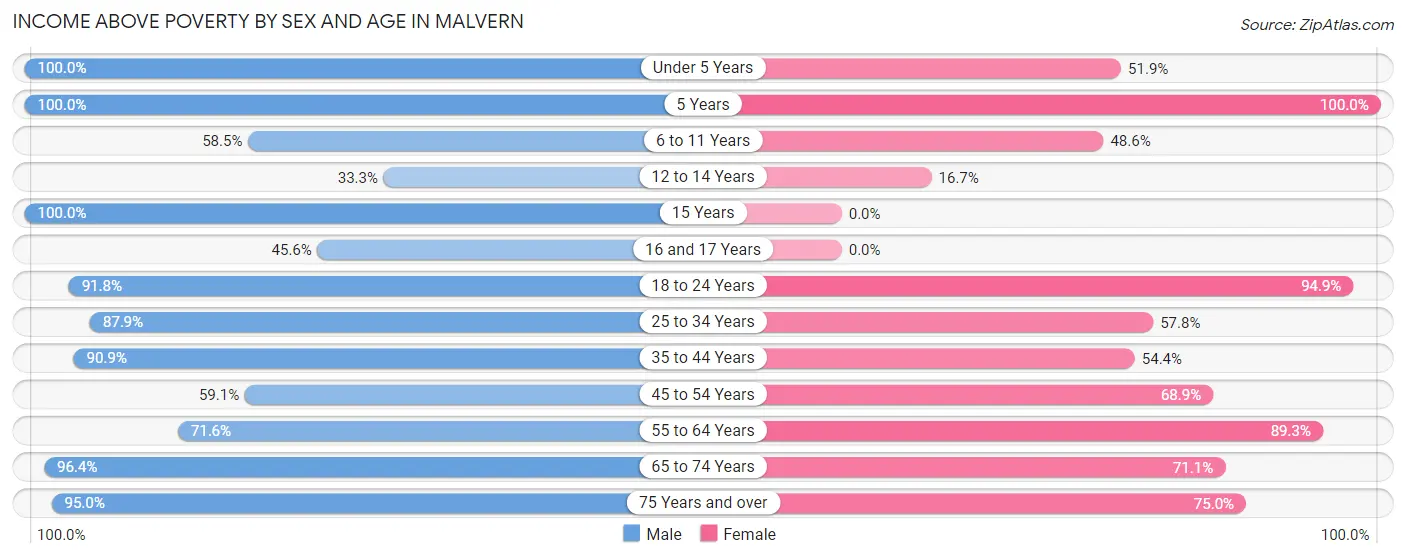
| Age Bracket | Male | Female |
| Under 5 Years | 11 (100.0%) | 14 (51.8%) |
| 5 Years | 2 (100.0%) | 24 (100.0%) |
| 6 to 11 Years | 31 (58.5%) | 17 (48.6%) |
| 12 to 14 Years | 3 (33.3%) | 2 (16.7%) |
| 15 Years | 12 (100.0%) | 0 (0.0%) |
| 16 and 17 Years | 52 (45.6%) | 0 (0.0%) |
| 18 to 24 Years | 56 (91.8%) | 56 (94.9%) |
| 25 to 34 Years | 87 (87.9%) | 37 (57.8%) |
| 35 to 44 Years | 40 (90.9%) | 68 (54.4%) |
| 45 to 54 Years | 26 (59.1%) | 31 (68.9%) |
| 55 to 64 Years | 83 (71.6%) | 216 (89.3%) |
| 65 to 74 Years | 80 (96.4%) | 69 (71.1%) |
| 75 Years and over | 38 (95.0%) | 21 (75.0%) |
| Total | 521 (75.7%) | 555 (73.2%) |
Income Below Poverty Among Married-Couple Families in Malvern
The poverty statistics for married-couple families in Malvern show that 9.0% or 22 of the total 245 families live below the poverty line. Families with no children have the highest poverty rate of 12.0%, comprising of 22 families. On the other hand, families with 1 or 2 children have the lowest poverty rate of 0.0%, which includes 0 families.
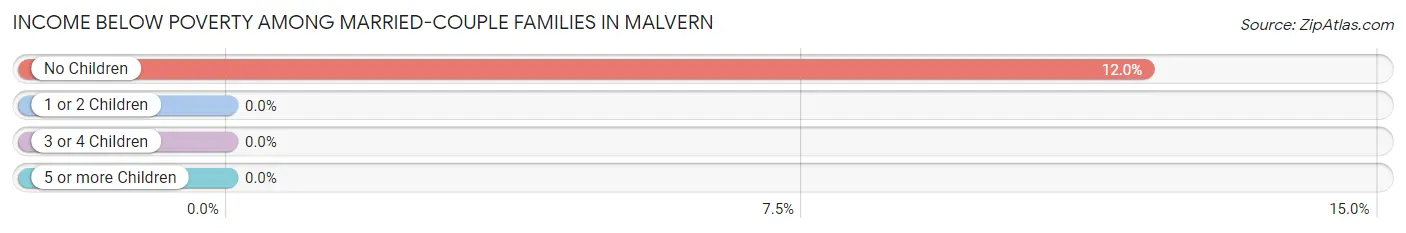
| Children | Above Poverty | Below Poverty |
| No Children | 162 (88.0%) | 22 (12.0%) |
| 1 or 2 Children | 39 (100.0%) | 0 (0.0%) |
| 3 or 4 Children | 22 (100.0%) | 0 (0.0%) |
| 5 or more Children | 0 (0.0%) | 0 (0.0%) |
| Total | 223 (91.0%) | 22 (9.0%) |
Income Below Poverty Among Single-Parent Households in Malvern
According to the poverty data in Malvern, 80.0% or 12 single-father households and 69.9% or 86 single-mother households are living below the poverty line. Among single-father households, those with 1 or 2 children have the highest poverty rate, with 12 households (100.0%) experiencing poverty. Likewise, among single-mother households, those with no children have the highest poverty rate, with 2 households (100.0%) falling below the poverty line.
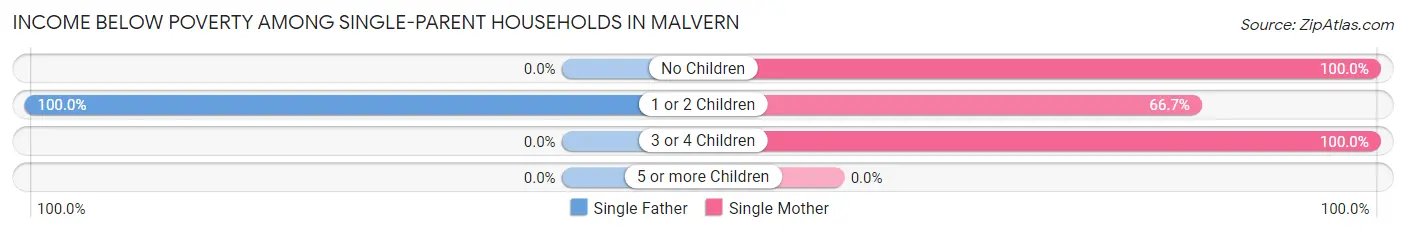
| Children | Single Father | Single Mother |
| No Children | 0 (0.0%) | 2 (100.0%) |
| 1 or 2 Children | 12 (100.0%) | 74 (66.7%) |
| 3 or 4 Children | 0 (0.0%) | 10 (100.0%) |
| 5 or more Children | 0 (0.0%) | 0 (0.0%) |
| Total | 12 (80.0%) | 86 (69.9%) |
Income Below Poverty Among Married-Couple vs Single-Parent Households in Malvern
The poverty data for Malvern shows that 22 of the married-couple family households (9.0%) and 98 of the single-parent households (71.0%) are living below the poverty level. Within the married-couple family households, those with no children have the highest poverty rate, with 22 households (12.0%) falling below the poverty line. Among the single-parent households, those with 3 or 4 children have the highest poverty rate, with 10 household (100.0%) living below poverty.
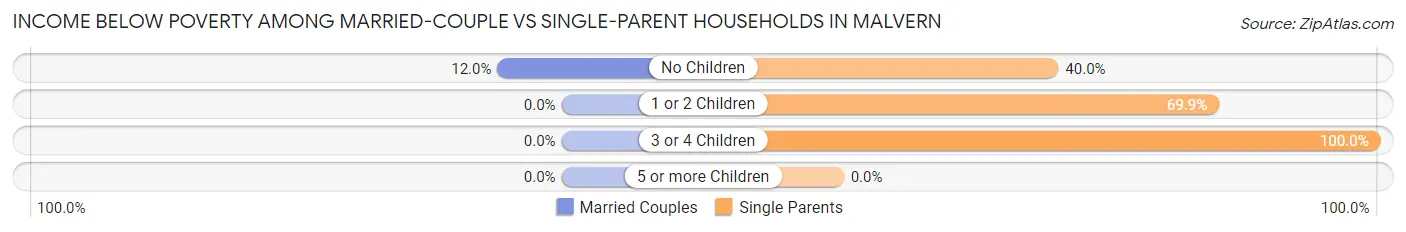
| Children | Married-Couple Families | Single-Parent Households |
| No Children | 22 (12.0%) | 2 (40.0%) |
| 1 or 2 Children | 0 (0.0%) | 86 (69.9%) |
| 3 or 4 Children | 0 (0.0%) | 10 (100.0%) |
| 5 or more Children | 0 (0.0%) | 0 (0.0%) |
| Total | 22 (9.0%) | 98 (71.0%) |
Race in Malvern
The most populous races in Malvern are White / Caucasian (1,413 | 90.9%), Black / African American (96 | 6.2%), and Two or more Races (43 | 2.8%).
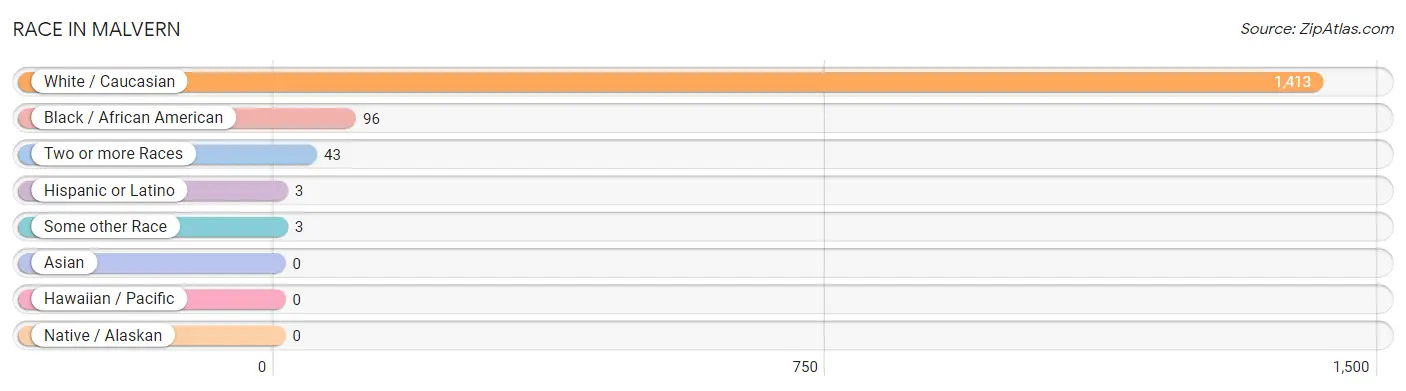
| Race | # Population | % Population |
| Asian | 0 | 0.0% |
| Black / African American | 96 | 6.2% |
| Hawaiian / Pacific | 0 | 0.0% |
| Hispanic or Latino | 3 | 0.2% |
| Native / Alaskan | 0 | 0.0% |
| White / Caucasian | 1,413 | 90.9% |
| Two or more Races | 43 | 2.8% |
| Some other Race | 3 | 0.2% |
| Total | 1,555 | 100.0% |
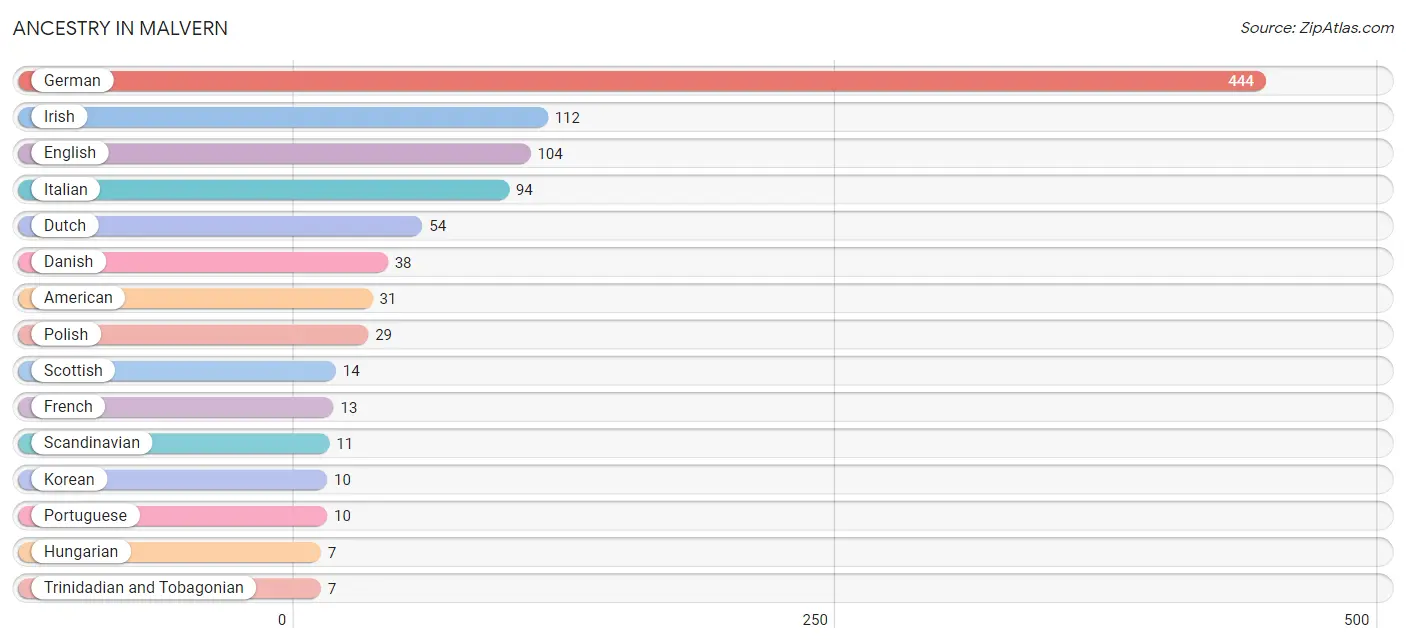
Ancestry in Malvern
The most populous ancestries reported in Malvern are German (444 | 28.5%), Irish (112 | 7.2%), English (104 | 6.7%), Italian (94 | 6.0%), and Dutch (54 | 3.5%), together accounting for 52.0% of all Malvern residents.
| Ancestry | # Population | % Population |
| American | 31 | 2.0% |
| Arab | 6 | 0.4% |
| British | 4 | 0.3% |
| Canadian | 3 | 0.2% |
| Czech | 5 | 0.3% |
| Czechoslovakian | 2 | 0.1% |
| Danish | 38 | 2.4% |
| Dutch | 54 | 3.5% |
| English | 104 | 6.7% |
| European | 4 | 0.3% |
| French | 13 | 0.8% |
| German | 444 | 28.5% |
| Greek | 5 | 0.3% |
| Hungarian | 7 | 0.4% |
| Iraqi | 3 | 0.2% |
| Irish | 112 | 7.2% |
| Italian | 94 | 6.0% |
| Korean | 10 | 0.6% |
| Lebanese | 3 | 0.2% |
| Mexican | 3 | 0.2% |
| Polish | 29 | 1.9% |
| Portuguese | 10 | 0.6% |
| Scandinavian | 11 | 0.7% |
| Scotch-Irish | 3 | 0.2% |
| Scottish | 14 | 0.9% |
| Slovak | 3 | 0.2% |
| Swedish | 3 | 0.2% |
| Swiss | 4 | 0.3% |
| Trinidadian and Tobagonian | 7 | 0.4% |
| Welsh | 5 | 0.3% | View All 30 Rows |
Immigrants in Malvern
The most numerous immigrant groups reported in Malvern came from Canada (4 | 0.3%), Asia (3 | 0.2%), Central America (3 | 0.2%), Europe (3 | 0.2%), and Guatemala (3 | 0.2%), together accounting for 1.0% of all Malvern residents.
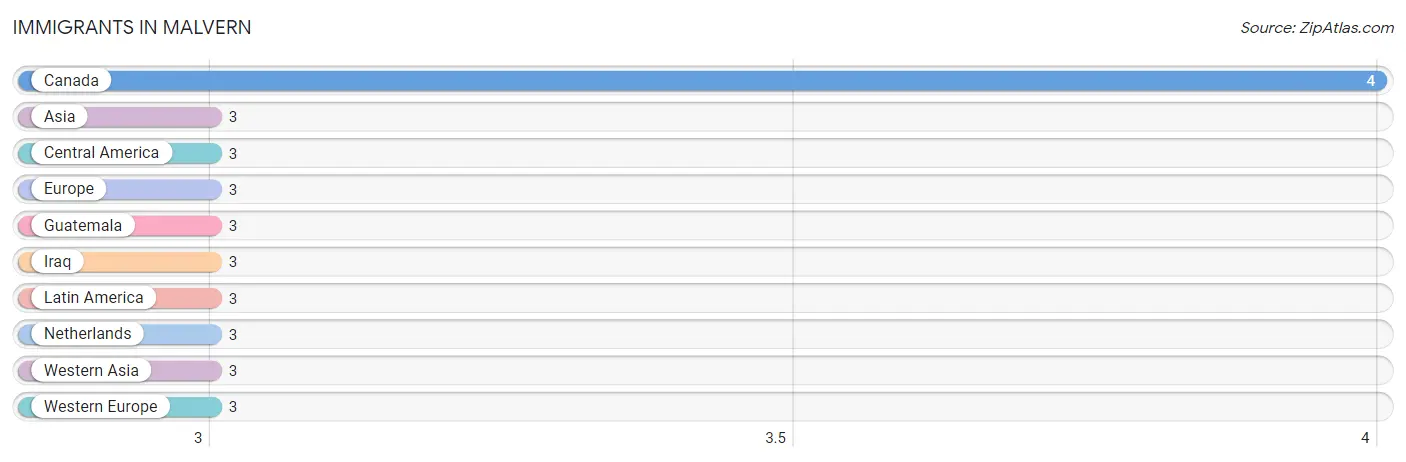
| Immigration Origin | # Population | % Population |
| Asia | 3 | 0.2% |
| Canada | 4 | 0.3% |
| Central America | 3 | 0.2% |
| Europe | 3 | 0.2% |
| Guatemala | 3 | 0.2% |
| Iraq | 3 | 0.2% |
| Latin America | 3 | 0.2% |
| Netherlands | 3 | 0.2% |
| Western Asia | 3 | 0.2% |
| Western Europe | 3 | 0.2% | View All 10 Rows |
Sex and Age in Malvern
Sex and Age in Malvern
The most populous age groups in Malvern are 15 to 19 Years (141 | 20.3%) for men and 55 to 59 Years (163 | 18.9%) for women.
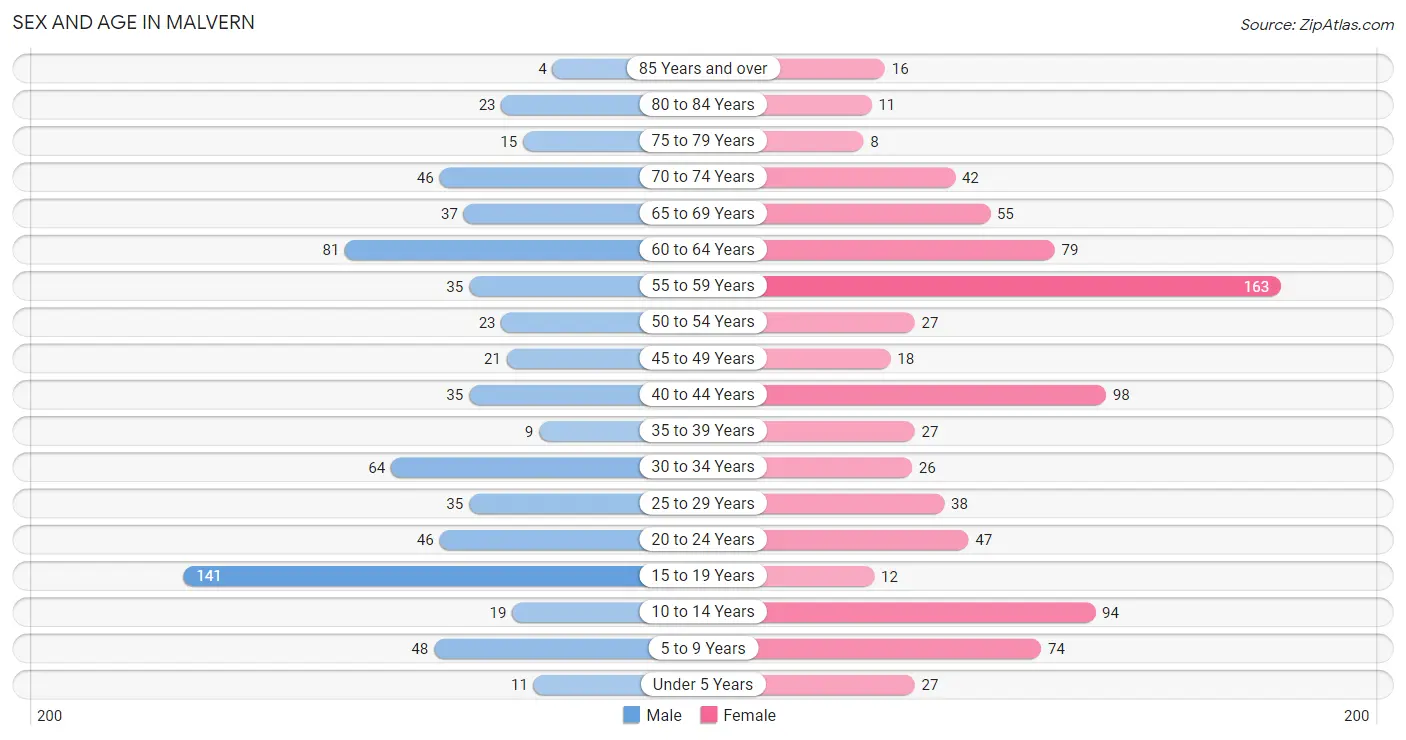
| Age Bracket | Male | Female |
| Under 5 Years | 11 (1.6%) | 27 (3.1%) |
| 5 to 9 Years | 48 (6.9%) | 74 (8.6%) |
| 10 to 14 Years | 19 (2.7%) | 94 (10.9%) |
| 15 to 19 Years | 141 (20.3%) | 12 (1.4%) |
| 20 to 24 Years | 46 (6.6%) | 47 (5.4%) |
| 25 to 29 Years | 35 (5.1%) | 38 (4.4%) |
| 30 to 34 Years | 64 (9.2%) | 26 (3.0%) |
| 35 to 39 Years | 9 (1.3%) | 27 (3.1%) |
| 40 to 44 Years | 35 (5.1%) | 98 (11.4%) |
| 45 to 49 Years | 21 (3.0%) | 18 (2.1%) |
| 50 to 54 Years | 23 (3.3%) | 27 (3.1%) |
| 55 to 59 Years | 35 (5.1%) | 163 (18.9%) |
| 60 to 64 Years | 81 (11.7%) | 79 (9.2%) |
| 65 to 69 Years | 37 (5.3%) | 55 (6.4%) |
| 70 to 74 Years | 46 (6.6%) | 42 (4.9%) |
| 75 to 79 Years | 15 (2.2%) | 8 (0.9%) |
| 80 to 84 Years | 23 (3.3%) | 11 (1.3%) |
| 85 Years and over | 4 (0.6%) | 16 (1.9%) |
| Total | 693 (100.0%) | 862 (100.0%) |
Families and Households in Malvern
Median Family Size in Malvern
The median family size in Malvern is 2.82 persons per family, with married-couple families (245 | 64.0%) accounting for the largest median family size of 2.92 persons per family. On the other hand, single male/father families (15 | 3.9%) represent the smallest median family size with 1.73 persons per family.
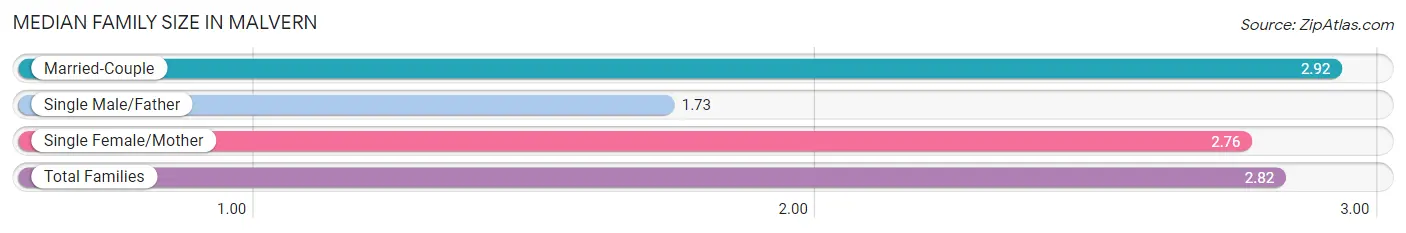
| Family Type | # Families | Family Size |
| Married-Couple | 245 (64.0%) | 2.92 |
| Single Male/Father | 15 (3.9%) | 1.73 |
| Single Female/Mother | 123 (32.1%) | 2.76 |
| Total Families | 383 (100.0%) | 2.82 |
Median Household Size in Malvern
The median household size in Malvern is 2.16 persons per household, with single female/mother households (123 | 17.2%) accounting for the largest median household size of 3.75 persons per household. non-family households (334 | 46.6%) represent the smallest median household size with 1.02 persons per household.
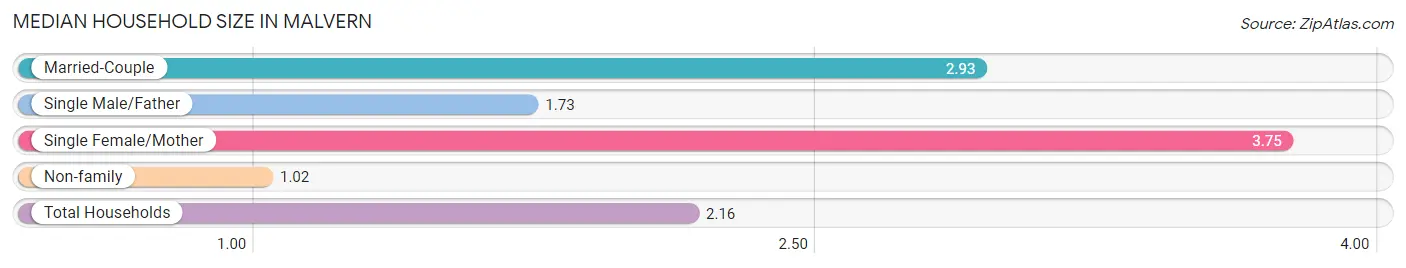
| Household Type | # Households | Household Size |
| Married-Couple | 245 (34.2%) | 2.93 |
| Single Male/Father | 15 (2.1%) | 1.73 |
| Single Female/Mother | 123 (17.2%) | 3.75 |
| Non-family | 334 (46.6%) | 1.02 |
| Total Households | 717 (100.0%) | 2.16 |
Household Size by Marriage Status in Malvern
Out of a total of 717 households in Malvern, 383 (53.4%) are family households, while 334 (46.6%) are nonfamily households. The most numerous type of family households are 2-person households, comprising 198, and the most common type of nonfamily households are 1-person households, comprising 328.
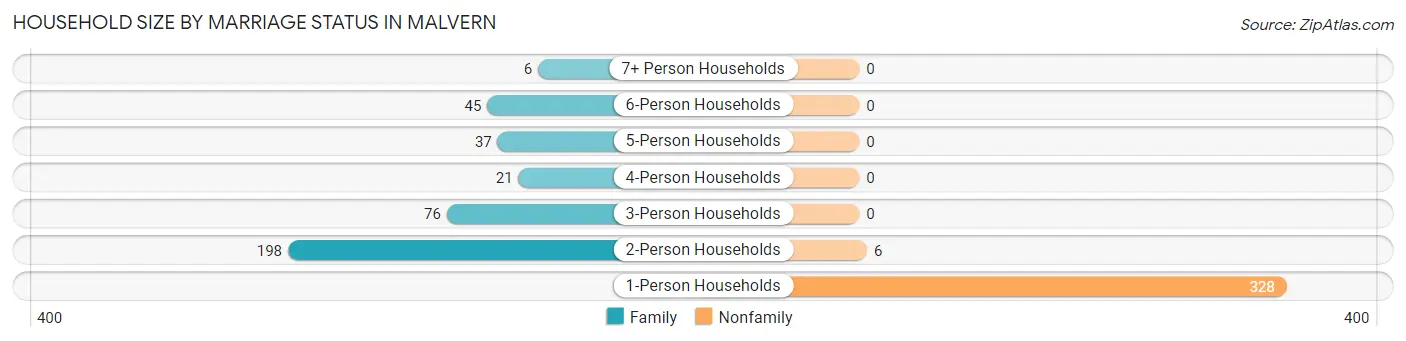
| Household Size | Family Households | Nonfamily Households |
| 1-Person Households | - | 328 (45.8%) |
| 2-Person Households | 198 (27.6%) | 6 (0.8%) |
| 3-Person Households | 76 (10.6%) | 0 (0.0%) |
| 4-Person Households | 21 (2.9%) | 0 (0.0%) |
| 5-Person Households | 37 (5.2%) | 0 (0.0%) |
| 6-Person Households | 45 (6.3%) | 0 (0.0%) |
| 7+ Person Households | 6 (0.8%) | 0 (0.0%) |
| Total | 383 (53.4%) | 334 (46.6%) |
Female Fertility in Malvern
Fertility by Age in Malvern
Average fertility rate in Malvern is 55.0 births per 1,000 women. Women in the age bracket of 20 to 34 years have the highest fertility rate with 144.0 births per 1,000 women. Women in the age bracket of 20 to 34 years acount for 100.0% of all women with births.
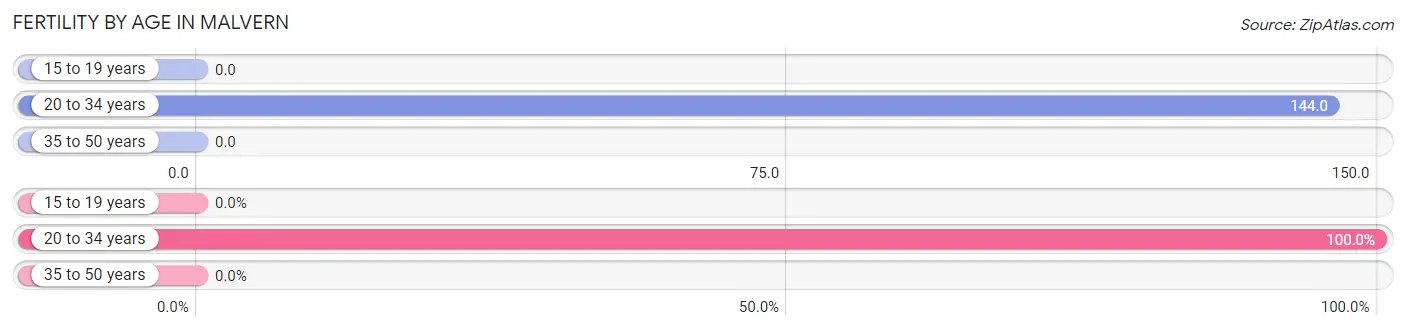
| Age Bracket | Women with Births | Births / 1,000 Women |
| 15 to 19 years | 0 (0.0%) | 0.0 |
| 20 to 34 years | 16 (100.0%) | 144.0 |
| 35 to 50 years | 0 (0.0%) | 0.0 |
| Total | 16 (100.0%) | 55.0 |
Fertility by Age by Marriage Status in Malvern
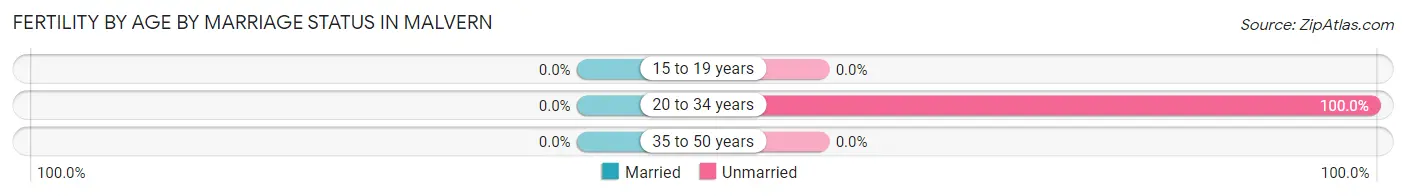
| Age Bracket | Married | Unmarried |
| 15 to 19 years | 0 (0.0%) | 0 (0.0%) |
| 20 to 34 years | 0 (0.0%) | 16 (100.0%) |
| 35 to 50 years | 0 (0.0%) | 0 (0.0%) |
| Total | 0 (0.0%) | 16 (100.0%) |
Fertility by Education in Malvern
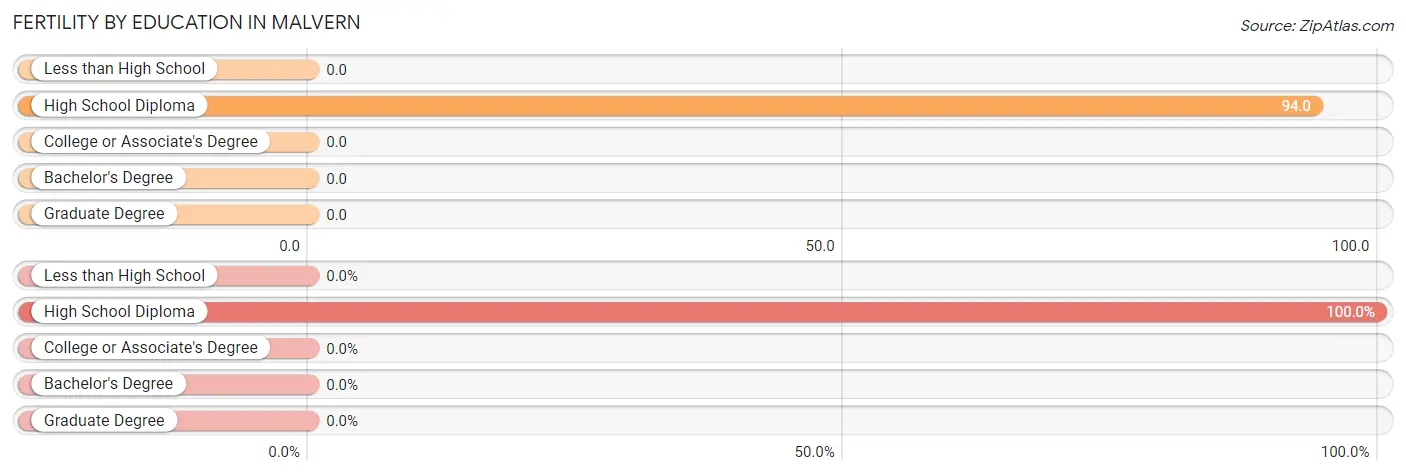
| Educational Attainment | Women with Births | Births / 1,000 Women |
| Less than High School | 0 (0.0%) | 0.0 |
| High School Diploma | 16 (100.0%) | 94.0 |
| College or Associate's Degree | 0 (0.0%) | 0.0 |
| Bachelor's Degree | 0 (0.0%) | 0.0 |
| Graduate Degree | 0 (0.0%) | 0.0 |
| Total | 16 (100.0%) | 55.0 |
Fertility by Education by Marriage Status in Malvern
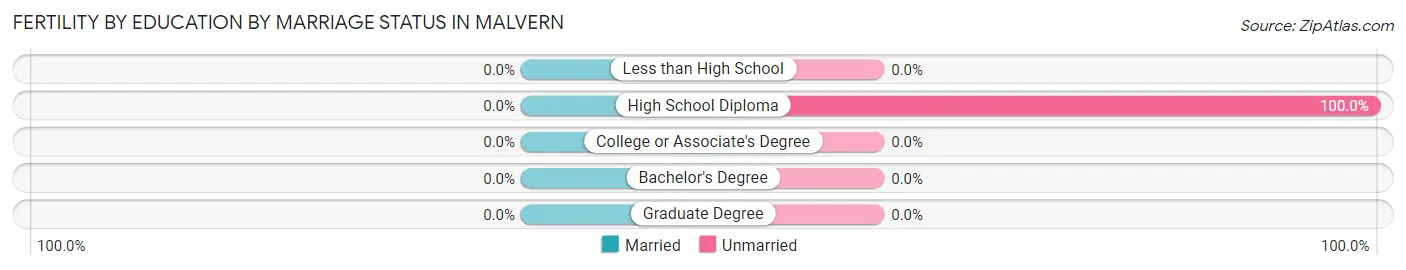
| Educational Attainment | Married | Unmarried |
| Less than High School | 0 (0.0%) | 0 (0.0%) |
| High School Diploma | 0 (0.0%) | 16 (100.0%) |
| College or Associate's Degree | 0 (0.0%) | 0 (0.0%) |
| Bachelor's Degree | 0 (0.0%) | 0 (0.0%) |
| Graduate Degree | 0 (0.0%) | 0 (0.0%) |
| Total | 0 (0.0%) | 16 (100.0%) |
Employment Characteristics in Malvern
Employment by Class of Employer in Malvern
Among the 701 employed individuals in Malvern, private company employees (527 | 75.2%), self-employed (not incorporated) (74 | 10.6%), and not-for-profit organizations (56 | 8.0%) make up the most common classes of employment.
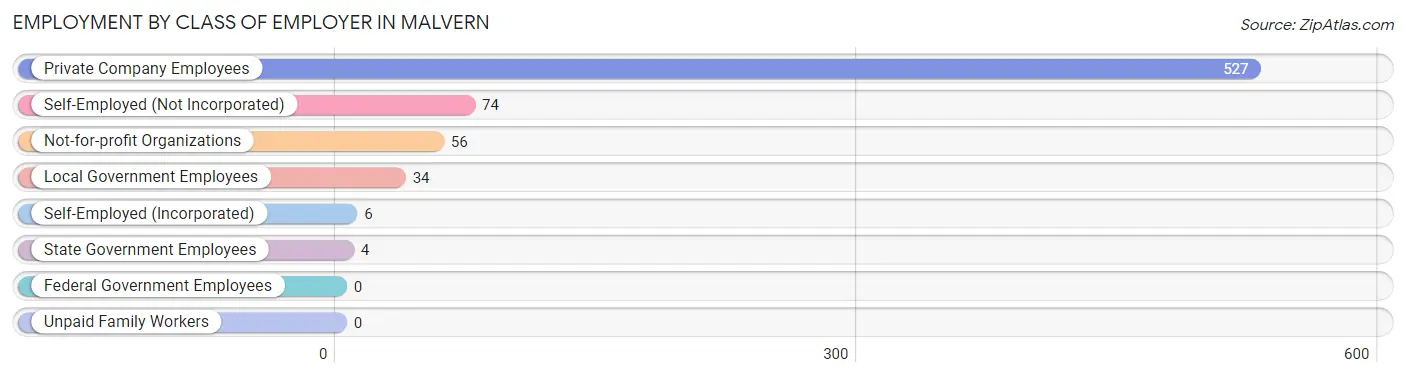
| Employer Class | # Employees | % Employees |
| Private Company Employees | 527 | 75.2% |
| Self-Employed (Incorporated) | 6 | 0.9% |
| Self-Employed (Not Incorporated) | 74 | 10.6% |
| Not-for-profit Organizations | 56 | 8.0% |
| Local Government Employees | 34 | 4.9% |
| State Government Employees | 4 | 0.6% |
| Federal Government Employees | 0 | 0.0% |
| Unpaid Family Workers | 0 | 0.0% |
| Total | 701 | 100.0% |
Employment Status by Age in Malvern
According to the labor force statistics for Malvern, out of the total population over 16 years of age (1,270), 58.3% or 740 individuals are in the labor force, with 1.3% or 10 of them unemployed. The age group with the highest labor force participation rate is 20 to 24 years, with 100.0% or 93 individuals in the labor force. Within the labor force, the 75 years and over age range has the highest percentage of unemployed individuals, with 100.0% or 3 of them being unemployed.
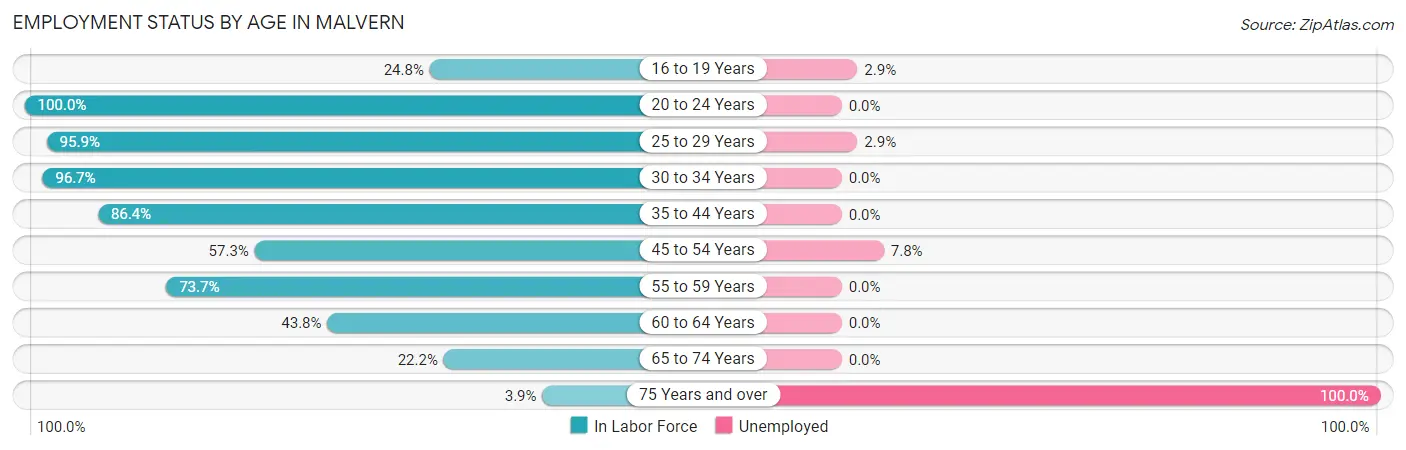
| Age Bracket | In Labor Force | Unemployed |
| 16 to 19 Years | 35 (24.8%) | 1 (2.9%) |
| 20 to 24 Years | 93 (100.0%) | 0 (0.0%) |
| 25 to 29 Years | 70 (95.9%) | 2 (2.9%) |
| 30 to 34 Years | 87 (96.7%) | 0 (0.0%) |
| 35 to 44 Years | 146 (86.4%) | 0 (0.0%) |
| 45 to 54 Years | 51 (57.3%) | 4 (7.8%) |
| 55 to 59 Years | 146 (73.7%) | 0 (0.0%) |
| 60 to 64 Years | 70 (43.8%) | 0 (0.0%) |
| 65 to 74 Years | 40 (22.2%) | 0 (0.0%) |
| 75 Years and over | 3 (3.9%) | 3 (100.0%) |
| Total | 740 (58.3%) | 10 (1.3%) |
Employment Status by Educational Attainment in Malvern
According to labor force statistics for Malvern, 73.2% of individuals (570) out of the total population between 25 and 64 years of age (779) are in the labor force, with 1.1% or 6 of them being unemployed. The group with the highest labor force participation rate are those with the educational attainment of college / associate degree, with 90.2% or 110 individuals in the labor force. Within the labor force, individuals with college / associate degree education have the highest percentage of unemployment, with 5.5% or 6 of them being unemployed.

| Educational Attainment | In Labor Force | Unemployed |
| Less than High School | 36 (47.4%) | 0 (0.0%) |
| High School Diploma | 336 (71.9%) | 0 (0.0%) |
| College / Associate Degree | 110 (90.2%) | 7 (5.5%) |
| Bachelor's Degree or higher | 88 (77.2%) | 0 (0.0%) |
| Total | 570 (73.2%) | 9 (1.1%) |
Employment Occupations by Sex in Malvern
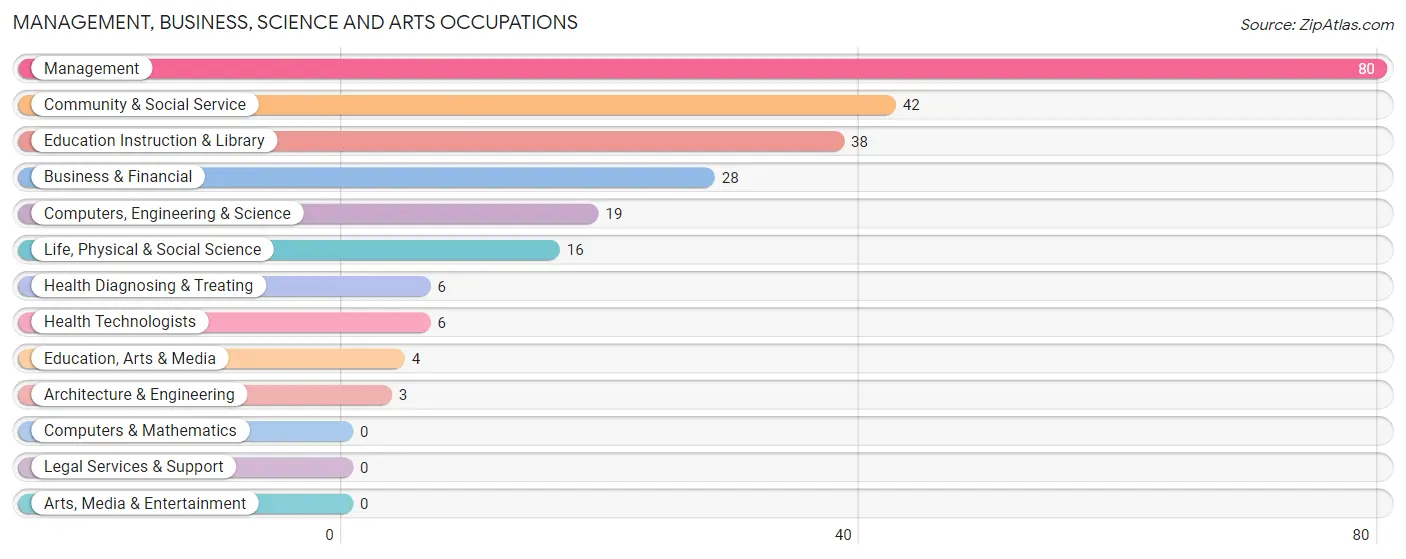
Management, Business, Science and Arts Occupations
The most common Management, Business, Science and Arts occupations in Malvern are Management (80 | 10.9%), Community & Social Service (42 | 5.8%), Education Instruction & Library (38 | 5.2%), Business & Financial (28 | 3.8%), and Computers, Engineering & Science (19 | 2.6%).
Management, Business, Science and Arts Occupations by Sex
Within the Management, Business, Science and Arts occupations in Malvern, the most male-oriented occupations are Architecture & Engineering (100.0%), Management (63.7%), and Education, Arts & Media (50.0%), while the most female-oriented occupations are Life, Physical & Social Science (100.0%), Education Instruction & Library (100.0%), and Health Diagnosing & Treating (100.0%).
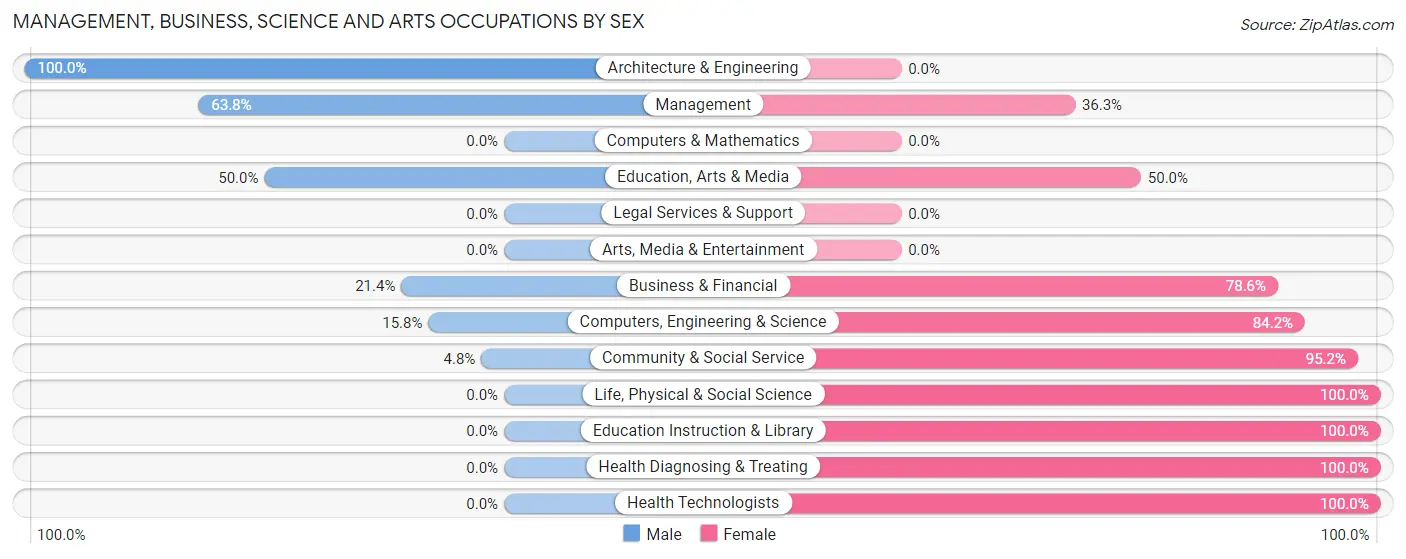
| Occupation | Male | Female |
| Management | 51 (63.7%) | 29 (36.2%) |
| Business & Financial | 6 (21.4%) | 22 (78.6%) |
| Computers, Engineering & Science | 3 (15.8%) | 16 (84.2%) |
| Computers & Mathematics | 0 (0.0%) | 0 (0.0%) |
| Architecture & Engineering | 3 (100.0%) | 0 (0.0%) |
| Life, Physical & Social Science | 0 (0.0%) | 16 (100.0%) |
| Community & Social Service | 2 (4.8%) | 40 (95.2%) |
| Education, Arts & Media | 2 (50.0%) | 2 (50.0%) |
| Legal Services & Support | 0 (0.0%) | 0 (0.0%) |
| Education Instruction & Library | 0 (0.0%) | 38 (100.0%) |
| Arts, Media & Entertainment | 0 (0.0%) | 0 (0.0%) |
| Health Diagnosing & Treating | 0 (0.0%) | 6 (100.0%) |
| Health Technologists | 0 (0.0%) | 6 (100.0%) |
| Total (Category) | 62 (35.4%) | 113 (64.6%) |
| Total (Overall) | 271 (37.1%) | 460 (62.9%) |
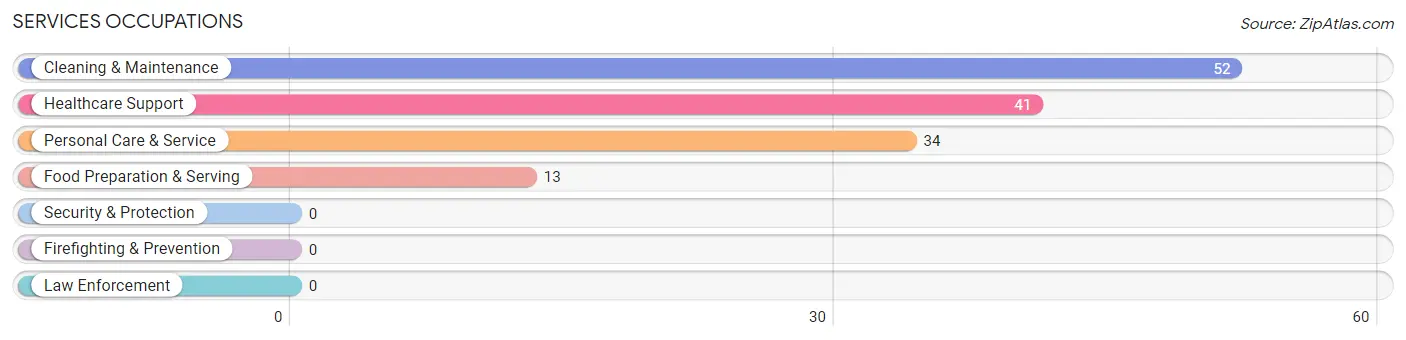
Services Occupations
The most common Services occupations in Malvern are Cleaning & Maintenance (52 | 7.1%), Healthcare Support (41 | 5.6%), Personal Care & Service (34 | 4.6%), and Food Preparation & Serving (13 | 1.8%).
Services Occupations by Sex
Within the Services occupations in Malvern, the most male-oriented occupations are Cleaning & Maintenance (63.5%), and Healthcare Support (43.9%), while the most female-oriented occupations are Food Preparation & Serving (100.0%), Personal Care & Service (100.0%), and Healthcare Support (56.1%).
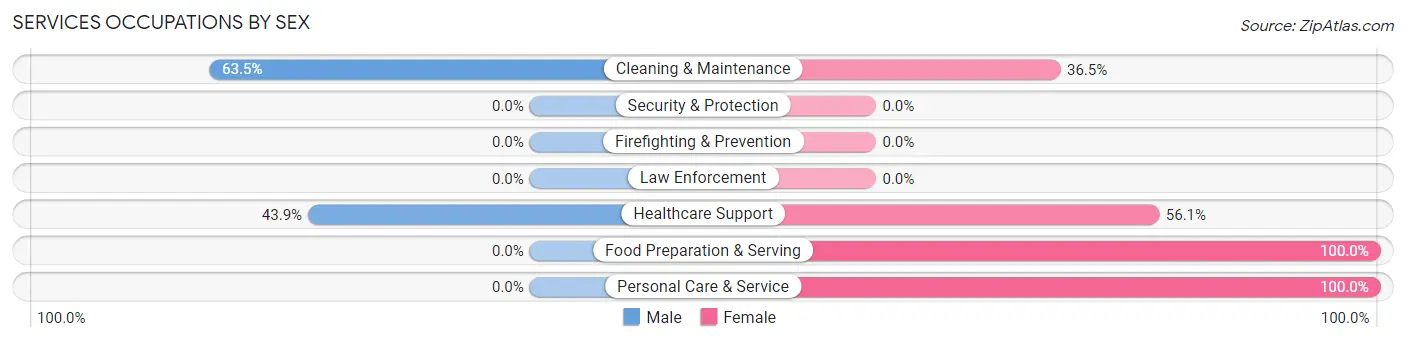
| Occupation | Male | Female |
| Healthcare Support | 18 (43.9%) | 23 (56.1%) |
| Security & Protection | 0 (0.0%) | 0 (0.0%) |
| Firefighting & Prevention | 0 (0.0%) | 0 (0.0%) |
| Law Enforcement | 0 (0.0%) | 0 (0.0%) |
| Food Preparation & Serving | 0 (0.0%) | 13 (100.0%) |
| Cleaning & Maintenance | 33 (63.5%) | 19 (36.5%) |
| Personal Care & Service | 0 (0.0%) | 34 (100.0%) |
| Total (Category) | 51 (36.4%) | 89 (63.6%) |
| Total (Overall) | 271 (37.1%) | 460 (62.9%) |
Sales and Office Occupations
The most common Sales and Office occupations in Malvern are Sales & Related (77 | 10.5%), and Office & Administration (63 | 8.6%).

Sales and Office Occupations by Sex

| Occupation | Male | Female |
| Sales & Related | 27 (35.1%) | 50 (64.9%) |
| Office & Administration | 15 (23.8%) | 48 (76.2%) |
| Total (Category) | 42 (30.0%) | 98 (70.0%) |
| Total (Overall) | 271 (37.1%) | 460 (62.9%) |
Natural Resources, Construction and Maintenance Occupations
The most common Natural Resources, Construction and Maintenance occupations in Malvern are Installation, Maintenance & Repair (31 | 4.2%), and Construction & Extraction (11 | 1.5%).

Natural Resources, Construction and Maintenance Occupations by Sex

| Occupation | Male | Female |
| Farming, Fishing & Forestry | 0 (0.0%) | 0 (0.0%) |
| Construction & Extraction | 11 (100.0%) | 0 (0.0%) |
| Installation, Maintenance & Repair | 31 (100.0%) | 0 (0.0%) |
| Total (Category) | 42 (100.0%) | 0 (0.0%) |
| Total (Overall) | 271 (37.1%) | 460 (62.9%) |
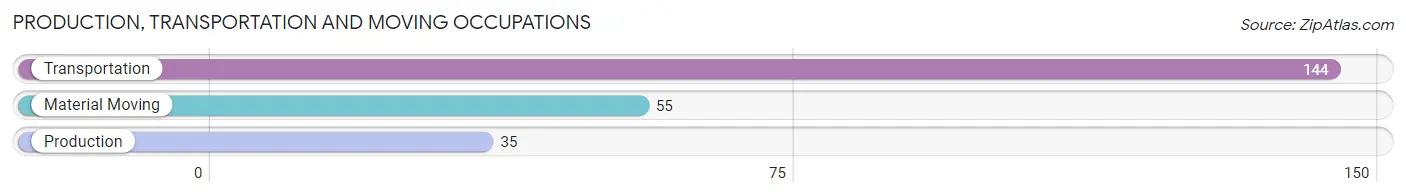
Production, Transportation and Moving Occupations
The most common Production, Transportation and Moving occupations in Malvern are Transportation (144 | 19.7%), Material Moving (55 | 7.5%), and Production (35 | 4.8%).
Production, Transportation and Moving Occupations by Sex

| Occupation | Male | Female |
| Production | 26 (74.3%) | 9 (25.7%) |
| Transportation | 21 (14.6%) | 123 (85.4%) |
| Material Moving | 27 (49.1%) | 28 (50.9%) |
| Total (Category) | 74 (31.6%) | 160 (68.4%) |
| Total (Overall) | 271 (37.1%) | 460 (62.9%) |
Employment Industries by Sex in Malvern
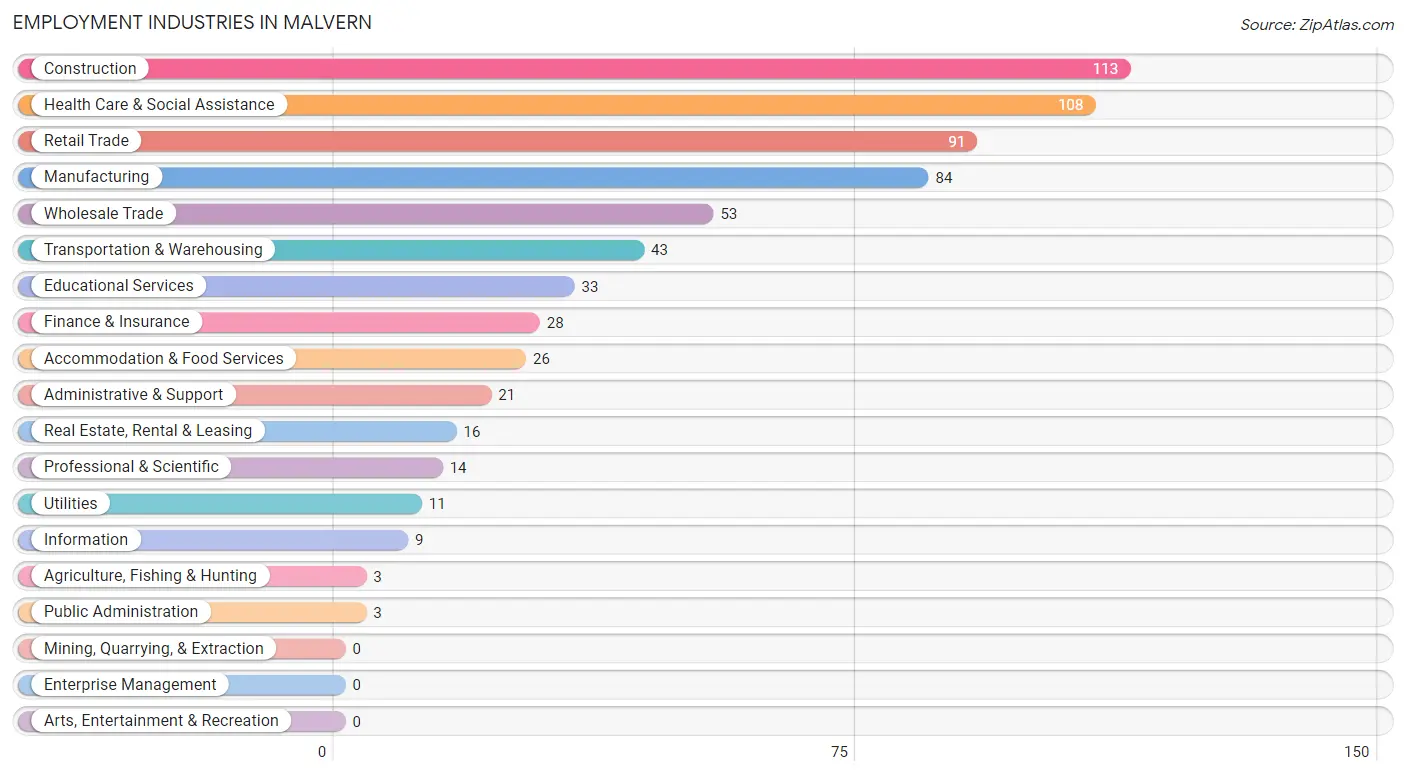
Employment Industries in Malvern
The major employment industries in Malvern include Construction (113 | 15.5%), Health Care & Social Assistance (108 | 14.8%), Retail Trade (91 | 12.4%), Manufacturing (84 | 11.5%), and Wholesale Trade (53 | 7.2%).
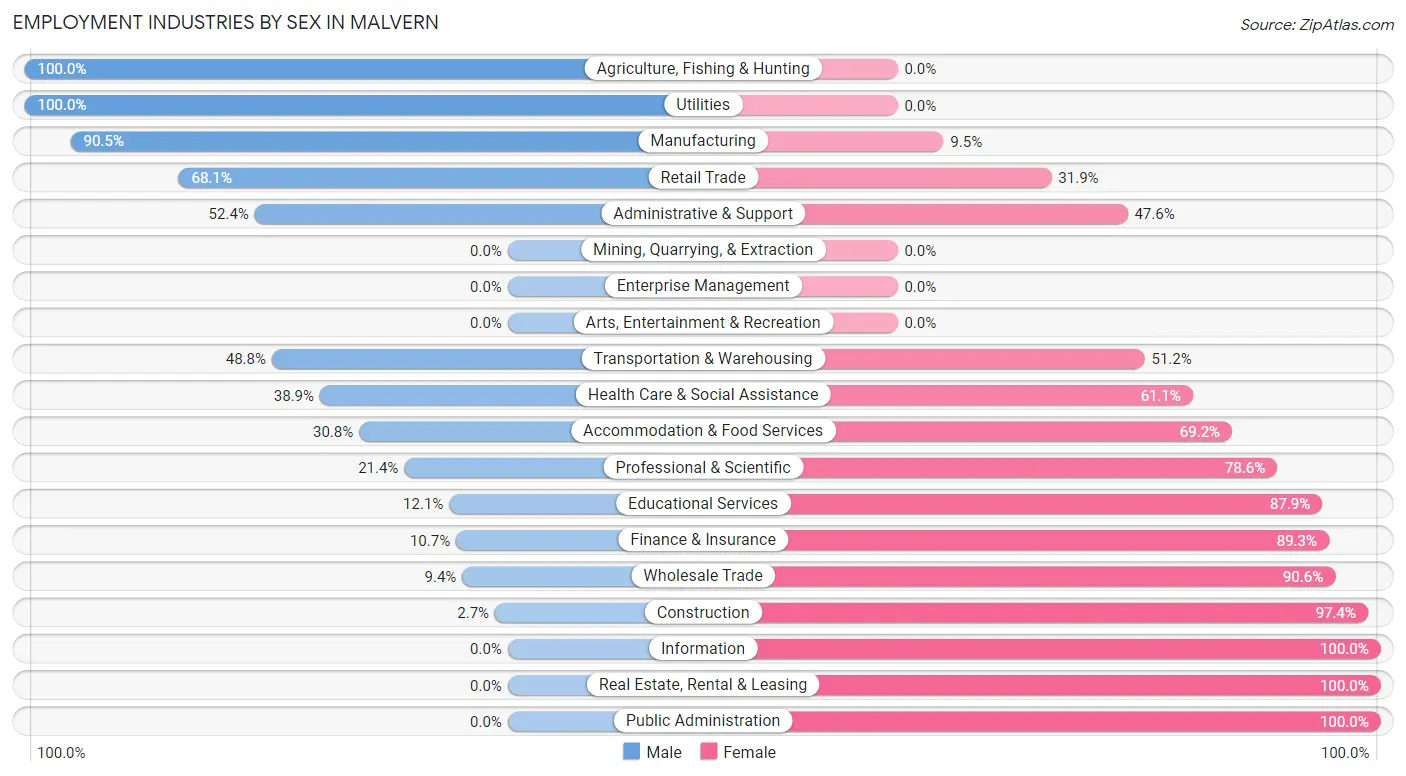
Employment Industries by Sex in Malvern
The Malvern industries that see more men than women are Agriculture, Fishing & Hunting (100.0%), Utilities (100.0%), and Manufacturing (90.5%), whereas the industries that tend to have a higher number of women are Information (100.0%), Real Estate, Rental & Leasing (100.0%), and Public Administration (100.0%).
| Industry | Male | Female |
| Agriculture, Fishing & Hunting | 3 (100.0%) | 0 (0.0%) |
| Mining, Quarrying, & Extraction | 0 (0.0%) | 0 (0.0%) |
| Construction | 3 (2.6%) | 110 (97.4%) |
| Manufacturing | 76 (90.5%) | 8 (9.5%) |
| Wholesale Trade | 5 (9.4%) | 48 (90.6%) |
| Retail Trade | 62 (68.1%) | 29 (31.9%) |
| Transportation & Warehousing | 21 (48.8%) | 22 (51.2%) |
| Utilities | 11 (100.0%) | 0 (0.0%) |
| Information | 0 (0.0%) | 9 (100.0%) |
| Finance & Insurance | 3 (10.7%) | 25 (89.3%) |
| Real Estate, Rental & Leasing | 0 (0.0%) | 16 (100.0%) |
| Professional & Scientific | 3 (21.4%) | 11 (78.6%) |
| Enterprise Management | 0 (0.0%) | 0 (0.0%) |
| Administrative & Support | 11 (52.4%) | 10 (47.6%) |
| Educational Services | 4 (12.1%) | 29 (87.9%) |
| Health Care & Social Assistance | 42 (38.9%) | 66 (61.1%) |
| Arts, Entertainment & Recreation | 0 (0.0%) | 0 (0.0%) |
| Accommodation & Food Services | 8 (30.8%) | 18 (69.2%) |
| Public Administration | 0 (0.0%) | 3 (100.0%) |
| Total | 271 (37.1%) | 460 (62.9%) |
Education in Malvern
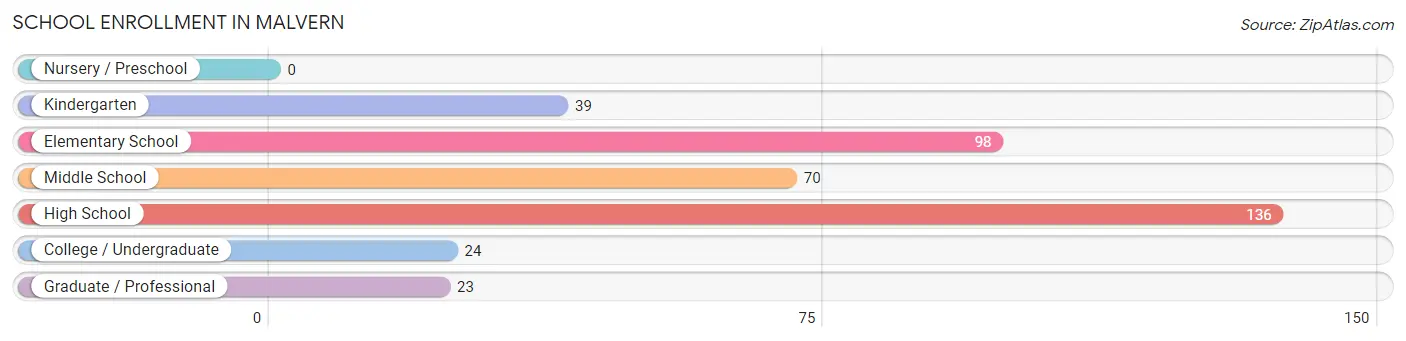
School Enrollment in Malvern
The most common levels of schooling among the 390 students in Malvern are high school (136 | 34.9%), elementary school (98 | 25.1%), and middle school (70 | 17.9%).
| School Level | # Students | % Students |
| Nursery / Preschool | 0 | 0.0% |
| Kindergarten | 39 | 10.0% |
| Elementary School | 98 | 25.1% |
| Middle School | 70 | 17.9% |
| High School | 136 | 34.9% |
| College / Undergraduate | 24 | 6.1% |
| Graduate / Professional | 23 | 5.9% |
| Total | 390 | 100.0% |
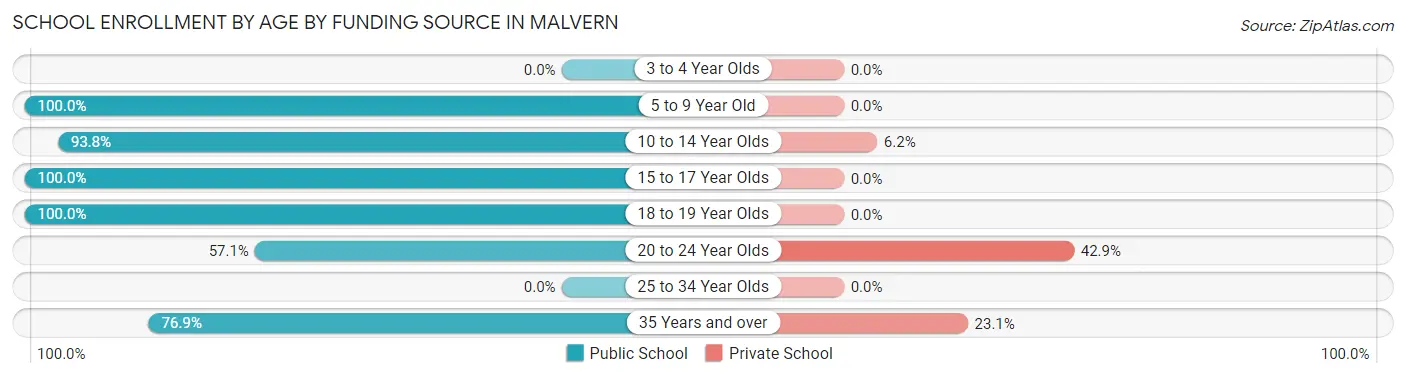
School Enrollment by Age by Funding Source in Malvern
Out of a total of 390 students who are enrolled in schools in Malvern, 22 (5.6%) attend a private institution, while the remaining 368 (94.4%) are enrolled in public schools. The age group of 20 to 24 year olds has the highest likelihood of being enrolled in private schools, with 9 (42.9% in the age bracket) enrolled. Conversely, the age group of 5 to 9 year old has the lowest likelihood of being enrolled in a private school, with 94 (100.0% in the age bracket) attending a public institution.
| Age Bracket | Public School | Private School |
| 3 to 4 Year Olds | 0 (0.0%) | 0 (0.0%) |
| 5 to 9 Year Old | 94 (100.0%) | 0 (0.0%) |
| 10 to 14 Year Olds | 106 (93.8%) | 7 (6.2%) |
| 15 to 17 Year Olds | 126 (100.0%) | 0 (0.0%) |
| 18 to 19 Year Olds | 10 (100.0%) | 0 (0.0%) |
| 20 to 24 Year Olds | 12 (57.1%) | 9 (42.9%) |
| 25 to 34 Year Olds | 0 (0.0%) | 0 (0.0%) |
| 35 Years and over | 20 (76.9%) | 6 (23.1%) |
| Total | 368 (94.4%) | 22 (5.6%) |
Educational Attainment by Field of Study in Malvern
Psychology (46 | 32.2%), education (38 | 26.6%), science & technology (20 | 14.0%), business (9 | 6.3%), and bio, nature & agricultural (7 | 4.9%) are the most common fields of study among 143 individuals in Malvern who have obtained a bachelor's degree or higher.
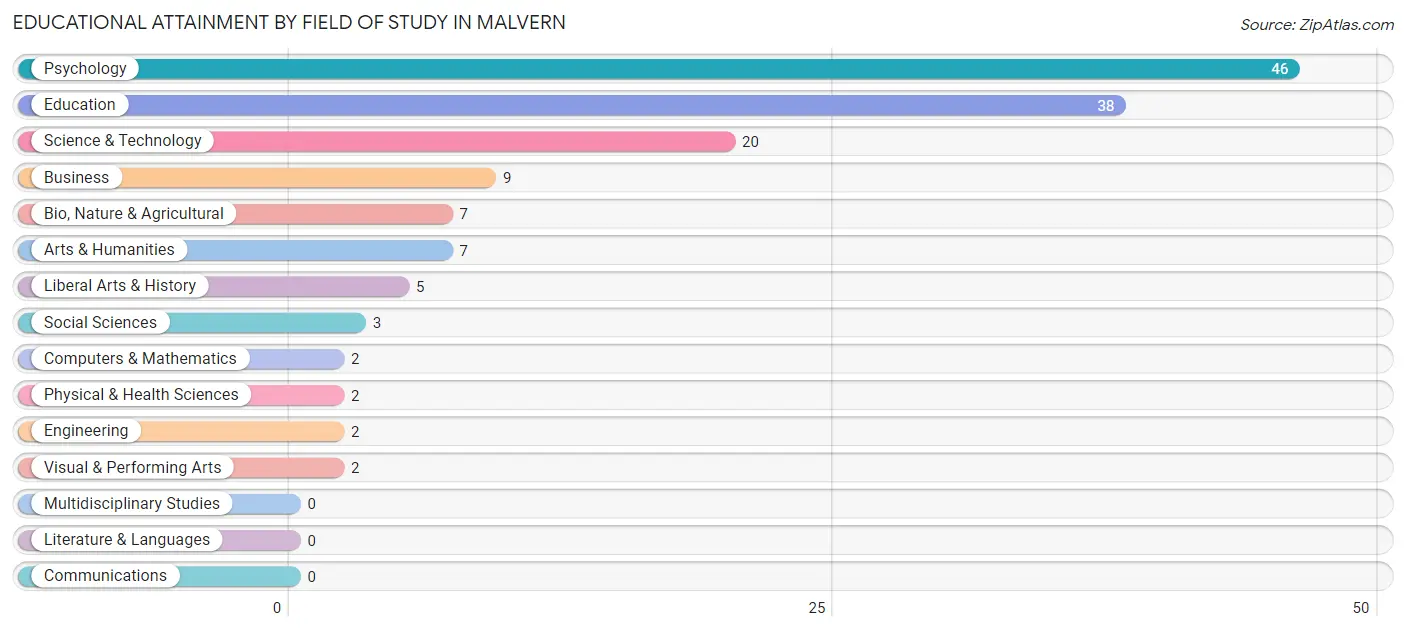
| Field of Study | # Graduates | % Graduates |
| Computers & Mathematics | 2 | 1.4% |
| Bio, Nature & Agricultural | 7 | 4.9% |
| Physical & Health Sciences | 2 | 1.4% |
| Psychology | 46 | 32.2% |
| Social Sciences | 3 | 2.1% |
| Engineering | 2 | 1.4% |
| Multidisciplinary Studies | 0 | 0.0% |
| Science & Technology | 20 | 14.0% |
| Business | 9 | 6.3% |
| Education | 38 | 26.6% |
| Literature & Languages | 0 | 0.0% |
| Liberal Arts & History | 5 | 3.5% |
| Visual & Performing Arts | 2 | 1.4% |
| Communications | 0 | 0.0% |
| Arts & Humanities | 7 | 4.9% |
| Total | 143 | 100.0% |
Transportation & Commute in Malvern
Vehicle Availability by Sex in Malvern
The most prevalent vehicle ownership categories in Malvern are males with 2 vehicles (89, accounting for 34.2%) and females with 2 vehicles (61, making up 20.2%).
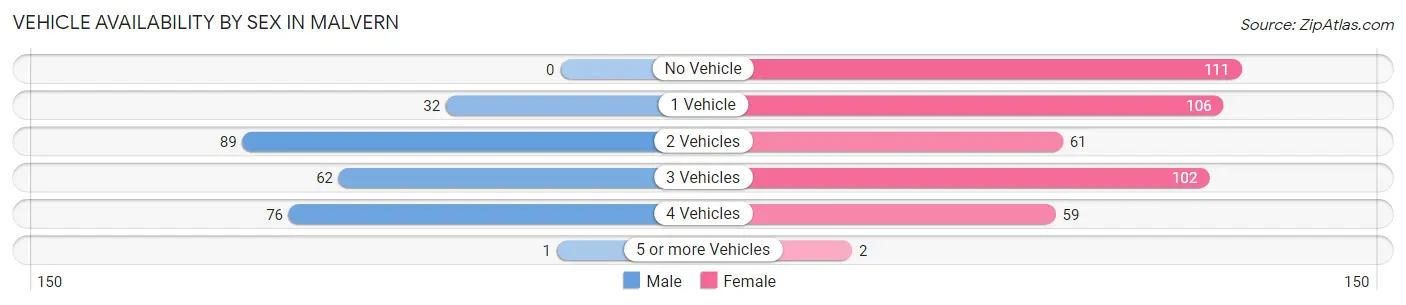
| Vehicles Available | Male | Female |
| No Vehicle | 0 (0.0%) | 111 (25.2%) |
| 1 Vehicle | 32 (12.3%) | 106 (24.0%) |
| 2 Vehicles | 89 (34.2%) | 61 (13.8%) |
| 3 Vehicles | 62 (23.8%) | 102 (23.1%) |
| 4 Vehicles | 76 (29.2%) | 59 (13.4%) |
| 5 or more Vehicles | 1 (0.4%) | 2 (0.4%) |
| Total | 260 (100.0%) | 441 (100.0%) |
Commute Time in Malvern
The most frequently occuring commute durations in Malvern are 60 to 89 minutes (122 commuters, 19.7%), 15 to 19 minutes (121 commuters, 19.5%), and 10 to 14 minutes (80 commuters, 12.9%).
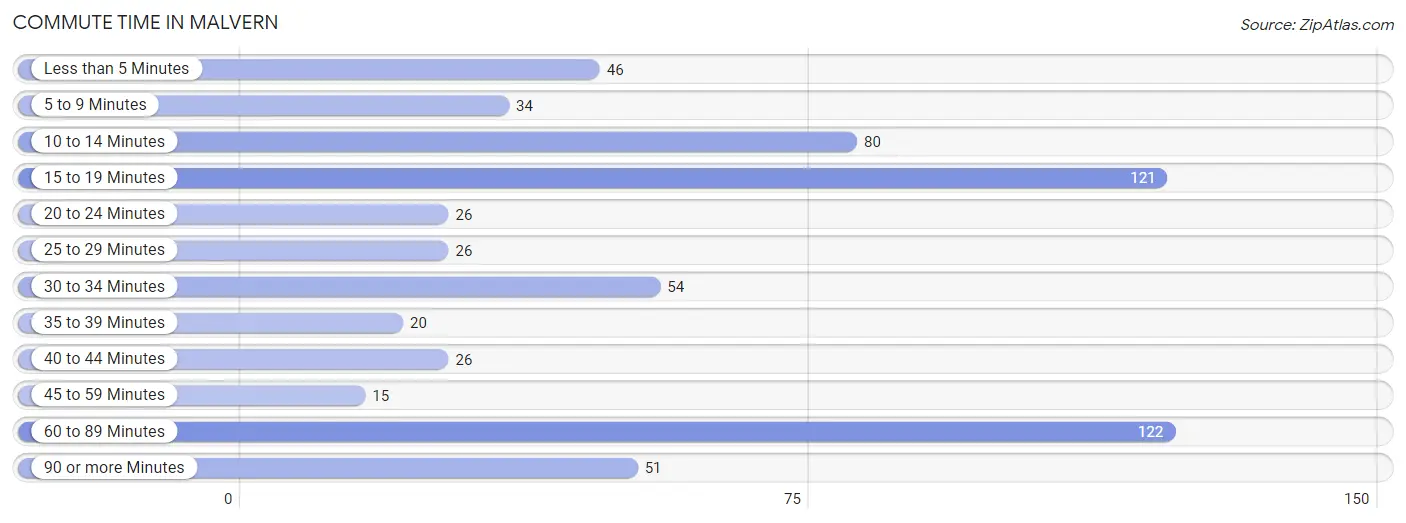
| Commute Time | # Commuters | % Commuters |
| Less than 5 Minutes | 46 | 7.4% |
| 5 to 9 Minutes | 34 | 5.5% |
| 10 to 14 Minutes | 80 | 12.9% |
| 15 to 19 Minutes | 121 | 19.5% |
| 20 to 24 Minutes | 26 | 4.2% |
| 25 to 29 Minutes | 26 | 4.2% |
| 30 to 34 Minutes | 54 | 8.7% |
| 35 to 39 Minutes | 20 | 3.2% |
| 40 to 44 Minutes | 26 | 4.2% |
| 45 to 59 Minutes | 15 | 2.4% |
| 60 to 89 Minutes | 122 | 19.7% |
| 90 or more Minutes | 51 | 8.2% |
Commute Time by Sex in Malvern
The most common commute times in Malvern are 10 to 14 minutes (70 commuters, 27.9%) for males and 60 to 89 minutes (116 commuters, 31.4%) for females.
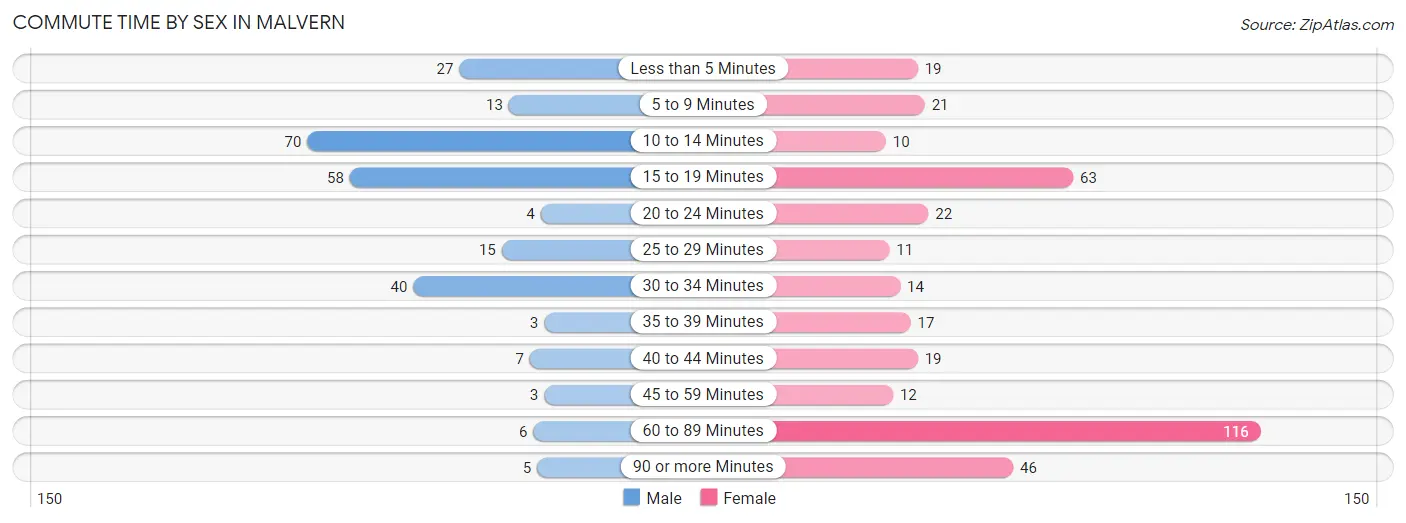
| Commute Time | Male | Female |
| Less than 5 Minutes | 27 (10.8%) | 19 (5.1%) |
| 5 to 9 Minutes | 13 (5.2%) | 21 (5.7%) |
| 10 to 14 Minutes | 70 (27.9%) | 10 (2.7%) |
| 15 to 19 Minutes | 58 (23.1%) | 63 (17.0%) |
| 20 to 24 Minutes | 4 (1.6%) | 22 (5.9%) |
| 25 to 29 Minutes | 15 (6.0%) | 11 (3.0%) |
| 30 to 34 Minutes | 40 (15.9%) | 14 (3.8%) |
| 35 to 39 Minutes | 3 (1.2%) | 17 (4.6%) |
| 40 to 44 Minutes | 7 (2.8%) | 19 (5.1%) |
| 45 to 59 Minutes | 3 (1.2%) | 12 (3.2%) |
| 60 to 89 Minutes | 6 (2.4%) | 116 (31.4%) |
| 90 or more Minutes | 5 (2.0%) | 46 (12.4%) |
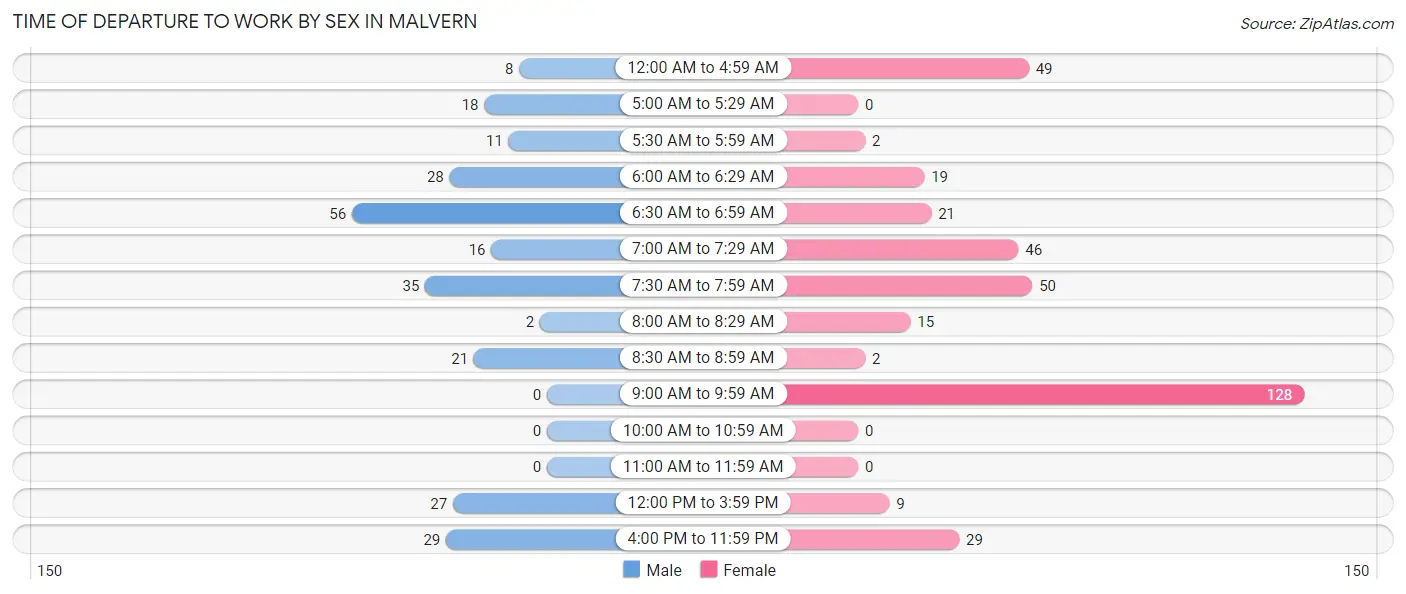
Time of Departure to Work by Sex in Malvern
The most frequent times of departure to work in Malvern are 6:30 AM to 6:59 AM (56, 22.3%) for males and 9:00 AM to 9:59 AM (128, 34.6%) for females.
| Time of Departure | Male | Female |
| 12:00 AM to 4:59 AM | 8 (3.2%) | 49 (13.2%) |
| 5:00 AM to 5:29 AM | 18 (7.2%) | 0 (0.0%) |
| 5:30 AM to 5:59 AM | 11 (4.4%) | 2 (0.5%) |
| 6:00 AM to 6:29 AM | 28 (11.2%) | 19 (5.1%) |
| 6:30 AM to 6:59 AM | 56 (22.3%) | 21 (5.7%) |
| 7:00 AM to 7:29 AM | 16 (6.4%) | 46 (12.4%) |
| 7:30 AM to 7:59 AM | 35 (13.9%) | 50 (13.5%) |
| 8:00 AM to 8:29 AM | 2 (0.8%) | 15 (4.1%) |
| 8:30 AM to 8:59 AM | 21 (8.4%) | 2 (0.5%) |
| 9:00 AM to 9:59 AM | 0 (0.0%) | 128 (34.6%) |
| 10:00 AM to 10:59 AM | 0 (0.0%) | 0 (0.0%) |
| 11:00 AM to 11:59 AM | 0 (0.0%) | 0 (0.0%) |
| 12:00 PM to 3:59 PM | 27 (10.8%) | 9 (2.4%) |
| 4:00 PM to 11:59 PM | 29 (11.6%) | 29 (7.8%) |
| Total | 251 (100.0%) | 370 (100.0%) |
Housing Occupancy in Malvern
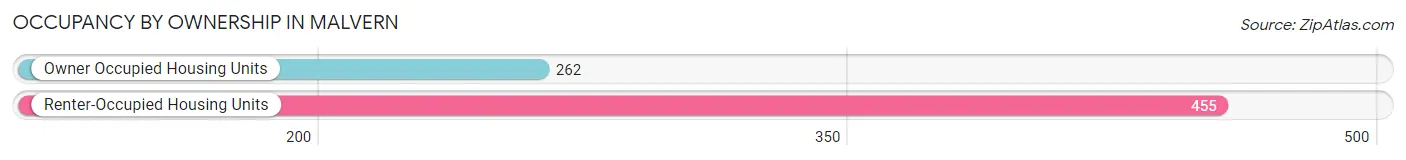
Occupancy by Ownership in Malvern
Of the total 717 dwellings in Malvern, owner-occupied units account for 262 (36.5%), while renter-occupied units make up 455 (63.5%).
| Occupancy | # Housing Units | % Housing Units |
| Owner Occupied Housing Units | 262 | 36.5% |
| Renter-Occupied Housing Units | 455 | 63.5% |
| Total Occupied Housing Units | 717 | 100.0% |
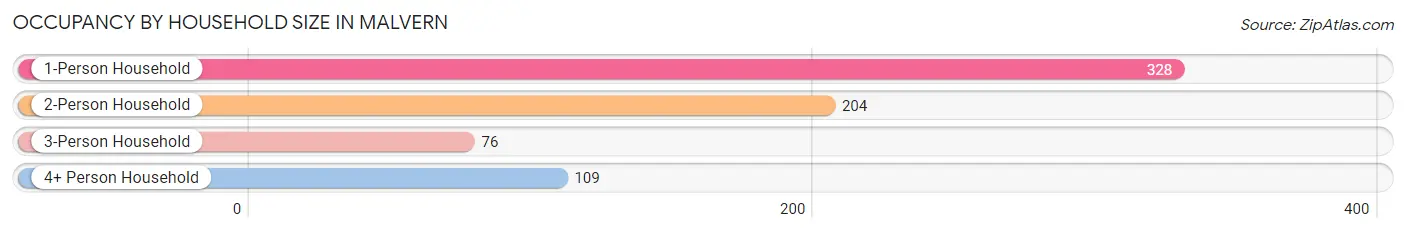
Occupancy by Household Size in Malvern
| Household Size | # Housing Units | % Housing Units |
| 1-Person Household | 328 | 45.8% |
| 2-Person Household | 204 | 28.4% |
| 3-Person Household | 76 | 10.6% |
| 4+ Person Household | 109 | 15.2% |
| Total Housing Units | 717 | 100.0% |
Occupancy by Ownership by Household Size in Malvern
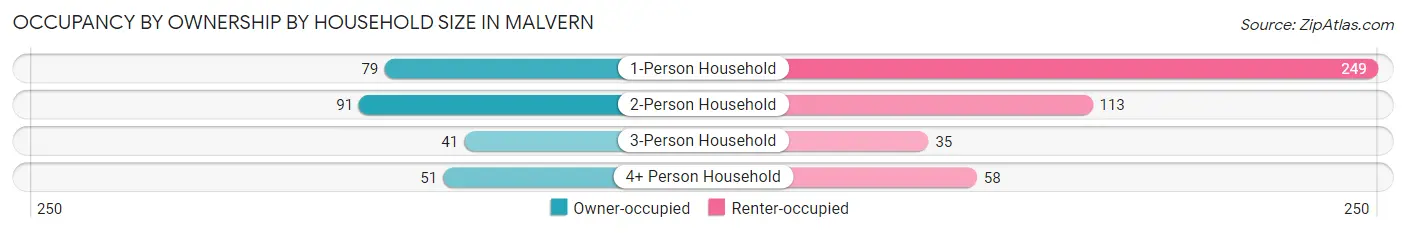
| Household Size | Owner-occupied | Renter-occupied |
| 1-Person Household | 79 (24.1%) | 249 (75.9%) |
| 2-Person Household | 91 (44.6%) | 113 (55.4%) |
| 3-Person Household | 41 (53.9%) | 35 (46.1%) |
| 4+ Person Household | 51 (46.8%) | 58 (53.2%) |
| Total Housing Units | 262 (36.5%) | 455 (63.5%) |
Occupancy by Educational Attainment in Malvern
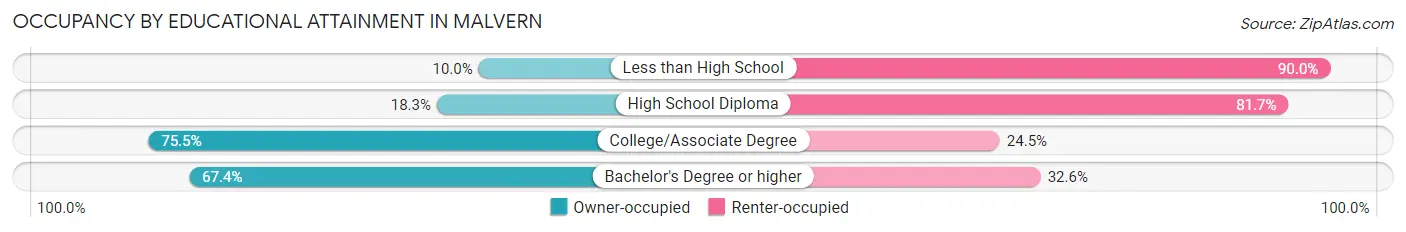
| Household Size | Owner-occupied | Renter-occupied |
| Less than High School | 8 (10.0%) | 72 (90.0%) |
| High School Diploma | 70 (18.3%) | 313 (81.7%) |
| College/Associate Degree | 120 (75.5%) | 39 (24.5%) |
| Bachelor's Degree or higher | 64 (67.4%) | 31 (32.6%) |
Occupancy by Age of Householder in Malvern
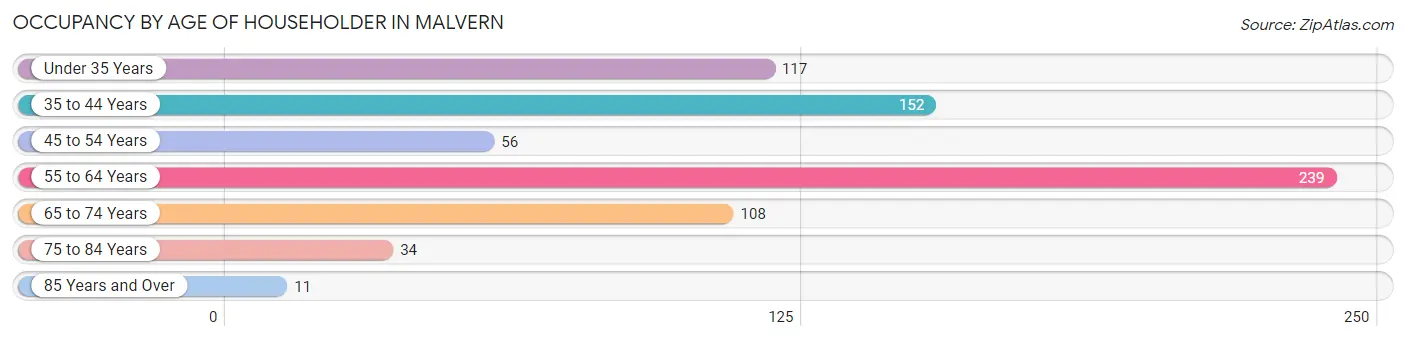
| Age Bracket | # Households | % Households |
| Under 35 Years | 117 | 16.3% |
| 35 to 44 Years | 152 | 21.2% |
| 45 to 54 Years | 56 | 7.8% |
| 55 to 64 Years | 239 | 33.3% |
| 65 to 74 Years | 108 | 15.1% |
| 75 to 84 Years | 34 | 4.7% |
| 85 Years and Over | 11 | 1.5% |
| Total | 717 | 100.0% |
Housing Finances in Malvern
Median Income by Occupancy in Malvern
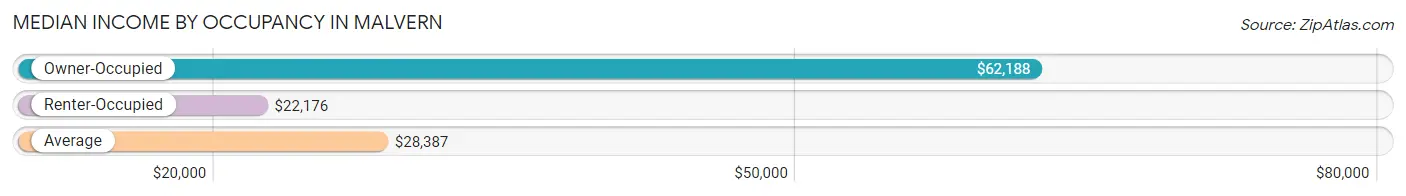
| Occupancy Type | # Households | Median Income |
| Owner-Occupied | 262 (36.5%) | $62,188 |
| Renter-Occupied | 455 (63.5%) | $22,176 |
| Average | 717 (100.0%) | $28,387 |
Occupancy by Householder Income Bracket in Malvern
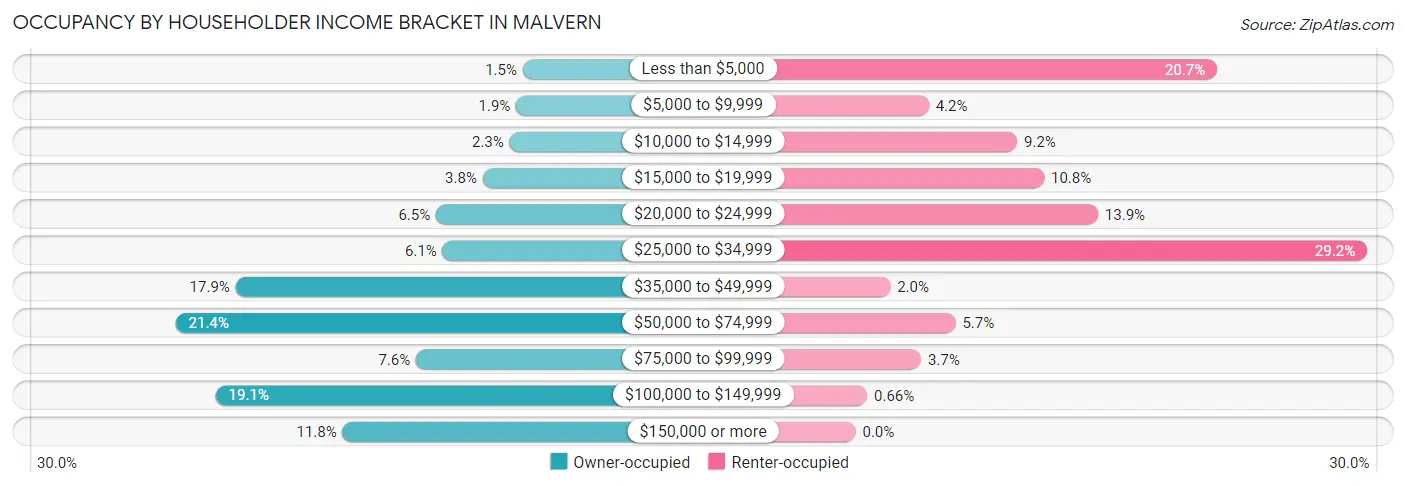
| Income Bracket | Owner-occupied | Renter-occupied |
| Less than $5,000 | 4 (1.5%) | 94 (20.7%) |
| $5,000 to $9,999 | 5 (1.9%) | 19 (4.2%) |
| $10,000 to $14,999 | 6 (2.3%) | 42 (9.2%) |
| $15,000 to $19,999 | 10 (3.8%) | 49 (10.8%) |
| $20,000 to $24,999 | 17 (6.5%) | 63 (13.9%) |
| $25,000 to $34,999 | 16 (6.1%) | 133 (29.2%) |
| $35,000 to $49,999 | 47 (17.9%) | 9 (2.0%) |
| $50,000 to $74,999 | 56 (21.4%) | 26 (5.7%) |
| $75,000 to $99,999 | 20 (7.6%) | 17 (3.7%) |
| $100,000 to $149,999 | 50 (19.1%) | 3 (0.7%) |
| $150,000 or more | 31 (11.8%) | 0 (0.0%) |
| Total | 262 (100.0%) | 455 (100.0%) |
Monthly Housing Cost Tiers in Malvern
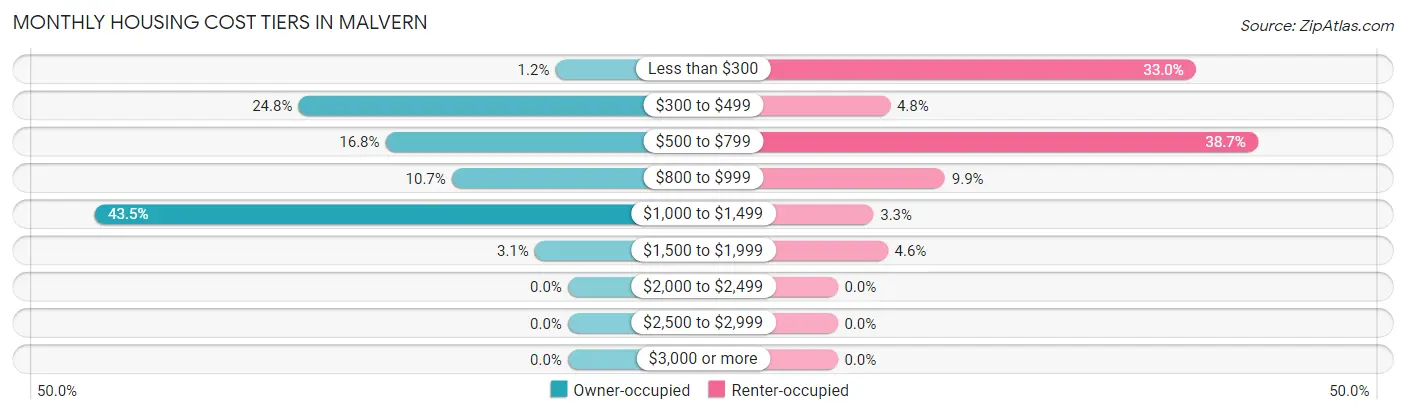
| Monthly Cost | Owner-occupied | Renter-occupied |
| Less than $300 | 3 (1.1%) | 150 (33.0%) |
| $300 to $499 | 65 (24.8%) | 22 (4.8%) |
| $500 to $799 | 44 (16.8%) | 176 (38.7%) |
| $800 to $999 | 28 (10.7%) | 45 (9.9%) |
| $1,000 to $1,499 | 114 (43.5%) | 15 (3.3%) |
| $1,500 to $1,999 | 8 (3.0%) | 21 (4.6%) |
| $2,000 to $2,499 | 0 (0.0%) | 0 (0.0%) |
| $2,500 to $2,999 | 0 (0.0%) | 0 (0.0%) |
| $3,000 or more | 0 (0.0%) | 0 (0.0%) |
| Total | 262 (100.0%) | 455 (100.0%) |
Physical Housing Characteristics in Malvern
Housing Structures in Malvern
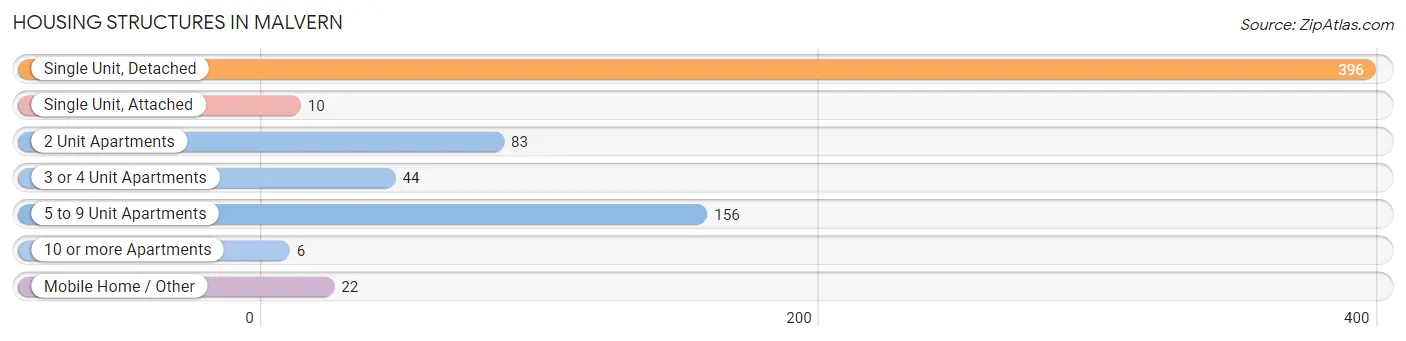
| Structure Type | # Housing Units | % Housing Units |
| Single Unit, Detached | 396 | 55.2% |
| Single Unit, Attached | 10 | 1.4% |
| 2 Unit Apartments | 83 | 11.6% |
| 3 or 4 Unit Apartments | 44 | 6.1% |
| 5 to 9 Unit Apartments | 156 | 21.8% |
| 10 or more Apartments | 6 | 0.8% |
| Mobile Home / Other | 22 | 3.1% |
| Total | 717 | 100.0% |
Housing Structures by Occupancy in Malvern
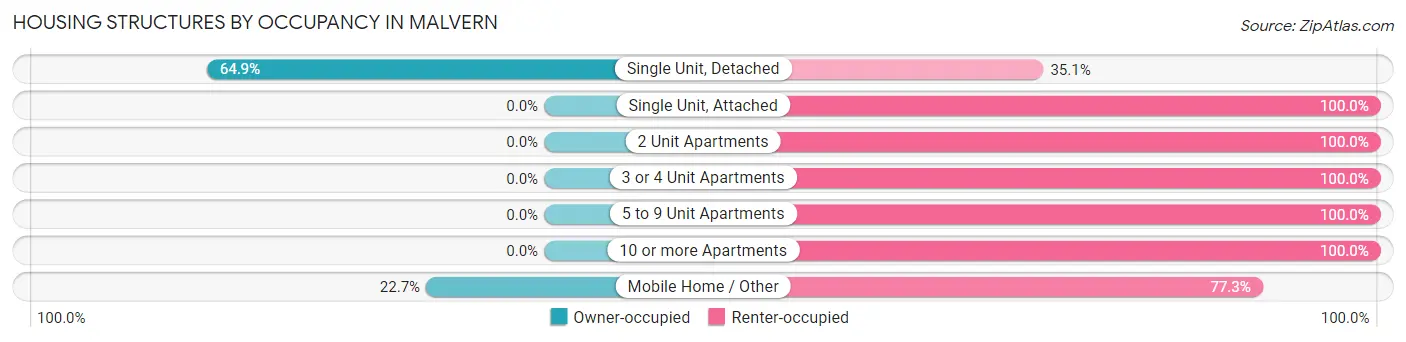
| Structure Type | Owner-occupied | Renter-occupied |
| Single Unit, Detached | 257 (64.9%) | 139 (35.1%) |
| Single Unit, Attached | 0 (0.0%) | 10 (100.0%) |
| 2 Unit Apartments | 0 (0.0%) | 83 (100.0%) |
| 3 or 4 Unit Apartments | 0 (0.0%) | 44 (100.0%) |
| 5 to 9 Unit Apartments | 0 (0.0%) | 156 (100.0%) |
| 10 or more Apartments | 0 (0.0%) | 6 (100.0%) |
| Mobile Home / Other | 5 (22.7%) | 17 (77.3%) |
| Total | 262 (36.5%) | 455 (63.5%) |
Housing Structures by Number of Rooms in Malvern
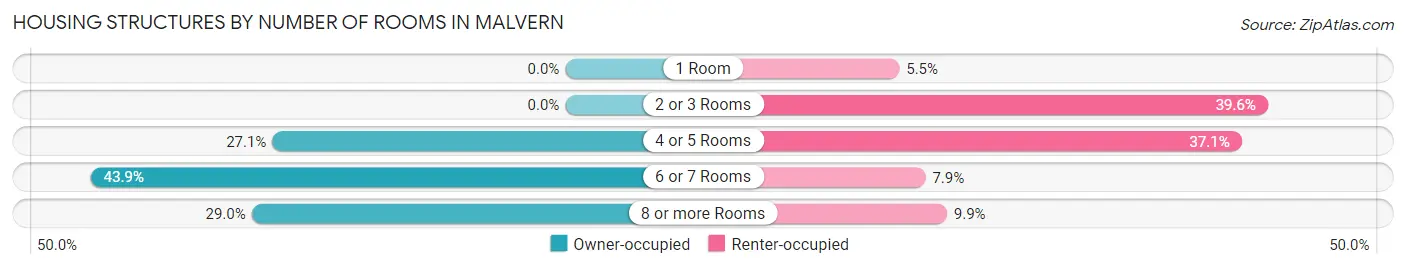
| Number of Rooms | Owner-occupied | Renter-occupied |
| 1 Room | 0 (0.0%) | 25 (5.5%) |
| 2 or 3 Rooms | 0 (0.0%) | 180 (39.6%) |
| 4 or 5 Rooms | 71 (27.1%) | 169 (37.1%) |
| 6 or 7 Rooms | 115 (43.9%) | 36 (7.9%) |
| 8 or more Rooms | 76 (29.0%) | 45 (9.9%) |
| Total | 262 (100.0%) | 455 (100.0%) |
Housing Structure by Heating Type in Malvern
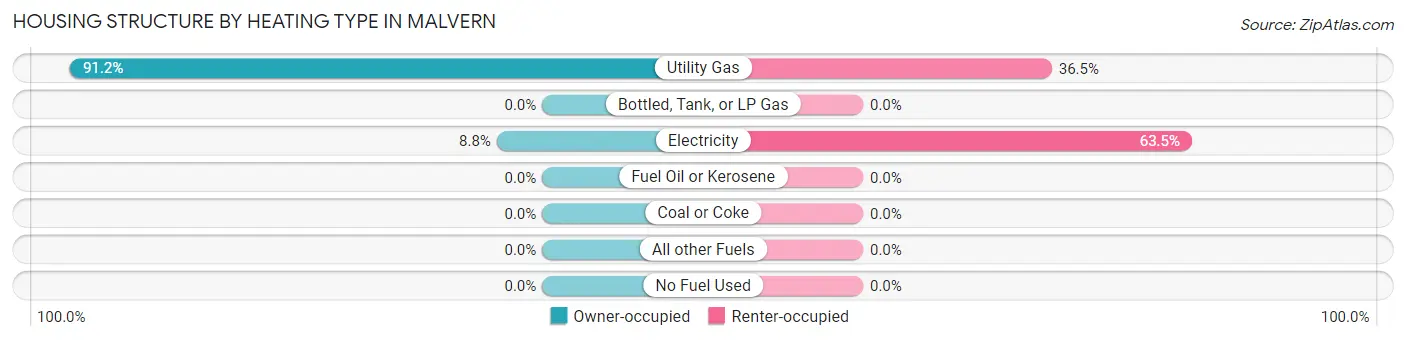
| Heating Type | Owner-occupied | Renter-occupied |
| Utility Gas | 239 (91.2%) | 166 (36.5%) |
| Bottled, Tank, or LP Gas | 0 (0.0%) | 0 (0.0%) |
| Electricity | 23 (8.8%) | 289 (63.5%) |
| Fuel Oil or Kerosene | 0 (0.0%) | 0 (0.0%) |
| Coal or Coke | 0 (0.0%) | 0 (0.0%) |
| All other Fuels | 0 (0.0%) | 0 (0.0%) |
| No Fuel Used | 0 (0.0%) | 0 (0.0%) |
| Total | 262 (100.0%) | 455 (100.0%) |
Household Vehicle Usage in Malvern
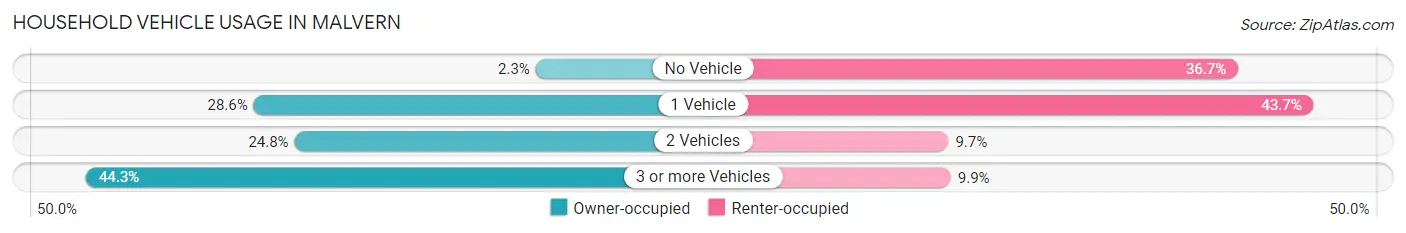
| Vehicles per Household | Owner-occupied | Renter-occupied |
| No Vehicle | 6 (2.3%) | 167 (36.7%) |
| 1 Vehicle | 75 (28.6%) | 199 (43.7%) |
| 2 Vehicles | 65 (24.8%) | 44 (9.7%) |
| 3 or more Vehicles | 116 (44.3%) | 45 (9.9%) |
| Total | 262 (100.0%) | 455 (100.0%) |
Real Estate & Mortgages in Malvern
Real Estate and Mortgage Overview in Malvern
| Characteristic | Without Mortgage | With Mortgage |
| Housing Units | 90 | 172 |
| Median Property Value | $98,300 | $118,800 |
| Median Household Income | $33,250 | $27 |
| Monthly Housing Costs | $452 | $0 |
| Real Estate Taxes | $1,319 | $0 |
Property Value by Mortgage Status in Malvern
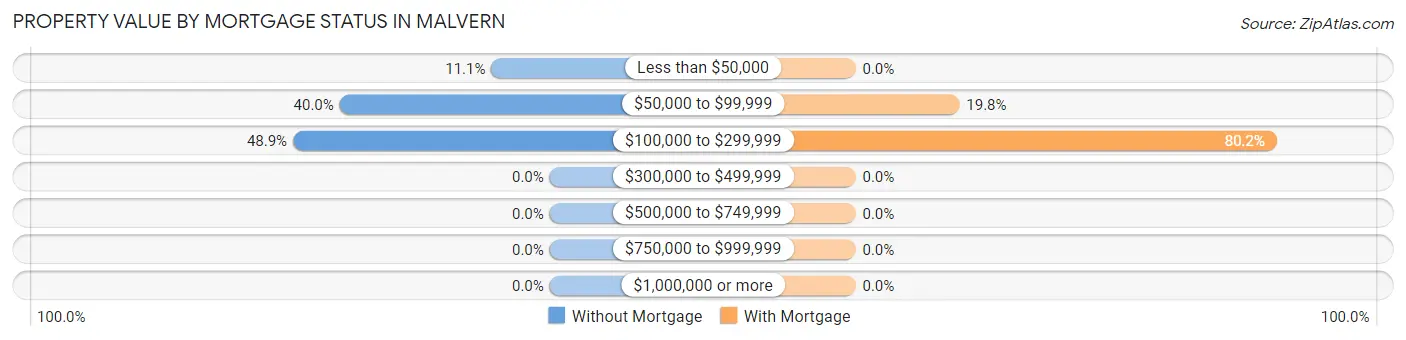
| Property Value | Without Mortgage | With Mortgage |
| Less than $50,000 | 10 (11.1%) | 0 (0.0%) |
| $50,000 to $99,999 | 36 (40.0%) | 34 (19.8%) |
| $100,000 to $299,999 | 44 (48.9%) | 138 (80.2%) |
| $300,000 to $499,999 | 0 (0.0%) | 0 (0.0%) |
| $500,000 to $749,999 | 0 (0.0%) | 0 (0.0%) |
| $750,000 to $999,999 | 0 (0.0%) | 0 (0.0%) |
| $1,000,000 or more | 0 (0.0%) | 0 (0.0%) |
| Total | 90 (100.0%) | 172 (100.0%) |
Household Income by Mortgage Status in Malvern
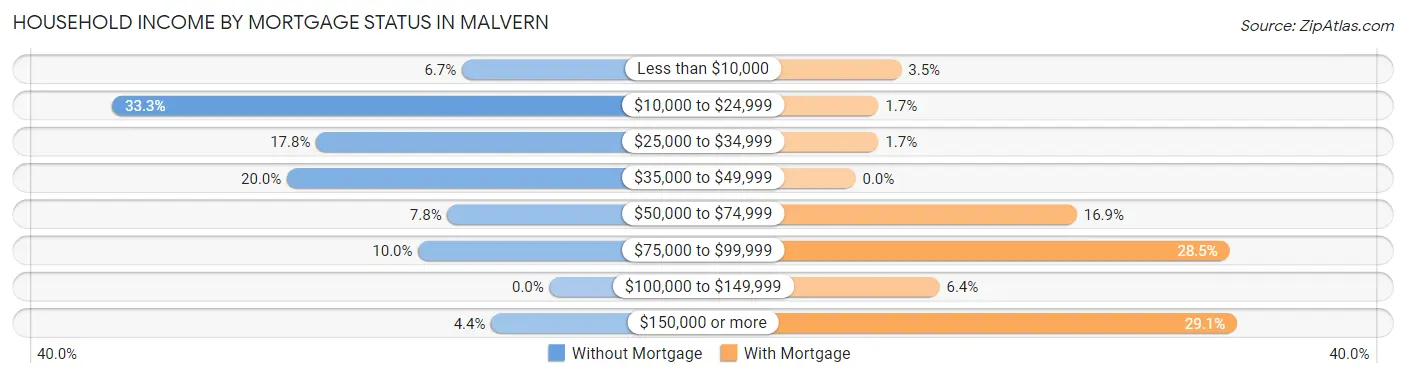
| Household Income | Without Mortgage | With Mortgage |
| Less than $10,000 | 6 (6.7%) | 6 (3.5%) |
| $10,000 to $24,999 | 30 (33.3%) | 3 (1.7%) |
| $25,000 to $34,999 | 16 (17.8%) | 3 (1.7%) |
| $35,000 to $49,999 | 18 (20.0%) | 0 (0.0%) |
| $50,000 to $74,999 | 7 (7.8%) | 29 (16.9%) |
| $75,000 to $99,999 | 9 (10.0%) | 49 (28.5%) |
| $100,000 to $149,999 | 0 (0.0%) | 11 (6.4%) |
| $150,000 or more | 4 (4.4%) | 50 (29.1%) |
| Total | 90 (100.0%) | 172 (100.0%) |
Property Value to Household Income Ratio in Malvern
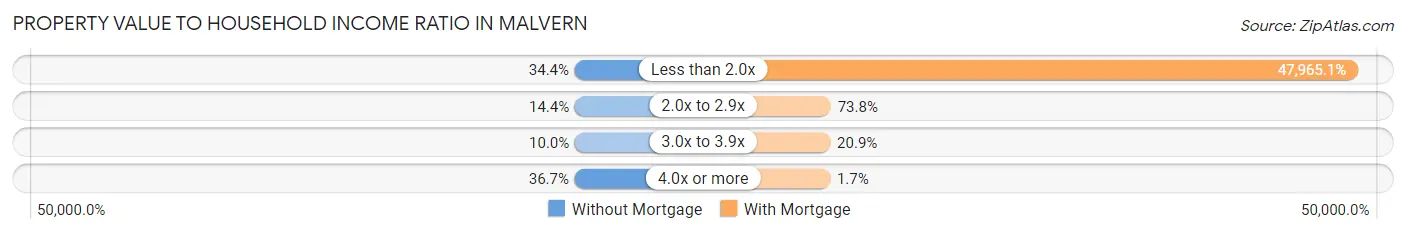
| Value-to-Income Ratio | Without Mortgage | With Mortgage |
| Less than 2.0x | 31 (34.4%) | 82,500 (47,965.1%) |
| 2.0x to 2.9x | 13 (14.4%) | 127 (73.8%) |
| 3.0x to 3.9x | 9 (10.0%) | 36 (20.9%) |
| 4.0x or more | 33 (36.7%) | 3 (1.7%) |
| Total | 90 (100.0%) | 172 (100.0%) |
Real Estate Taxes by Mortgage Status in Malvern

| Property Taxes | Without Mortgage | With Mortgage |
| Less than $800 | 19 (21.1%) | 0 (0.0%) |
| $800 to $1,499 | 39 (43.3%) | 19 (11.1%) |
| $800 to $1,499 | 32 (35.6%) | 53 (30.8%) |
| Total | 90 (100.0%) | 172 (100.0%) |
Health & Disability in Malvern
Health Insurance Coverage by Age in Malvern
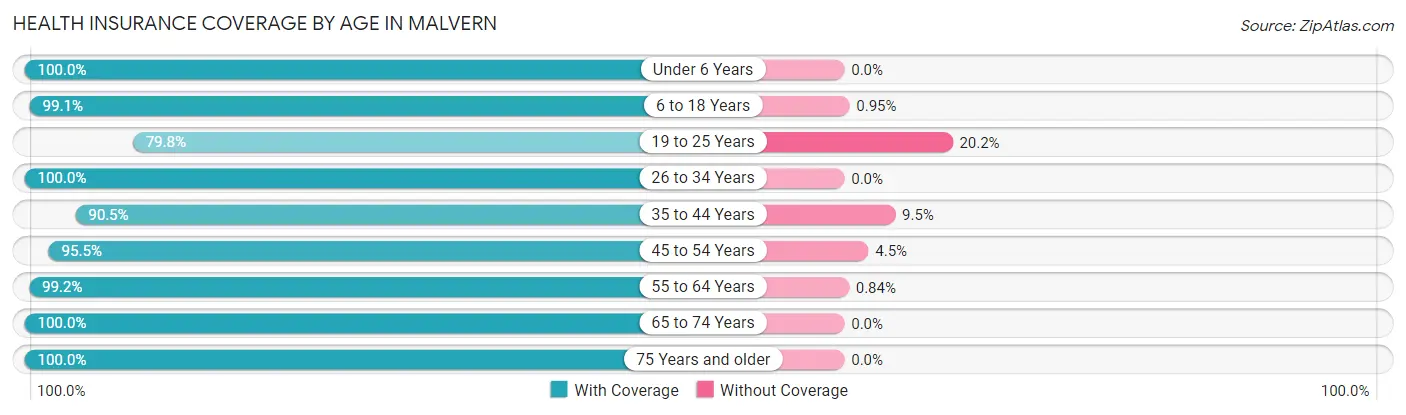
| Age Bracket | With Coverage | Without Coverage |
| Under 6 Years | 97 (100.0%) | 0 (0.0%) |
| 6 to 18 Years | 312 (99.1%) | 3 (0.9%) |
| 19 to 25 Years | 95 (79.8%) | 24 (20.2%) |
| 26 to 34 Years | 151 (100.0%) | 0 (0.0%) |
| 35 to 44 Years | 153 (90.5%) | 16 (9.5%) |
| 45 to 54 Years | 85 (95.5%) | 4 (4.5%) |
| 55 to 64 Years | 355 (99.2%) | 3 (0.8%) |
| 65 to 74 Years | 180 (100.0%) | 0 (0.0%) |
| 75 Years and older | 68 (100.0%) | 0 (0.0%) |
| Total | 1,496 (96.8%) | 50 (3.2%) |
Health Insurance Coverage by Citizenship Status in Malvern

| Citizenship Status | With Coverage | Without Coverage |
| Native Born | 97 (100.0%) | 0 (0.0%) |
| Foreign Born, Citizen | 312 (99.1%) | 3 (0.9%) |
| Foreign Born, not a Citizen | 95 (79.8%) | 24 (20.2%) |
Health Insurance Coverage by Household Income in Malvern

| Household Income | With Coverage | Without Coverage |
| Under $25,000 | 595 (92.5%) | 48 (7.5%) |
| $25,000 to $49,999 | 268 (100.0%) | 0 (0.0%) |
| $50,000 to $74,999 | 197 (99.0%) | 2 (1.0%) |
| $75,000 to $99,999 | 100 (100.0%) | 0 (0.0%) |
| $100,000 and over | 336 (100.0%) | 0 (0.0%) |
Public vs Private Health Insurance Coverage by Age in Malvern
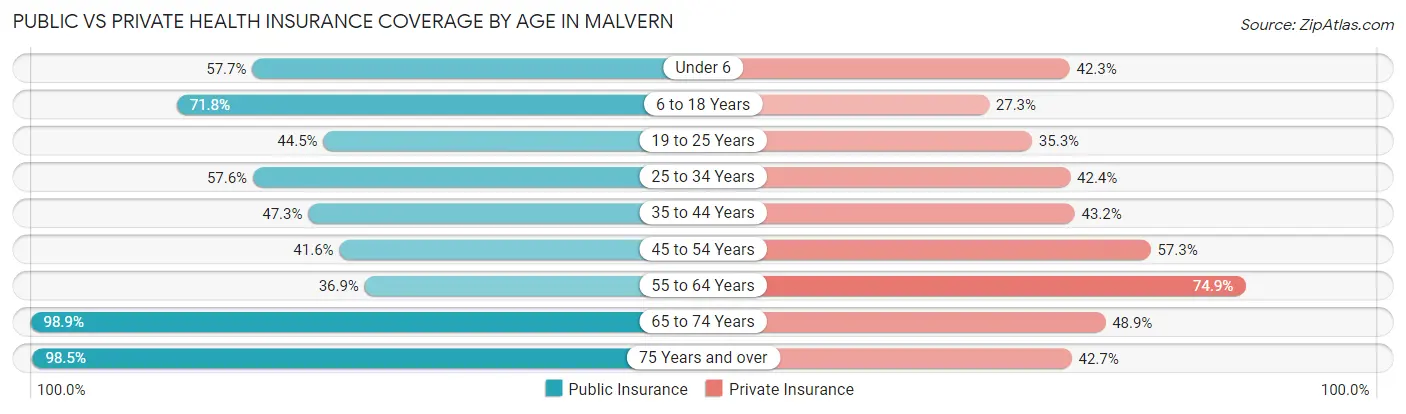
| Age Bracket | Public Insurance | Private Insurance |
| Under 6 | 56 (57.7%) | 41 (42.3%) |
| 6 to 18 Years | 226 (71.8%) | 86 (27.3%) |
| 19 to 25 Years | 53 (44.5%) | 42 (35.3%) |
| 25 to 34 Years | 87 (57.6%) | 64 (42.4%) |
| 35 to 44 Years | 80 (47.3%) | 73 (43.2%) |
| 45 to 54 Years | 37 (41.6%) | 51 (57.3%) |
| 55 to 64 Years | 132 (36.9%) | 268 (74.9%) |
| 65 to 74 Years | 178 (98.9%) | 88 (48.9%) |
| 75 Years and over | 67 (98.5%) | 29 (42.6%) |
| Total | 916 (59.3%) | 742 (48.0%) |
Disability Status by Sex by Age in Malvern
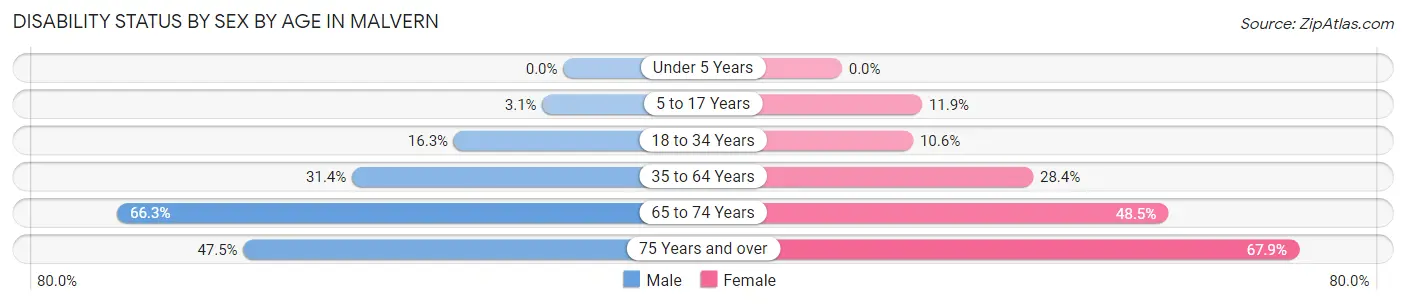
| Age Bracket | Male | Female |
| Under 5 Years | 0 (0.0%) | 0 (0.0%) |
| 5 to 17 Years | 6 (3.1%) | 20 (11.9%) |
| 18 to 34 Years | 26 (16.3%) | 13 (10.6%) |
| 35 to 64 Years | 64 (31.4%) | 117 (28.4%) |
| 65 to 74 Years | 55 (66.3%) | 47 (48.4%) |
| 75 Years and over | 19 (47.5%) | 19 (67.9%) |
Disability Class by Sex by Age in Malvern
Disability Class: Hearing Difficulty
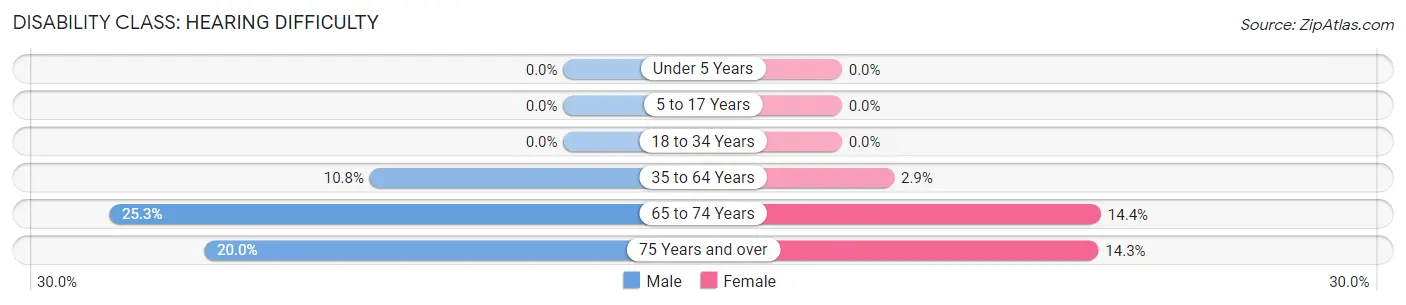
| Age Bracket | Male | Female |
| Under 5 Years | 0 (0.0%) | 0 (0.0%) |
| 5 to 17 Years | 0 (0.0%) | 0 (0.0%) |
| 18 to 34 Years | 0 (0.0%) | 0 (0.0%) |
| 35 to 64 Years | 22 (10.8%) | 12 (2.9%) |
| 65 to 74 Years | 21 (25.3%) | 14 (14.4%) |
| 75 Years and over | 8 (20.0%) | 4 (14.3%) |
Disability Class: Vision Difficulty
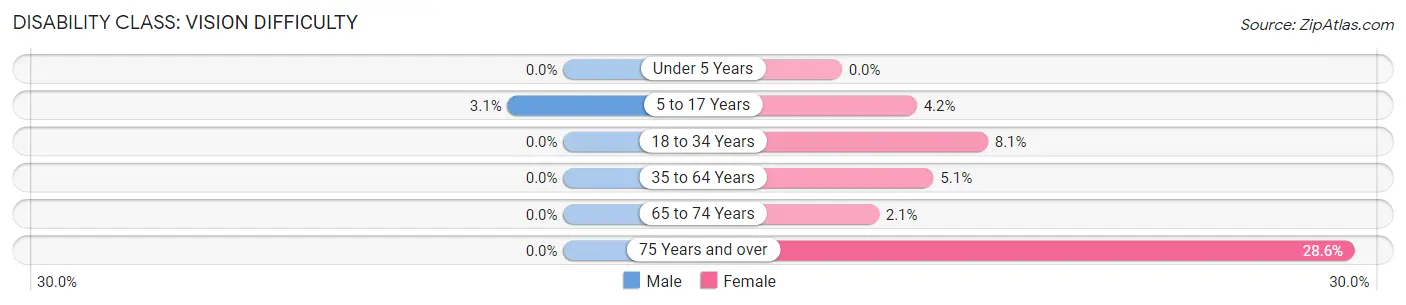
| Age Bracket | Male | Female |
| Under 5 Years | 0 (0.0%) | 0 (0.0%) |
| 5 to 17 Years | 6 (3.1%) | 7 (4.2%) |
| 18 to 34 Years | 0 (0.0%) | 10 (8.1%) |
| 35 to 64 Years | 0 (0.0%) | 21 (5.1%) |
| 65 to 74 Years | 0 (0.0%) | 2 (2.1%) |
| 75 Years and over | 0 (0.0%) | 8 (28.6%) |
Disability Class: Cognitive Difficulty
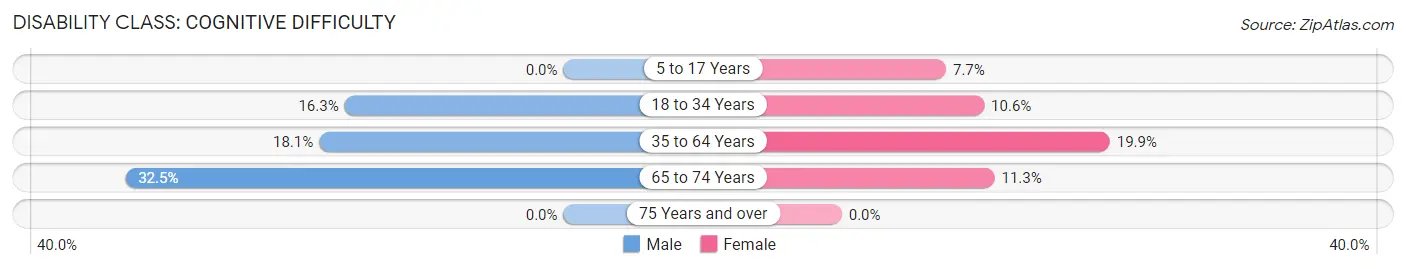
| Age Bracket | Male | Female |
| 5 to 17 Years | 0 (0.0%) | 13 (7.7%) |
| 18 to 34 Years | 26 (16.3%) | 13 (10.6%) |
| 35 to 64 Years | 37 (18.1%) | 82 (19.9%) |
| 65 to 74 Years | 27 (32.5%) | 11 (11.3%) |
| 75 Years and over | 0 (0.0%) | 0 (0.0%) |
Disability Class: Ambulatory Difficulty
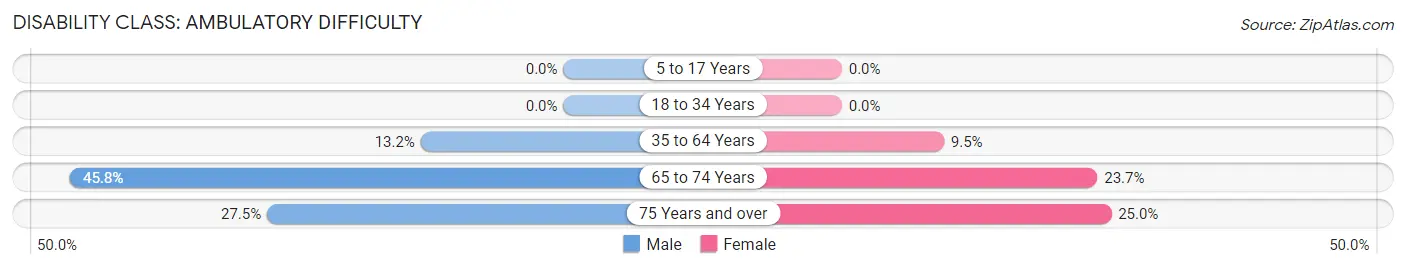
| Age Bracket | Male | Female |
| 5 to 17 Years | 0 (0.0%) | 0 (0.0%) |
| 18 to 34 Years | 0 (0.0%) | 0 (0.0%) |
| 35 to 64 Years | 27 (13.2%) | 39 (9.5%) |
| 65 to 74 Years | 38 (45.8%) | 23 (23.7%) |
| 75 Years and over | 11 (27.5%) | 7 (25.0%) |
Disability Class: Self-Care Difficulty
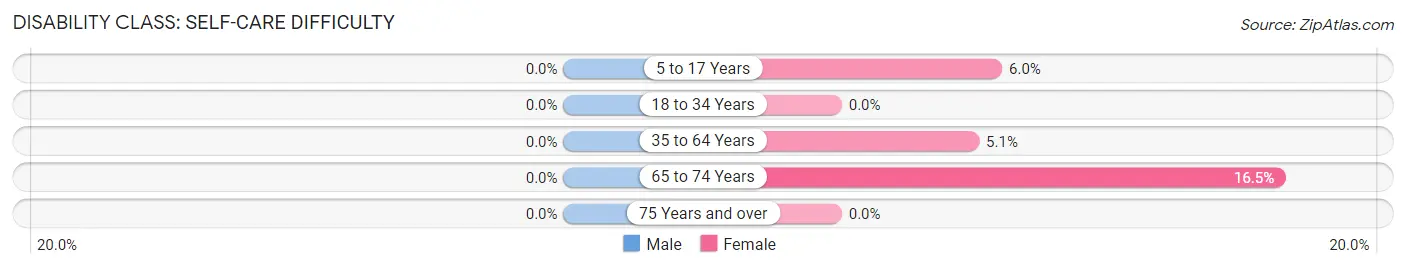
| Age Bracket | Male | Female |
| 5 to 17 Years | 0 (0.0%) | 10 (5.9%) |
| 18 to 34 Years | 0 (0.0%) | 0 (0.0%) |
| 35 to 64 Years | 0 (0.0%) | 21 (5.1%) |
| 65 to 74 Years | 0 (0.0%) | 16 (16.5%) |
| 75 Years and over | 0 (0.0%) | 0 (0.0%) |
Technology Access in Malvern
Computing Device Access in Malvern
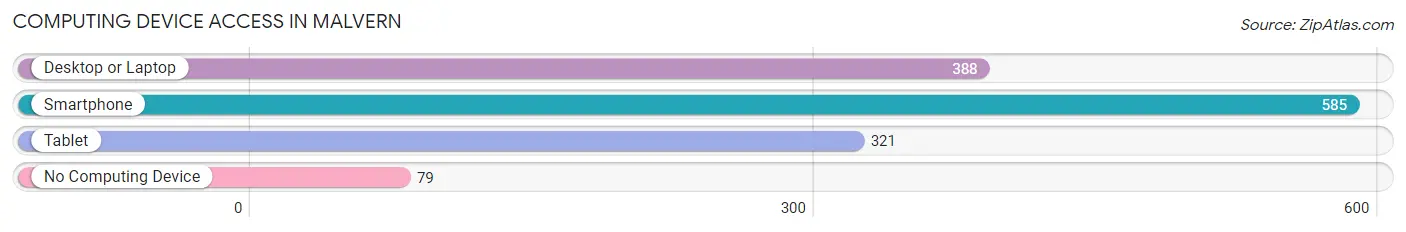
| Device Type | # Households | % Households |
| Desktop or Laptop | 388 | 54.1% |
| Smartphone | 585 | 81.6% |
| Tablet | 321 | 44.8% |
| No Computing Device | 79 | 11.0% |
| Total | 717 | 100.0% |
Internet Access in Malvern
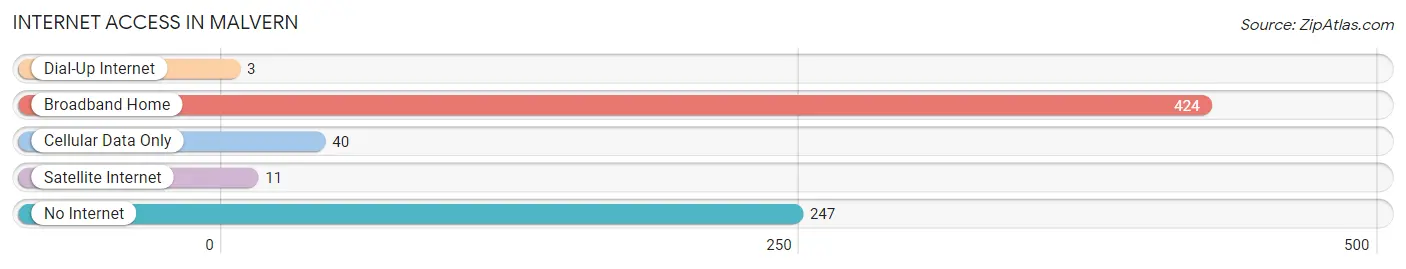
| Internet Type | # Households | % Households |
| Dial-Up Internet | 3 | 0.4% |
| Broadband Home | 424 | 59.1% |
| Cellular Data Only | 40 | 5.6% |
| Satellite Internet | 11 | 1.5% |
| No Internet | 247 | 34.4% |
| Total | 717 | 100.0% |
Malvern Summary
Malvern, Ohio is a small village located in Carroll County, Ohio. It is situated on the banks of the Tuscarawas River, approximately 30 miles south of Canton and 40 miles east of Akron. The village has a population of 1,845 people, according to the 2010 census.
History
Malvern was founded in 1815 by a group of settlers from Pennsylvania. The village was originally known as “New Philadelphia”, but was later renamed Malvern after a town in England. The village was incorporated in 1837.
In the early days, Malvern was a farming community, with the main crops being wheat, corn, and oats. The village also had a number of mills, including a sawmill, a gristmill, and a woolen mill.
In the late 19th century, Malvern began to experience a period of growth and development. The village was connected to the outside world by the Cleveland and Marietta Railroad in 1881, and the village’s first newspaper, the Malvern Herald, was established in 1883.
In the early 20th century, Malvern experienced a period of industrialization. The village was home to several factories, including a brickyard, a canning factory, and a furniture factory.
Geography
Malvern is located in northeastern Ohio, approximately 30 miles south of Canton and 40 miles east of Akron. The village is situated on the banks of the Tuscarawas River, and is surrounded by rolling hills and farmland.
The village has a total area of 1.2 square miles, all of which is land. The climate in Malvern is characterized by hot, humid summers and cold, snowy winters.
Economy
The economy of Malvern is largely based on agriculture and manufacturing. The village is home to several farms, which produce a variety of crops, including corn, wheat, and oats.
The village is also home to several factories, including a furniture factory, a canning factory, and a brickyard. In addition, the village is home to several small businesses, including restaurants, shops, and service providers.
Demographics
According to the 2010 census, the population of Malvern was 1,845 people. The racial makeup of the village was 97.3% White, 0.7% African American, 0.2% Native American, 0.2% Asian, 0.2% from other races, and 1.6% from two or more races.
The median household income in Malvern was $41,250, and the median family income was $48,750. The per capita income in the village was $19,945. Approximately 11.2% of the population was below the poverty line.
Conclusion
Malvern is a small village located in Carroll County, Ohio. It was founded in 1815 and has a population of 1,845 people, according to the 2010 census. The village is situated on the banks of the Tuscarawas River and is surrounded by rolling hills and farmland. The economy of Malvern is largely based on agriculture and manufacturing, and the village is home to several small businesses. The racial makeup of the village is predominantly White, with a small percentage of African American, Native American, and Asian residents. The median household income in Malvern is $41,250, and the per capita income is $19,945.
Common Questions
What is Per Capita Income in Malvern?
Per Capita income in Malvern is $19,675.
What is the Median Family Income in Malvern?
Median Family Income in Malvern is $34,115.
What is the Median Household income in Malvern?
Median Household Income in Malvern is $28,387.
What is Income or Wage Gap in Malvern?
Income or Wage Gap in Malvern is 15.6%.
Women in Malvern earn 84.4 cents for every dollar earned by a man.
What is Inequality or Gini Index in Malvern?
Inequality or Gini Index in Malvern is 0.49.
What is the Total Population of Malvern?
Total Population of Malvern is 1,555.
What is the Total Male Population of Malvern?
Total Male Population of Malvern is 693.
What is the Total Female Population of Malvern?
Total Female Population of Malvern is 862.
What is the Ratio of Males per 100 Females in Malvern?
There are 80.39 Males per 100 Females in Malvern.
What is the Ratio of Females per 100 Males in Malvern?
There are 124.39 Females per 100 Males in Malvern.
What is the Median Population Age in Malvern?
Median Population Age in Malvern is 40.6 Years.
What is the Average Family Size in Malvern
Average Family Size in Malvern is 2.8 People.
What is the Average Household Size in Malvern
Average Household Size in Malvern is 2.2 People.
How Large is the Labor Force in Malvern?
There are 740 People in the Labor Forcein in Malvern.
What is the Percentage of People in the Labor Force in Malvern?
58.3% of People are in the Labor Force in Malvern.
What is the Unemployment Rate in Malvern?
Unemployment Rate in Malvern is 1.3%.