Zip Codes with the Highest Percentage of Population Employed in Life, Physical & Social Science in Akron, OH
RELATED REPORTS & OPTIONS
Life, Physical & Social Science
Akron
Compare Zip Codes
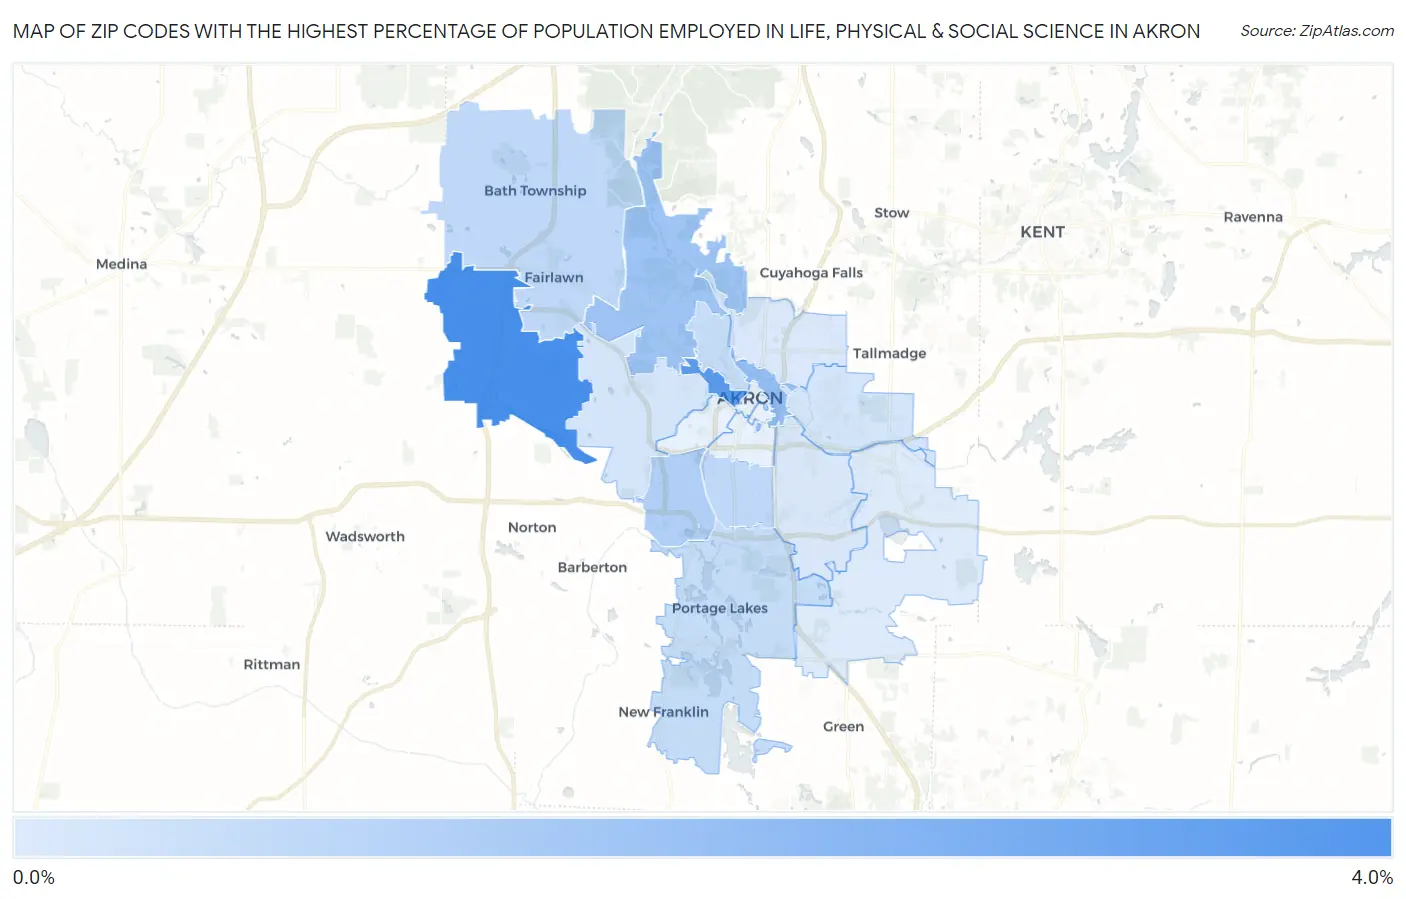
Map of Zip Codes with the Highest Percentage of Population Employed in Life, Physical & Social Science in Akron
0.27%
3.3%
Zip Codes with the Highest Percentage of Population Employed in Life, Physical & Social Science in Akron, OH
| Zip Code | % Employed | vs State | vs National | |
| 1. | 44321 | 3.3% | 0.90%(+2.37)#35 | 1.1%(+2.18)#1,614 |
| 2. | 44302 | 2.9% | 0.90%(+1.98)#49 | 1.1%(+1.79)#2,018 |
| 3. | 44304 | 1.7% | 0.90%(+0.836)#125 | 1.1%(+0.643)#4,578 |
| 4. | 44313 | 1.5% | 0.90%(+0.631)#151 | 1.1%(+0.438)#5,504 |
| 5. | 44314 | 1.1% | 0.90%(+0.232)#224 | 1.1%(+0.039)#8,013 |
| 6. | 44301 | 0.88% | 0.90%(-0.014)#296 | 1.1%(-0.207)#10,105 |
| 7. | 44333 | 0.87% | 0.90%(-0.032)#310 | 1.1%(-0.226)#10,312 |
| 8. | 44303 | 0.75% | 0.90%(-0.150)#355 | 1.1%(-0.343)#11,538 |
| 9. | 44319 | 0.75% | 0.90%(-0.151)#356 | 1.1%(-0.344)#11,548 |
| 10. | 44320 | 0.48% | 0.90%(-0.421)#471 | 1.1%(-0.615)#14,826 |
| 11. | 44305 | 0.44% | 0.90%(-0.459)#495 | 1.1%(-0.652)#15,278 |
| 12. | 44306 | 0.38% | 0.90%(-0.517)#516 | 1.1%(-0.710)#15,995 |
| 13. | 44310 | 0.33% | 0.90%(-0.570)#547 | 1.1%(-0.764)#16,707 |
| 14. | 44312 | 0.27% | 0.90%(-0.624)#580 | 1.1%(-0.817)#17,373 |
1
Common Questions
What are the Top 10 Zip Codes with the Highest Percentage of Population Employed in Life, Physical & Social Science in Akron, OH?
Top 10 Zip Codes with the Highest Percentage of Population Employed in Life, Physical & Social Science in Akron, OH are:
What zip code has the Highest Percentage of Population Employed in Life, Physical & Social Science in Akron, OH?
44321 has the Highest Percentage of Population Employed in Life, Physical & Social Science in Akron, OH with 3.3%.
What is the Percentage of Population Employed in Life, Physical & Social Science in Akron, OH?
Percentage of Population Employed in Life, Physical & Social Science in Akron is 0.81%.
What is the Percentage of Population Employed in Life, Physical & Social Science in Ohio?
Percentage of Population Employed in Life, Physical & Social Science in Ohio is 0.90%.
What is the Percentage of Population Employed in Life, Physical & Social Science in the United States?
Percentage of Population Employed in Life, Physical & Social Science in the United States is 1.1%.